Embed Size (px)
Citation preview

Norwegian Citizen Panel 2019, Fifteenth Wave
Methodology report
Øivind Skjervheim
Asle Høgestøl
Olav Bjørnebekk
Amund Eikrem
June, 2019

TABLE OF CONTENTS
Background ............................................................................................................................................................. 2
Technical Aspects of the Survey .............................................................................................................................. 2
Software .............................................................................................................................................................. 2
Pilot – Procedure and Assessment ...................................................................................................................... 2
RandomizatIon Procedures ................................................................................................................................. 2
Panel Recruitment................................................................................................................................................... 4
Data Collection wave 15.......................................................................................................................................... 4
Responses by method of data collection ............................................................................................................ 4
Response of Existing Panel Members Over Time ............................................................................................ 5
Platforms ............................................................................................................................................................. 5
Time Usage .......................................................................................................................................................... 6
Representativity ...................................................................................................................................................... 7
Factors Explaining Lack of Representativity ........................................................................................................ 7
The Representativity of the Norwegian Citizen Panel ........................................................................................ 8
Weighting .............................................................................................................................................................. 11
Appendix ............................................................................................................................................................... 13

2
BACKGROUND
This report describes the procedures of data collection in the fifteenth wave of The Norwegian Citizen Panel.
Furthermore, the report discusses technical aspects of the data collection before turning to the representativity
of the panel and how the weights are calculated.
The Norwegian Citizen Panel (NCP) is one of the main components of Digital Social Science Core Facility
(DIGSSCORE) at the University of Bergen. NCP was established as a collaboration between several departments
at the Faculty of Social Sciences at the University of Bergen and Uni Research Rokkan Centre.
ideas2evidence is responsible for the panel recruitment, the administration of the panel, and the technical
solutions regarding data collection and computing.
TECHNICAL ASPECTS OF THE SURVEY
SOFTWARE
The web-based research software Confirmit administers the surveys and the panel. Confirmit is a "Software-as-
a-Service" solution, where all software runs on Confirmit’s continuously monitored server park, and where
survey respondents and developers interact with the system through various web-based interfaces. This
software provides very high data security and operational stability. The security measures are the most
stringent in the industry, and Confirmit guarantees 99.7 percent uptime. ideas2evidence does the
programming of the survey in Confirmit on behalf of The Norwegian Citizen Panel.
PILOT – PROCEDURE AND ASSESSMENT
The survey went through both large-N and small-N pilot testing before data collection. The large-N pilot was
done in cooperation with Amalie Skram high school. In addition, the survey was tested extensively during the
development phase by ideas2evidence and the researchers involved in the project.
The pilot testing was regarded as successful, and no major technical revisions were deemed necessary.
The field period started by inviting a random sample of the respondents (soft launch). This was done in order to
minimize the consequences if the questionnaire contained technical errors. No such errors were
located/reported after two hours of data collection among the random sample. Remaining panel members was
therefore invited. No major errors were located/reported throughout the rest of the data collection; thus, the
field period is regarded successful.
RANDOMIZATION PROCEDURES
Each wave of NCP has an extensive use of randomization procedures. The context of each randomization
procedure may vary, 1 but they all share some common ground that will be described in the following.
All randomization procedures are executed live in the questionnaire. This means that the randomization takes
place while the respondent is in the questionnaire, as opposed to pre-defined randomizations that are
uploaded to the questionnaire. All randomizations are independent from another, unless the documentation
states otherwise.
1 Some examples: sorting respondents in different thematic subsets, randomly allocate treatment value in experiments, randomize order of an answer list/array, order a sequence of questions by random, ask a given question to a subset of the respondents.

3
The randomization procedures are written in JavaScript. Math.random()2 is a key function, in combination with
Math.floor()3. These functions are used to achieve the following:
• Randomly select one value from a vector
• Randomly shuffle the contents of an array
The first procedure is typically used to determine a random sample of respondents to i.e. a control group. Say
for example we wish to create two groups of respondents: group 1 and group 2. All respondents are randomly
assigned the value 1 or 2, where each randomization is independent from one another. When N is large enough
these two groups will be of equal size (50/50).
Here is an example of the JavaScript code executed in Confirmit:
The second procedure is typically used when defining the order of an answer list as random. This can be useful
for example when asking for the respondent’s party preference or in a list experiment. However, since i.e. a
party cannot be listed twice, the procedure must take into account that the array of parties is reduced by 1 for
each randomization.
Here is an example of the JavaScript code executed in Confirmit 4:
2 Please see following resource (or other internet resources):https://developer.mozilla.org/en-US/docs/Web/JavaScript/Reference/Global_Objects/Math/random 3 Please see following resource (or other internet resources):https://developer.mozilla.org/en-US/docs/Web/JavaScript/Reference/Global_Objects/Math/floor 4 Code collected from Mike Bostocks visualization: https://bost.ocks.org/mike/shuffle/

4
PANEL RECRUITMENT
Panel members were recruited in wave 1, wave 3, wave 8, wave 11, and wave 14. All samples were drawn from
the National Population Registry of Norway. This registry holds information on everyone born in Norway, as
well as former and current inhabitants. The formal responsibility for this registry is held by the Norwegian Tax
Administration but has partly outsourced the administration to the private IT-company Evry. Evry drew the
sample on behalf of the Norwegian Citizen Panel after relevant permissions were acquired from the Norwegian
Tax Administration.
The samples consisted of people over the age of 18 that were randomly drawn from the register. The extracted
information was a) last name, b) first name, c) address, d) gender, e) year of birth, and f) phone number (the
latter was not included in wave 1). The sample excluded persons without a current home address in Norway.
For a detailed description of the recruitment process in wave 1, wave 3, wave 8, wave 11 and wave 14, we refer
to the respective methodology reports for each wave. Note, however, that there are some differences between
the four recruitment processes. Please refer to table 1.
Table 1: Summary of recruitment processes
Sample size Mode Contacts Returned letters Response Rate (%)
Recruitment 1 (wave 1) 25 000 Postal 2 546 20.1 %
Recruitment 2 (wave 3) 25 000 Postal, phone/SMS 4 543 23.0 %
Recruitment 3 (wave 8) 22 000 Postal/SMS 3 479 19.4 %
Recruitment 4 (wave 11) 14 000 Postal/SMS 2 334 15.1 %
Recruitment 5 (wave 14) 14 000 Postal/SMS 2 389 15.0 %
DATA COLLECTION WAVE 15
RESPONSES BY METHOD OF DATA COLLECTION
The survey was launched May 21th 2019. It was sent to the email accounts of the panel’s 18,090 members. In
these e-mails, the basic information about the Norwegian Citizen Panel was repeated, and the individual panel
members received unique URLs that led to the questionnaire.
The invitation, the first reminder and the second reminder were all distributed via e-mail. The third, and last
reminder was, depending on whether the individual panel member had a registered mobile phone number or
not, distributed via SMS and e-mail. Prior to wave fifteen 34.7 percent of the panel was registered with a
mobile phone number.
Table 2: Responses and response rate for panel members by the different stages of data collection
Responses Cumulative Responses
Response Rate (%)
Cumulative Response Rate
Invitation (21th of May) 3 795 3 795 34.8 % 34.8 %
1st reminder (29th of May) 2 317 6 112 21.3 % 56.1 %
2nd reminder (3rd of June) 1 064 7 176 9.8 % 65.8 %
3rd reminder – email (7th of June) 557 7 733 5.1 % 70.9 %
3rd reminder – SMS (7th of June) 372 8 105 3.4 % 74.4 %
In total, the questionnaire received 8,105 answers. 3,795 respondents completed the survey in the period
between the invitation and the first reminder (May 21th – May 29th), a response rate of 34.8 percent. The
pattern is similar to earlier waves; the email invitation produces a higher number of respondents than the
subsequent reminders. For details on the number of respondents after each reminder, we refer you to table 2.
5
As before we exclude respondents that have not participated in any of the last three waves when we calculate
the response rate. This leaves us with 10,900 eligible respondents. The overall response rate, as reported in
table 2, is 74.4 percent.
RESPONSE OF EXISTING PANEL MEMBERS OVER TIME
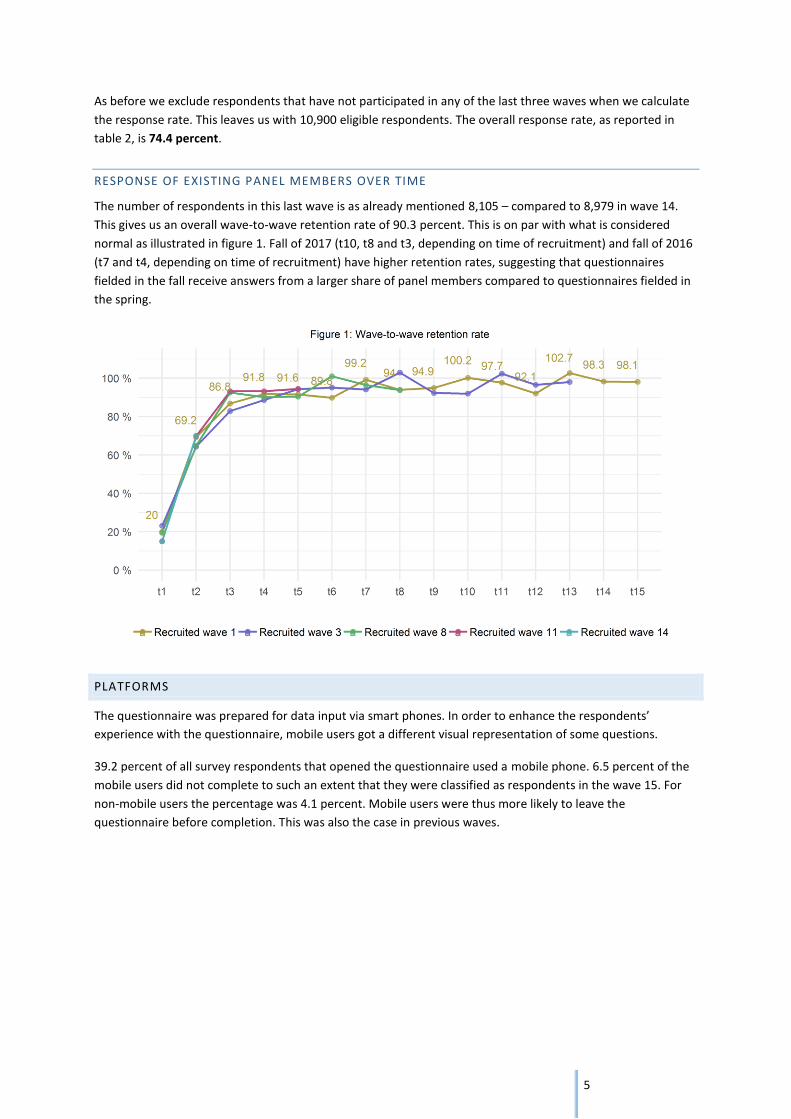
The number of respondents in this last wave is as already mentioned 8,105 – compared to 8,979 in wave 14.
This gives us an overall wave-to-wave retention rate of 90.3 percent. This is on par with what is considered
normal as illustrated in figure 1. Fall of 2017 (t10, t8 and t3, depending on time of recruitment) and fall of 2016
(t7 and t4, depending on time of recruitment) have higher retention rates, suggesting that questionnaires
fielded in the fall receive answers from a larger share of panel members compared to questionnaires fielded in
the spring.
PLATFORMS
The questionnaire was prepared for data input via smart phones. In order to enhance the respondents’
experience with the questionnaire, mobile users got a different visual representation of some questions.
39.2 percent of all survey respondents that opened the questionnaire used a mobile phone. 6.5 percent of the
mobile users did not complete to such an extent that they were classified as respondents in the wave 15. For
non-mobile users the percentage was 4.1 percent. Mobile users were thus more likely to leave the
questionnaire before completion. This was also the case in previous waves.

6
Respondents between 18 and 45 years old are more inclined than others to use their mobile phone when
answering the questionnaire, as shown in figure 2. From 46 years and higher, the share of mobile users declines
substantially. Overall, women are more inclined to use mobile to answer the questionnaire compared to men.
The exception of the rule is men and women between 18-25 years and 76 years and above, where the share of
mobile users (59 percent) is identical.
TIME USAGE
The average respondent used 15.3 minutes to complete the questionnaire. This on par with what the
respondents were told upon invitation. The challenge of measuring average time usage is that respondents
may leave the questionnaire open in order to complete the survey later. This idle time causes an artificially high
average for completing the survey. The average of 15.3 minutes therefore only includes the respondents which
used less than, or equal to, 60 minutes.

7
As in earlier waves, the NCP questionnaire is divided into different subsets. Wave 15 consisted of six subsets,
group 1-6. The respondents were assigned to a group by random when they first entered the questionnaire.
Figure 3 and table 3 shows that respondents that answered questions as part of group 2 and 3 spent more time
on the questionnaire, compared to the other groups.
Table 3: Average time usage (minutes) in each subset in wave 15
As before, mobile users on average use substantially less time on the survey than non-mobile users. The
documentation report from wave 7 showed that mobile users spend less time writing text on open text
questions. Mobile users in wave 7 wrote on average 42 characters in the open text questions, while users
answering on non-mobile platforms on average wrote 62 characters.
The same report also noted that mobile users spend considerably less time answering some of the more
complex questions in the questionnaire (i.e. questions with long and/or high degree of complexity in the
vignettes). This could imply that users on mobile platforms spend less time reading vignettes before answering
the questions. 65 percent of the respondents answering “don’t know” on one specific, complex question in the
wave 7 survey were mobile users, a significantly higher number than expected when we take into account that
the percentage of respondents answering the survey on a mobile phone was 26 percent of the total sample.
Our numbers show that mobile users on average spent less time than non-mobile users on 85 percent of the
questions in the seventh wave.
REPRESENTATIVITY
In this section, we describe the representativity of the panel as a whole. First, we will discuss factors explaining
representativity. Thereafter we apply demographic variables to present data on representativity by different
strata. The data on representativity is the foundation for the section on weighting.
FACTORS EXPLAINING LACK OF REPRESENTATIVITY
There are two main points that can serve as explanations to non-response and lack of representativity when
recruiting panel and maintaining panel members:
access to and familiarity with the internet (given that a web-based questionnaire was the only
response mode made available)
the motivation and interest of the respondents
The first challenge is strongly related to the age composition of the survey respondents. Although Norway has a
very high computer and internet density, the probability of having an e-mail address, and the skills required to
access and fill in an online questionnaire, normally decreases with increasing age. The second challenge,
motivation and interest, is often explained by the respondents’ level of education. In addition to age and
education, we added the variables of geography and gender in order to test the representativity of the survey
respondents. The variables have the following categories:
Age: 19-29 years, 30-59 years, 60 and above.
Highest completed education: no education/elementary school, upper secondary,
university/university college.
All respondents
G1-respondents
G2-respondents
G3-respondents
G4-respondents
G5-respondents
G6-respondents
All users 14.5 15.2 16.5 16.4 15.2 14.5 14.5
Non-mobile users 15.4 16.2 17.6 17.1 16.2 15.2 15.4
Mobile users 13.1 13.8 14.6 15.1 13.5 13.5 13.1

8
Geography: Oslo/Akershus, Eastern Norway, Southern Norway, Western Norway, Trøndelag,
Northern Norway.
THE REPRESENTATIVITY OF THE NORWEGIAN CITIZEN PANEL
The sampling frame of the survey equals to the Norwegian population above the age of 18, comprising a
population of approximately 4,1 million individuals. Earlier reports have documented a systematic
underrepresentation of respondents belonging to the two lowest educational groups, independent of gender
and age. The underrepresentation is however particularly strong for young men. As expected, individuals with
education from universities or university colleges are overrepresented. All of these observations are still true
for wave 15.
Table 4: Age distribution in the population and the net sample of wave 15 18-29 years 30-59 years 60 years and above
Population 20.3 % 51.1 % 28.6 % Net sample 7.8 % 47.2 % 45.0 %
From the age distribution presented in table 4, we see that 18-29-year olds are underrepresented in the net
sample of wave 15. The representation of the age group 30-59 years in the net sample is slightly
underrepresented compared to the distribution in the population, while respondents aged 60 years and above
are clearly overrepresented.
In wave 15, all age brackets have become less representative compared to the population (figure 4). The
underrepresentation of the young and middle-aged respondents and overrepresentation of respondents above
the age of 60 is at its most prominent in the history of the panel.
Waves that succeed a recruitment wave share a pattern. After each recruitment wave (wave 1, 3, 8, 11, and
14), all age brackets become either more underrepresented or more overrepresented compared to the
population. These patterns are explained by varying degree of panel-loyalty between the different age groups.
The oldest age group started out as underrepresented in wave 1, but thereafter they have become increasingly
overrepresented since they are more likely to answer once they have been recruited. A lesser sense of
loyalty/interest explains the development of 18-29-year olds. This group also started out as underrepresented,
but their underrepresentation has steadily increased as they are less likely to answer succeeding waves after
they have been recruited.

9
New patterns emerge when adding gender in table 5; young men are more underrepresented than young
women. In the oldest age group, men are clearly overrepresented, more so than women. Lastly, the middle-
aged men in the net sample are underrepresented, while women in this age bracket are slightly
overrepresented.
Table 5: Combined distribution of age and gender in the population and the net sample of wave 15
18-29 years 30-59 years 60 years and above
Men Women Men Women Men Women
Population 10.4 % 9.9 % 26.3 % 24.8 % 13.4 % 15.2 % Net sample 3.3 % 4.6 % 21.9 % 25.3 % 24.5 % 20.5 %
The inclusion of educational level in table 6 reveals a systematic underrepresentation of respondents with little
or no education, independent of age and gender. As discussed in relation to table 4, the underrepresentation is
especially strong for young respondents. The underrepresentation is also strong for middle-aged respondents
with little or no education. There is also some underrepresentation of respondents aged 60 and above with
little or no education.
Table 6: Combined distribution of age, gender and education in the population and the net sample of wave 15 Population Net sample
Men Women Men Women
No education/elementary school
18
-29
year
s 4.1 % 3.1 % 0.3 % 0.4 %
Upper secondary education 4.1 % 3.2 % 1.6 % 2.0 %
University/university college 2.3 % 3.6 % 1.4 % 2.1 %
No education/elementary school
30
-59
year
s 5.5 % 4.7 % 0.8 % 0.7 %
Upper secondary education 11.6 % 8.3 % 7.7 % 5.7 %
University/university college 9.2 % 11.8 % 13.7 % 19.1 %
No education/elementary school
60
an
d
abo
ve 3.2 % 4.6 % 2.6 % 2.2 %
Upper secondary education 6.7 % 7.3 % 7.4 % 5.2 %
University/university college 3.6 % 3.3 % 14.6 % 12.5 %
Respondents that have upper secondary education as their highest completed education are underrepresented
in all groups, except men with upper secondary education aged 60 years or above. Those who have university
or university college education are clearly overrepresented in the two oldest age brackets, independent of
gender.

10
Figure 55 illustrates the representation of education groups since wave 1. The general trend is that the highly
educated are overrepresented compared to those with less or no education. Except for slight adjustments
improving the representativity of the education groups when new respondents are recruited (wave 1, 3, 8, 11,
and 14), the overall pattern has remained stable throughout all waves.
In regards to geography, (table 7) we observe that Trøndelag and Southern Norway are on level with the
population, while the capital area – the counties of Oslo and Akershus – is clearly overrepresented. Western
Norway is also overrepresented, but not as prominent as the capital area. Northern Norway and Eastern
Norway meanwhile are underrepresented among the respondents in the fifteenth wave.
Table 7: Combined distribution of age, gender and geography in the population and the net sample of wave 15 Population Net sample
Men Women Total Men Women Total
Akershus/Oslo 18-29 years 2.5 % 2.6 % 5.2 % 1.0 % 1.4 % 2.4 %
30-59 years 6.8 % 6.4 % 13.2 % 6.3 % 8.0 % 14.3 %
60 and above 2.7 % 3.1 % 5.8 % 6.1 % 5.8 % 11.9 %
In total 12.0 % 12.2 % 24.1 % 13.4 % 15.2 % 28.6 %
Eastern Norway 18-29 years 2.5 % 2.3 % 4.8 % 0.6 % 0.7 % 1.3 %
30-59 years 6.7 % 6.5 % 13.2 % 4.8 % 5.2 % 10.0 %
60 and above 4.0 % 4.6 % 8.6 % 6.5 % 5.2 % 11.7 %
In total 13.2 % 13.4 % 26.5 % 11.9 % 11.1 % 23.0 %
Southern Norway 18-29 years 0.6 % 0.6 % 1.2 % 0.1 % 0.2 % 0.3 %
30-59 years 1.4 % 1.4 % 2.8 % 1.1 % 1.2 % 2.3 %
60 and above 0.8 % 0.9 % 1.6 % 1.3 % 1.0 % 2.3 %
In total 2.8 % 2.8 % 5.6 % 2.5 % 2.4 % 4.9 %
Western Norway 18-29 years 2.8 % 2.6 % 5.4 % 0.8 % 1.3 % 2.1 %
30-59 years 6.8 % 6.3 % 13.1 % 6.1 % 7.0 % 13.1 %
60 and above 3.4 % 3.8 % 7.2 % 6.5 % 5.6 % 12.1 %
In total 13.0 % 12.7 % 25.7 % 13.4 % 13.9 % 27.3 %
Trøndelag 18-29 years 1.0 % 0.9 % 1.9 % 0.4 % 0.6 % 1.0 %
30-59 years 2.2 % 2.1 % 4.2 % 2.0 % 2.0 % 4.0 %
60 and above 1.2 % 1.3 % 2.5 % 2.0 % 1.4 % 3.4 %
In total 4.4 % 4.3 % 8.7 % 4.4 % 4.0 % 8.4 %
Northern Norway 18-29 years 1.0 % 0.9 % 1.9 % 0.3 % 0.3 % 0.6 %
30-59 years 2.3 % 2.2 % 4.5 % 1.7 % 1.9 % 3.6 %
60 and above 1.4 % 1.5 % 2.9 % 2.1 % 1.4 % 3.5 %
In total 4.7 % 4.6 % 9.3 % 4.1 % 3.6 % 7.7 %
The clearly most overrepresented group are men and women aged 60 years and above living in the capital
area. This group accounts for 5.8 percent of the population but 11.9 percent of the respondents in wave 15
belongs to this demography. The most underrepresented groups are young men and women in all regions, in
addition to middle-aged men and women in Eastern Norway.
5 Note that the calculations for wave 9 in figure 5 has been updated in this documentation report, and in the respective figures in the documentation reports for wave 10-14.
11
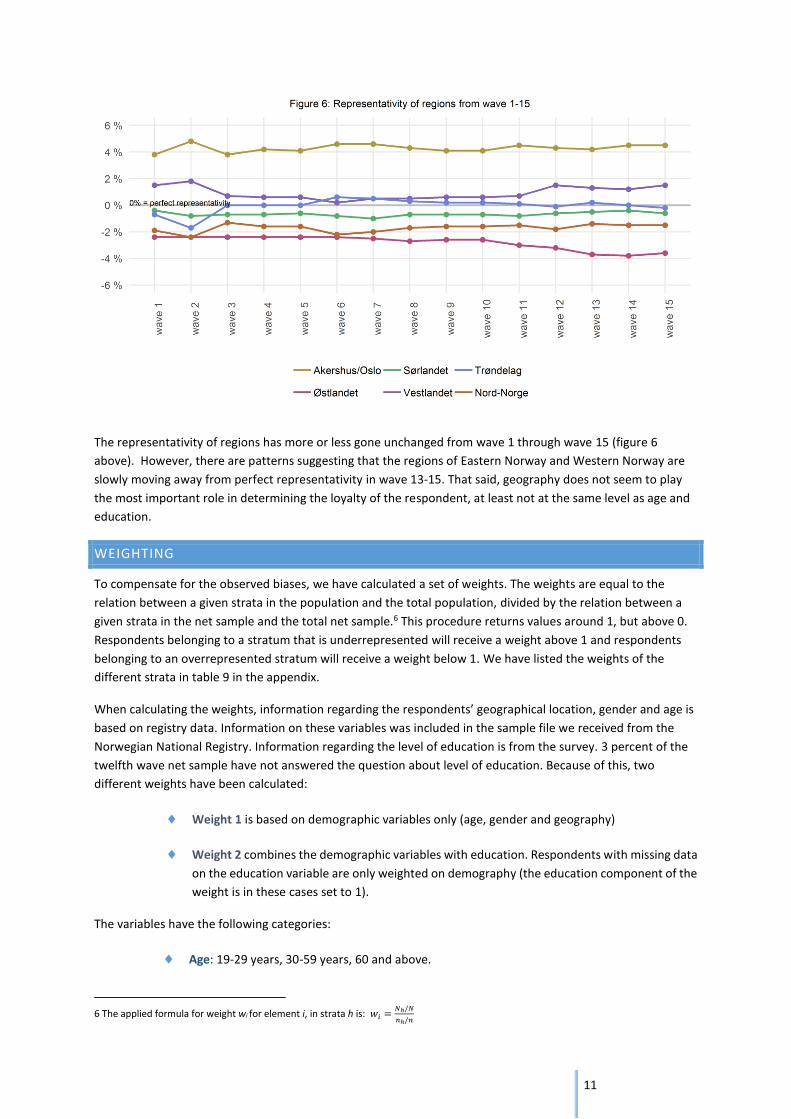
The representativity of regions has more or less gone unchanged from wave 1 through wave 15 (figure 6
above). However, there are patterns suggesting that the regions of Eastern Norway and Western Norway are
slowly moving away from perfect representativity in wave 13-15. That said, geography does not seem to play
the most important role in determining the loyalty of the respondent, at least not at the same level as age and
education.
WEIGHTING
To compensate for the observed biases, we have calculated a set of weights. The weights are equal to the
relation between a given strata in the population and the total population, divided by the relation between a
given strata in the net sample and the total net sample.6 This procedure returns values around 1, but above 0.
Respondents belonging to a stratum that is underrepresented will receive a weight above 1 and respondents
belonging to an overrepresented stratum will receive a weight below 1. We have listed the weights of the
different strata in table 9 in the appendix.
When calculating the weights, information regarding the respondents’ geographical location, gender and age is
based on registry data. Information on these variables was included in the sample file we received from the
Norwegian National Registry. Information regarding the level of education is from the survey. 3 percent of the
twelfth wave net sample have not answered the question about level of education. Because of this, two
different weights have been calculated:
Weight 1 is based on demographic variables only (age, gender and geography)
Weight 2 combines the demographic variables with education. Respondents with missing data
on the education variable are only weighted on demography (the education component of the
weight is in these cases set to 1).
The variables have the following categories:
Age: 19-29 years, 30-59 years, 60 and above.
6 The applied formula for weight wi for element i, in strata h is: 𝑤𝑖 =
𝑁ℎ/𝑁
𝑛ℎ/𝑛

12
Highest completed education: no education/elementary school, upper secondary,
university/university college.
Geography: Oslo/Akershus, Eastern Norway, Southern Norway, Western Norway, Trøndelag,
Northern Norway.
The method for calculating weights is the same as in previous waves.
When applied, both weights will provide a weighted N equal to the number of respondents in the dataset.
As shown in the discussion above, of the factors considered, level of education creates the most bias. We
therefore strongly recommend using weight 2 in most statistical analyses, as this weight provides the most
accurate compensation for the various sources of bias in the net sample. Table 8 shows the effects of weight 2
on the distribution of self-reported level of education in the net sample. As we can observe, the weight gives
the sample a perfect distribution compared to the population. It is however important to stress that the
distribution when not weighted is far from ideal, with a clear underrepresentation of the population with low
levels of education.
Table 8: Effect of weight 2 on self-reported level of education
Sample - not weighted
Sample - weighted
Population Difference between sample and population
Difference between weighted sample and population
No education/elementary school 7.0 % 24.7 % 25.2 % -18.2 % -0.5 %
Upper secondary eduction 29.5 % 41.4 % 41.2 % -11.7 % 0.2 %
University/university college 63.5 % 33.9 % 33.6 % 29.9 % 0.3 %

13
APPENDIX
Table 9: Weights applied to different strata (weight 2)
Men Women Men Women
Osl
o/A
kers
hu
s
18
-29
yea
rs No education/elementary school 13.5 5.9
Wes
tern
No
rway
18
-29
yea
rs No education/elementary school 7.4 7.9
Upper secondary education 1.7 1.4 Upper secondary education 3.9 1.5
University/university college 1.7 1.6 University/university college 1.8 1.5
30
-59
yea
rs No education/elementary school 6.4 7.9
30
-59
yea
rs No education/elementary school 8.4 6.8
Upper secondary education 1.5 1.3 Upper secondary education 1.4 1.3
University/university college 0.7 0.6 University/university college 0.6 0.6
60
an
d a
bo
ve
No education/elementary school 1.0 1.7
60
an
d a
bo
ve
No education/elementary school 1.1 1.8
Upper secondary education 0.9 1.2 Upper secondary education 0.8 1.2
University/university college 0.2 0.2 University/university college 0.2 0.2
East
ern
No
rway
18
-29
yea
rs No education/elementary school 17.4 11.0
Trø
nd
elag
18
-29
yea
rs No education/elementary school 14.2 3.5
Upper secondary education 4.1 2.3 Upper secondary education 1.6 1.1
University/university college 1.4 3.0 University/university college 1.5 1.4
30
-59
yea
rs No education/elementary school 7.1 8.5
30
-59
yea
rs No education/elementary school 7.9 13.0
Upper secondary education 1.7 1.8 Upper secondary education 1.2 1.6
University/university college 0.7 0.7 University/university college 0.7 0.6
60
an
d a
bo
ve
No education/elementary school 1.7 2.2
60
an
d a
bo
ve
No education/elementary school 1.2 3.0
Upper secondary education 1.0 1.7 Upper secondary education 0.9 1.7
University/university college 0.2 0.3 University/university college 0.3 0.3
Sou
ther
n N
orw
ay 1
8-2
9 y
ears
No education/elementary school 19.1 -
No
rth
ern
No
rway
18
-29
yea
rs No education/elementary school - 13.0
Upper secondary education 3.9 1.5 Upper secondary education 1.9 2.6
University/university college 4.0 1.5 University/university college 1.4 1.8
30
-59
yea
rs No education/elementary school 5.6 5.5
30
-59
yea
rs No education/elementary school 5.0 4.2
Upper secondary education 1.8 1.4 Upper secondary education 1.6 1.7
University/university college 0.7 0.7 University/university college 0.7 0.8
60
an
d a
bo
ve
No education/elementary school 1.1 2.7
60
an
d a
bo
ve
No education/elementary school 1.1 3.2
Upper secondary education 1.1 1.9 Upper secondary education 1.1 1.6
University/university college 0.3 0.3 University/university college 0.3 0.3