Embed Size (px)
DESCRIPTION
Partial Loss of Prestress
Citation preview

PARTIAL LOSS OF PRESTRESS
3.1 INTRODUCTION
It is a well-established fact that the initial prestressing force applied to the concrete e lement undergoes a progressive process of reduction over a period of approxi mately five years. Conseq uently. it is important to determine the level of the prestressing fo rce at each loading stage. from the stage of transfer of the prestressing force to the concrete. 10 the various stages of prestressing available at service load , up to the ultimate. Essentially. the red uction in the prestressing force can be grouped in to two categories:
• Immediate elastic loss during the fabrication o r construction process, including elastic shorten ing of the concrete. anchorage losses, and fricliona llosses .
• Time-dependent losses such as creep, shrin kage, and those due to temperature ef· fec ts and steel relaxation. all o f which are determinable at the service-load limit state of stress in the prestressed concrete element .
An exact determination of the magnitude o f these losses-particularly the timedependen t ones- is not feasible , since they depend o n a multiplicity of interrelated factors. Empirical methods of estimating losses differ with the different codes of practice or
Executive Center. Honolulu. Hawaii. (Counesy, Post-Tensioning Institute.)
73

74 Chapter 3 Partial Loss of Prestress
Table 3.1 AASHTO Lump-Sum Losses
Type of prestressing steel
f~ = 4,000 psi (27.6 N/mm2)
Total loss
f~ = 5,000 psi (34.5 N/mm2)
Pre tensioning strand
Post-tensioninga wire or strand
Bars
32,000 psi (221 N/mm2)
22,000 psi (152 N/mm2)
45,000 psi (310 N/mm2)
33,000 psi (228 N/mm2)
23,000 psi (159 N/mm2)
aLosses due to friction are excluded. Such losses should be computed according to Section 6.S of the AASHTO specifications.
recommendations, such as those of the Prestressed Concrete Institute, the ACI-ASCE joint committee approach, the AASHTO lump-sum approach, the Comite Eurointernationale du Beton (CEB), and the FIP (Federation Internationale de la Precontrainte). The degree of rigor of these methods depends on the approach chosen and the accepted practice of record.
A very high degree of refinement of loss estimation is neither desirable nor warranted, because of the multiplicity of factors affecting the estimate. Consequently, lumpsum estimates of losses are more realistic, particularly in routine designs and under average conditions. Such lump-sum losses can be summarized in Table 3.1 of AASHTO and Table 3.2 of PTI. They include elastic shortening, relaxation in the prestressing steel, creep, and shrinkage, and they are applicable only to routine, standard conditions of loading; normal concrete, quality control, construction procedures, and environmental conditions; and the importance and magnitude of the system. Detailed analysis has to be performed if these standard conditions are not fulfilled.
A summary of the sources of the separate prestressing losses and the stages of their occurrence is given in Table 3.3, in which the subscript i denotes "initial" and the subscript j denotes the loading stage after jacking. From this table, the total loss in prestress can be calculated for pre tensioned and post-tensioned members as follows:
(i) Pretensioned Members
Table 3.2 Approximate Prestress Loss Values for Post-Tensioning
Post-tensioning tendon material
Stress-relieved 270-K strand and stressrelieved 240-K wire
Bar
Low-relaxation 270-K strand
Prestress loss, psi
Slabs Beams and joists
30,000 (207 N/mm2) 35,000 (241 N/mm2)
20,000 (138 N/mm2) 25,000 (172 N/mm2)
15,000 (103 N/mm2) 20,000 (138 N/mm2)
(3.1a)
Note: This table of approximate prestress losses was developed to provide a common post-tensioning industry basis for determining tendon requirements on projects in which the magnitude of prestress losses is not specified by the designer. These loss values are based on use of normal-weight concrete and on average values of concrete strength, prestress level, and exposure conditions. Actual values of losses may vary significantly above or below the table values where the concrete is stressed at low strengths, where the concrete is highly prestressed, or in very dry or very wet exposure conditions. The table values do not include losses due to friction.
Source: Post-Tensioning Institute.

3.2 Elastic Shortening of Concrete (ES) 75
Table 3.3 Types of Prestress Loss
Stage of occurrence Tendon stress loss
Type of Pretensioned Post-tensioned During time Total or prestress loss members members interval (ti1 tj) during life
Elastic shortening of At transfer At sequential t:.fpES concrete (ES) jacking
Relaxation of tendons (R) Before and after transfer After transfer t:.fpR(t;, t) t:.fpR
Creep of concrete (CR) After transfer After transfer t:.fpc(t;, t) t:.fPCR Shrinkage of concrete (SH) After transfer After transfer t:.fps(t;, tj) t:.fpSH Friction (F) At jacking t:.fpF Anchorage seating loss (A) At transfer t:.fpA
Total Life Life
where AlpR = AlpR(to,ttr) + NpR(ttr> ts) to = time at jacking ttr = time at transfer ts = time at stabilized loss
t:.fPT(tj) t) t:.fpT
Hence, computations for steel relaxation loss have to be performed for the time interval t1 through t2 of the respective loading stages.
As an example, the transfer stage, say, at 18 h would result in ttr = t2 = 18 hand to = t1 = O. If the next loading stage is between transfer and 5 years (17,520 h), when losses are considered stabilized, then t2 = ts = 17,520 hand t1 = 18 h. Then, if Ipi is the initial prestressing stress that the concrete element is subjected to and Ip] is the jacking stress in the tendon, then
(3.1b)
(ii) Post-tensioned Members
(3.1c)
where alpES is applicable only when tendons are jacked sequentially, and not simultaneously.
In the post-tensioned case, computation of relaxation loss starts between the transfer time t1 = ttr and the end of the time interval t2 under consideration. Hence
(3.1d)
3.2 ELASTIC SHORTENING OF CONCRETE (ES)
Concrete shortens when a prestressing force is applied. As the tendons that are bonded to the adjacent concrete simultaneously shorten, they lose part of the prestressing force that they carry.
3.2.1 Pretensioned Elements
For pretensioned (precast) elements, the compressive force imposed on the beam by the tendon results in the longitudinal shortening of the beam, as shown in Figure 3.1. The unit shortening in concrete is EES = aEsIL, so
76 Chapter 3 Partial Loss of Prestress
Tendon
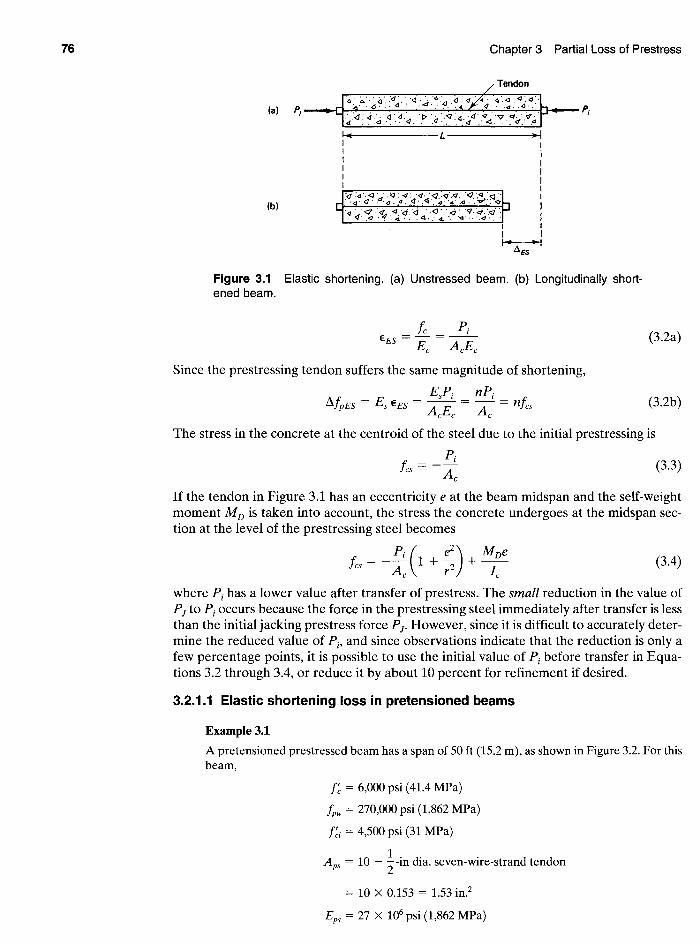
Figure 3.1 Elastic shortening. (a) Unstressed beam. (b) Longitudinally shortened beam.
fe Pi EES = - =--
Ee AeEe
Since the prestressing tendon suffers the same magnitude of shortening,
EsPi nPi !1fpEs = EsEEs = A E = A = nfes
e e e
(3.2a)
(3.2b)
The stress in the concrete at the centroid of the steel due to the initial prestressing is
Pi fes =-:A (3.3)
e
If the tendon in Figure 3.1 has an eccentricity e at the beam midspan and the self-weight moment M D is taken into account, the stress the concrete undergoes at the midspan section at the level of the prestressing steel becomes
Pi ( e2
) MDe fes = - Ae 1 + ,2 + T (3.4)
where Pi has a lower value after transfer of prestress. The small reduction in the value of PJ to Pi occurs because the force in the prestressing steel immediately after transfer is less than the initial jacking prestress force PJ. However, since it is difficult to accurately determine the reduced value of Pi' and since observations indicate that the reduction is only a few percentage points, it is possible to use the initial value of Pi before transfer in Equations 3.2 through 3.4, or reduce it by about 10 percent for refinement if desired.
3.2.1.1 Elastic shortening loss in pretensioned beams
Example 3.1
A pretensioned prestressed beam has a span of 50 ft (15.2 m), as shown in Figure 3.2. For this beam,
!~ = 6,000 psi (41.4 MPa)
!pu = 270,000 psi (1,862 MPa)
!;i = 4,500 psi (31 MPa)
Aps = 10 - ~-in dia. seven-wire-strand tendon
= 10 X 0.153 = 1.53 in.2
Eps = 27 X 106 psi (1,862 MPa)

3.2 Elastic Shortening of Concrete (ES) 77
1
r DT 30"
~ . 1 62mm)
TH 15"
(381 mm)
+i----~--2+ I. 50'~ .1
(15.2 m)
Section 1-1
Figure 3.2 Beam in Example 3.1.
Calculate the concrete fiber stresses at transfer at the centroid of the tendon for the midspan section of the beam, and the magnitude of loss in prestress due to the effect of elastic shortening of the concrete. Assume that prior to transfer, the jacking force on the tendon was 75% fpu'
Solution:
Ac = 15 X 30 = 450 in.2
15(30? I = -- = 33750in.4
C 12 '
2 Ie . 2 r = - = 75m.
Ac
Aps = 10 X 0.153 = 1.53 in.2
e = 30 - 4 = 11 in e 2 .
Pi = 0.75fpuAps = 0.75 X 270,000 X 1.53 = 309,825 lb
wl2 15 X 30 (50)2 MD = 8 = 144 X 15~ X 12 = 1,757,813 in.-lb
From Equation 3.4, the concrete fiber stress at the steel centroid of the beam at the moment of transfer, assuming that Pi == PJ' is
P;( e2) MDe
fcs=-A:\I+ r +---y;
= _ 309,825 1 + 112) + 1,757,813 X 11 450 75 33,750
= -1,799.3 + 572.9 = -1,226.4 psi (8.50 MPa)
We also have
Initial Ed = 57,000~ = 57,000Y 4,500 = 3.824 X 10⁶ psi
Es 27 X 106
Initial modular ratio n = - = 6 = 7.06 Eel 3.824 X 10
28 days' strength Ec = 57,000Y6,000 = 4.415 X 10⁶ psi
27 X 106
28 days' modular ratio n = 4.415 X 106 = 6.12
From Equation 3.2b, the loss of prestress due to elastic shortening is
!:J..fpES = nfcs = 7.06 X 1,226.4 = 8,659.2 psi (59.7 MPa)

78 Chapter 3 Partial Loss of Prestress
3.2.2 Post-Tensioned Elements
In post-tensioned beams, the elastic shortening loss varies from zero if all tendons are jacked simultaneously to half the value calculated in the pretensioned case if several sequential jacking steps are used, such as jacking two tendons at a time. If n is the number of tendons or pairs of tendons sequentially tensioned, then
(3.5)
where j denotes the number of jacking operations. Note that the tendon that was tensioned last does not suffer any losses due to elastic shortening, while the tendon that was tensioned first suffers the maximum amount of loss.
3.2.2.1 Elastic shortening loss in post-tensioned beam
Example 3.2
Solve Example 3.1 if the beam is post-tensioned and the prestressing operation is such that
(a) Two tendons are jacked at a time.
(b) One tendon is jacked at a time.
(c) All tendons are simultaneously tensioned.
Solution:
(a) From Example 3.1, l1!pE = 8,659.2 psi. Clearly, the last tendon suffers no loss of prestress due to elastic shortening. So only the first four pairs have losses, with the first pair suffering the maximum loss of 8,659.2 psi. From Equation 3.5, the loss due to elastic shortening in the post-tensioned beam is
(b)
4/4 + 3/4 + 2/4 + 1/4 l1!pEs = 5 (8,659.2)
= ~~ x (8,659.2) = 4,330 psi (29.9 MPa)
9/9 + 8/9 + ... + 1/9 l1!pEs = 10 (8,659.2)
45 . = 90 x (8,659.2) = 4,330 pSI (29.9 MPa)
In both cases the loss in prestressing in the post-tensioned beam is half that of the pretensioned beam.
(c) l1!pEs = 0
3.3 STEEL STRESS RELAXATION (R)
Stress-relieved tendons suffer loss in the prestressing force due to constant elongation with time, as discussed in Chapter 2. The magnitude of the decrease in the prestress depends not only on the duration of the sustained prestressing force, but also on the ratio

3.3 Steel Stress Relaxation (R) 79
fp/fpy of the initial prestress to the yield strength of the reinforcement. Such a loss in stress is termed stress relaxation. The ACI 318-05 Code limits the tensile stress in the prestressing tendons to the following:
(a) For stresses due to the tendon jacking force, fp] = 0.94 fpy, but not greater than the lesser of 0.80 fpu and the maximum value recommended by the manufacturer of the tendons and anchorages.
(b) Immediately after prestress transfer, fpi = 0.82 fpy, but not greater than 0.74 fpu' (c) In post-tensioned tendons, at the anchorages and couplers immediately after force
transfer = 0.70 fpu'
The range of values of fpy is given by the following:
Prestressing bars: fpy = 0.80 fpu Stress-relieved tendons: fpy = 0.85 fpu Low-relaxation tendons: fpy = 0.90 fpu
If fpR is the remaining prestressing stress in the steel after relaxation, the following expression defines fpR for stress relieved steel:
fpR _ _ (lOg t2 - log t1)(fpi _ ) -r. - 1 10 -r 0.55 Jp' Jpy
(3.6)
In this expression, log t in hours is to the base 10, fp/fpy exceeds 0.55, and t = t2 - t1. Also, for low-relaxation steel, the denominator of the log term in the equation is divided by 45 instead of 10. A plot of Equation 3.6 is given in Figure 3.3.
An approximation of the term (log t2 - log t1) can be made in Equation 3.6 so that log t = log(t2 - t1) without significant loss in accuracy. In that case, the stress-relaxation loss becomes
log t (f;i ) afpR = f;r-10 fpy - 0.55
where f;i is the initial stress in steel to which the concrete element is subjected.
100
90
... c: 80 ~ ., c.
';"Q. 70 .... Q.
60
50 10 100
f· ~ =0.6 fpy
0.7 0.8 0.9
1000 Time, hours
10,000 100,000
Figure 3.3 Stress-relaxation relationship in stress-relieved strands. (Courtesy, Post-Tensioning Institute.)
(3.7)

80 Chapter 3 Partial Loss of Prestress
If a step-by-step loss analysis is necessary, the loss increment at any particular stage can be defined as
f:jJ = ft (lOg t2 - log t1) (f~i _ 055) JpR pI 10 -F'
Jpy (3.8)
where t1 is the time at the beginning of the interval and t2 is the time at the end of the interval from jacking to the time when the loss is being considered.
For low relaxation steel, the divider is 45 instead of 10 in Equation 3.8, as shown in Equation 2.19.
3.3.1 Relaxation Loss Computation
Example 3.3
Find the relaxation loss in prestress at the end of 5 years in Example 3.1, assuming that relaxation loss from jacking to transfer, from elastic shortening, and from long-term loss due to creep and shrinkage over this period is 20 percent of the initial prestress. Assume also that the yield strength!py = 230,000 psi (1,571 MPa).
Solution: From Equation 3.1b for this stage
!Pi = !pJ - l:l.!pR(tO, f,,)
= 0.75 X 270,000 = 202,500 psi (1,396 MPa)
The reduced stress for calculating relaxation loss is
!~i = (1 - 0.20) X 202,500 = 162,000 psi (1,170 MPa)
The duration of the stress-relaxation process is
5 X 365 X 24 2:: 44,000 hours
From Equation 3.7,
log f (!~i ) l:l.!pR = !~{-io !py - 0.55
_ log 44,000 (162,000 _ ) - 162,000 10 230000 0.55 ,
= 162,000 X 0.4643 X 0.1543 = 11,606 psi (80.0 MPa)
3.3.2 ACI·ASCE Method of Accounting for Relaxation Loss
The ACI-ASCE method uses the separate contributions of elastic shortening, creep, and shrinkage in the evaluation of the steel stress-relaxation loss by means of the equation
ilfpR = [Kre - Jil(fpES + fpCR + fpSH)] X C
The values of K r& J, and C are given in Tables 3.4 and 3.5.
3.4 CREEP LOSS (eR)
Experimental work over the past half century indicates that flow in materials occurs with time when load or stress exists. This lateral flow or deformation due to the longitudinal stress is termed creep. A more detailed discussion is given in Ref. 3.9. It must be emphasized that creep stresses and stress losses result only from sustained loads during the loading history of the structural element.

3.4 Creep Loss (CR) 81
Table 3.4 Values of C
Stress-relieved bar Stress-relieved or low-relaxation
fp/fpu strand or wire strand or wire
0.80 1.28
0.79 1.22
0.78 1.16
0.77 1.11
0.76 1.05
0.75 1.45 1.00
0.74 1.36 0.95
0.73 1.27 0.90
0.72 1.18 0.85
0.71 1.09 0.80
0.70 1.00 0.75
0.69 0.94 0.70
0.68 0.89 0.66
0.67 0.83 0.61
0.66 0.78 0.57
0.65 0.73 0.53
0.64 0.68 0.49
0.63 0.63 0.45
0.62 0.58 0.41 0.61 0.53 0.37
0.60 0.49 0.33
Source: Post-Tensioning Institute.
The deformation or strain resulting from this time-dependent behavior is a function of the magnitude of the applied load, its duration, the properties of the concrete including its mixture proportions, curing conditions, the age of the element at first loading, and environmental conditions. Since the stress-strain relationship due to creep is essentially linear, it is feasible to relate the creep strain ECR to the elastic strain EEL such that a creep coefficient Cu can be defined as
Table 3.5 Values of KRE and J
Type of tendon8 KRE
270 Grade stress-relieved strand or wire 20,000
250 Grade stress-relieved strand or wire 18,500
240 or 235 Grade stress-relieved wire 17,600
270 Grade low-relaxation strand 5,000 250 Grade low-relaxation wire 4,630
240 or 235 Grade low-relaxation wire 4,400
145 or 160 Grade stress-relieved bar 6,000
aIn accordance with ASTM A416-74, ASTM A421-76, or ASTM A722-75.
Source: Prestressed Concrete Institute.
J
0.15
0.14
0.13
0.040
0.037
0.035
0.05

82 Chapter 3 Partial Loss of Prestress
ECR C =-
u EEL (3.9a)
Then the creep coefficient at any time t in days can be defined as
to.60 C = C
t 10 + to.60 u (3.9b)
As discussed in Chapter 2, the value of Cu ranges between 2 and 4, with an average of 2.35 for ultimate creep. The loss in prestressed members due to creep can be defined for bonded members as
(3.10)
where fes is the stress in the concrete at the level of the centroid of the prestressing tendon. In general, this loss is a function of the stress in the concrete at the section being analyzed. In post-tensioned, nonbonded members, the loss can be considered essentially uniform along the whole span. Hence, an average value of the concrete stress fes between the anchorage points can be used for calculating the creep in post-tensioned members.
The ACI-ASCE Committee expression for evaluating creep loss has essentially the same format as Equation 3.10, viz.,
(3.11a)
or
(3.11b)
where KCR = 2.0 for pretensioned members = 1.60 for post-tensioned members (both for normal concrete)
fes = stress in concrete at level of steel cgs immediately after transfer lesd = stress in concrete at level of steel cgs due to all superimposed dead loads
applied after prestressing is accomplished n = modular ratio
Note that KCR should be reduced by 20 percent for lightweight concrete.
3.4.1 Computation of Creep Loss
Example 3.4
Compute the loss in prestress due to creep in Example 3.1 given that the total superimposed load, excluding the beam's own weight after transfer, is 375 plf (5.5 kN/m).
Solution: At full concrete strength,
Ee = 57,000 \/6,000 = 4.415 X 10⁶ psi (30.4 X 10³ MPa)
n = Es = 27.0 X 106
= 6.12 Ec 4.415 X 10⁶
375(50? MSD = 8 X 12 = 1,406,250 in.-lb (158.9 kN-m)

3.5 Shrinkage Loss (SH) 83
- MSDe 1,406,250 x 11 . !esd = T = 33,750 = 458.3 pSI (3.2 MPa)
From Example 3.1,
les = 1,226.4 psi (8.5 MPa)
Also, for normal concrete use, KCR = 2.0 (pretensioned beam); so from Equation 3.11a,
l1!pcR = nKCR (fes - lesd)
3.5 SHRINKAGE LOSS (SH)
= 6.12 x 2.0(1,226.4 - 458.3)
= 9,401.5 psi (64.8 MPa)
As with concrete creep, the magnitude of the shrinkage of concrete is affected by several factors. They include mixture proportions, type of aggregate, type of cement, curing time, time between the end of external curing and the application of prestressing, size of the member, and the environmental conditions. Size and shape of the member also affect shrinkage. Approximately 80 percent of shrinkage takes place in the first year of life of the structure. The average value of ultimate shrinkage strain in both moist-cured and steam-cured concrete is given as 780 x 10-6 in.lin. in ACI 209 R-92 Report. This average value is affected by the length of initial moist curing, ambient relative humidity, volumesurface ratio, temperature, and concrete composition. To take such effects into account, the average value of shrinkage strain should be multiplied by a correction factor "ISH as follows
ESH = 780 X 10- 6 "ISH (3.12)
Components of "ISH are factors for various environmental conditions and tabulated in Ref. 3.12, Sec. 2.
The Prestressed Concrete Institute stipulates for standard conditions an average value for nominal ultimate shrinkage strain (ESH)u = 820 x 10-6 in.lin. (mm/mm) , (Ref. 3.4). If ESH is the shrinkage strain after adjusting for relative humidity at volume-tosurface ratio VIS, the loss in prestressing in pre tensioned member is
(3.13)
For post-tensioned members, the loss in prestressing due to shrinkage is somewhat less since some shrinkage has already taken place before post-tensioning. If the relative humidity is taken as a percent value and the VIS ratio effect is considered, the PCI general expression for loss in prestressing due to shrinkage becomes
-6 ( V) IlfpsH = 8.2 x 10 KSH Eps 1 - 0.06 S (100 - RH)
where RH = relative humidity
Table 3.6 Values of KSH for Post-Tensioned Members
Time from end of moist curing to application of prestress, days 1
0.92
3
0.85
Source: Prestressed Concrete Institute.
5 7
0.80 0.77
10 20
0.73 0.64
(3.14)
30 60
0.58 0.45
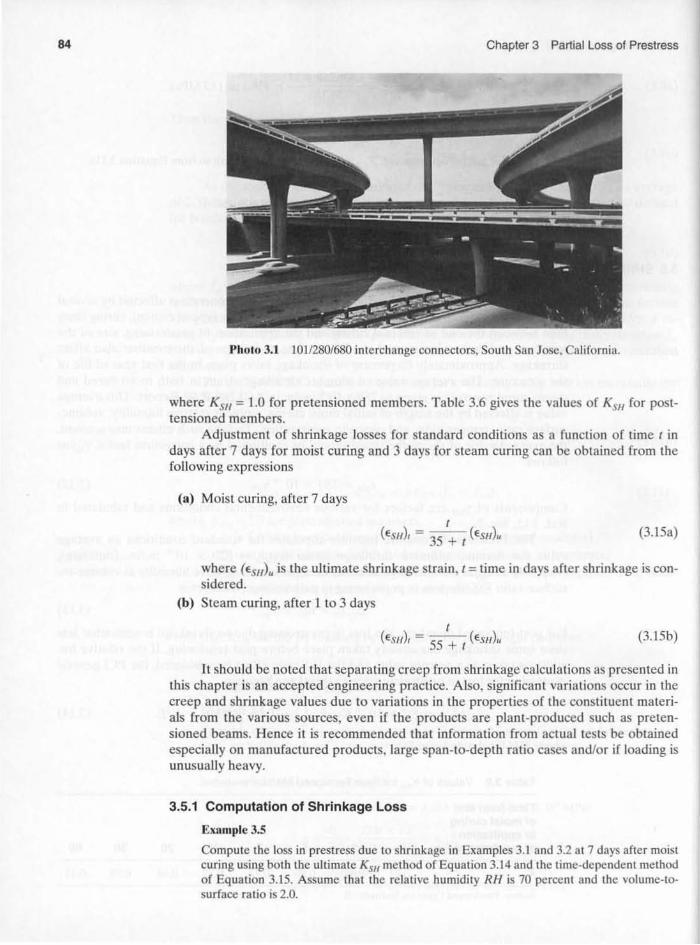
84 Chapter 3 Partial l oss 01 Prestress
Photo 3.1 1011280/680 interchange connectors. South San Jose. Cali fornia.
where K SII = 1.0 for pretensioned members. Table 3.6 gives the values of K SI/ for posttensioned members.
Adjustment of shrinkage losses for standard conditions as a function of time ( in days after 7 days for moist curing and 3 days for steam curing can be obtained from the fol lowi ng expressions
(a) Moist curing, after 7 days
(3.150)
where (ES") .. is the ultimate shrin kage strain. (= time in days after shrinkage is considered.
(b) Steam curing, after I to 3 days
I (ESI/), = 55 + ( (ESI/) .. (3. 15b)
It sho uld be noted that separating creep from shrinkage ca lcu lations as presen ted in this chapter is an accepted engineeri ng practice. A lso. significan t va riations occur in the creep and shri nkage values due to variations in the properties of the constituent materials from the various sources. eve n if the products are plant-prod uced such as pretensioned beams. Hence it is recommended that information from actua l tests be obtained especially on manufactured products. large span-to-depth ratio cases and/or if loading is unusually heavy.
3.5.1 Computation of Shrinkage Loss
E"ample 3.S
Compute the loss in prestress d ue to shrinkage in E"amples 3.1 and 3.2 at 7 days after moist curing using both the ultimate K SIf method of Equation 3.14 and the time.dependent method o f Eq uation 3.15. Assume that the rela tive humidity RH is 70 percent and the volume-tosurface ratio is 2.0.
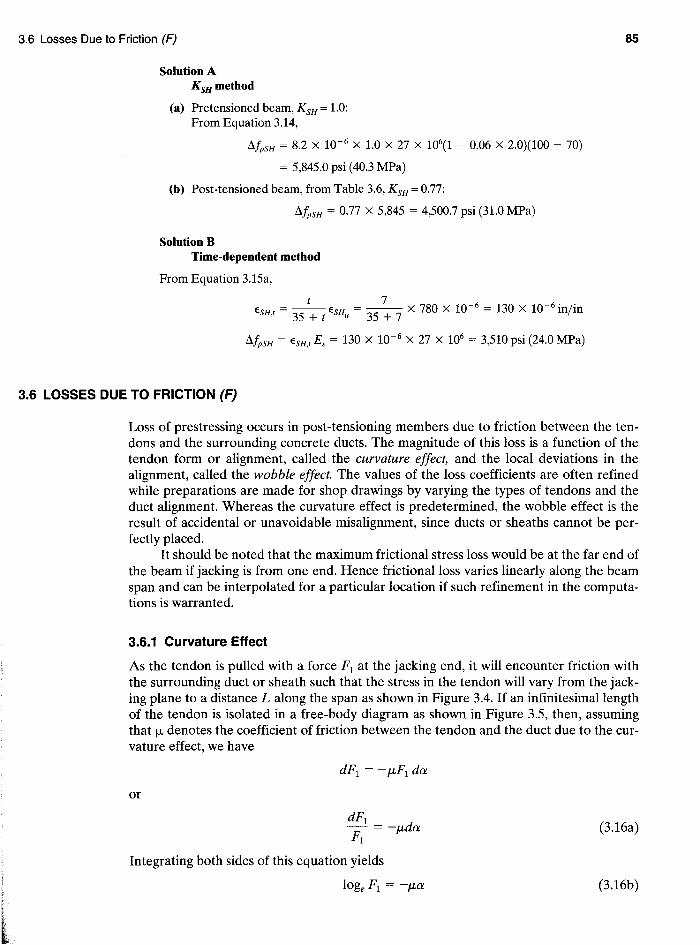
3.6 Losses Due to Friction (F)
Solution A KsHmethod
(a) Pretensioned beam, KSH = 1.0: From Equation 3.14,
I1fpsH = 8.2 X 10- 6 x 1.0 x 27 x 106(1 - 0.06 x 2.0)(100 - 70)
= 5,845.0 psi (40.3 MPa)
(b) Post-tensioned beam, from Table 3.6, KSH = 0.77:
I1fpsH = 0.77 X 5,845 = 4,500.7 psi (31.0 MPa)
Solution B Time-dependent method
From Equation 3.15a,
ESHt = _t_ ESH = -357
X 780 X 10- 6 = 130 X 10- 6 in/in , 35 + t u + 7
I1fpsH = ESH,t Es = 130 X 10- 6 X 27 X 106 = 3,510 psi (24.0 MPa)
3.6 LOSSES DUE TO FRICTION (F)
85
Loss of prestressing occurs in post-tensioning members due to friction between the tendons and the surrounding concrete ducts. The magnitude of this loss is a function of the tendon form or alignment, called the curvature effect, and the local deviations in the alignment, called the wobble effect. The values of the loss coefficients are often refined while preparations are made for shop drawings by varying the types of tendons and the duct alignment. Whereas the curvature effect is predetermined, the wobble effect is the result of accidental or unavoidable misalignment, since ducts or sheaths cannot be perfectly placed.
It should be noted that the maximum frictional stress loss would be at the far end of the beam if jacking is from one end. Hence frictional loss varies linearly along the beam span and can be interpolated for a particular location if such refinement in the computations is warranted.
3.6.1 Curvature Effect
As the tendon is pulled with a force FI at the jacking end, it will encounter friction with the surrounding duct or sheath such that the stress in the tendon will vary from the jacking plane to a distance L along the span as shown in Figure 3.4. If an infinitesimal length of the tendon is isolated in a free-body diagram as shown in Figure 3.5, then, assuming that I-L denotes the coefficient of friction between the tendon and the duct due to the curvature effect, we have
or
dFI - = -J-Lda FI
Integrating both sides of this equation yields
loge FI = -J-La
(3.16a)
(3.16b)

86 Chapter 3 Partial Loss of Prestress
Jacking Tendon end /
~L--~=/~d~ f-L+1
Distance along tendon
Figure 3.4 Frictional force stress distribution in tendon.
If ex = LlR, then
(3.17)
3.6.2 Wobble Effect
Suppose that K is the coefficient of friction between the tendon and the surrounding concrete due to wobble effect or length effect. Friction loss is caused by imperfection in alignment along the length of the tendon, regardless of whether it has a straight or draped alignment. Then by the same principles described in developing Equation 3.16,
(a)
F,
(b)
Tendon
id
P, = F, dOl
F ~--t----~F '~~'
do <¢:J F,
(c)
F, dOl
Figure 3.5 Curvature friction loss. (a) Tendon alignment. (b) Forces on infinitesimallength where Fl is at the jacking end. (c) Polygon of forces assuming Fl = F2 over the infinitesimal length in (b).
(3.18)

3.6 Losses Due to Friction (F)
or
F2 = F1e-KL
Superimposing the wobble effect on the curvature effect gives
F2 = F1e-lLa-KL
or, in terms of stresses,
The frictional loss of stress I:1lpF is then given by
I:1lpF = /1 - 12 = /1(1 - e- lLa - KL )
87
(3.19)
(3.20)
(3.21)
Assuming that the prestress force between the start of the curved portion and its end is small (= 15 percent), it is sufficiently accurate to use the initial tension for the entire curve in Equation 3.21. Equation 3.21 can thus be simplified to yield
(3.22)
where L is in feet. Since the ratio of the depth of beam to its span is small, it is sufficiently accurate to
use the projected length of the tendon for calculating a. Assuming the curvature of the tendon to be based on that of a circular arc, the central angle a along the curved segment in Figure 3.6 is twice the slope at either end of the segment. Hence,
If
then
a m 2m tan-=-=-
2 x/2 x
1 Y == -m and a/2 = 4y/x
2
a = 8y/x radian (3.23)
Table 3.7 gives the design values of the curvature friction coefficient fJ. and the wobble or length friction coefficient K adopted from the ACI 318 Commentary.
3.6.3 Computation of Friction Loss
Example 3.6
Assume that the alignment characteristics of the tendons in the post-tensioned beam of Example 3.2 are as shown in Figure 3.7. If the tendon is made of 7-wire uncoated strands in flexible metal sheathing, compute the frictional loss of stress in the prestressing wires due to the curvature and wobble effects.
~--------------x--------------~
Figure 3.6 Approximate evaluation of the tendon's central angle.

88 Chapter 3 Partial Loss of Prestress
Table 3.7 Wobble and Curvature Friction Coefficients
Type of tendon
Tendons in flexible metal sheathing Wire tendons 7-wire strand High-strength bars
Tendons in rigid metal duct 7-wire strand
Mastic-coated tendons Wire tendons and 7-wire strand
Pre greased tendons Wire tendons and 7-wire strand
Source: Prestressed Concrete Institute.
Solution:
Wobble coefficient, Kperfoot
0.0010-0.0015 0.0005-0.0020 0.0001-0.0006
0.0002
0.0010-0.0020
0.0003-0.0020
Pi = 309,825lb
From Equation 3.23,
309,825 . !pi = --5- = 202,500 pSI
1. 3
8y 8 X 11 . Ci. = ~ = 50 X 12 = 0.1467 radIan
Curvature coefficient, fA.
0.15-0.25 0.15-0.25 0.08-0.30
0.15-0.25
0.05-0.15
0.05-0.15
From Table 3.7, use K = 0.0020 and IL = 0.20. From Equation 3.22, the prestress loss due to friction is
!l.!pF = !pi (/La + KL)
= 202,500(0.20 X 0.1467 + 0.0020 X 50)
= 202,500 X 0.1293 = 26,191 psi (180.6 MPa)
This loss due to friction is 12.93 percent of the initial prestress.
3.7 ANCHORAGE-SEATING LOSSES (A)
Anchorage-seating losses occur in post-tensioned members due to the seating of wedges in the anchors when the jacking force is transferred to the anchorage. They can also occur in the prestressing casting beds of pre tensioned members due to the adjustment
R = 140'
1-------50'-0 .. (15.2 mJ-----J
Figure 3.7 Prestressing tendon alignment.

3.7 Anchorage-Seating losses (A) 89
expected when the prestressing force is transferred to these beds. A remedy for this loss can be easily dfected during the st ressing operations by overstressing. Generally. the magnitude of anchorage-seating loss ranges between ! in. and t in. (6.35 mm and 9.53 mm) for the two-piece wedges. The magnitude of the overstressing that is necessary depends on the anchorage system used since each system has its particular adjustment needs, and the manufacturer is expected to supply the data on the slip expected due to anchorage adjustment. If 6" is the magnitude of the slip, L is the tendon length , and Eps is the modulus of the prestressing wires, then the prestress loss due to anchorage slip becomes
3.7.1 Computation of Anchorage-Seating Loss
EXllmple 3.7
(3.24)
Compute the anchorage·seating loss in the post-tensioned beam o f Example 3.2 if the estimated slip is lin. (6.35 m).
Solut ion:
E,. = 27 X l(f psi
4 04 = 0.25 in.
404 0.25 No .
Ill", =I: E,.. = 50 x 12 x 27 x h,- - 11.250 psI (77.6 MPa)
Note that the percentage of loss due to anchorage slip becomes very high in short-beam elements and thus becomes of major significance in short-span beams. In such cases. it becomes difficult to post-tension such beams with high accuracy.
I'hoto 3.2 Termccntrc. Denver. Colorado. (Courtesy. Post-Tensioning Institute.)


![[XLS] member list.xlsx · Web view1 1 1939 1958 1963 120 2 2 1946 1969 525 110 3 3 506 116 4 4 507 100 5 5 508 100 6 6 1959 1965 225009 509 116 7 7 510 100 8 8 512 150 9 9 513 500](https://img.dokumen.tips/doc/110x75/5aae44547f8b9a5d0a8be639/xls-member-listxlsxweb-view1-1-1939-1958-1963-120-2-2-1946-1969-525-110-3-3-506.jpg)


![Reinforced Concrete (a Fundamental Approach)Edward G[1].Nawy 5t](https://img.dokumen.tips/doc/110x75/5469522baf7959593e8b46f8/reinforced-concrete-a-fundamental-approachedward-g1nawy-5t.jpg)