Embed Size (px)
Citation preview
Consumer
1QFY19E Results Preview
9 JUL 2018
Naveen Trivedi (FMCG, Appliances) [email protected],+91-22-6171 7324
Siddhant Chhabria (FMCG, Appliances) [email protected],+91-22-6171 7336
Madhukar Ladha (Aviation) [email protected], +91-22-6171-7323
Himanshu Shah (Alco-Bev) [email protected], +91-22-6171 7315
Jay Gandhi (Jewellery) [email protected], +91-22-6171-7320
Rohit Harlikar (Jewellery) [email protected], +91-22-6639-3036
Basanth Patil (Lubricants) [email protected], +91-22-6171-7319

2
FMCG Sector: A strong start, promising FY19
Domestic business to post optically strong performance: Our FMCG
coverage universe performance is expected to accelerate in 1QFY19
with 12/17% YoY revenue/EBITDA growth vs. 8/15% YoY in 4QFY18
owing to a favorable base (GST led destocking) of 1/3% YoY in
1QFY18 for domestic business. As per retail audit data by Nielsen
(stated by various management), consumer offtake is yet to recover
fully to the historical levels (low teens). Rural used to grow 2.5-3%
faster than the Urban but the delta has so far reached to only
~1.5%. However, considering macro tailwinds are also supporting
(partially witnessed in the last 2 qtrs) especially in rural, we expect
rural growth to further accelerate. Input prices (mainly crude
derivatives) have risen therefore companies have taken price hikes
of 1-2% during the quarter. Most staple companies plan to take 3-
4% price hike during FY19 to pass on rising inflation costs. This will
further accelerate revenue growth during FY19.
International business is recovering: International business
performance is now beginning to stabilize on account of improving
consumer confidence index for most geographies and favorable
base (impacted by geo-political issues, unfavorable currencies).
1QFY19 result Outliers: HUL, Jubilant FoodWorks and Emami
Recommendation and Top picks: We have been strong believers of
HUL and Britannia to outperform, as category leaders will drive
category growth during turbulent market conditions (demon and
GST). We remain structurally positive for HUL and Britannia,
however on account of limited upside we downgrade HUL and
Britannia to NEUTRAL. We prefer mid-cap staples as consumption
dynamics and trade conditions are now beginning to normalize
which will support pick-up in performance. We have rolled forward
our target price for our coverage universe to Jun-20 EPS (earlier
Mar-20).
Our top picks in FMCG: Emami and Marico
FMCG: Expect 12% Sales And 17% EBITDA Growth
CONSUMER: 1QFY19E RESULTS PREVIEW
-
10.0
20.0
30.0
40.0
ITC
HU
L
GCP
L
Dab
ur
Bri
tan
nia
Mar
ico
Colg
ate
Emam
i
Jubi
lant
Fo
od
Sales Gr. (%) EBITDA Gr. (%)> 40.0
3
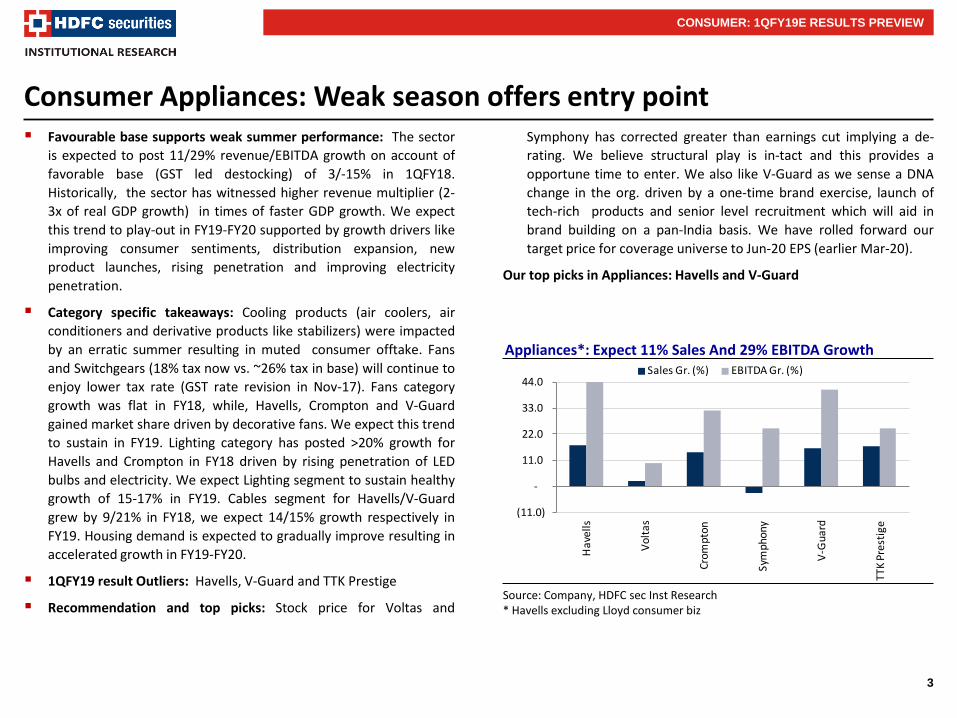
Consumer Appliances: Weak season offers entry point Favourable base supports weak summer performance: The sector
is expected to post 11/29% revenue/EBITDA growth on account of
favorable base (GST led destocking) of 3/-15% in 1QFY18.
Historically, the sector has witnessed higher revenue multiplier (2-
3x of real GDP growth) in times of faster GDP growth. We expect
this trend to play-out in FY19-FY20 supported by growth drivers like
improving consumer sentiments, distribution expansion, new
product launches, rising penetration and improving electricity
penetration.
Category specific takeaways: Cooling products (air coolers, air
conditioners and derivative products like stabilizers) were impacted
by an erratic summer resulting in muted consumer offtake. Fans
and Switchgears (18% tax now vs. ~26% tax in base) will continue to
enjoy lower tax rate (GST rate revision in Nov-17). Fans category
growth was flat in FY18, while, Havells, Crompton and V-Guard
gained market share driven by decorative fans. We expect this trend
to sustain in FY19. Lighting category has posted >20% growth for
Havells and Crompton in FY18 driven by rising penetration of LED
bulbs and electricity. We expect Lighting segment to sustain healthy
growth of 15-17% in FY19. Cables segment for Havells/V-Guard
grew by 9/21% in FY18, we expect 14/15% growth respectively in
FY19. Housing demand is expected to gradually improve resulting in
accelerated growth in FY19-FY20.
1QFY19 result Outliers: Havells, V-Guard and TTK Prestige
Recommendation and top picks: Stock price for Voltas and
Symphony has corrected greater than earnings cut implying a de-
rating. We believe structural play is in-tact and this provides a
opportune time to enter. We also like V-Guard as we sense a DNA
change in the org. driven by a one-time brand exercise, launch of
tech-rich products and senior level recruitment which will aid in
brand building on a pan-India basis. We have rolled forward our
target price for coverage universe to Jun-20 EPS (earlier Mar-20).
Our top picks in Appliances: Havells and V-Guard
Source: Company, HDFC sec Inst Research * Havells excluding Lloyd consumer biz
CONSUMER: 1QFY19E RESULTS PREVIEW
(11.0)
-
11.0
22.0
33.0
44.0
Hav
ells
Vol
tas
Crom
pton
Sym
phon
y
V-G
uard
TTK
Pres
tige
Sales Gr. (%) EBITDA Gr. (%)
Appliances*: Expect 11% Sales And 29% EBITDA Growth
4
FMCG: Optically strong performance
COMPANY 1QFY19E
OUTLOOK WHAT’S LIKELY KEY MONITORABLES
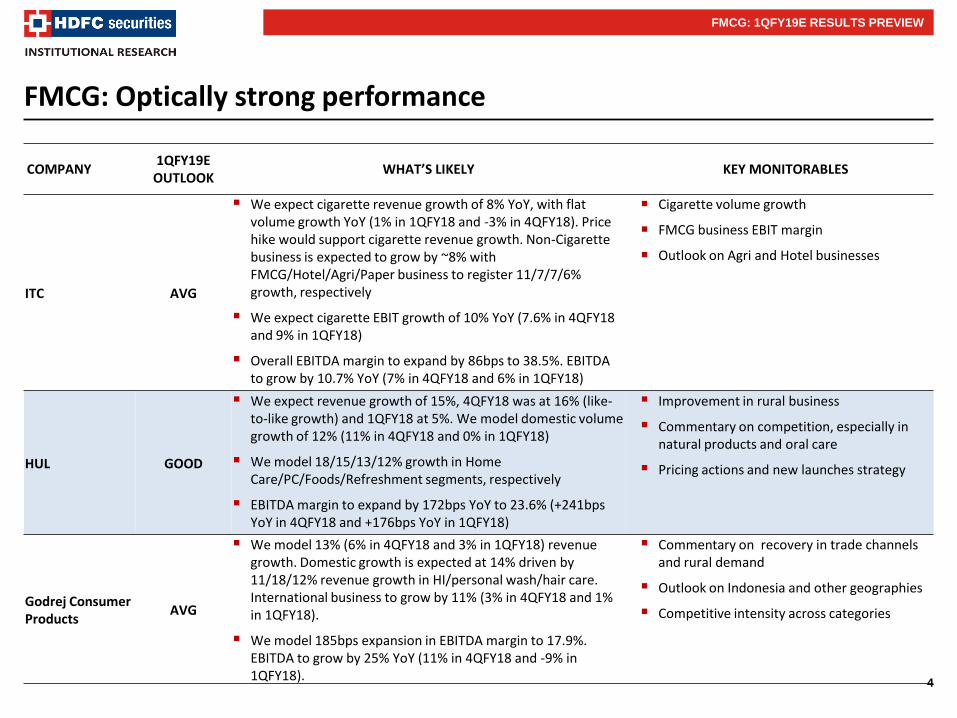
ITC AVG
We expect cigarette revenue growth of 8% YoY, with flat volume growth YoY (1% in 1QFY18 and -3% in 4QFY18). Price hike would support cigarette revenue growth. Non-Cigarette business is expected to grow by ~8% with FMCG/Hotel/Agri/Paper business to register 11/7/7/6% growth, respectively
We expect cigarette EBIT growth of 10% YoY (7.6% in 4QFY18 and 9% in 1QFY18)
Overall EBITDA margin to expand by 86bps to 38.5%. EBITDA to grow by 10.7% YoY (7% in 4QFY18 and 6% in 1QFY18)
Cigarette volume growth
FMCG business EBIT margin
Outlook on Agri and Hotel businesses
HUL GOOD
We expect revenue growth of 15%, 4QFY18 was at 16% (like-to-like growth) and 1QFY18 at 5%. We model domestic volume growth of 12% (11% in 4QFY18 and 0% in 1QFY18)
We model 18/15/13/12% growth in Home Care/PC/Foods/Refreshment segments, respectively
EBITDA margin to expand by 172bps YoY to 23.6% (+241bps YoY in 4QFY18 and +176bps YoY in 1QFY18)
Improvement in rural business
Commentary on competition, especially in natural products and oral care
Pricing actions and new launches strategy
Godrej Consumer Products
AVG
We model 13% (6% in 4QFY18 and 3% in 1QFY18) revenue growth. Domestic growth is expected at 14% driven by 11/18/12% revenue growth in HI/personal wash/hair care. International business to grow by 11% (3% in 4QFY18 and 1% in 1QFY18).
We model 185bps expansion in EBITDA margin to 17.9%. EBITDA to grow by 25% YoY (11% in 4QFY18 and -9% in 1QFY18).
Commentary on recovery in trade channels and rural demand
Outlook on Indonesia and other geographies
Competitive intensity across categories
FMCG: 1QFY19E RESULTS PREVIEW

5
FMCG: Optically strong performance
COMPANY 1QFY19E
OUTLOOK WHAT’S LIKELY KEY MONITORABLES
Dabur GOOD
Consolidated revenue to grow by 13.5% (-8% in 1QFY18 and 11% in 4QFY18). We model domestic business growth at 13.4% and international at 14%. Hair care/oral care/health supplements/home care/food are expected to grow by 13.5/12.5/16/12/14%.
We expect international business to grow by 14% (11% in 4QFY18 and -15% in 1QFY18). Currency depreciation is now anniversarised and demand in most geographies are improving
EBITDA margin to expand by 101bps YoY to 18.3% (206 bps YoY in 4QFY18 and -61bps in 1QFY18). EBITDA to grow by 20.1% YoY
Commentary on rural growth and wholesale channels
Commentary on competition and Real juice performance (erratic summer)
New launches strategy
Britannia GOOD
We model 13.5% revenue growth with volume growth of 12% (10% in 4QFY18 and 3% in 1QFY18)
Input price softening and cost-control initiatives would result in expanding EBITDA margin by 158bps YoY to 16%. EBITDA to grow by 26% YoY
Change in competitiveness post GST, especially after a rise in taxes in the value segment
Commentary on new launches
Commentary on distribution expansion
Marico AVG
We model 17.5% domestic revenue growth, with volume growth of 9% (1% in 4QFY18 and -9% in 1QFY18).
Parachute and Saffola both enjoy a favorable base (-9% volume growth in 1QFY18 each) resulting in healthy pickup. Parachute is expected to report high double digit value growth owing to copra inflation (~25% price hike)
International business to grow by 10%, with healthy growth from Bangladesh. Currency impact to anniversarise, hence minimal forex impact
We model 277bps fall in gross margins and 180bps fall YoY in EBITDA margin owing to high copra inflation
Commentary on copra prices
Outlook on youth product category and strategy on new launches
Pricing strategy for the next few quarters
CSD channel improvement
Improvement in international business
FMCG: 1QFY19E RESULTS PREVIEW

6
FMCG: Optically strong performance
COMPANY 1QFY19E
OUTLOOK WHAT’S LIKELY KEY MONITORABLES
Colgate AVG
We expect 10% revenue growth with 8% volume growth (4% in 4QFY18 and -5% in 1QFY19)
Gross margin would continue to expand, we model 184bps YoY expansion to 65.2%. We expect that ASP expense would continue to increase in support of new launches. We model 15% increase in ASP (15.3% of sales)
EBITDA margin to expand by 156bps YoY to 24%. EBITDA to grow by 17.5% (5% in 1QFY18 and 26% in 4QFY18)
Toothpaste volume growth and market share change
New product launches
ASP spends, especially with increased competition from Dabur
Emami GOOD
We expect 17% consolidated revenue growth, with 18/10% domestic/international growth (-16/-19% in 1QFY18). We model 16.5% domestic volume growth (-18% in 1QFY18)
We expect gross margin to decline by 63bps YoY to ~67%. We model higher ASP spend (20% YoY) to factor the company’s strategy to focus on volume growth. EBITDA margin to expand by 396bps to 16.5% (-1,043 bps in 1QFY18 owing to GST destocking). EBITDA to grow by 54% YoY.
Kesh King growth outlook
Price hike strategy
Commentary on new launches
Outlook on Mentha oil
Distribution strategy
Commentary on international business
Jubilant FoodWorks
GOOD
We model 20% revenue growth, driven by 18% SSG (6.5% in 1QFY18 and 26.5% in 4QFY18). ‘Everyday value offers’ (Rs 199 and Rs 99), FIFA world cup, upgrade in pizza quality and closure of loss making stores have been supporting the acceleration in SSG since last 4 quarters. We model 14 Dominos stores addition in 1QFY19
We model gross margin to contract by 136bps YoY and 70bps QoQ to 75%. EBITDA margin can expand to 15.5% vs. 11.7% in 1QFY18 and 16.4% in 4QFY18. EBITDA to grow by 59% YoY.
Commentary on product launches
Outlook on store addition in FY19-20
Competitive intensity, pricing strategy
Outlook on SSG
FMCG: 1QFY19E RESULTS PREVIEW

7
Appliances: Favourable base supporting weak summer
COMPANY 1QFY19E
OUTLOOK WHAT’S LIKELY KEY MONITORABLES
Havells India GOOD
We expect Havells (ex-Lloyd ) to register ~18% revenue growth (8.6% in 1QFY18 and 18% in 4QFY18). Cables, Fan and Switchgears to benefit from GST rate revision (Nov’17). We model 2% comparable (Lloyd was acquired during mid 1QFY18) revenue growth for Lloyd (flat in 4QFY18). Consolidated revenue growth at 37%.
We model 16/10/21/30% for Switch Gears/Cables/Lighting/Consumer durables
We model EBITDA margin (ex-Lloyd) to expand by 297bps YoY ( -365bps in 1QFY18 and +119bps in 4QFY18) to 13%, while for Lloyd, we expect margin of 7.8%
Outlook on housing activities
GST rate revision impact on Cables and Fan
Updates on Lloyd’s Consumer business
Voltas
WEAK
We expect consolidated net revenue growth of 2% YoY. UCP segment to register3% contraction (1% in 1QFY18 and 8% in 4QFY18) on account of weak summer. EMPS segment to grow by 8% (14% in 1QFY18 and 5% in 4QFY18)
We model UCP EBIT margin contraction of 75bps YoY to 13.3% due to stiff competition. EMPS EBIT to expand by 75bps to 6.1%
EBITDA margin to expand by 84bps to 11.8% during the quarter
RAC channel inventory
Competitiveness in RAC market
Outlook on EMPS revenue and margin
Crompton Consumer
AVG
We expect 14% revenue growth, driven by 15% growth from Lighting (10% in 1QFY18 and 21% in 4QFY18) and 14% growth from ECD segment (-8.6% in 1QFY18 and 10% in 4QFY18).
We model 190bps EBITDA margin expansion to 14.2% driven by continued operational excellence and premiumisation in fans
Growth in premium fans
Distribution expansion
Performance of new launches
APPLIANCES: 1QFY19E RESULTS PREVIEW

8
Appliances: Favourable base supporting weak summer
COMPANY 1QFY19E
OUTLOOK WHAT’S LIKELY KEY MONITORABLES
Symphony WEAK
We expect net revenue to contract by 3% (-14.7% in 1QFY18 and -14% in 4QFY18) driven by impact of erratic summer in the domestic business. We model 5% revenue contraction in the domestic business
We model gross margin expansion of 382bps (1QFY18 was down by 677bps due to introductory launch of Touch series) to 55%. EBITDA margin is expected to expand by 418bps (1QFY18 was down 1,068bps) to 19.2%.
Performance of new product launches
Inventory levels in trade channels
GST impact on unorganised players
Outlook on exports and International
V-Guard Industries
GOOD
We model 16% YoY revenue growth (1% in 1QFY18 and 13% in 4QFY18) for the quarter. We expect healthy growth across the products except summer driven
We expect 8/24/15/15/26/35% growth for Stabilisers/UPS/Pumps/Cables/Water Heaters/Fans
We model 173bps expansion in gross margin (-109bps in 1QFY18 and 174bps in 4QFY18) to 29%. V-Guard is spending on the brand rejuvenation exercise (one-time) and we model 62% YoY jump in ASP expense during the quarter. We expect 124bps increase in EBITDA margin to 7.1% (-574bps in 1QFY18 and -356bps in 4QFY18)
GST rate revision impact on Cables and Fan
Non-south performance
Performance of new launches
Outlook on input cost inflation
TTK Prestige GOOD
We expect net revenue growth of 16.8% (3% in 1QFY18 and 22% in 4QFY18), led by 15/22/16/25% growth in Cookers/Cookware/Appliances/Others respectively
We model EBITDA margin expansion of 84bps YoY (-1bps in 1QFY18 and 131bps in 4QFY18) to 13.3%
Performance of new product launches
Commentary on recovery in trade channels
Witnessing any green shoots in rural demand
APPLIANCES: 1QFY19E RESULTS PREVIEW
9
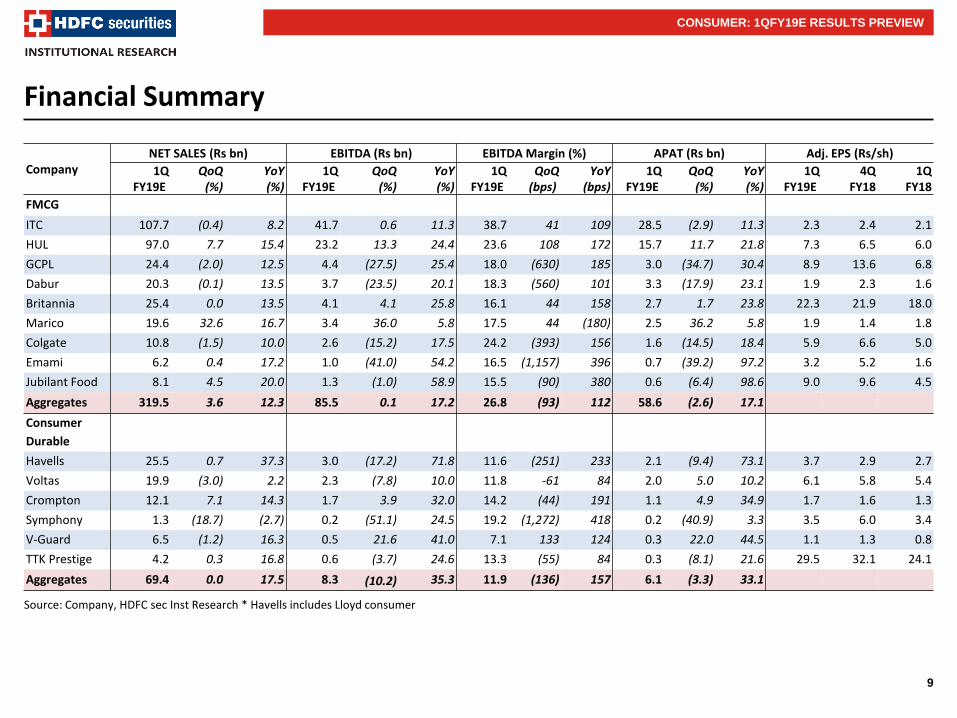
Financial Summary
Source: Company, HDFC sec Inst Research * Havells includes Lloyd consumer
CONSUMER: 1QFY19E RESULTS PREVIEW
Company NET SALES (Rs bn) EBITDA (Rs bn) EBITDA Margin (%) APAT (Rs bn) Adj. EPS (Rs/sh)
1Q FY19E
QoQ (%)
YoY (%)
1Q FY19E
QoQ (%)
YoY (%)
1Q FY19E
QoQ (bps)
YoY (bps)
1Q FY19E
QoQ (%)
YoY (%)
1Q FY19E
4Q FY18
1Q FY18
FMCG
ITC 107.7 (0.4) 8.2 41.7 0.6 11.3 38.7 41 109 28.5 (2.9) 11.3 2.3 2.4 2.1
HUL 97.0 7.7 15.4 23.2 13.3 24.4 23.6 108 172 15.7 11.7 21.8 7.3 6.5 6.0
GCPL 24.4 (2.0) 12.5 4.4 (27.5) 25.4 18.0 (630) 185 3.0 (34.7) 30.4 8.9 13.6 6.8
Dabur 20.3 (0.1) 13.5 3.7 (23.5) 20.1 18.3 (560) 101 3.3 (17.9) 23.1 1.9 2.3 1.6
Britannia 25.4 0.0 13.5 4.1 4.1 25.8 16.1 44 158 2.7 1.7 23.8 22.3 21.9 18.0
Marico 19.6 32.6 16.7 3.4 36.0 5.8 17.5 44 (180) 2.5 36.2 5.8 1.9 1.4 1.8
Colgate 10.8 (1.5) 10.0 2.6 (15.2) 17.5 24.2 (393) 156 1.6 (14.5) 18.4 5.9 6.6 5.0
Emami 6.2 0.4 17.2 1.0 (41.0) 54.2 16.5 (1,157) 396 0.7 (39.2) 97.2 3.2 5.2 1.6
Jubilant Food 8.1 4.5 20.0 1.3 (1.0) 58.9 15.5 (90) 380 0.6 (6.4) 98.6 9.0 9.6 4.5
Aggregates 319.5 3.6 12.3 85.5 0.1 17.2 26.8 (93) 112 58.6 (2.6) 17.1
Consumer
Durable
Havells 25.5 0.7 37.3 3.0 (17.2) 71.8 11.6 (251) 233 2.1 (9.4) 73.1 3.7 2.9 2.7
Voltas 19.9 (3.0) 2.2 2.3 (7.8) 10.0 11.8 -61 84 2.0 5.0 10.2 6.1 5.8 5.4
Crompton 12.1 7.1 14.3 1.7 3.9 32.0 14.2 (44) 191 1.1 4.9 34.9 1.7 1.6 1.3
Symphony 1.3 (18.7) (2.7) 0.2 (51.1) 24.5 19.2 (1,272) 418 0.2 (40.9) 3.3 3.5 6.0 3.4
V-Guard 6.5 (1.2) 16.3 0.5 21.6 41.0 7.1 133 124 0.3 22.0 44.5 1.1 1.3 0.8
TTK Prestige 4.2 0.3 16.8 0.6 (3.7) 24.6 13.3 (55) 84 0.3 (8.1) 21.6 29.5 32.1 24.1
Aggregates 69.4 0.0 17.5 8.3 (10.2) 35.3 11.9 (136) 157 6.1 (3.3) 33.1

10
Peer Set Comparison
Source: Company, HDFC sec Inst Research NR: Not Rated TP is fair value for GCPL and TTK Prestige since we don’t have active coverage
CONSUMER: 1QFY19E RESULTS PREVIEW
Company MCap
(Rs bn) CMP (Rs)
Reco. TP
(Rs)
EPS (Rs) P/E (x) EV/EBITDA (x) Core RoCE (%)
FY19E FY20E FY21E FY19E FY20E FY21E FY19E FY20E FY21E FY19E FY20E FY21E
HUL 3,632 1,678 NEU 1,709 29.4 35.6 42.7 57.2 47.2 39.3 39.7 33.1 28.1 78.4 81.0 80.7
ITC 3,304 272 BUY 367 10.2 11.2 12.3 26.8 24.3 22.1 16.8 14.9 13.4 38.2 40.3 42.7
GCPL 850 1,248 NR 1,143 26.8 30.8 36.7 46.5 40.5 34.0 35.3 30.2 25.4 20.4 22.9 26.9
Britannia 756 6,300 NEU 6,307 103.2 132.4 158.6 61.1 47.6 39.7 40.9 32.4 27.1 45.7 52.4 56.0
Dabur 669 380 BUY 423 9.4 11.3 13.7 40.5 33.5 27.7 33.4 28.1 24.0 56.8 67.5 77.3
Marico 439 340 BUY 388 8.3 10.7 12.4 41.1 31.9 27.5 30.4 23.8 20.8 50.5 70.4 83.1
Colgate 322 1,183 NEU 1,219 29.7 34.8 39.8 39.8 34.0 25.5 24.3 20.8 15.1 69.7 83.9 100.8
Emami 240 520 BUY 627 14.0 16.6 19.9 37.1 31.3 26.1 27.2 23.1 19.3 27.6 34.0 43.4
Jub. Food 180 1,366 BUY 1,510 25.9 30.7 38.2 52.8 44.5 35.8 27.9 23.9 19.7 56.5 69.3 86.5
Havells 341 545 BUY 680 14.9 18.0 21.5 36.5 30.2 25.4 24.8 20.9 17.7 35.3 40.7 48.1
Voltas 171 516 BUY 638 19.2 22.1 25.1 26.9 23.4 20.5 19.4 16.9 16.9 60.2 60.4 60.4
Crompton 147 228 BUY 286 6.4 7.8 9.3 35.6 29.3 24.5 22.1 18.4 15.2 50.2 58.3 67.3
Symphony 99 1,411 BUY 2,031 34.2 43.3 50.7 41.3 32.6 27.8 31.0 24.3 20.6 66.8 58.5 62.4
V-Guard 83 195 BUY 240 4.7 6.5 8.0 41.4 30.1 24.4 29.8 22.4 18.7 27.2 33.5 37.6
TTK Prestige 67 5,824 NR 8,176 162.4 196.3 237.1 35.9 29.7 24.6 21.5 17.8 14.7 16.6 18.2 20.0

11
Aviation 1QFY19E: Higher fuel costs to dent earnings
COMPANY 1QFY19E
OUTLOOK WHAT’S LIKELY KEY MONITORABLES
Interglobe MUTED
ASKM growth of 17% and PLF of 90.5% to boost revenue; Yield to decline 4% YoY as a result of competition in the current window
Hardening ATF prices expected to drag operating efficiency Expect EBITDAR margin to be at 20.4%, -1,350 bps YoY PAT to decline 74.4% YoY
Guidance on yields and pricing power Forex impact Capex guidance for new aircraft addition plans Update on A320 neo additions
SpiceJet MUTED
ASKM growth of 15% Load Factor expected to be strong at 94.5% Yield to be flat YoY at 3.96 Expect EBITDAR margin to be 19.3%, (-540 bps YoY) PAT to decline 78% Y-o-Y, owing to higher fuel costs
Trend in yield and ancillary revenue Forex impact Update on New aircraft additions timeline
AVIATION: 1QFY19E RESULTS PREVIEW
The Aviation sector is expected to deliver a disappointing quarter despite RPKM growth for our coverage companies of 17% with profits declining ~75% Y-o-Y as a result of higher fuel prices and a weaker rupee.

12
Financial Summary
Company NET SALES (Rs bn) EBITDAR (Rs bn) EBITDAR Margin (%) APAT (Rs bn) Adj. EPS (Rs/sh)
1Q FY19E
QoQ (%)
YoY (%)
1Q FY19E
QoQ (%)
YoY (%)
1Q FY19E
QoQ (bps)
YoY (bps)
1Q FY19E
QoQ (%)
YoY (%)
1Q FY19E
QoQ (%)
YoY (%)
Interglobe 65.9 14.3 14.5 13.5 19.9 -31 20.4 90 -1,350 2.1 76.3 -74.4 5.4 76.3 -75.9
SpiceJet 22.1 9.7 19.1 4.3 16.3 -6.9 19.2 110 -540 0.4 -16.4 -78.0 0.5 -16.4 -83.3
Aggregate 88.0 13.1 15.6 17.8 19.0 -26.4 20.2 100 -1150 2.5 50.2 -75.1
Source: Companies, HDFC sec Inst Research
AVIATION: 1QFY19E RESULTS PREVIEW
Valuation Summary
*Note – estimate based on IND AS Source: Company, HDFC sec Inst Research
MCap
(Rs bn) CMP (Rs)
Rating TP
(Rs)
EPS (Rs) P/E (x) EV/EBITDAR (x) ROAE (%)
FY18 FY19E FY20E FY18 FY19E FY20E FY18 FY19E FY20E FY18 FY19E FY20E
Interglobe 386.3 1,072 NEU 1,120 58.3 51.3 77.6 18.4 20.9 13.8 8.6 7.5 5.6 41.3 24.8 29.5
Spicejet 171.2 109 NEU 118 7.1 4.1 9.8 15.4 26.9 11.2 9.6 8.3 5.8 N.A. 76.8 80.1

13
Alco-Bev 1QFY19E: Modest performance
COMPANY 1QFY19E
OUTLOOK WHAT’S LIKELY KEY MONITORABLES
UNITED SPIRITS STRONG
Led by low base effect of 1QFY18 owing to highway ban, we expect the underlying volume to grow by 9.5% YoY and revenue to grow by 16% led by mix change and price increases. UNSP received price increases in Maharashtra (LBT withdrawal), Telangana, AP etc in FY18
We model 460 bps YoY expansion in EBITDA margin aided by (a) 270 bps expansion in GM due to lower input costs, partly due to franchising of lower margin Popular segment in several states and mix change and (b) modest increase in other operating costs
Outlook on recovery in volumes especially in states of UP and West Bengal owing to route to market changes
Update on premiumisation
Regulatory environment especially excise hikes in various states for FY19 and importantly in Maharashtra
ALCO-BEV: 1QFY19E RESULTS PREVIEW
Financial Summary
Source : Company, HDFC sec Inst Research
Source : Company, HDFC sec Inst Research
Valuation Summary
COMPANY NET SALES (Rs bn) EBITDA (Rs bn) EBITDA Margin (%) APAT (Rs bn) Adj. EPS (Rs/sh)
1Q FY19E
QoQ (%)
YoY (%)
1Q FY19E
QoQ (%)
YoY (%)
1Q FY19E
QoQ (bps)
YoY (bps)
1Q FY19E
QoQ (%)
YoY (%)
1Q FY19E
4Q FY18
1Q FY18
United Spirits 20.66 (4.9) 16.0 2.78 1.5 76.7 13.46 85 462 1.46 (16.1) 129.5 2.02 2.40 0.88
COMPANY Mcap
(Rs bn)
CMP (Rs)
RECO TP
(Rs)
EPS (Rs/sh) P/E (x) EV/EBITDA (x) RoIC (%)
FY18 FY19E FY20E FY21E FY18 FY19E FY20E FY21E FY18 FY19E FY20E FY21E FY18 FY19E FY20E FY21E
United Spirits 462 636 SELL 570 9.6 10.3 13.4 16.9 66.3 61.9 47.5 37.6 40.8 32.9 27.7 22.9 10.8 15.3 17.1 20.0

14
Jewellery 1QFY19E: Soft quarter Our Jewellery coverage universe is expected to register 4/6% YoY
revenue/EBITDA growth during 1QFY19 vs 45/30% YoY in 1QFY18. The jewellery industry has been going through a significant soft patch in the first 5 months of CY 2018 as evidenced in the decline of imports of gold by 39% in volume terms. This is primarily led by decline in demand for bullion and to some extent by weak demand for adornment during the period. Further, this quarter also has a very high base for comparison which had a favorable impact of GST-led preponement of purchases. We expect demand to normalise as rural consumption picks up led by govt’s thrust on agricultural and rural incomes.
Jewellery: Expect 4% Sales And 6% EBITDA Growth
JEWELLERY: 1QFY19E RESULTS PREVIEW
Source: Company, HDFC sec Inst Research
-
2.0
4.0
6.0
Tita
n
Than
gam
ayil
Sales Gr. (%) EBITDA Gr. (%)

15
COMPANY 1QFY19E
OUTLOOK WHAT’S LIKELY KEY MONITORABLES
TITAN AVG
We expect muted growth of 0.5% YoY in Jewellery revenues due to 1. weak demand in adornment during the period and 2. high base for comparison which had a favorable impact of GST-led preponement of purchases. We also expect flat gold grammage growth YoY (55% in 1QFY18 and 3% in 4QFY18). Non-jewellery business is expected to grow by ~7% with Watches/Eyewear/Other business to register 8/5/10% growth, respectively.
We expect Jewellery EBIT growth of 4.2% YoY (58.6% in 1QFY18 and 60.5% in 4QFY18).
Overall EBITDA margin to expand by 22bps to 9.4% during the quarter.
Grammage growth and market share change
Outlook on jewellery demand
Outlook on Watches and Eyewear businesses
Non-jewellery business EBIT margin
THANGAMAYIL AVG
We expect revenue growth of 4.4% (51.3% in 1QFY18 and -2.5% in 4QFY18). We model gold volume growth of 5% (49% in 1QFY18 and 17% in 4QFY18).
EBITDA margin expected to be higher by 7 bps YoY to 4.7% led by operating leverage
PAT to improve 1.6% YoY owing to higher revenue partly offset by higher interest expense.
Grammage growth and demand outlook
Commentary on store renovation and expansion
EBIT margin
JEWELLERY: 1QFY19E RESULTS PREVIEW
Jewellery 1QFY19E: Muted growth dented by weak demand

16
Financial Summary
Source: Company, HDFC sec Inst Research
JEWELLERY: 1QFY19E RESULTS PREVIEW
Company NET SALES (Rs bn) EBITDA (Rs bn) EBITDA Margin (%) APAT (Rs bn) Adj. EPS (Rs/sh)
1Q FY19E
QoQ (%)
YoY (%)
1Q FY19E
QoQ (%)
YoY (%)
1Q FY19E
QoQ (bps)
YoY (bps)
1Q FY19E
QoQ (%)
YoY (%)
1Q FY19E
4Q FY18
1Q FY18
Titan 41.2 0.2 3.3 3.9 -11.3 5.8 9.4 -122 22 2.6 -16.0 4.9 2.9 3.5 2.8
Thangamayil 4.5 27.1 4.4 0.2 45.6 6.0 4.7 60 7 0.1 96.0 1.6 7.1 3.6 7.0
Aggregate 45.7 2.4 3.4 4.1 -9.5 5.8 8.9 -11.7 21.0 2.7 -14.2 4.8
Valuation Summary
Source: Company, HDFC sec Inst Research
Company MCap
(Rs bn) CMP (Rs)
Reco. TP
(Rs)
EPS (Rs) P/E (x) EV/EBITDA (x) Core RoCE (%)*
FY18 FY19E FY20E FY18 FY19E FY20E FY18 FY19E FY20E FY18 FY19E FY20E Titan 738 831 NEU 820 15.9 19.4 23.2 52.2 42.8 35.8 35.7 29.1 24.0 19.3 19.7 19.8
Thangamayil 6 430 BUY 650 21.0 29.6 37.1 20.5 14.5 11.6 10.9 9.3 8.2 9.4 11.9 12.4

17
Lubricants: New capacity to drive growth
COMPANY 1QFY19E
OUTLOOK WHAT’S LIKELY KEY MONITORABLES
Gulf Oil GOOD
Expect revenue growth of 30.6% YoY, driven by 26.6% YoY volume growth and 3.2% YoY realization growth
EBITDA margin expected to be higher by 101bps on YoY to 16.6%, led by higher gross margins and higher B2C contribution
APAT to grow strongly by 17.7% YoY, owing to higher operating profit
Volume growth
Realization and product mix trend
Capacity utilization of new capacity
LUBRICANTS : 1QFY19E RESULTS PREVIEW
Financial Summary
Source: Company, HDFC sec Inst Research
Company
NET SALES (Rs bn) EBITDA (Rs bn) EBITDA Margin (%) APAT (Rs bn) Adj. EPS (Rs/sh)
1Q FY19E
QoQ (%)
YoY (%)
1Q FY19E
QoQ (%)
YoY (%)
1Q FY19E
QoQ (bps)
YoY (bps)
1Q FY19E
QoQ (%)
YoY (%)
1Q FY19E
4Q FY18
1Q FY18
Gulf Oil 3.7 (2.0) 30.6 0.6 (3.5) 23.1 16.6 (24.5) (101.4) 0.40 -2.4 17.7 8.1 8.3 6.9
Valuation Summary
Company MCap
(Rs bn) CMP (Rs) Reco.
TP (Rs)
EPS (Rs) P/E (x) EV/EBITDA (x) Core RoCE (%)
FY18 FY19E FY20E FY18 FY19E FY20E FY18 FY19E FY20E FY18 FY19E FY20E
Gulf Oil 42.4 861 BUY 1,028 31.9 36.3 41.1 27.0 23.8 21.0 17.8 15.1 13.1 47.0 45.2 52.6
Source: Company, HDFC sec Inst Research

18
CONSUMER: 1QFY19E RESULTS PREVIEW
Rating Definitions
BUY : Where the stock is expected to deliver more than 10% returns over the next 12 month period
NEUTRAL : Where the stock is expected to deliver (-) 10% to 10% returns over the next 12 month period
SELL : Where the stock is expected to deliver less than (-) 10% returns over the next 12 month period
Disclosure: Authors and the names subscribed to this report, hereby certify that all of the views expressed in this research report accurately reflect our views about the subject issuer(s) or securities. HSL has no material adverse disciplinary history as on the date of publication of this report. We also certify that no part of our compensation was, is, or will be directly or indirectly related to the specific recommendation(s) or view(s) in this report. Research Analyst or his/her relative or HDFC Securities Ltd. does not have any financial interest in the subject company. Also Research Analyst or his relative or HDFC Securities Ltd. or its Associate may have beneficial ownership of 1% or more in the subject company at the end of the month immediately preceding the date of publication of the Research Report. Further Research Analyst or his relative or HDFC Securities Ltd. or its associate does not have any material conflict of interest. Any holding in stock –No HDFC Securities Limited (HSL) is a SEBI Registered Research Analyst having registration no. INH000002475. Disclaimer: This report has been prepared by HDFC Securities Ltd and is meant for sole use by the recipient and not for circulation. The information and opinions contained herein have been compiled or arrived at, based upon information obtained in good faith from sources believed to be reliable. Such information has not been independently verified and no guaranty, representation of warranty, express or implied, is made as to its accuracy, completeness or correctness. All such information and opinions are subject to change without notice. This document is for information purposes only. Descriptions of any company or companies or their securities mentioned herein are not intended to be complete and this document is not, and should not be construed as an offer or solicitation of an offer, to buy or sell any securities or other financial instruments. This report is not directed to, or intended for display, downloading, printing, reproducing or for distribution to or use by, any person or entity who is a citizen or resident or located in any locality, state, country or other jurisdiction where such distribution, publication, reproduction, availability or use would be contrary to law or regulation or what would subject HSL or its affiliates to any registration or licensing requirement within such jurisdiction. If this report is inadvertently send or has reached any individual in such country, especially, USA, the same may be ignored and brought to the attention of the sender. This document may not be reproduced, distributed or published for any purposes without prior written approval of HSL. Foreign currencies denominated securities, wherever mentioned, are subject to exchange rate fluctuations, which could have an adverse effect on their value or price, or the income derived from them. In addition, investors in securities such as ADRs, the values of which are influenced by foreign currencies effectively assume currency risk. It should not be considered to be taken as an offer to sell or a solicitation to buy any security. HSL may from time to time solicit from, or perform broking, or other services for, any company mentioned in this mail and/or its attachments. HSL and its affiliated company(ies), their directors and employees may; (a) from time to time, have a long or short position in, and buy or sell the securities of the company(ies) mentioned herein or (b) be engaged in any other transaction involving such securities and earn brokerage or other compensation or act as a market maker in the financial instruments of the company(ies) discussed herein or act as an advisor or lender/borrower to such company(ies) or may have any other potential conflict of interests with respect to any recommendation and other related information and opinions. HSL, its directors, analysts or employees do not take any responsibility, financial or otherwise, of the losses or the damages sustained due to the investments made or any action taken on basis of this report, including but not restricted to, fluctuation in the prices of shares and bonds, changes in the currency rates, diminution in the NAVs, reduction in the dividend or income, etc. HSL and other group companies, its directors, associates, employees may have various positions in any of the stocks, securities and financial instruments dealt in the report, or may make sell or purchase or other deals in these securities from time to time or may deal in other securities of the companies / organizations described in this report. HSL or its associates might have managed or co-managed public offering of securities for the subject company or might have been mandated by the subject company for any other assignment in the past twelve months. HSL or its associates might have received any compensation from the companies mentioned in the report during the period preceding twelve months from t date of this report for services in respect of managing or co-managing public offerings, corporate finance, investment banking or merchant banking, brokerage services or other advisory service in a merger or specific transaction in the normal course of business. HSL or its analysts did not receive any compensation or other benefits from the companies mentioned in the report or third party in connection with preparation of the research report. Accordingly, neither HSL nor Research Analysts have any material conflict of interest at the time of publication of this report. Compensation of our Research Analysts is not based on any specific merchant banking, investment banking or brokerage service transactions. HSL may have issued other reports that are inconsistent with and reach different conclusion from the information presented in this report. Research entity has not been engaged in market making activity for the subject company. Research analyst has not served as an officer, director or employee of the subject company. We have not received any compensation/benefits from the subject company or third party in connection with the Research Report. HDFC securities Limited, I Think Techno Campus, Building - B, "Alpha", Office Floor 8, Near Kanjurmarg Station, Opp. Crompton Greaves, Kanjurmarg (East), Mumbai 400 042 Phone: (022) 3075 3400 Fax: (022) 2496 5066 Compliance Officer: Binkle R. Oza Email: [email protected] Phone: (022) 3045 3600 HDFC Securities Limited, SEBI Reg. No.: NSE-INB/F/E 231109431, BSE-INB/F 011109437, AMFI Reg. No. ARN: 13549, PFRDA Reg. No. POP: 04102015, IRDA Corporate Agent License No.: HDF 2806925/HDF C000222657, SEBI Research Analyst Reg. No.: INH000002475, CIN - U67120MH2000PLC152193 Mutual Funds Investments are subject to market risk. Please read the offer and scheme related documents carefully before investing.

19
HDFC securities Institutional Equities Unit No. 1602, 16th Floor, Tower A, Peninsula Business Park, Senapati Bapat Marg, Lower Parel, Mumbai - 400 013 Board : +91-22-6171 7330 www.hdfcsec.com
CONSUMER: 1QFY19E RESULTS PREVIEW