Embed Size (px)
Citation preview

i
LBNL-55701
Natural Gas Prices Forecast Comparison - AEO vs. Natural Gas Markets
Gabrielle Wong-Parodi, Alex Lekov, and Larry Dale
Energy Analysis DepartmentEnvironmental Energy Technologies Division
Ernest Orlando Lawrence Berkeley National LaboratoryUniversity of California
Berkeley, CA 94720
February 2005
This work was supported by the Office of Building Technologies and Community Systems of theU.S. Department of Energy, under Contract No. DE-AC03-76SF00098.

ii

iii
Acknowledgments
The work described in this report was funded by the Assistant Secretary of Energy Efficiencyand Renewable Energy, Officeof Building Technologies and Community Systems of the U.S.Department of Energy, under Contract No. DE-AC03-76SF00098. The authors would especiallylike to thank Doug Hale of the Energy Information Administration for supporting and reviewingthis report.
Disclaimer
This document was prepared as an account of work sponsored by the United States Government.While this document is believed to contain correct information, neither the United StatesGovernment nor any agency thereof, nor The Regents of the University of California, nor any oftheir employees, makes any warranty, express or implied, or assumes any legal responsibility for theaccuracy, completeness, or usefulness of any information, apparatus, product, or process disclosed,or represents that its use would not infringe privately owned rights. Reference herein to any specificcommercial product, process, or service by its trade name, trademark, manufacturer, or otherwise,does not necessarily constitute or imply its endorsement, recommendation, or favoring by the UnitedStates Government or any agency thereof, or The Regents of the University of California. The viewsand opinions of authors expressed herein do not necessarily state or reflect those of the United StatesGovernment or any agency thereof or The Regents of the University of California.

iv
v
Table of Contents
Acknowledgments . . . . . . . . . . . . . . . . . . . . . . . . . . . . . . . . . . . . . . . . . . . . . . . . . . . . . . . . . . . . ii
Table of Contents . . . . . . . . . . . . . . . . . . . . . . . . . . . . . . . . . . . . . . . . . . . . . . . . . . . . . . . . . . . . . iii
Abstract . . . . . . . . . . . . . . . . . . . . . . . . . . . . . . . . . . . . . . . . . . . . . . . . . . . . . . . . . . . . . . . . . . . . iv
1. Introduction . . . . . . . . . . . . . . . . . . . . . . . . . . . . . . . . . . . . . . . . . . . . . . . . . . . . . . . . . . . . . . . . 11.1 History of Natural Gas Regulation . . . . . . . . . . . . . . . . . . . . . . . . . . . . . . . . . . . . . . . 2
2. Annual Energy Outlook (AEO) . . . . . . . . . . . . . . . . . . . . . . . . . . . . . . . . . . . . . . . . . . . . . . . . 42.1 Description of AEO . . . . . . . . . . . . . . . . . . . . . . . . . . . . . . . . . . . . . . . . . . . . . . . . . . 42.2 Description of National Energy Modeling System (NEMS) . . . . . . . . . . . . . . . . . . . 4
2.2.1 Structure of NEMS . . . . . . . . . . . . . . . . . . . . . . . . . . . . . . . . . . . . . . . . . . . 5
3. Henry Hub3.1 The Marketplace: Henry Hub STIFS . . . . . . . . . . . . . . . . . . . . . . . . . . . . . . . . . . . . . 6
3.1.1 Types of Trading . . . . . . . . . . . . . . . . . . . . . . . . . . . . . . . . . . . . . . . . . . . . . . 6
4. Analysis of AEO and Henry Hub Compared to U.S. Wellhead . . . . . . . . . . . . . . . . . . . . . . . . 84.1 U.S. Wellhead and AEO Natural Gas Prices . . . . . . . . . . . . . . . . . . . . . . . . . . . . . . . 84.2 U.S. Wellhead and Henry Hub Natural Gas Prices . . . . . . . . . . . . . . . . . . . . . . . . . . 94.3 U.S. Wellhead versus AEO and Henry Hub Natural Gas Prices . . . . . . . . . . . . . . . 114.4 Conclusions . . . . . . . . . . . . . . . . . . . . . . . . . . . . . . . . . . . . . . . . . . . . . . . . . . . . . . . . 15

vi

vii
Abstract
This paper evaluates the accuracy of two methods to forecast natural gas prices: using theEnergy Information Administration’s Annual Energy Outlook forecasted price (AEO) and theHenry Hub compared to U.S. Wellhead futures price. A statistical analysis is performed todetermine the relative accuracy of the two measures in the recent past. A statistical analysissuggests that the Henry Hub futures price provides a more accurate average forecast of naturalgas prices than the AEO. For example, the Henry Hub futures price underestimated the naturalgas price by 35 cents per thousand cubic feet (11.5 percent) between 1996 and 2003 and theAEO underestimated by 71 cents per thousand cubic feet (23.4 percent). Upon closer inspection,a liner regression analysis reveals that two distinct time periods exist, the period between 1996 to1999 and the period between 2000 to 2003. For the time period between 1996 to 1999, AEOshowed a weak negative correlation (R-square = 0.19) between forecast price by actual U.S.Wellhead natural gas price versus the Henry Hub with a weak positive correlation (R-square =0.20) between forecasted price and U.S. Wellhead natural gas price. During the time periodbetween 2000 to 2003, AEO shows a moderate positive correlation (R-square = 0.37) betweenforecasted natural gas price and U.S. Wellhead natural gas price versus the Henry Hub that showa moderate positive correlation (R-square = 0.36) between forecast price and U.S. Wellheadnatural gas price. These results suggest that agencies forecasting natural gas prices shouldconsider incorporating the Henry Hub natural gas futures price into their forecasting modelsalong with the AEO forecast. Our analysis is very preliminary and is based on a very small dataset. Naturally the results of the analysis may change, as more data is made available.

viii

1Scott A. Nauman, Forces of Change in the Natural Gas Industry, Conference: GasMart 2004(May 11, 2004), ExxonMobil<http://www.gasmart.com/presentations/Nauman.pdf>
2National Petroleum Council (2003). Balancing Natural Gas Policy - Fueling the Demands of aGrowing Economy, Volume I Summary of Findings and Recommendations, Report of the NationalPetroleum Council, September 25, 2003.
3U.S. Department of Energy, Annual Energy Outlook 2004 with Projections to 2025, PostedJanuary 2004, 2004. Report No. DOE/EIA-0383(2003).<http://www.eia.doe.gov/oial\f/analysispaper/pdf/table13.pdf>
1
1. Introduction
In the United States natural gas consumption is on the rise, natural gas demand is expected togrow 2.4% per year until 2020, while oil demand is expected to grow 1.7% per year and coaldemand 1.5% per year.1 The 2003 National Petroleum Council Study reported “there exists afundamental shift in the supply/demand balance which has resulted in higher natural gas demandand volatility and they project that this trend is expected to continue.”2 The electricity crisis ofthe winter of 2000/2001 in California is a clear example of our precarious reliance on naturalgas. This price volatility affects all sector end-users from electric generation to residential.
In the residential sector, current natural gas consumption is approximately 7.23 trillion cubic feetper year and that demand is expected to grow to approximately 10.3 trillion cubic feet by 2025.3
Natural gas as a fuel for residential appliances, such as furnaces and boilers, continues to grow asalternative forms of energy become less and less attractive. Therefore when a Rulemaking, inthis case the Federal Residential Furnace and Boiler Rulemaking commissioned by theDepartment of Energy, assesses the impact of natural gas prices on life-cycle cost analysis; theaccuracy of the models that are set to predict natural gas prices is now of immediate importancein being able to provide the best information possible to inform manufacturers and policymakers.
Historically, the Annual Energy Outlook (AEO) has been used as the national benchmark forreporting futures natural gas prices. Recently, the accuracy of AEO’s natural gas prices for theFurnace and Boiler Rulemaking has come into question with stakeholders suggesting that othermodels might more accurately reflect the commodity market.
This paper first presents a picture of the history and development of the natural gas market in theUnited States, with a close examination of AEO and the Henry Hub. An evaluation of theaccuracy of two methods to forecast natural gas prices is performed: using the EnergyInformation Administrations’ Annual Energy Outlook forecasted price (AEO) and using theHenry Hub compared to U.S. Wellhead futures price. By performing this work, insight will begained on the accuracy of forecasting methods and on the behavior of future forecasts.

4NaturalGas.Org, Natural Gas Overview, (Last Accessed on July 13, 2004).<http://www.naturalgas.org/overview/background.asp>
2
1.1 History of Natural Gas Regulation
The natural gas market has had over 100 years of evolution in the United States. Understandingthe history of the natural gas market helps to explain how the role of regulation, and subsequentderegulation, shape today’s market. In the early days of regulation (mid-1800s), localmunicipalities decided one company with a single distribution network could deliver natural gasmore efficiently and cheaply than if two companies had separate distribution networks andmarkets. In order to prevent these natural monopolies from abusing their position, localgovernment decided that regulation was needed to ensure the quality of service and low price tocustomers. In the early 1900s, as local distribution networks grew in size, gas companies beganto spread outside of an enclosed municipality border and into others. At this point, intrastateregulations at the state level began to pop up, the first states to do so were New York andWisconsin.4
With improved technologies, companies began to develop the capability of developingpipeline distribution networks that crossed state borders. Out of growing concern, between 1911and 1928, several states attempted to exercise control over the growing power of gas companiesthat owned production, pipelines and distributions. However, these attempts proved futilebecause the U.S. Supreme Court upheld the “interstate commerce clause” of the U.S.Constitution. Still, something needed to be done to curb the growing power of gas companies. In 1935 Congress passed the Public Utility Holding Company Act to curb the power of theseutility companies to exercise unfair control of the natural gas market, however, this still did notregulate interstate gas sales. The Natural Gas Act (NGA) the federal government firstinvolvement with the regulation of interstate natural gas sales. NGA gave power to the FederalPower Commission (FPC) to oversee the regulation of natural gas sales by regulating the ratescharged for interstate natural gas delivery. Under the FPC, gas companies could not build a newpipeline to a region that was already being served by an existing pipeline and by 1942, a gascompany interested in building a new pipeline had to get approval. Although natural gas rates oftransit were being regulated, the price of natural gas was not being regulated at it’s source, thewellhead.
The FPC originally decided to leave the wellhead price unregulated because natural gasproducers and pipelines were distinct entities and the FPC operated on the belief that the marketwould keep prices low. However, the Supreme Court’s 1954 Phillips Petroleum Co. v.Wisconsin (347 U.S. 672 (1954)) ruling said that natural gas producers that sold to the interstatepipelines could be classified as natural gas companies and therefore were subject to regulation bythe FPC. While interstate pipelines were relatively simple to regulate, it was much moreburdensome to regulate natural gas producers because there were so many of them. In 1960, theFPC decided to set rates based by region and divided the country into 5 distinct geographicareas. This again proved to be burdensome on the FPC, it was much more difficult to determine

5Kate Calvin, The Energy Information Administrations’ Changing Energy Forecasts: A study ofthe Annual Energy Outlooks from 1983 to 2004, March 3, 2004, Stanford University, Palo Alto.
3
the correct geographic area than previously believed. Therefore, the FPC decided to set priceceilings on natural gas rates sold at the wellhead. This price ceiling had a few wide-rangingeffects. The first is that the rates were far below market value so there was little incentive fornatural gas producers to invest money in exploration and drilling for new wellheads. Second,although there was regulation of natural gas sold to interstate pipelines, there were no regulationon natural gas produced and sold to intra-state pipelines. Therefore, natural gas sold to the intra-state pipelines were relatively high, but natural gas was abundant in gas producing states whilenon-gas producing states experienced shortages.
This lead to the Natural Gas Policy Act (NGPA) in 1978 which essentially created asingle nation-wide natural gas market, equalizing supply with demand, and allowing marketforces to determine the price of natural gas at the wellhead. In 1982, the first AEO waspublished based on the Intermediate Future Forecasting System (IFFS), replacing the AnnualReport to Congress (published from 1977-1981) which satisfied a 1977 Department of EnergyOrganization Congress Act mandate which required energy forecasts to be provided and updatedannually. At the request of Congress and with the assistance of the National Academy in theearly 1990s, the Energy Information Administration (EIA) began developing the NationalEnergy Modeling System (NEMS), which improved upon the IFFS model “representation o felectricity and natural gas markets, demand-side management programs, development ofrenewable sources, and environmental policies.”5 This sets the stage for our current natural gassituation and price volatility.

6U.S. Department of Energy, Annual Energy Outlook 2004 with Projections to 2025, PostedJanuary 2004, 2004. Report No. DOE/EIA-0383(2003).<http://www.eia.doe.gov/oial\f/analysispaper/pdf/table13.pdf>
7Energy Information Administration, The National Energy Modeling System: An Overview 2003,2003. (Last Accessed July 12, 2003)
4
2. Annual Energy Outlook (AEO)
This section contains a description of AEO and of NEMS, the modeling system that providesdata for the AEO.
2.1 Description of AEO
The Annual Energy Outlook is an annual report produced by EIA of midterm forecasts of energysupply, demand, and prices. AEO’s projections are based on the NEMS. Projections are basedon Federal, State, and local laws on effect September 1st the year prior to publication, projectionsare not based on pending regulations, policies, and standards of the prior year. In order to dealwith potential shifts in regulations and the economy, the AEO focuses on primarily on areference case, which uses mid-range assumptions for economic growth and world oil prices, andfour other cases that assume higher and lower economic growth and higher and lower world oilprices. Assumptions for economic growth are based on growth in labor force and productivitywhile varying oil price levels are based on oil production in the Organization of PetroleumExporting Countries (OPEC). The AEO examines other cases that explore the impacts of avariety of other assumptions in NEMS, such as the impact of new and improved technologiesand are run as fully integrated cases or by running only a portion of the entire modeling system. Historical data, used for reference purposes are based on EIA’s Annual Energy Review. ForAEO 2004, projections for 2003 and 2004 were taken from EIA’s September 2003 Short-TermEnergy Outlook (STEO).6
2.2 Description of National Energy Modeling System (NEMS)
Basically, NEMS represents the interaction between energy markets and the U.S. Economy. According to the EIA, “the model achieves a supply/demand balance in the end-use demandregions, defined as the nine Census divisions, by solving for the prices of each energy productthat will balance the quantities consumers wish to consume.”4 NEMS contains details for thefollowing: residential demand, commercial demand, industrial demand, transportation demand,electricity, renewables, oil supply, natural gas supply, natural gas transmission and distribution,refining, and coal supply. The natural gas supply covers six categories: conventional lower-48onshore, lower-48 deep and shallow offshore, coalbed methane, gas shales, tight sands,Canadian, Mexican and liquefied natural gas, and Alaskan Gas which includes the followingregions: six lower 48 onshore regions, three lower 48 offshore regions, three Alaska regions andeight liquefied natural gas import regions. The natural gas transmission and distribution coversthree categories: core vs. noncore, peak vs. offpeak, and pipeline capacity expansion.7

<http://www.eia.doe.gov/oiaf/overview.html>
8Energy Information Administration, Price Responsiveness in the AEO2003 NEMS Residentialand Commercial Buildings Sector Model, Table 13. Natural Gas Wellhead Prices, Actual vs. Forecasts,2003. (Posted October 2003).
5
Figure 1. National Energy Modeling System
2.2.1 Structure of NEMS
NEMS contains four demand modules which consist of Residential, Commercial, Transportation,and Industrial; four supply modules which consist of Oil and Gas, Natural Gas Transmission andDistribution, Coal Market, and Renewable Fuels; two conversion modules which consist ofElectricity Market and Petroleum Market; Macroeconomic Activity Module, InternationalEnergy Module, and Integrating Module. The flexible modular structure of NEMS allows for avariety of different focuses and for the model to run using only a few specific modules at a time. Interactions between modules are controlled by the Integrating Module. The Integrating Modulehas five main functions, it manages the global data structure, executes all or any of the user self-selected options in an iterative convergence algorithm, checks for convergence and checks foranomalies, implements convergence relaxation between iterations to speed up convergence, andupdates values of important NEMS variables. NEMS uses data from the nine census regions:New England, Middle Atlantic, South Atlantic, East South Central, East North Central, WestSouth Central, West North Central, Mountain, and Pacific.5, 8

<http://www.eia.doe.gov/oiaf/analysispaper/>
9New York Mercantile Exchange, Henry Hub Natural Gas Futures (Last Accessed on August 8,2004) <http://www.nymex.com/jsp/markets/NG_spec.jsp>
6
3. Henry Hub
This section contains a description of the Henry Hub and briefly details market structure.
3.1 The Marketplace: Henry Hub
Two distinct markets exist for natural gas, the spot market and the futures market. The spotmarket is the daily market, natural gas is bought and sold within a one day time period; the priceof natural gas for a particular day can be determined by the spot market.3 The futures market iswhen natural gas is under contract for one month up to thirty-six months in advance. Natural gasfutures are traded in 10,000 million British thermal units (mmBtu) on the New York MercantileExchange (NYMEX) and are widely used as the national benchmark price. Natural gas is pricedand traded at different locations throughout the country called ‘market hubs’, one of the principlehubs is the Henry Hub. Henry Hub is owned and operated by Sabine Pipe Line LCC which isthe most active and publicized hub in the United States. The Henry Hub interconnects with 9interstate and 4 intrastate pipelines that provide access to markets in the Midwest, Northeast,Southeast and Gulf Coast. Since November 1989, futures contracts traded on NYMEX areHenry Hub contracts, which means the that the price at NYMEX for natural gas reflects naturalgas for physical delivery at this hub.9 The difference between Henry Hub natural gas price andanother hub is called the location differential. Another location where natural gas can incuradditional price factor are at the Citygate, locations where the pipeline meets the distributors,before the gas reaches the consumer.3
3.1.1 Types of Trading
There are two main types of trading, physical trading and financial trading. Physical tradinginvolves the buying and selling of the physical commodity, in this case natural gas. Financialtrading consists of derivatives where the buyer and seller never actually take physical delivery ofthe commodity. There are three principle types of physical trading: swing contracts, baseloadcontracts, and firm contracts. Swing contracts are short-term contract that can last as little as oneday or up to one month. These contracts are usually in effect when supply from the seller ordemand from the buyer is unreliable. Baseload contracts are much like swing contracts expectthat the buyers and sellers reach an understanding that they will not back out of the contractseven if there are price fluctuations. Firm contracts are when the buyer and seller can choose topursue legal recourse if one of the parties should pull out of the contract. These contracts areusually used when the supply and demand for natural gas are unlikely to change.3
Financial trading involves natural gas derivatives which derive their value from the underlyingprice of natural gas. Prices of natural gas are determined by supply and demand conditions. If

7
there are more buyers than sellers, the price will go up, and if there are more sellers than buyers,the price will go down. It has been estimated that the value of natural gas derivatives are ten totwelve times greater than value of physical natural gas trading. In fact, less than two percent ofall natural gas contracts that come into effect are ever settled through deliveries. There are twomain reasons to trade in financial gas markets: hedging and speculation, “the main differencebetween speculation and hedging is that the objective of hedging is to reduce risk, whereas theobjective of speculation is to take on the risk in hope of earning a financial return,” both hedgersand speculators use forecasts to determine the price of natural gas, the only difference betweenthe forecasts is the way that the are used.3

10Philip Budzick, U.S. Natural Gas Markets: Relationship Between Henry Hub Spot Prices andU.S. Wellhead Prices, 2004.<http://www.eia.doe.gov/oaif/analysispaper/henryhub/index.html>
11Energy Information Administration, Natural Gas Monthly June 2001: Appendix A, June, 2001,Energy Information Administration.<http://www.eia.doe.gov/pub/oil_gas/data_publications/natural_gas_monthly/historical/2001/2001_06/pdf/appendix_a.pdf>
8
4. Analysis of AEO and Henry Hub Compared to U.S. Wellhead
This section contains the results of a brief analysis comparing AEO’s natural gas price forecastto the U.S. Wellhead and the Henry Hub natural gas price forecast to the U.S. Wellhead. Thisanalysis will be useful information for future Rulemakings.
4.1 U.S. Wellhead and AEO Natural Gas Prices
AEO bases it’s forecast on U.S. Wellhead Prices, the price received by natural gas producers formarketed gas, as reported on Form EIA-895 by the States and Minerals Management Services(MMS).10 Form EIA-895 requests that State agencies report the quantity and value of marketedproduction, this replaces preliminary data which are estimated from the New York MercantileExchange (NYMEX) futures closing for natural gas delivery at the Henry Hub.11 U.S. Wellheadprices are reported in dollars per thousand cubic feet. The wellhead price includes the value ofnatural gas liquids and pertains to all transaction occurring in the United States (lower 48 States),thereby encompassing purchase commitments of all durations.9 For AEO 1996-2002, the data onwhich the natural gas price forecast was based reflects data available as of July of the previousyear. AEO 2003 reflects data available as of August 2002 while AEO 2004 reflects dataavailable as of September 2003.
Table 1. AEO Predicted Price from 1996-2003 for the years between 1994-2003
ForecastYear
Predictor YearAverage Actual1996 1997 1998 1999 2000 2001 2002 2003
1996 2.20 2.20 2.161997 2.35 1.98 2.16 2.321998 2.52 2.07 2.45 2.35 1.951999 2.66 2.18 2.54 2.45 2.46 2.192000 2.76 2.21 2.55 2.46 2.52 2.50 3.692001 2.88 2.32 2.64 2.60 2.56 3.64 2.77 4.012002 3.00 2.41 2.72 2.72 2.61 3.10 2.21 2.68 2.952003 3.12 2.53 2.81 2.85 2.38 2.86 2.72 3.57 2.85 4.98
Table 1 summarizes AEO 1996 to AEO 2003 forecasted natural gas prices from 1996 to 2003. As shown in this table, AEO reports forecasted data from the predictor year onward. Forexample, in 1996 AEO predicts for the current year and seven years ahead. We only show the

9
AEO Natural Gas Price Forecast vs. U.S. Natural Gas Wellhead Price ($/Mcf)
$0
$1
$2
$3
$4
$5
$6
1996 1997 1998 1999 2000 2001 2002 2003
Year
Pric
e
AEO 1996
AEO 1997
AEO 1998
AEO 1999
AEO 2000
AEO 2001
AEO 2002
AEO 2003
National Average
Figure 2. AEO Natural Gas Price Forecast vs. U.S. Natural Gas Wellhead Price($/Mcf).
forecast years for which Henry Hub has also predicted. The average forecast for each forecastedyear is shown, for the forecast year 1998 the average natural gas price is $2.35. The far rightcolumn shows the actual natural gas price from 1996 to 2003, which is defined as an nationalannual average.
This information is charted in Figure 2 (the dashed black line represents the actual price fornatural gas). For the period of 1996-1999, on average AEO’s forecast was relatively accurate. In 2000, the market experienced a period of significant fluctuations of natural gas prices; overall,AEO’s forecast was significantly lower, and continues to be, than the actual price. In thebeginning of 2003, AEO forecasted a natural gas price of $3.57 whereas the actual price for 2003is $4.98 (39% underestimation).
4.2 U.S. Wellhead and Henry Hub Natural Gas Prices
Henry Hub spot gas prices represents natural gas sales contracted for next day delivery and titletransfer. Natural Gas Weekly (NGW) is the standard for the report of Henry Hub spot gasprices, this price represents a volume-weighted average price of spot transactions. Henry Hubspot prices are reported in dollars per million Btu. The Henry Hub spot price pertains to

12Philip Budzick, U.S. Natural Gas Markets: Relationship Between Henry Hub SpotPrices and U.S. Wellhead Prices, 2004. <http://www.eia.doe.gov/oiaf/analysispaper/henryhub/index.html>
10
transactions for next day deliver occurring at the Henry Hub Processing Plant and it is measureddownstream of the wellhead, after the natural gas liquids have been removed and after atransportation cost has been incurred.12
Table 2. Futures Predicted Price from 1996-2003 for the years between 1996-2003Forecast
YearPredictor Year
Average Actual1996 1997 1998 1999 2000 2001 2002 20031996 2.59 2.59 2.161997 2.41 2.58 2.50 2.321998 2.33 2.54 2.11 2.33 1.951999 2.27 2.49 2.19 2.26 2.30 2.192000 2.20 2.40 2.26 2.34 3.89 2.62 3.692001 2.16 2.33 2.31 2.39 3.92 4.28 2.90 4.012002 2.13 2.28 2.34 2.39 3.92 4.31 3.21 2.94 2.952003 2.11 2.26 2.36 2.40 3.87 4.29 3.23 5.37 3.24 4.98
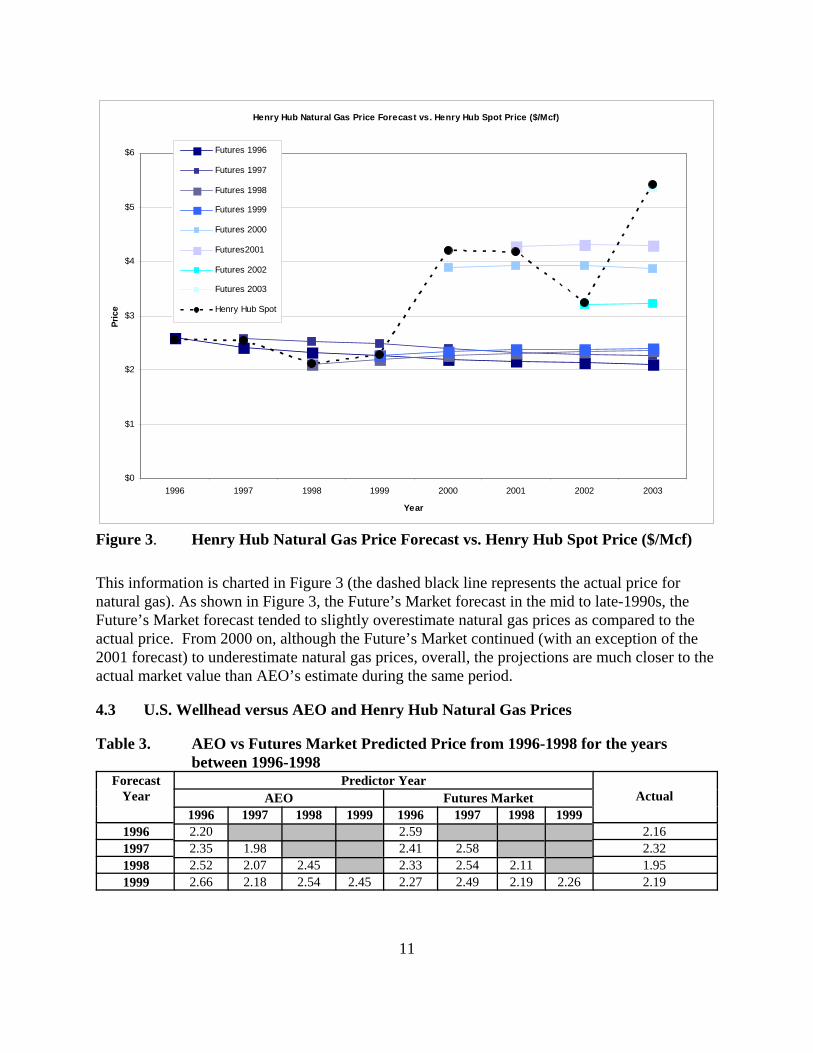
Table 2 summarizes the futures market forecasted natural gas prices from 1996-2003.2 TheFuture’s Market data is projected daily for one month ahead (e.g., every day for the month ofApril 1997, there is a price projected for the month of May 1997), on the last day of the monththere is a final projection (forecast) for the next month (which is often the next day). In order tocompare the Future’s Market forecast data to AEO’s forecast data, the final projection for eachmonth (12 values total, one value for each month) was averaged in order to get one annualaverage value. The average forecast for each forecasted year is shown, for the forecast year1996 the average henry hub natural gas spot price is $2.59. The far right column shows theactual natural gas price from 1996 to 2003, which is defined as an annual average.
11
Henry Hub Natural Gas Price Forecast vs. Henry Hub Spot Price ($/Mcf)
$0
$1
$2
$3
$4
$5
$6
1996 1997 1998 1999 2000 2001 2002 2003
Year
Pric
e
Futures 1996
Futures 1997
Futures 1998
Futures 1999
Futures 2000
Futures2001
Futures 2002
Futures 2003
Henry Hub Spot
Figure 3. Henry Hub Natural Gas Price Forecast vs. Henry Hub Spot Price ($/Mcf)
This information is charted in Figure 3 (the dashed black line represents the actual price fornatural gas). As shown in Figure 3, the Future’s Market forecast in the mid to late-1990s, theFuture’s Market forecast tended to slightly overestimate natural gas prices as compared to theactual price. From 2000 on, although the Future’s Market continued (with an exception of the2001 forecast) to underestimate natural gas prices, overall, the projections are much closer to theactual market value than AEO’s estimate during the same period.
4.3 U.S. Wellhead versus AEO and Henry Hub Natural Gas Prices
Table 3. AEO vs Futures Market Predicted Price from 1996-1998 for the years between 1996-1998
ForecastYear
Predictor YearActualAEO Futures Market
1996 1997 1998 1999 1996 1997 1998 19991996 2.20 2.59 2.161997 2.35 1.98 2.41 2.58 2.321998 2.52 2.07 2.45 2.33 2.54 2.11 1.951999 2.66 2.18 2.54 2.45 2.27 2.49 2.19 2.26 2.19

12
AEO and Futures Natural Gas Price Forecast 1996-1999 vs U.S. Natural Gas Wellhead Price ($/Mcf)
$1.50
$1.70
$1.90
$2.10
$2.30
$2.50
$2.70
$2.90
1995 1996 1997 1998 1999 2000
Year
Pric
e
AEO Forecast
Futures Forecast
U.S. Natural Gas Wellhead Price($/Mcf)Linear (AEO Forecast)
Linear (Futures Forecast)
Figure 4. Futures Market vs AEO Forecast from 1996-1999 as Compared to the U.S.Natural Gas Wellhead Price ($/Mcf)
Table 4. AEO vs Futures Market Predicted Price from 1998-2003 for the years between 1998-2003
Forecast Year Predictor YearActualAEO Futures Market
2000 2001 2002 2003 2000 2001 2002 20032000 2.52 3.89 3.692001 2.56 3.64 3.92 4.28 4.012002 2.61 3.10 2.21 3.92 4.31 3.21 2.952003 2.38 2.86 2.72 3.57 3.87 4.29 3.23 5.37 4.98
Table 3 summarizes the natural gas price forecasts for the period between 1996-1999 as reportedby AEO and Henry Hub as well as the U.S. Natural Gas Wellhead Price observed during thesame period. Table 4 summarizes the natural gas price forecasts for the period between 2000-2003 reported by AEO and Henry Hub as well as the U.S. Natural Gas Wellhead Price observedduring the same period.
Figure 4 charts the information presented in Table 3. As shown in Figure 4, this is a graphicalcomparison of AEO and Henry Hub reported projections from 1996-1999. During this period,AEO tended to accurately estimate the actual U.S. Wellhead natural gas price while the FuturesMarket consistently overestimated.
.

13
AEO and Futures Natural Gas Price Forecast 2000-2003 vs U.S. Natural Gas Wellhead Price ($/Mcf)
$1.50
$2.00
$2.50
$3.00
$3.50
$4.00
$4.50
$5.00
$5.50
$6.00
1999 2000 2001 2002 2003 2004Year
Pric
e
AEO Forecast
Futures Forecast
U.S. Natural Gas WellheadPrice ($/Mcf)Linear (AEO Forecast)
Linear (Futures Forecast)
Figure 5. Futures Market vs AEO Forecast from 2000-2003 as Compared to the U.S.Natural Gas Wellhead Price ($/Mcf)
Figure 5 charts the information presented in Table 4. As shown in Figure 5, this is a graphicalcomparison of AEO and Henry Hub reported projections from 2000-2003. During this period,AEO consistently underestimated the actual U.S. Wellhead natural gas price while the FuturesMarket more accurately estimated the actual price.
Table 5. Descriptive Statistics of Futures Market, AEO and U.S. Natural Gas Wellhead Prices
Natural Gas Forecast Variable Mean StandardDeviation
Sum Minimum Maximum
U.S. Wellhead Price 3.03 1.09 24.25 1.95 4.98
Futures Market 2.68 0.11 21.41 2.30 3.24
AEO 2.32 0.04 18.59 2.16 2.47* Descriptive Statistics using MS Excel Data Analysis
Table 5 shows descriptive statistics of the Futures Market, AEO and U.S. Natural Gas WellheadPrices. U.S. Natural Gas Wellhead (mean = $3.03, standard deviation = $1.09) prices showmuch higher prices and price variability than both the Futures Market (mean = $2.56, standarddeviation = $0.11) and AEO (mean = $2.32, standard deviation = $0.04). The Henry Hub

14
Observed Futures vs Actual (1996-1999)
y = 0.4055x + 1.5542R2 = 0.2011
2.25
2.3
2.35
2.4
2.45
2.5
2.55
2.6
2.65
1.9 2 2.1 2.2 2.3 2.4
U.S. Natural Gas Wellhead Price, $/Mcf
Futu
res
Figure 7. Regression Analysis PlotsObserved Futures by Actual(1996-1999)
Observed AEO vs Actual (1996-1999)
y = -0.3913x + 3.1365R2 = 0.1962
2.15
2.20
2.25
2.30
2.35
2.40
2.45
2.50
1.90 2.00 2.10 2.20 2.30 2.40
U.S. Natural Gas Wellhead Price, $/Mcf
AEO
Figure 6. Regression Analysis PlotsObserved AEO by Actual(1996-1999)
futures price underestimated the natural gas price by 35 cents per thousand cubic feet (11.5percent) between 1996 and 2003 and AEO underestimated by 71 cents per thousand cubic feet(23.4 percent).
Figure 6 shows a weak negative correlation between forecasted AEO natural gas price by actualU.S. wellhead natural gas prices (R-square = -0.19) for the period between 1996 to 1999. Figure7 shows a weak positive correlation between forecasted Futures Market natural gas price byactual U.S. wellhead natural gas prices (R-square = 0.20) for the period between 1996 to 1999.

15
Observed AEO vs Actual (2000-2003)
y = 3.3916x - 5.2594R2 = 0.3755
2.50
3.00
3.50
4.00
4.50
5.00
5.50
2.30 2.40 2.50 2.60 2.70 2.80 2.90
U.S. Natural Gas Wellhead Price, $/Mcf
AEO
Figure 8. Regression Analysis PlotsObserved AEO by Actual(2000-2003)
Observed Futures vs Actual (2000-2003)
y = 0.1815x + 2.214R2 = 0.3604
2.5
2.6
2.7
2.8
2.9
3
3.1
3.2
3.3
2.5 3 3.5 4 4.5 5 5.5
U.S. Natural Gas Wellhead Price, $/Mcf
Futu
res
Figure 9. Regression Analysis PlotsObserved Futures by Actual(2000-2003)
Figure 8 shows a moderate positive correlation between forecasted AEO natural gas price byactual U.S. wellhead natural gas prices (R-square = 0.37) for the period between 2000 to 2003. Figure 9 shows a moderate positive correlation between forecasted Futures Market natural gasprice by actual U.S. wellhead natural gas prices (R-square = 0.36) for the period between 2000 to2003.
4.4 Conclusions
Overall, the above information shows that two distinct periods between 1996 to 2003 existed. During the period between 1996 to 1999, U.S. wellhead natural gas prices were relatively stable,but by the end of 2000 the natural gas market started to show signs of price volatility.
Between the period of 1996 to 1999, the Futures market tended to accurately estimate the actualnatural prices whereas AEO tended to slightly underestimate natural gas prices. The trendschanged after 2000, for the period between 2000 to 2003, both AEO and the Futures markettended to accurately estimate natural gas prices.
These trends suggest that during periods of relative stability in the natural gas market, theFutures Market is a better predictor of actual natural gas prices than AEO. But, during periodsof price volatility, there is no difference between the Futures Market and AEO in predictingnatural gas prices Overall, the Futures Market is better barometer of natural gas prices than AEOduring periods of stability and instability. These results suggest that agencies should considerincorporating the Henry Hub natural gas futures into their forecasting models along with theAEO forecast.

16
Appendix A
Table 1. AEO Predicted Price from 1996-2003 for the years between 1996-2003 (NotNormalized)
ForecastYear
Predictor YearAverage Actual1996 1997 1998 1999 2000 2001 2002 2003
1996 1.67 1.67 2.161997 1.74 1.74 1.74 2.321997 1.82 1.77 2.10 1.90 1.951998 1.87 1.81 2.11 2.09 1.97 2.191999 1.89 1.82 2.11 2.10 2.17 2.02 3.692000 1.91 1.84 2.12 2.16 2.17 3.34 2.26 4.012001 1.93 1.85 2.12 2.20 2.17 2.79 1.98 2.15 2.952002 1.94 1.88 2.12 2.25 2.20 2.52 2.37 3.13 2.30 4.98
Table 2. Futures Predicted Price from 1996-2003 for the years between 1996-2003
ForecastYear
Predictor YearAverage Actual
1996 1997 1998 1999 2000 2001 2002 2003
1996 2.59 2.59 2.161997 2.41 2.58 2.50 2.321998 2.33 2.54 2.11 2.33 1.951999 2.27 2.49 2.19 2.26 2.30 2.192000 2.20 2.40 2.26 2.34 3.89 2.62 3.692001 2.16 2.33 2.31 2.39 3.92 4.28 2.90 4.012002 2.13 2.28 2.34 2.39 3.92 4.31 3.21 2.94 2.952003 2.11 2.26 2.36 2.40 3.87 4.29 3.23 5.37 3.24 4.98