Embed Size (px)
Citation preview

Natural Gas Pathways to Achieve Air Quality Goals
Presentation to CEC-IEPR Workshop on Transportation
April 10, 2014

Natural Gas: A Foundational Fuel
Abundant Affordable Domestic

Overview
• Natural Gas technology is relatively mature offering the opportunity to achieve significant emissions reductions in the near term
• Low natural gas prices will aid adoption as an economic decision
• Tanks and fuel systems are the largest contributors to vehicle cost differential – both will come down significantly over the next 10 years
• A variety of technology advances and increasing blends of Renewable Natural Gas will allow NG solutions to meet NOx and GHG goals over the mid and long term

0%
10%
20%
30%
40%
50%
60%
70%
80%
90%
100%
2010 2015 2020 2025 2030 2035 2040 2045 2050
Rem
ain
ing E
mis
sion
s R
elati
ve
to 2
010
Statewide CO2
South Coast NOx
San Joaquin NOx
Source: Curves based on CARB Vision for clean air Scenario 3 in CARB vision model, available at http://www.arb.ca.gov/planning/vision/vision.htm
CARB Statewide
2050 GHG Target
SJV carrying capacity for 80 ppb ozone standard = 160 tons/day
SCAQMD carrying capacity for 80 ppb ozone standard = 115 tons/day 15 years too late
14 years too late
Current Glide Paths Miss Emissions Goals
4
SCAQMD carrying capacity for 75 ppb ozone standard = 80 tons/day
South Coast NOx Targets
San Joaquin NOx Target
8 years too late

Natural Gas in Reducing Emissions

Potential for rapid increase in the N-ZEV Fleet
6
SoCal Regional NG HDV Adoption Firecast Scenario
Market Share Scenarios CY2013 CY2020 CY2023 CY2030
Refuse 28.0% 55.5% 53.2% 62.4%
Transit 68.8% 68.8% 68.8% 68.8%
Drayage POLA / POLB 6.9% 6.9% 21.5% 22.1%
Regional / Beverage / Delivery 0.2% 5.5% 10.5% 24.5%
Line Haul 0.2% 8.7% 11.1% 21.3%
Total 4.0% 10.9% 14.5% 24.6%

Five Strategies to Further Reduce NOx and GHG Emissions from NGVs

1. grams per brake horsepower hour (g/bhp-hr)
NOx Reduction Pathway

GHG Reduction Pathway

Roadmap for NOx Reductions from Natural Gas HDVs
10
Thousands of Drayage trucks, transit buses, refuse trucks
Dedicated NG engines
Three-way catalysts, SCR
Hybrids: Battery-electric,
Hydraulic
Today Near-term (2013-2023) Long-term (2023-2032+)
Aerodynamics, Weight Reduction, and Rolling Resistance Reduction Strategies - e.g. DOE SmartWay and Super Truck (reduces vehicle energy needs and related fuel consumption)
Hydrogen/methane blends, Improved ultra lean ignition & air/fuel control technologies (Reduces fuel pathway NOx emissions)
Advanced Engines (improved combustion and engine efficiency reduce emissions)
Advanced After-treatment
• Enhanced 3-way catalyst
• Low emission Turbine
Parker’s hydraulic
hybrid refuse truck
• US Hybrid’s PHEV Drayage Truck • Siemens Catenary Hybrid Truck • Future CNG PHEV or FCHV using
pipeline supplied RNG
Strategies / Technologies
Examples
Targets <0.2g NOx <0.05g NOx <0.02g NOx ZE Miles, Net Zero, ZE
Equivalent
Hybrids: Catenary, Plug-in, Fuel Cell
CNG/H2 Blends

Roadmap for GHG Reductions from Natural Gas HDVs
11
Thousands of Drayage trucks, transit buses, refuse trucks
Dedicated NG engines
Three-way catalysts, SCR
(enables higher efficiency engines)
Hybrids: Battery-electric,
Hydraulic
20% GHG reductions w/o RNG
20%-30% GHG reductions w/o RNG
30-40% GHG reductions w/o RNG
50%+ GHG reductions
w/o RNG
Today Near-term (2013-2023) Long-term (2023-2032+)
Renewable natural gas, improved ultra lean ignition & air/fuel controls technologies
Aerodynamics, Weight Reduction, and Rolling Resistance Reduction Strategies (e.g. DOE SmartWay and Super Truck)
Advanced Engines
Advanced After-treatment
(enables higher efficiency engines)
• Enhanced 3-way catalyst
• Low emission Turbine
Parker’s hydraulic hybrid refuse
truck
Strategies / Technologies
Examples
Targets
Hybrids: Catenary, Plug-in
CNG/H2 blends, RNG, Fuel Cell Hybrids
• US Hybrid’ PHEV Drayage Truck • FCHV using pipeline supplied RNG • Future CNG PHEV
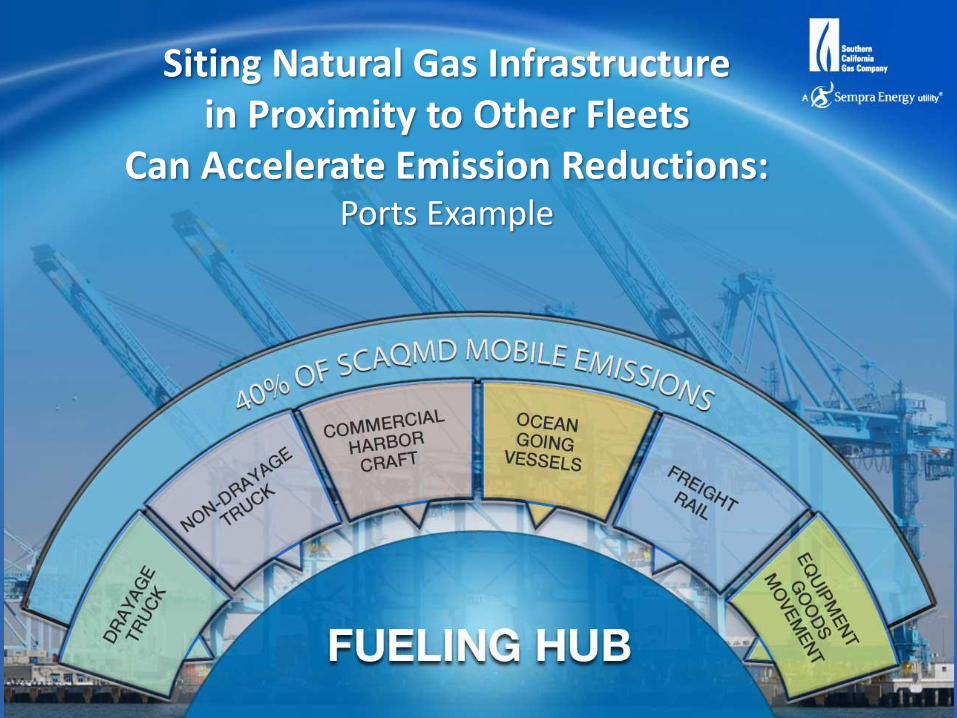
Siting Natural Gas Infrastructure in Proximity to Other Fleets
Can Accelerate Emission Reductions: Ports Example

Putting the Strategies Together in a Pathway Example: Long Haul Truck
13
Today By 2023 By 2032
Spark Ignition + EGR+TWC •<0.20 g NOx •~40% efficiency
• Engine Efficiency Improvements
• Lower NOx Emissions Targets
•<0.05 g NOx •~40-45% efficiency
Near Zero Emissions Target
New Engines (Gas Turbine) Near Zero
Emission Gas Turbine •<0.02 g NOx •~55% efficiency
Benefits • Power plant-
equivalent NOx emissions
• Up to 50% less GHG without RNG blending
Benefits • 75% NOx
reductions • ~30% GHG
reductions
Benefits • Available today • ~20% GHG
benefits vs. diesel
Renewable NG + H2 blending
Aero, Weight, Tires

Putting the Strategies Together in a Pathway Example: Drayage/Short Haul Truck
14
Today By 2023 By 2032
Spark Ignition + EGR+TWC •<0.20 g NOx •~35-37% efficiency
•New Engines Sizes •Improved engines / after-treatment •Hybridization
SI & Compression Ignition + Heat Recovery •<0.05 g NOx •~45% efficiency
CNG-Hybrid (Extended all-electric range)
Near Zero Emissions Target
Engine Efficiency Improvements
Zero Emission NG/H2 Hybrid •<0.02 g NOx •~55% efficiency
Benefits • >70 zero emission
miles per day • 50% + GHG
reductions • Supports H2
fueling infrastructure dev
Benefits • Zero emission
miles possible • 75% NOx
reductions • 30%+ GHG
reductions
Benefits • Available today • ~20% GHG
benefits vs. diesel
Aero, Weight, Tires
Hydrogen Blending
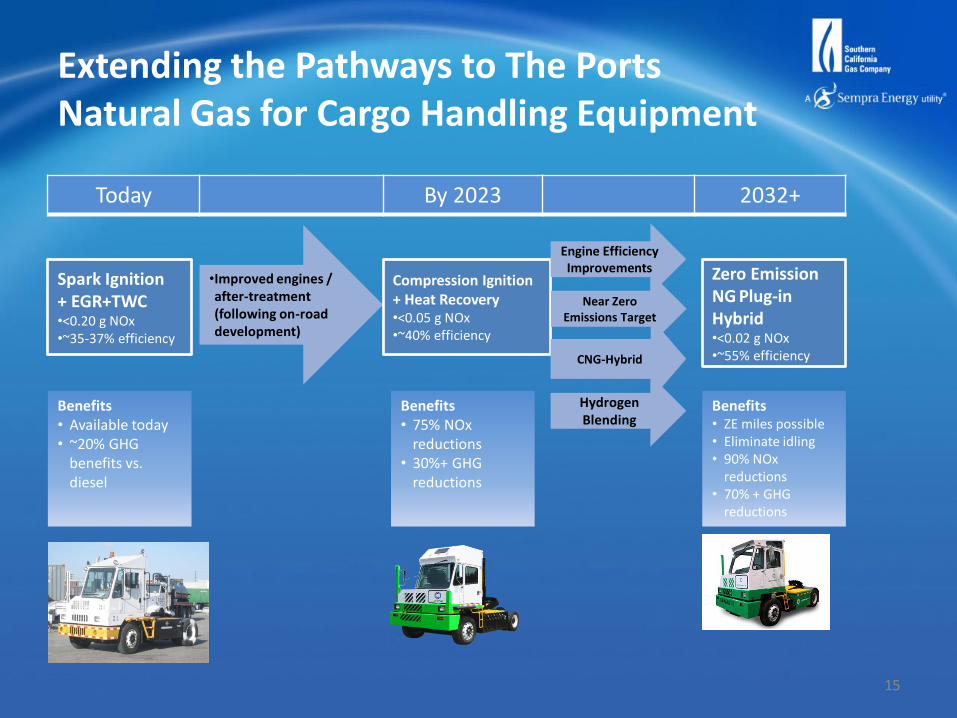
Extending the Pathways to The Ports Natural Gas for Cargo Handling Equipment
15
Today By 2023 2032+
Spark Ignition + EGR+TWC •<0.20 g NOx •~35-37% efficiency
•Improved engines / after-treatment (following on-road development)
Compression Ignition + Heat Recovery •<0.05 g NOx •~40% efficiency
CNG-Hybrid
Near Zero Emissions Target
Engine Efficiency Improvements Zero Emission
NG Plug-in Hybrid •<0.02 g NOx •~55% efficiency
Benefits • ZE miles possible • Eliminate idling • 90% NOx
reductions • 70% + GHG
reductions
Benefits • 75% NOx
reductions • 30%+ GHG
reductions
Benefits • Available today • ~20% GHG
benefits vs. diesel
Hydrogen Blending

Extending the Pathways to Off Road Locomotives
16
Today 2013-2015 2015-2023 2023-2032 2032+
Existing Tier 2 Locomotive •5.5 g NOx
• New engine options (HPDI, dynamic gas blending)
• LNG Tender Car
• Tier 2 LNG Retrofits (<3 g
NOx)
• Tier 4 LNG Newbuilds (<1.3 g
NOx)
Near Zero Emissions Target
Solid Oxide Fuel Cell Technology
NZ-Emission Natural Gas Fuel Cell Locomotive •<0.02 g NOx •>60% efficiency
Benefits* • 98% + NOx
reductions vs Tier 2 diesel
• 55%+ GHG reductions vs Tier 2 diesel w/o RNG
Benefits • Tier 2: 45% NOx
reductions • Tier 2 and 4: 20%
GHG reductions vs Tier 2 diesel
Renewable NG blending
Ongoing RD&D for LNG fuel systems and engine conversions

Extending the Pathways to The Ports LNG for Marine Vessels
17
Today 2013-2015 2015-2018 2018-2023 2032+
Existing Tier 1 & 2 Vessels
• 1,000 ppm fuel sulfur limit for marine vessels in ECAs
• IMO Tier 3 NOx standards
• Tier 1& 2 LNG retrofits
• Tier 3 LNG new builds
• First LNG work boats, ferries, short sea shipping vessels deployed
Container Ships
Tankers High penetration of LNG into marine vessel fleet – estimated at 10,000+ vessels
Benefits • NOx, PM, and
SOx reductions beyond IMO Tier 3
• GHG reductions of up to 70%
Benefits • Up to 90% NOx
reductions • 98%+ PM and SOx
reductions • 20%+ GHG
reductions
Tug boats (new builds)
•Ongoing RD&D for LNG fuel systems and vessel retrofits. •Development of LNG bunkering standards and infrastructure
Expanded LNG bunkering
Vessel hydrodynamics
Vessel size increases

Numerous RNG and Related H2
Pathways Being Pursued
WWTP Biogas
Collection
Organic Matter
Landfill Biogas
Collection
Gasification
22% Energy Loss
TRL = 7 Anaerobic Digester
3% Energy Loss
TRL = 9
Compression,
Odorization,
Quality Control
& Injection
0.6% Energy
Loss
TRL = 9 CH4/CO2 Separation
Pressure Swing
Adsorption
Amine Scrubbing
Water Scrubbing
Membrane
3% Energy Loss
TRL = 8
Methanation
20% Energy Loss
TRL = 7
Renewable P2G
H2 Production
33% Energy Loss
TRL = 9
Solar Thermal Catalytic
H2 Production
0.6% Energy Loss
TRL = 2
CO2
Dry / Woody
Wet
Current cost range $10 - $41/ MMBtu + transportation

Technology Development Priorities
• Natural Gas Engine (and Turbine Drive) Development
• Next generation after-treatment
• Mild hybrids for accessories and fuel economy (tailored to duty cycle)
• Low-cost storage tanks (3600 psi and lower-pressure sorbent systems) – note that this is synergistic w/ FCV
• Low-cost compression systems including lower-capacity systems (small fleets… home refueling)
• Renewable Natural Gas pathways

![Future of Education and Skills 2030: Curriculum analysis · and transformational curriculum [standards], while improving the pathways for student populations to achieve those goals,](https://img.dokumen.tips/doc/110x75/5d648f9e88c993f2418b6467/future-of-education-and-skills-2030-curriculum-and-transformational-curriculum.jpg)