Embed Size (px)
Citation preview

British Journal of Social Psychology (2013), 52, 726–746
© 2012 The British Psychological Society
www.wileyonlinelibrary.com
Nations’ income inequality predicts ambivalence instereotype content: How societies mind the gap
Federica Durante1*, Susan T. Fiske2, Nicolas Kervyn3,Amy J. C. Cuddy4, Adebowale (Debo) Akande5,Bolanle E. Adetoun6, Modupe F. Adewuyi7, Magdeline M. Tserere8,Ananthi Al Ramiah9, Khairul Anwar Mastor10, Fiona Kate Barlow11,Gregory Bonn12, RominW. Tafarodi12, Janine Bosak13, Ed Cairns14,Claire Doherty14, Dora Capozza15, Anjana Chandran16,Xenia Chryssochoou17, Tilemachos Iatridis18,Juan Manuel Contreras2, Rui Costa-Lopes19, Roberto Gonzalez20,Janet I. Lewis21, Gerald Tushabe22, Jacques-Philippe Leyens3,Renee Mayorga23, Nadim N. Rouhana24, Vanessa Smith Castro25,Rolando Perez25, Rosa Rodrıguez-Bailon26, Miguel Moya26,Elena Morales Marente27, Marisol Palacios Galvez27,Chris G. Sibley28, Frank Asbrock29 and Chiara C. Storari30
1University of Milan – Bicocca, Italy2Princeton University, New Jersey, USA3Catholic University of Louvain at Louvain-la-Neuve, Belgium4Harvard Business School, Boston, Massachusetts, USA5Institute of Research on Global Issues, Tshwane, South Africa6Economic Commission for West Africa (Ecowas), Abuja, Nigeria7Emory University, Atlanta, Georgia, USA8National Prosecuting Authority, Pretoria, South Africa9University of Oxford, UK10University Kebangsaan Malaysia, Bangi, Malaysia11University of Queensland, St Lucia, Australia12University of Toronto, Ontario, Canada
*Correspondence should be addressed to Federica Durante, Dipartimento di Psicologia, Universita di Milano–Bicocca, Piazzadell’Ateneo Nuovo 1, 20126 Milano, Italy (e-mail: [email protected]).After the first four authors, the remaining authors are listed alphabetically by the last name of our primary contact at the university.Nicolas Kervyn is now at Centre Emile Berheim, Solvay Brussels School of Economics andManagement, ULB, Belgium; Ananthi AlRamiah is now at Yale-NUSCollege, Singapore; JuanManuel Contreras is now atHarvardUniversity, USA; Gregory Bonn is now atMonash University Sunway Campus, Malaysia; Janine Bosak is now at Dublin City University Business School, Ireland.
DOI:10.1111/bjso.12005
726

13University of Bern, Switzerland14University of Ulster, UK15University of Padova, Italy16Bangalore, India17Panteion University of Social and Political Sciences, Athens, Greece18University of Crete, Greece19ICS – University of Lisbon, Portugal20Pontificia Universidad Catolica de Chile, Santiago, Chile21Harvard University, Cambridge, Massachusetts, USA22Makerere University, Kampala, Uganda23University of Lima, Peru24Tufts University, Medford, Massachusetts, USA25University of Costa Rica, San Pedro, Costa Rica26University of Granada, Spain27University of Huelva, Spain28University of Auckland, New Zealand29Philipps University Marburg, Germany30University of Lausanne, Switzerland
Income inequality undermines societies: The more inequality, the more health problems,
social tensions, and the lower social mobility, trust, life expectancy. Given people’s
tendency to legitimate existing social arrangements, the stereotype contentmodel (SCM)
argues that ambivalence―perceiving many groups as either warm or competent, but not
both―may help maintain socio-economic disparities. The association between stereo-
type ambivalence and income inequality in 37 cross-national samples from Europe, the
Americas, Oceania, Asia, and Africa investigates how groups’ overall warmth-compe-
tence, status-competence, and competition-warmth correlations vary across societies,
andwhether these variations associate with income inequality (Gini index). More unequal
societies report more ambivalent stereotypes, whereas more equal ones dislike
competitive groups and do not necessarily respect them as competent. Unequal societies
may need ambivalence for system stability: Income inequality compensates groups with
partially positive social images.
Inequality corrodes human relations. As Alexis de Tocqueville (1835/2003) noted, material
differencesdividepeople socially, andobstructempathy, favouringexploitationandslavery.
Coming from aristocratic France, in 1831, de Tocqueville travelled the United States,impressedby the ‘equality of conditions’ (p. 11),which, inhis opinion, helpedAmericans to
trust each other. Indeed, for thousands of years the quality of human life has improved by
raisingmaterial livingstandards,butnowadaysfor richcountries toget richeraddsnothingto
quality of life (Wilkinson & Pickett, 2010). What instead seems to matter the most in
developed nations is the level of inequality in society, namely, the size of incomedisparities.
Many problems plague more unequal societies: The more inequality, the more health
problems, social tensions, and the lower life expectancy, social mobility, education, trust,
happiness, and well-being (see Wilkinson & Pickett, 2009, for a review). If on the onehand, both history and recent events (e.g., the Arab spring, the Occupymovement) argue
in favour of people’s need for justice and therefore for fighting against inequality, on the
other hand, both history and recent events (e.g., the economic crisis) show the existence
Income inequality and ambivalent stereotypes 727

of a perplexing degree of acquiescence that contributes to the maintenance of unequal
systems. Certainly, collective actions have played a critical role in reducing inequality.
However, when considering the level of persistent disparity within and between
societies, the relative lack of collective actions may seem surprising.The American historian Howard Zinn (1968) claimed that ‘society’s tendency is to
maintain what has been’ and ‘rebellion is only an occasional reaction’ (p. 16; cited in Jost,
Banaji, &Nosek, 2004). Social psychologists Jost andBanaji (1994) offer an explanation for
such a tendency by arguing that individuals are inclined to rationalize the status quo, thus
perceiving the existing social arrangements that affect them as fair, legitimate, and
justified. The stereotype content model (SCM; Fiske, Cuddy, Glick, & Xu, 2002) suggests
that depicting societal groups in ambivalent ways―such as fortunate in one sphere while
unfortunate in another―may mask socio-economic disparities, facilitating, as a conse-quence, the rationalization andmaintenance of the status quo. Using the SCM, the present
work begins to investigate the relationship between ambivalent societal stereotypes and
income inequality across nations, hypothesizing that the more unequal a society is the
more ambivalence appears as a rational buffer that helps to conceal inequality and
maintain the system.
Ambivalence and the SCMAmong the functions of stereotypes, Tajfel (1981) argued that stereotypes contribute to
themaintenance of the system ‘explaining or justifying a variety of social actions’ (p. 146).
More recently, ambivalent stereotypes especially appear to serve this function because
they paint both advantaged and disadvantaged groups as possessing distinctive but
counterbalanced strengths and weaknesses, as if every ‘class gets its share’ (Lane, 1959,
p. 39), leading people to perceive society as fair (Glick & Fiske, 2001; Kay & Jost, 2003).
Underlying ambivalent stereotypes, favourable and unfavourable biases co-exist,
beyond outgroup antipathy (e.g., Eagly & Kite, 1987; Eagly & Mladinic, 1989; Glick &Fiske, 1996, 2001, 2011; Katz & Hass, 1988). In this context, the SCM (Fiske et al., 2002)
innovates by looking at various stereotypes simultaneously and from society’s perspec-
tive, as shared, cultural, public images. Not only aremany societal stereotypes ambivalent,
combining both hostile and favourable beliefs about a group, but also warmth and
competence (W-C) are the two basic dimensions capturing cultural contents. Although
labels differ (socially vs. intellectually good–bad, Rosenberg, Nelson, & Vivekananthan,
1968; communion vs. agency, Bakan, 1966; see also Abele & Wojciszke, 2007), W-C
repeatedly appear as basic dimensions of social judgment (see Cuddy, Fiske, & Glick,2008; Fiske, Cuddy, & Glick, 2007) and intergroup behaviour (Cuddy, Fiske, & Glick,
2007) because they help individuals’ social interactions, indicating how helpful or
harmful a target may be (Fiske et al., 2002).
Ambivalent combinations of competence and warmth also emerge in compensation-
hypothesis studies (Judd, James-Hawkins, Yzerbyt, & Kashima, 2005), revealing trade-offs
of competence and warmth when people rate individuals or groups in a comparative
context. A compensatory process occurswhen a positive perception on one dimension is
offset by a negative perception on the other: Participants tried to ‘rectify this disparity [onone dimension] by asserting that the situationmust be reversed on the other dimension of
social judgment’ (Judd et al., 2005, p. 910), but only on competence and warmth (see
Kervyn, Yzerbyt, & Judd, 2010, for a review).
According to the SCM, competence and warmth judgments, respectively, stem
from perceived socio-economic status (high–low) and perceived interdependence
728 Federica Durante et al.

(cooperative–competitive). These socio-structural factors predict groups’ location on the
competence-warmth stereotype map (Fiske, 2012; Fiske et al., 2002, 2007). Crossing
status and interdependence, four kinds of stereotype content emerge: High-status,
cooperative groups seem both competent andwarm, a univalent and positive stereotype;low-status, competitive groups receive univalent but negative stereotypes, seeming both
cold and incompetent. High-status, competitive groups are ambivalently judged as
competent, but not warm; whereas low-status, cooperative groups are ambivalently
considered as warm, but incompetent.
Stereotype content model hypotheses – perceived competence and warmth differ-
entiate groups’ stereotypes, many ambivalent (or mixed), with status predicting
competence, and competition predicting (low) warmth – have extensive support, usinga wide range of target groups: Occupations, nationalities, ethnicities, socio-economicgroups, religions, and gender subtypes (see Cuddy et al., 2008; for a review). Most
relevant here, Cuddy et al. (2009) tested SCM hypotheses using eight European (mostly
individualistic) and three East Asian (collectivistic) samples, finding cross-cultural
similarities on the main SCM hypotheses, with cross-cultural differences (more modest,
collectivistic cultures do not locate reference groups in the high–high cell). SCM provides
a pancultural tool for predicting group stereotypes from structural relations with other
groups in society, and for comparing across societies.
As noted, individuals are inclined to maintain the status quo rather than to subvert itand this might be particularly true for high-status people (e.g., Schmitt, Branscombe, &
Kappen, 2003). However, favourable attitudes towards the preservation of the social
order, albeit unjust, are also shared, at least under certain conditions, by disadvantaged
groups (Jost et al., 2004; Kay et al., 2009; Lane, 1959; Stott & Drury, 2004; Tajfel, 1981).
Holding ambivalent beliefs about social categories may help people (especially the more
deprived) to tolerate their situation (e.g., Jackman, 1994) because when one’s group is
lowonone dimension, it is rewarded on the other. For this reason, ambivalent stereotypes
can legitimate the status quo in ways that purely hostile stereotypes cannot (Fiske et al.,2002). Because people aremore likely to endorse collective actions onlywhen injustice is
relatively clear (see Ellemers &Barreto, 2009), these subtle, ambivalent forms of prejudice
may discouragepeople fromchallengingunequal systems. Becker andWright (2011) have
indeed recently shown that exposure to benevolent sexism (Glick & Fiske, 1996, 2011), a
paternalistic belief that portrays women as ‘wonderful but incompetent’, hence best
suited for low-status positions, decreaseswomen’s engagement in collective action,while
exposure to hostile sexism increases it (both effectsweremediated by system justification
motives).Ambivalent gender stereotypes are in fact more prevalent in countries with higher
gender inequality at a societal level (Brandt, 2011; Glick et al., 2000, 2004). Furthermore,
social problems more reliably associate with income distribution ‘when income
differences are measured across nation-states and other large geo-political units’
(Wilkinson & Pickett, 2007, p. 1966). Hence, to explore the ambivalence-inequality
association, our cross-national study used SCM theory and method to investigate the
ambivalent warmth–competence relationship and its relationship with an income-
inequality measure, namely, the Gini index (Brandolini & Smeeding, 2007).
Hypotheses
To establish comparability with earlier efforts, we first tested the four SCM hypotheses,
namely, how social groups were rated in warmth, competence, status, and competition,
Income inequality and ambivalent stereotypes 729

expecting that: Societal groups would array on perceived W-C (Hypothesis 1); many
groups would appear either more competent or more warm (but not necessarily both or
neither; Hypothesis 2); perceived status would positively correlate with competence
(Hypothesis 3), and competition negatively with warmth (Hypothesis 4).The inequality hypotheses investigated first overall correlations between W-C, and
whether these co-varied with Gini inequality coefficients. The Gini index measures the
degree of inequality in the distribution of income within a society. As calculated by the
AmericanCentral IntelligenceAgency, the cumulative family income is plotted against the
number of families arranged from the poorest to the richest. LowGini coefficients indicate
a more equal distribution, with 0 corresponding to complete equality, and 100
corresponding to complete inequality.1
We considered a society as more ambivalent when the overall W-C correlation,calculated across societal groups within each sample, was around zero: The less
correlated theW-C dimensions, the more the society’s groups appear as a cloud of points,
rather than a vector, as they would under a high warmth-competence correlation. The
more circular cloud reflects the distributionofmany groups into the ambivalent quadrants
of the space; the vector shapewould showmost groupsbeingunivalent, low–loworhigh–high. Thus, we expected higher inequality (Gini) to be associated with lower W-C
correlation coefficients (Hypothesis 5). This would fit greater inequality requiring more
compensation.The inequality focus also compared how stereotypic traits and their respective socio-
structural predictors (status-competence, competition-warmth) vary across societies.
Perhaps viewing some groups ambivalently helpsmask the status-competence dimension
as the main source of social difference, emphasizing the competition-(low)warmth
dimension as an additional source of social difference. A group might appear low status
and low competence, but compensated by stereotypically appearing cooperative and
friendly. This mechanism, that inequality could be masked by emphasizing another
dimension besides status-competence, suggests the hypothesis that correlations betweeninequality (Gini) and ambivalence (the warmth-competence correlation) will themselves
be linked to variations in the competition-warmth correlation: In other words, the
inequality-ambivalence association will depend on the way in which competitive groups
are perceived in terms of warmth (Hypothesis 6).
Alternatively, correlations between inequality and ambivalence could result from
compressing or exaggerating perceived status differences (vs. actual differences
measured by the Gini). If societies tend to conceal inequality, then the competence
attributed to high-status groups could be either minimized or alternatively inflated.Therefore, the inequality-ambivalence correlation would itself correlate with the
status-competence correlation, showing either compression, as when people endorse
egalitarian principles (negative correlation), or exaggeration, as when people endorse
meritocracy (positive correlation; Hypothesis 7).
Method
Data were collected in: Australia, Belgium, Bolivia, Canada, Chile, Costa Rica, England,
Greece, India, Israel, Italy, Malaysia, Mexico, Northern Ireland, New Zealand, Peru,
1Gini coefficients were retrieved from Central Intelligence Agency-TheWorld Factbook, https://www.cia.gov/library/publications/the-world-factbook/fields/2172.html July, 2011.
730 Federica Durante et al.

Portugal, South Africa, Spain, Switzerland, and Uganda. Data from South Korea, Japan,
Hong Kong, and United States (US) were retrieved from previous studies (Cuddy et al.,
2009; Fiske et al., 2002, Study 1) and reanalysed here.
Preliminary groups-listing study
Following Fiske et al. (2002) and Cuddy et al. (2009), in each country2 a preliminary
study identified societal groups considered most salient. In their respective native
languages, approximately 1,379 participants, mostly students, 55.14% female, sample
sizes between 28 and 100, averaging 25.07 years, voluntarily completed a self-adminis-
tered, open-ended questionnaire listing: What various types of people their society
categorizes into groups; which groups were considered to be of very low status; and ofwhich groups they consider themselves to be member.
These questions aimed to identify relevant social groups in the least constrained way,
insuring that all types of groups would be mentioned. Groups listed by at least 15% of
participants then appeared in that country’s main survey questionnaire. Across samples,
the number of distinct groups ranged between 14 (Chile) and 33 (Bolivia, UPB-CB; Table
SI.1 in the online supporting information presents demographic information for each
sample). Overall, 235 different societal groups were listed, many of which were context
specific (i.e., 140 social categories were mentioned only in one preliminary study). Givenpresent purposes, we checked for the possibility that specific target groups would be
chosen only in more equal versus unequal countries. We considered the societal groups
listed in at least 10 of 292 preliminary studies (i.e., 19 societal groups: Blacks, Catholic
people, children, Christians, disabled people, gays, immigrants, Jews, men, middle-class,
Muslims, old people, poor people, rich people, students, unemployed people, women,
working class, young people). For each target group, we took into consideration the Gini
coefficients of the countries in which it was listed, and then calculated the median, thus
obtaining 19 Gini medians. They ranged from 33.70 to 39.20, just on either side of theoverall median Gini (37.60) of the countries in which the 29 preliminary studies were
carried out. Results showed that all these groups were mentioned about equally in both
high versus low equal countries.
Main survey
Samples and participants
Thirty-seven samples were recruited, one from each of the countries mentioned, with the
exceptions of: Australia (two samples, Asian- and European-Australians), Bolivia (four
different Bolivian universities’ campuses2), Israel (two samples, Israeli-Jews and -Arabs),
Italy (two samples, students and non-students), New Zealand (two samples, European-and Maori-New Zealanders), Northern Ireland (two samples, Catholic and Protestant
Irish), Switzerland (four samples, Swiss-German students, Swiss-Italian students, Swiss-
French students, and Swiss-French non-students), United States (two samples, students
and non-students).
2 In Switzerland, three preliminary studies (one in each canton), and in Israel two preliminary studies (one for Israeli-Jews and onefor Israeli-Arabs) were carried out. In Bolivia, data for the long survey were collected in four universities’ campuses located in twoBolivian cities. In Cochabamba, both the preliminary groups-listing study and the long survey were conducted at the UniversidadPrivada Boliviana-Cochabamba (UPB-CB). In La Paz, the preliminary groups-listing study was at the Universidad Mayor de SanAndres (UMSA), whereas the long survey was at the UMSA, Universidad Catolica Boliviana (UCB), and Universidad PrivadaBoliviana (UPB).
Income inequality and ambivalent stereotypes 731

Respondents (N = 3,229) voluntarily participated in the main survey. Sample sizes
varied (n = 30–272), mostly students, 61.04% female, mean age 23.7 years (Table SI.2 in
the online supporting information presents demographic information for each sample).
Questionnaire and procedure
In their native languages, participants rated the groups from their countries’ respective
preliminary studies on items reflecting warmth, competence, status, and competition.3
Two items measured each construct (Appendix SI.A online presents all items) on 5-point
scales (1 = not at all to 5 = extremely). As in previous SCM studies, participants rated
how the groups are viewed at a cultural level: ‘We intend to investigate the way societal
groups are viewed by the […] society. Thus,we are not interested in your personal beliefs,but in how you think they are viewed by others’. This instruction aimed to reduce social
desirability concerns and to detect socially shared group stereotypes, in effect collective
lay theories about how groups interrelate.
Results
Reliabilities, for each construct, within each sample, were generally sufficient: Compe-
tence a = .64–.93 (median = 0.85); warmth a = .54–.93 (median = 0.75); status
a = .60–.95 (median = 0.86); and competition a = .56–.95 (median = 0.71).4
SCM hypotheses
As in previous SCM studies, to test whether groups’ stereotypes fell along the two primary
dimensions, competence andwarmth scores for each societal groupwere averaged acrossparticipants within each sample. These means indeed arrayed groups in a two-
dimensional Competence 9 Warmth space (Hypothesis 1). Two types of cluster analysis
examined its structure: Hierarchical cluster analysis (Ward’s, 1963, method, which
minimizes within-cluster variance and maximizes between-cluster variance) helped
determine the best-fitting number of clusters; then, k-means cluster analyses examined
which groups fit into which cluster. For 25 of 37 samples (67%), agglomeration statistics
from the hierarchical cluster analysis pointed to a four-cluster solution. Five clusterswere,
instead, the best fit for the 12 remaining samples – Asian- andWhite-Australian, Canadian,English, Greek, Indian, European- and Maori-New Zealand, Malaysian, Japanese, Spanish,
and Ugandan samples.
To test for ambivalent stereotypes (Hypothesis 2), in each sample, competence and
warmth means were compared within (paired t-test) and between (independent t-test)
clusters. To be identified as ambivalent (either high-competence/low-warmth [HC-LW] or
low-competence/high-warmth [LC-HW]), a cluster had to meet two conditions estab-
lishedpreviously (Cuddy et al., 2009; Fiske et al., 2002):W-Cmeans differed significantly;
a cluster’s mean for the high dimension was higher than a cluster low on that dimension,and its mean for the low dimension was lower than a cluster high on that dimension. As
expected, the majority of groups ended up in ambivalent clusters in 20 of 37 samples.
3 Status and competition ratings are not available for the Mexican sample.4Reported alpha medians include the following unsatisfactory alphas: Warmth, Indian sample (a = .49); Status, Israeli-Arabsample (a = .44); Competition, Swiss-German sample (a = .30), and the four Bolivian samples (UPB a = .26; UPB-CBa = .39; UMSA a = .43; UCB a = .48).
732 Federica Durante et al.

Three exceptions (Portugal and Northern Ireland –Catholic sample) were all univalent or
all ambivalent (Japan). Two samples showed an almost equivalent numbers of groups
contained in univalent versus ambivalent clusters (Indian, 17 vs. 16 groups, and Swiss
German, 13 vs. 14 groups, respectively), whereas the remaining 12 samples showedmoregroups gathered in univalent than ambivalent clusters (Appendix SI.B online presents
cluster analysis results for each sample).
Although in each country participants evaluated their own societal groups, some
groups present inmost societies, such as immigrants (labelled also as illegal immigrants or
migrant workers), and unemployed people consistently ended up in the low-compe-
tence/low-warmth (LC-LW) cluster across cultures. We could furthermore notice some
regional idiosyncrasies: For instance, in the European samples, the group Gypsies is
included in the LC-LW cluster, whereas in the South American samples we found thegroup illiterates in that quadrant. The high-competence/high-warmth cluster, instead,
comprised the ingroups and the reference groups,which vary from society to society. The
LC-HW cluster consistently included old people, children, and disabled people, as the
HC-LW consistently included rich people.
To test SCM structure-trait predictions (Hypotheses 3 and 4), status and competition
scores for each societal groupwere averaged across participants within each sample, and
their means correlated with competence and warmth means, respectively. As expected,
perceived status positively correlated with competence (rs = .74–.99, all ps < .001;average r = .90). Perceived competition-warmth correlations averaged r = �.32: Rang-
ing from r = �.42 to �.92, ps < .05, in 15 of 36 samples3; three samples were marginal,
ps < .07: r = �.37, �.35, and �.36. Unexpectedly, perceived competition correlated
positively with warmth in the Israeli-Arab sample (r = .45, p < .05). The remaining
competition-warmth correlations were non-significant, but 11 were in the predicted
negative direction whereas 6 were not (see Table 1). As in previous data sets using these
methods, the average status-competence correlation showed twice the effect size of the
average (negative) competition-warmth correlation.Overall, Hypotheses 1–4were supported in all our samples. Because each society rated
its own social categories, these results suggest that evaluating different target groups does
not affect the SCM basic tenets.
Ambivalence and inequality hypotheses
The distribution of target groups, within each sample, in the Competence 9 Warmth
space suggested degrees of ambivalence:Higher degrees in some samples (a circular cloudof points, showing a zero warmth-competence correlation; e.g., Figure 1), lower degrees
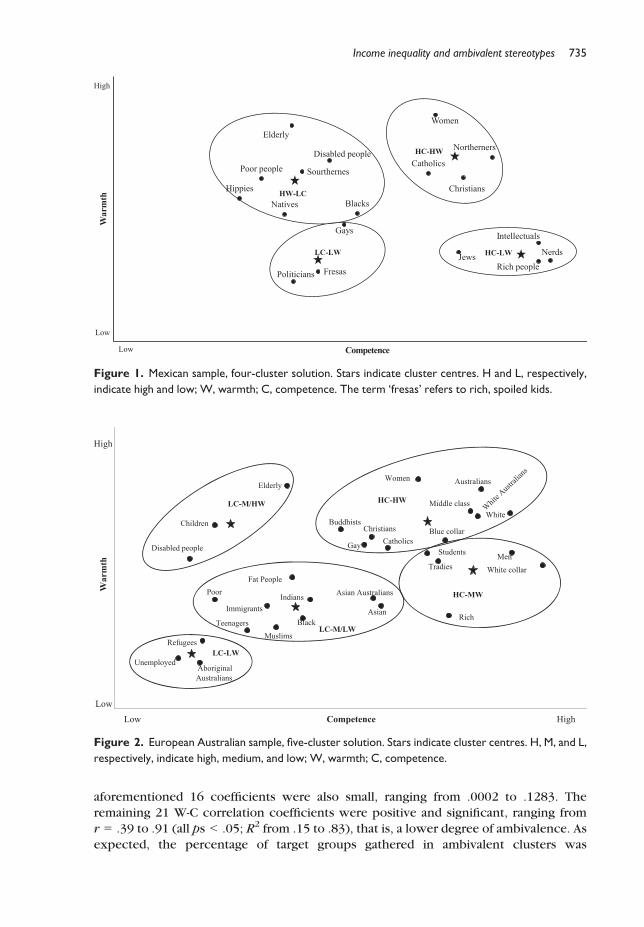
in others (a vector, from bottom left to top right, showing a positive warmth-competence
correlation; e.g., Figure 2). Thus, W-C relate to each other in different ways, in different
societies. As said, to measure different patterns across nations, we considered the overall
W-C correlation within each sample as an index of ambivalence: The lower the W-C
correlation, the greater the ambivalence; the higher a positive W-C correlation, the lower
the ambivalence.
Warmth and competence correlations were calculated at the target-group level withineach sample. As Table 1 illustrates, correlations ranged between �.19 (ns) and .91
(p < .001), average r = .40. Of 37 samples, 16 showed a small, non-significant W-C
correlation, that is, a higher degree of ambivalence according to our definition. Because
the number of groups evaluated by participants in each sample varied (i.e., from 14 to 33),
we also considered R2 as an estimate of W-C correlations’ effect size. The R
2 of the
Income inequality and ambivalent stereotypes 733

Table 1. Stereotypic traits correlations, social-structure stereotype correlations, Gini coefficients, all
samples
Sample
Warmth-
competence
Status-
competence
Competition-
warmth
Competition-
competence
Status-
warmth
Ginir r r r r
Mexico �.19 Unavailable Unavailable Unavailable Unavailable 48.2
US (non-student) �.09 .97*** �.53** .55** �.10 45.0
South Korea �.07 .91*** �.42* .83*** �.30 31.4
Canada �.03 .91*** �.56** .19 �.18 32.1
US (student) �.03 .98*** �.67*** .33 .01 45.0
Peru �.01 .97*** �.10 .97*** .10 49.6
Japan .03 .88*** �.39 .06 .03 37.6
Israel (Jews) .08 .99*** �.59** .48* .07 39.2
South Africa .11 .78*** �.18 .19 �.25 65.0
Hong Kong .12 .99*** �.37† .26 .12 53.3
Italy (student) .23 .79*** �.70*** .15 �.14 32.0
Chile .24 .97*** �.14 .75** .11 52.4
Bolivia (UMSA) .26 .90*** .03 .76*** .02 58.2
Switzerland
(German)
.28 .93*** �.67*** �.10 .03 33.7
Italy (non-student) .31 .75*** �.68*** .14 �.10 32.0
Costa Rica .36 .89*** �.36†† .66*** .05 48.0
Bolivia (UCB) .39* .94*** �.17 .48** .25 58.2
Bolivia (UPB) .41* .94*** �.11 .49** .36 58.2
England .46* .93*** �.53** �.35† .48** 34.0
Belgium .48* .95*** �.92*** �.45† .65** 28.0
New Zealand (Maori) .48** .96*** �.02 .40* .42* 36.2
New Zealand
(European)
.51** .91*** �.30 .27 .34 36.2
Bolivia (UPB-CB) .54** .91*** .25 .64*** .42* 58.2
Australia (European) .56** .94*** �.73*** �.34 .45* 30.5
Uganda .57** .92*** .41 .89*** .40 45.7
Spain .60** .92*** �.35†† .09 .53** 32.0
Greece .61** .81*** �.14 .51** .37 33.0
Portugal .61** .74*** �.67** �.21 .31 38.5
Australia (Asian) .65*** .95*** .01 .45* .63*** 30.5
Switzerland (French
student)
.65** .87*** �.80*** �.48* .34 33.7
India .72*** .87*** .01 .51** .53*** 36.8
Malaysia .74*** .93*** .04 .49** .69*** 44.1
Switzerland (Italian) .76*** .76*** �.18 .00 .39* 33.7
Northern Ireland
(Catholic)
.77*** .95*** �.69*** �.33 .70*** 34.0
Switzerland (French
non-student)
.80*** .84*** �.66*** �.40† .46* 33.7
Israel (Arabs) .81*** .80*** .45* .66*** .60** 39.2
Northern Ireland
(Protestant)
.91*** .92*** �.25 �.07 .78*** 34.0
Note. Data are reported according to the warmth and competence correlations: Ascending order.
*p � .05; **p � .01;***p � .001; †p between .052 and .058; ††p = .07.
734 Federica Durante et al.
aforementioned 16 coefficients were also small, ranging from .0002 to .1283. The
remaining 21 W-C correlation coefficients were positive and significant, ranging from
r = .39 to .91 (all ps < .05; R2 from .15 to .83), that is, a lower degree of ambivalence. As
expected, the percentage of target groups gathered in ambivalent clusters was
Catholics
Christians
Women
Northerners
Fresas
Gays
Politicians
Intellectuals
Jews Nerds
Rich people
Elderly
Disabled people
Hippies
Natives Blacks
Poor people Sourthernes
War
mth
Competence
HC-HW
LC-LW
HW-LC
HC-LW
High
Low
Low
Figure 1. Mexican sample, four-cluster solution. Stars indicate cluster centres. H and L, respectively,
indicate high and low; W, warmth; C, competence. The term ‘fresas’ refers to rich, spoiled kids.
AboriginalAustralians
MuslimsRefugees
Teenagers
Unemployed
Black
Children
Fat People
Disabled people
ImmigrantsIndians
Poor
Asian
Asian Australians
Men
Rich
Tradies
Students
White collar
Australians
Blue collarBuddhists
CatholicsChristians
Elderly
Gay
Middle classWhiteWhit
e Aust
ralian
sWomen
War
mth
Competence
High
HighLow
Low
LC-LW
LC-M/LW
LC-M/HW HC-HW
HC-MW
Figure 2. European Australian sample, five-cluster solution. Stars indicate cluster centres. H, M, and L,
respectively, indicate high, medium, and low; W, warmth; C, competence.
Income inequality and ambivalent stereotypes 735

significantly higher in samples with small, non-significant W-C correlations (on average,
60.82%) than in samples with positive, significant ones (on average, 44.72%),
t(35) = 2.03, p = .05. Further correlations compared the percentages of HC-LW and
LC-HW groups in each sample with the W-C correlations. The W-C coefficientssignificantly correlated with percentages of LC-HW groups, r = �.48, p < .01, but did
notwith percentages of HC-LW groups, r = .09, p = .58, suggesting that our ambivalence
index was mostly driven by the LC-HW combinations.
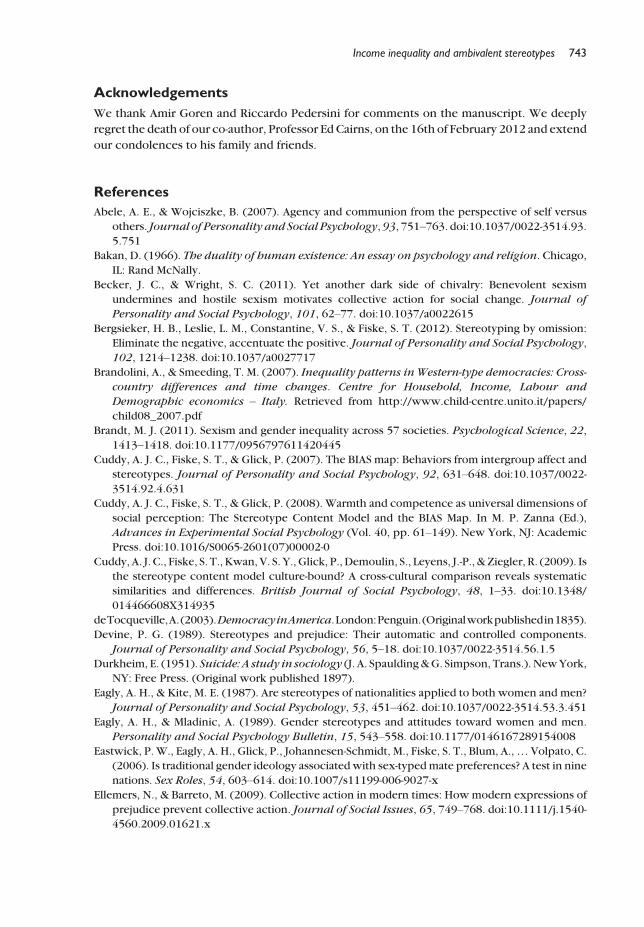
Next, Fisher’s z-transformation normalized the distribution of W-C coefficients,
allowing us to correlate the standardized coefficients with the Gini ones. A significant
correlation, r = �.34, p < .05, indicated that more ambivalent societies are also generally
more unequal, supporting Hypothesis 5 (see Figure 3). Inequality emphasizes more than
one dimension of intergroup perception (not just unequal status-competence but alsodifferentiated competition-warmth) to compensate.5
The robustness of the inequality-ambivalence association was tested in several ways.
First, in a regression analysis, Gini coefficients (centred around the mean), the number of
groups rated by each sample (centred around the mean), and their interaction were
regressed onto W-C correlations (Fisher standardized) to rule out the possibility that the
number of target groups evaluated in each sample had an impact on theW-C correlation’s
size and, therefore, on the inequality-ambivalence association. The model explained
15.2% of variance. Gini was the best and only predictor (b = �.33, p = .05); neither thenumber of groups (b = .09, p = .60) nor the interaction term (b = .16, p = .36) was
significant.
Second, we further tested Hypothesis 5 by controlling for other potential related
factors. Wilkinson and Pickett (2009) suggest that when inequality is measured across
whole societies versus small areas, its association with social problems is ‘stronger with
inequality than with average income, and, in most cases, controlling for average income
strengthens the associations with inequality’ (p. 498). Therefore, in a regression analysis,
both our measure of income inequality (Gini) and a measure of average income (GDP per
capita 2009)6 were regressed onto the Fisher standardized W-C correlations. Results
showed that Gini predicted W-C correlations (b = �.39, p = .08) whereas GDP did not
(b = �.09, p = .69; R2 = 11.6%).
Furthermore, arguably, the ideology concerning power and inequality in a given
society (and not income inequality per se) might be responsible for the prevalence of
ambivalent stereotypes. To control for the role of ideology, the Distance Power Index
(PDI; Hofstede, 1980)7was considered. PDI indexes the extent towhich the less powerful
members of a society accept and expect power to be distributed unequally, in otherwords, indexes the extent towhich society’s inequality is endorsed by those at the bottom
of the social ladder as much as by those at the top. ‘The fundamental issue here is how a
societyhandles inequalities amongpeople’ (http://geert-hofstede.com/dimensions.html).
5 A relevant issue not addressed in the present work concerns the country’s ethnic mix of each sample, whichmight be reflected inthe selected target groups. In fact, a society’s remarkable ethnic divisions might account for the relationship between incomeinequality and social problems. However, although Wilkinson and Pickett (2009) argue that ethnicity is an important socialmarker for status differentiation, and, as such, it might worsen the social and health problems deriving from status, their review ofmore than 150 studies suggests a primacy of income inequality over ethnicity (see alsoWilkinson& Pickett, 2010). Therefore, theethnic composition of the societies investigated here are unlikely to account for the relationship between inequality andambivalence.6GDP per capita 2009 was retrieved from The World Bank, http://data.worldbank.org/country, August 2011.7 PDI was retrieved from Geert Hofstede, http://geert-hofstede.com/countries.html, December 2011 (PDI is not available forBolivia and Uganda, i.e., five samples).
736 Federica Durante et al.

Gini and PDI coefficients were regressed onto the Fisher standardized W-C correlations,
and results showed that Gini predictedW-C correlations (b = �.39, p < .05)whereas PDI
did not (b = �.06, p = .74; R2 = 16.9%).8
Status-competence and competition-warmth correlations were also Fisher standard-ized and correlatedwithGini coefficients. TestingHypothesis 6, competition-warmth and
Gini coefficients significantly correlated, r = .48, p < .01, indicating that more equal
societies show stronger negative competition-warmth associations; in other words, more
equality, more dislike for competitive groups. In unequal societies, competition is more
acceptable. Testing Hypothesis 7, no significant pattern was found for the Gini and the
status-competence correlations (r = .21, p = .23).
Finally, we checked for the unpredicted structure-trait combinations: Status-warmth
and competition-competence correlations. As previously, they were calculated at thelevel of target groups within each sample; both unpredicted patterns were inconclusive:
For competition-competence, average r = .26, 16 positive correlations (range .40–.97, allps < .05), four negative correlations (r = �.48, p < .05; three marginally significant,
r = �.45, �.40, �.35, all ps < .06), the remaining 16 were non-significant. The status-
warmth average r = .27, 14 positive correlations (range .39–.78, all ps < .05), the
remaining non-significant (see Table 1). Fisher standardized correlations with Gini
coefficients showed that Gini coefficients significantly correlated with the competition-
competence correlations (r = .49, p < .01), indicating that in more equal societies beingcompetitive does not necessarily imply being competent. Gini and status-warmth
coefficients were only marginally associated (r = �.29, p = .09), suggesting a tendency,
in more egalitarian settings, to perceive high-status groups as warm.
Australia (Asians)
Australia (Europeans)
Belgium
Bolivia (UCB)
Bolivia (UMSA)
Bolivia (UPB)
Bolivia (UPB-BC)
Canada
Chile Costa Rica
Greece
Hong Kong
India
Israel (Jews)
Israel (Arabs)
Italy (student)
Italy (non-student)
Japan
Malaysia
Mexico
Northern Ireland (Catholic)
Northern Ireland (protestant)
New Zealand (European)New Zealand (Maori)
Peru
Portugal
South Africa
South Korea
Spain
Switzerland (German)
Switzerland (Italian)
Uganda
England
US (non student )US (student)
W-C
cor
rela
tion
GINI
Switzerland (French student)
Switzerland (French non-student)
Figure 3. Gini coefficients and warmth-competence (W-C) Fisher standardized correlations, all
samples.
8 A regression analysis including Gini coefficients, and both GDP and PDI was also performed. Gini predicted W-C correlations(b = �.42, p = .053) whereas GDP (b = �.06, p = .80) and PDI (b = �.08, p = .69) did not (R2 = 17.1%).
Income inequality and ambivalent stereotypes 737

All the SCM correlations illustrated above and the Gini coefficients were finally
correlated across samples. As Table 2 shows, when ambivalence is higher (i.e., low W-C
correlations), both structural factors (i.e., status and competition) are more strongly
related to competence. For lower degrees of ambivalence instead (i.e., high W-Ccorrelation), status is associated with warmth. This latter result is not surprising given
the very high status-competence correlation that we consistently find, which implies
that any dimension correlating with competence (warmth in this case) will also
correlate with status. Considering the Gini index, the cross-sample correlations
therefore suggest that less egalitarian societies show more ambivalent stereotypes, and
both high status and competition lead to perceiving groups as competent. More
egalitarian societies, instead, have fewer ambivalent stereotypes, status and competition
do not necessarily imply competence, and high-status groups tend to be perceived aswarm.
Finally, given the cross-cultural nature of our data, the fact that scales’ reliabilities,
and sample sizes varied noticeably across countries, the SCM correlations and the
moderating role played by income inequality were checked using meta-analytic
techniques, which allow weighting correlations to minimize the variance between
samples, and to correct for the unreliability of measures. Hedges and colleagues’ method
(Hedges & Olkin, 1985; Hedges & Vevea, 1998) was applied, and random-effects models
were performed.9 On each SCM index, two meta-analyses were carried out: First, assuggested by Hedges and Vevea (1998), on Fisher standardized correlations; second, as
recommended by Hunter and Schmidt (2004), on correlations corrected for unreliability
(see Lipsey & Wilson, 2001 for the formulas used). Inverse-variance-weighted mean
effect sizes concerning the SCM correlations are summarized in Table 3. The
significance of the average effect sizes can be inferred from the boundaries of the 95%
confidence intervals constructed around the mean effect size, which in all cases
presented in Table 3 do not contain zero.
Next, inverse-variance-weighted regressions (random-effects model) assessed therelationship between SCM correlations and income inequality. Weighted regressions
were performed on both Fisher standardized and corrected for unreliability correlations.
Results, summarized in Table 4, corroborated our findings and provided some support for
our Hypothesis 7. In fact, when the status-competence correlations were corrected for
unreliability, the Gini index resulted a significant moderator of such a relationship,
namely, more inequality more competence for high-status groups. In contrast, the
unpredicted, marginally significant relationship between income inequality and status-
warmth associations disappeared when correlations were corrected for unreliability.Finally, note that inverse-variance-weighted regressions including Gini coefficients and
other potential moderators (i.e., GDP and PDI) showed again the moderating role of
income inequality on our W-C correlation (Fisher correlations: b = �.41, p < .05;
9 All meta-analytic calculations reported in the present study were performed using the SPSS macro developed byWilson (2005).Random-effects models were chosen because they account for both within-study variability and variability arising from differencesbetween studies, in this case samples (see Hedges & Vevea, 1998; Hunter & Schmidt, 2000). In the Hedges and Vevea’s (1998)method, random-effects models weight each study (i.e., sample) by the inverse of the sampling variance plus a constant thatrepresents the variability across the population effects (Lipsey &Wilson, 2001). According to several authors, real-world data arelikely to have heterogeneous population effect sizes (e.g., Field, 2001, 2003; Hunter & Schmidt, 2000, 2004), and random-effects models should be the default approach in social sciences (Field & Gillett, 2010). Furthermore, random-effects models‘allow inferences that generalize beyond the studies included in the meta-analysis (unconditional inferences)’ (Field & Gillett,2010, p. 673; see also Hedges & Vevea, 1998). Finally, the homogeneity test (Q statistic) of effect sizes was taken intoconsideration: When significant, it indicates that the variability across effect sizes exceeds what would be expected based onsampling error.
738 Federica Durante et al.

unreliability correction: b = �.46, p < .05), whereas results for GDP (Fisher correlations:
b = �.06, p = .79; unreliability correction: b = �.14, p = .53) and PDI (Fisher
correlations: b = �.07, p = .69; unreliability correction: b = �.07, p = .71) were non-
significant.
Table 3. Meta-analysis results. Random-effects models
Stereotype content
model correlations N K r1 95% CI (r1) I2 (r1) r2 95% CI (r2) I2 (r2)
Warmth-competence 3,229 37 .44 .33, .55 93% .51 .38, .65 88.6%
Status-competence 3,139 36 .92 .90, .94 93.2% 1.09 1.04, 1.13 0.6%
Competition-warmth 3,139 36 �.38 �.49, �.25 93.6% �.44 �.58, �.30 87.3%
Status-warmth 3,139 36 .29 .17, .40 91.4% .34 .20, .48 88.9%
Competition-competence 3,139 36 .34 .18, .48 95.5% .38 .21, .55 92.3%
Note. N = total sample size for the given meta-analysis; K = number of samples included in the meta-
analysis; r1 = inverse-variance-weighted mean effect size calculated on Fisher standardized correlations;
95%CI = 95% confidence interval for the inverse-variance-weighted mean effect size (r1 and related 95%
CI reported in the table were converted back to r); r2 = inverse-variance-weighted mean effect size on
correlations corrected for unreliability; I2 = index of heterogeneity (Higgins & Thompson, 2002): It is
based on the Q homogeneity statistic (goodness of fit), I2 = (Q � (K � 1))/Q, multiplied by 100 to
express it as percentage. Larger values of I2, the more heterogeneity.
Table 4. Inverse-variance-weighted regression results (random-effectsmodel). Moderating role ofGini
coefficients on stereotype content model (SCM) correlations
SCM correlations
Fisher standardized r r Corrected for unreliability
b (95% CI) b p b (95% CI) b p
Warmth-competence �.01 (�0.03, �0.001) �.33 <.04 �.01 (�0.02, 0.002) �.27 .09
Status-competence .009 (�0.005, 0.022) .20 .22 .005 (0.0003, 0.009) .36 <.05Competition-warmth .02 (0.009, 0.03) .49 <.001 .02 (0.007, 0.04) .42 <.01Status-warmth �.01 (�0.02, 0.001) �.28 .08 �01 (�0.02, 0.003) �.26 .12
Competition-competence .03 (0.01, 0.04) .48 <.001 .03 (0.02, 0.05) .59 <.001
Table 2. Across samples correlations among stereotype content model (SCM) indices and Gini
coefficients
SCM indices 1 2 3 4 5 6
1. Warmth-competence –
2. Status-competence �.38* –
3. Competition-warmth .19 �.07 –
4. Competition-competence �.34* .22 .68*** –
5. Status-warmth .87*** �.01 .15 �.29† –
6. Gini �.34* .21 .48** .49** �.29† –
Note. The SCM correlations used to compute this table were Fisher standardized.
*p � .05; **p � .01; ***p � .001; †p = .09.
Income inequality and ambivalent stereotypes 739

Discussion
Data from 37 cross-national samples showed the expected significant, negativeassociation between SCM warmth-competence correlations and Gini coefficients,
indicating that income inequality implicates ambivalence. Furthermore, SCM’s hypoth-
esized negative relationship between competition and warmth emerged as even stronger
in more equal than unequal societies, showingmore dislike for competitive groups when
income differences are smaller. Finally, more equal societies do not necessarily perceive
competitive groups as competent.
The SCM hypothesizes that many societal stereotypes are ambivalent. The present
work supported this assumption, but also that different societies display different degreesof ambivalence, and that these relate to the societies’ income differences. Warmth and
competence here behaved consistently with the compensation effect (Judd et al., 2005),
namely, groups perceived as low on one dimension are raised on the other. That such
compensation appeared stronger in more unequal societies suggests that the more
income inequality, the more social groups need to be rewarded, as if actual economic
disparities are rationalized in social judgments.
Stereotype content model also hypothesizes that status predicts competence,
whereas competition predicts (low) warmth. Status did predict competence in allsamples, but this structure-trait combination did not correlate with societal income
inequality, suggesting that bothmore and less equal societies share themeritocratic belief
that status links to talent and abilities. Alternatively, as shown in Table 4, this result might
be due to an error of measurement. In fact, when the status-competence correlations
were corrected for unreliability, the Gini index became a significant moderator, showing
that themore income inequality themore high-status groups are perceived as competent.
Therefore, although this issue needs to be further investigated, it seems that more
unequal societies tend to endorse meritocracy more than relatively equal ones,concealing inequality through exaggerating perceived status differences. Relatedly,
status-warmth correlations were only marginally associated with income inequality,
suggesting that in relatively equal countries, high-status groups also tend to be perceived
as warm. However, when correlations were corrected for measures’ unreliability, this
tendency disappeared.
What instead consistently varies according to the degree of income inequality is the
SCM-predicted competition-warmth association. More egalitarian societies especially
perceive competitive groups as lacking warmth, suggesting that, given their relativeincome equality, competition seems unnecessary, so competitive groups are considered
untrustworthy and perhaps exploitative. On the other hand, when economic disparities
are bigger, people accept competition as inevitable: If competition is part of the system as
a legitimate way to improve one’s own position, then competitive groups are not disliked
as much as in more egalitarian settings. These different views of competition held by
relatively equal versus unequal societies also appear in the significant correlation between
Gini coefficients and competition-competence correlations: The more inequality, the
more people equate competition as competent (realistic behaviour), whereas the moreequality, the less people think competition is necessarily competent.
Before discussing the theoretical and pragmatic implications of our findings, note that
the majority of our samples came from relatively equal countries (23 samples: Gini
between 28 and 39; 14 samples: Gini between 44 and 65). Adding data coming frommore
unequal countries as well as from countries with very high level of equality (e.g., Sweden,
Norway) would allow us to optimally test our hypotheses. Furthermore, our participants
740 Federica Durante et al.

were mostly students: Although convenience samples might seem risky, compared with
representative samples, as they would tend to limit our results only to college student
perceptions, this method is justified on three counts. First, the convenience samples,
being similar, would tend to decrease the predicted cultural differences, providing aconservative test of our hypotheses. Second, demographic differences within country do
not modify the results (Cuddy et al., 2007). Third, the SCM method asks for society’s
views, so it tends to emphasize a culturally shared lay theory of groups in society. Indeed,
as suggested elsewhere, people from the same culture, whether actively biased or not,
know their own cultural stereotypes (Devine, 1989; Fiske, 1993).
Nevertheless, especially in more unequal countries, access to higher education is
linked to socio-economic status; consequently, it could be argued that our evidence may
reflect the higher status people’s point of view. Although, as noted above, SCM theory andmethod have proven a pancultural tool for detecting societal beliefs, future studies should
extend these findings usingmore representative samples, and taking into account the role
of the respondents’ socio-economic position in addressing the ambivalence-inequality
hypothesis: This would control for the possibility that higher versus lower status groups
within a society would be more likely to hold ambivalent societal stereotypes in more
unequal versus equal contexts, helping, furthermore, to theoretically bridge an individual
level to a societal level analysis. However, United States, Italy, and Switzerland (French
canton) results for student and non-student samples were very similar, as were results fornon-student Maori (low-status group in NewZealand) and European NewZealanders (see
Table 1).
The findings shed new light on how stereotypes potentially exert control. Stereotypes
tell both how a given group of people allegedly do think, feel, behave (descriptively), and
how they supposedly should think, feel, behave (prescriptively; Fiske, 1993). The
descriptive and prescriptive aspects of stereotypes both exert social control, the
description because it anchors social interactions to what is commonly believed about a
certain group, the prescription because it demands the stereotyped group to conform tostereotypical expectations. In other words, ‘stereotypes reinforce one group’s or
individual’s power over another by limiting the options of the stereotyped group, so in this
way stereotypes maintain power’ and control (Fiske, 1993, p. 623). Furthermore,
ambivalent stereotypes are also more easily accepted by the targets because the negative
side of such beliefs is masked by the positive one (e.g., Eastwick et al., 2006). Thus,
descriptive and prescriptive aspects of ambivalent stereotypes may even be appealing
(hencemore constraining) for stereotyped peoplewhoperceive their group to be socially
appreciated inonewayor another (i.e.,warmthor competence). All this likely encouragespeople’s acquiescence, while discouraging, even under great social and economic
inequalities, social change and collective action.
This does not imply that people will never challenge unequal systems. What the
present work depicts is a static picture taken at a particular historical time. The literature
on active minorities, for instance, has documented the influence that, over time,
minority groups can exert on majorities, leading to system change; socio-psychological
reseach has devoted considerable attention to the conditions that facilitate collective
action and social change (see van Zomeren & Klandermans, 2011 [special issue]). Mostrelevant here, SCM links to the legitimacy and stability of status relations between
groups as theorized by Tajfel (1981). In a recent work by Oldmeadow and Fiske (in
press), groups were more differentiated on warmth in illegitimate than legitimate
systems, but on competence in stable than unstable systems, highlighting the
importance of the structural reality in shaping groups’ stereotypes. Therefore,
Income inequality and ambivalent stereotypes 741

ambivalent stereotypes may be the cognitive alternative available in unjust (illegitimate)
but stable systems. Future studies should investigate to what extent income inequality
affects people’s beliefs and behaviours when systems are perceived as legitimate/stable
versus illegitimate/unstable.However, because ‘the content of stereotypes can serve to maintain ideological
support for the prevailing social system’ (Kay et al., 2007, p. 312), and specific
ambivalent stereotypes link to system justification (Becker & Wright, 2011; Jost & Kay,
2005), ambivalence may be a system-justifying strategy endorsed at a macro-social level.
Nowadays, given the evolution of democratic systems around the world, many societies
(especially the most developed) need a way to maintain social control, supporting
equality while facing severe economic disparities among people. Ambivalent societal
stereotypes offer one solution. This seems indirectly supported by recent evidenceshowing that in the United States, ‘stereotypes of 10 ethnic and national groups over
75 years revealed that as anti-prejudice norms grew stronger, historically negative aspects
of stereotypes faded from mention’ (Bergsieker, Leslie, Constantine, & Fiske, 2012,
p. 1232), but the negative content is implied (Kervyn, Bergsieker, & Fiske, 2012), so
‘modern stereotype assessment methods replicated the contemporary pattern of often-
ambivalent stereotype content’ (Bergsieker et al., 2012, p. 1232). All these findings
highlight the insidious effects of ambivalent societal beliefs. The solution, however,
cannot be to go back to hostile and overt forms of stereotypes and prejudice. Therefore,future studies should investigate how to contrast the deterrent effects of ambivalence on
social change, especially in light of Wilkinson and Pickett’s (2010) argument: ‘The
historical evidence confirms the primacy of political will. Rather than greater equality
waiting till well-meaning governments think they can afford tomake societiesmore equal,
governments have usually not pursued more egalitarian policies until they thought their
survival depend on it’ (p. 241).
Arguably, over the past few decades, social psychology has progressively lost its
connection to sociology, neglecting the influence of structural factors on people’sbehaviours (Oishi, Kesebir, & Snyder, 2009): Modern social psychologists apparently lack
a ‘sociological imagination’ (Mills, 1959) or ‘the ability to look beyond personal
experience and immediate situations to see the influence of social forces operating in a
larger societal (or distal, macro) context’ (Oishi et al., 2009, p. 336). The importance of
considering distant factors was well documented, for example, in Durkheim’s (1897/
1951) classic analysis of howcollective factors, such as the degree of social integration and
moral regulation in a society, affected suicide rates across societies; inMcClelland’s (1961)
pioneeringwork connecting changes in need for achievementwithin a society to changesin its economic activities; and in Nisbett and Cohen’s (1996) work linking economic and
historical factors to violent behaviours in the Southern United States (i.e., the culture of
honour). Recently, Fiske (2011) argues for status as dividing people through upward envy
and downward scorn; Oishi, Kesebir, and Diener (2011) have shown how income
inequality (i.e., Gini) affected Americans’ happiness over the past 37 years; and Loughnan
et al. (2011) have demonstrated that greater self-enhancement is found in societies with
higher Gini. All this points out that the nature of people’s behaviour can be traced not only
in individuals but also in the collective reality created by groups, societies, institutions;that is, macro factors can explainmicro-psychological phenomena (Oishi et al., 2009; see
also Oishi & Graham, 2010). The current work likewise links distal factors (income
inequality) and social beliefs (ambivalent societal stereotypes) across nations. Here, some
sociological imagination appears.
742 Federica Durante et al.
Acknowledgements
We thank Amir Goren and Riccardo Pedersini for comments on the manuscript. We deeply
regret the death of our co-author, Professor Ed Cairns, on the 16th of February 2012 and extend
our condolences to his family and friends.
References
Abele, A. E., & Wojciszke, B. (2007). Agency and communion from the perspective of self versus
others. Journal of Personality and Social Psychology,93, 751–763. doi:10.1037/0022-3514.93.5.751
Bakan, D. (1966). The duality of human existence: An essay on psychology and religion. Chicago,
IL: Rand McNally.
Becker, J. C., & Wright, S. C. (2011). Yet another dark side of chivalry: Benevolent sexism
undermines and hostile sexism motivates collective action for social change. Journal of
Personality and Social Psychology, 101, 62–77. doi:10.1037/a0022615Bergsieker, H. B., Leslie, L. M., Constantine, V. S., & Fiske, S. T. (2012). Stereotyping by omission:
Eliminate the negative, accentuate the positive. Journal of Personality and Social Psychology,
102, 1214–1238. doi:10.1037/a0027717Brandolini, A., & Smeeding, T. M. (2007). Inequality patterns in Western-type democracies: Cross-
country differences and time changes. Centre for Household, Income, Labour and
Demographic economics – Italy. Retrieved from http://www.child-centre.unito.it/papers/
child08_2007.pdf
Brandt, M. J. (2011). Sexism and gender inequality across 57 societies. Psychological Science, 22,
1413–1418. doi:10.1177/0956797611420445Cuddy, A. J. C., Fiske, S. T., & Glick, P. (2007). The BIAS map: Behaviors from intergroup affect and
stereotypes. Journal of Personality and Social Psychology, 92, 631–648. doi:10.1037/0022-3514.92.4.631
Cuddy, A. J. C., Fiske, S. T., & Glick, P. (2008). Warmth and competence as universal dimensions of
social perception: The Stereotype Content Model and the BIAS Map. In M. P. Zanna (Ed.),
Advances in Experimental Social Psychology (Vol. 40, pp. 61–149). New York, NJ: Academic
Press. doi:10.1016/S0065-2601(07)00002-0
Cuddy, A. J. C., Fiske, S. T., Kwan, V. S. Y., Glick, P., Demoulin, S., Leyens, J.-P.,&Ziegler, R. (2009). Is
the stereotype content model culture-bound? A cross-cultural comparison reveals systematic
similarities and differences. British Journal of Social Psychology, 48, 1–33. doi:10.1348/014466608X314935
deTocqueville,A.(2003).DemocracyinAmerica.London:Penguin.(Originalworkpublishedin1835).
Devine, P. G. (1989). Stereotypes and prejudice: Their automatic and controlled components.
Journal of Personality and Social Psychology, 56, 5–18. doi:10.1037/0022-3514.56.1.5Durkheim, E. (1951). Suicide: A study in sociology (J. A. Spaulding&G. Simpson, Trans.). NewYork,
NY: Free Press. (Original work published 1897).
Eagly, A. H., & Kite, M. E. (1987). Are stereotypes of nationalities applied to both women and men?
Journal of Personality and Social Psychology, 53, 451–462. doi:10.1037/0022-3514.53.3.451Eagly, A. H., & Mladinic, A. (1989). Gender stereotypes and attitudes toward women and men.
Personality and Social Psychology Bulletin, 15, 543–558. doi:10.1177/0146167289154008Eastwick, P. W., Eagly, A. H., Glick, P., Johannesen-Schmidt, M., Fiske, S. T., Blum, A.,… Volpato, C.
(2006). Is traditional gender ideology associatedwith sex-typedmate preferences? A test in nine
nations. Sex Roles, 54, 603–614. doi:10.1007/s11199-006-9027-xEllemers, N., & Barreto, M. (2009). Collective action in modern times: How modern expressions of
prejudice prevent collective action. Journal of Social Issues, 65, 749–768. doi:10.1111/j.1540-4560.2009.01621.x
Income inequality and ambivalent stereotypes 743

Field, A. P. (2001). Meta-analysis of correlation coefficients: A Monte Carlo comparison of fixed and
random-effects methods. Psychological Methods, 6, 161–180. doi:10.1037//1082-989X.6.2.161Field, A. P. (2003). The problems in using fixed-effects models of meta-analysis on real-world data.
Understanding Statistics, 2, 77–96. doi:10.1207/S15328031US0202_02Field, A. P., & Gillett, R. (2010). How to do a meta-analysis. British Journal of Mathematical and
Statistical Psychology, 63, 665–694. doi:10.1348/000711010X502733Fiske, S. T. (1993). Controlling other people. The impact of power on stereotyping. American
Psychologist, 48, 621–628. doi:10.1037/0003-066X.48.6.621Fiske, S. T. (2011). Envy up, scorn down: How status divides us. New York, NY: Russell Sage.
Fiske, S. T. (2012). Journey to the edges: Social structures and neural maps of inter-group processes.
British Journal of Social Psychology, 51, 1–12. doi:10.1111/j.2044-8309.2011.02092.xFiske, S. T., Cuddy, A. J. C., & Glick, P. (2007). Universal dimensions of social perception: Warmth
and competence. Trends in Cognitive Sciences, 11, 77–83. doi:10.1016/j.tics.2006.11.005Fiske, S. T., Cuddy, A. J. C., Glick, P., & Xu, J. (2002). A model of (often mixed) stereotype
content: Competence and warmth respectively follow from the perceived status and
competition. Journal of Personality and Social Psychology, 82, 878–902. doi:10.1037//
0022-3514.82.6.878
Glick, P., & Fiske, S. T. (1996). The Ambivalent Sexism Inventory: Differentiating hostile and
benevolent sexism. Journal of Personality and Social Psychology, 70, 491–512. doi:10.1037/0022-3514.70.3.491
Glick, P., & Fiske, S. T. (2001). An ambivalent alliance: Hostile and benevolent sexism as
complementary justifications of gender inequality.AmericanPsychologist,56, 109–118. doi:10.1037/0003-066X.56.2.109
Glick, P., & Fiske, S. T. (2011). Ambivalent sexism revisited. Psychology of Women Quarterly, 35,
530–535. doi:10.1177/0361684311414832Glick, P., Fiske, S. T., Mladinic, A., Saiz, J. L., Abrams, D., Masser, B., … Lopez Lopez, W. (2000).
Beyondprejudice as simple antipathy: Hostile and benevolent sexism across cultures. Journal of
Personality and Social Psychology, 79, 763–775. doi:10.1037/0022-3514.79.5.763Glick, P., Lameiras, M., Fiske, S. T., Eckes, T., Masser, B., Volpato, C., … Wells, R. (2004). Bad but
bold: Ambivalent attitudes toward men predict gender inequality in 16 nations. Journal of
Personality and Social Psychology, 86, 713–728. doi:10.1037/0022-3514.86.5.713Hedges, L. V., & Olkin, I. (1985). Statistical methods for meta-analysis. Orlando, FL: Academic
Press.
Hedges, L. V., & Vevea, J. L. (1998). Fixed- and random-effects models in meta-analysis.
Psychological Methods, 3, 486–504. doi:10.1037/1082-989X.3.4.486Higgins, J. P. T., &Thompson, S.G. (2002).Quantifying heterogeneity in ameta-analysis. Statistics in
Medicine, 21, 1539–1558. doi:10.1002/sim.1186
Hofstede, G. (1980). Culture’s Consequences: International Differences in Work-related Values.
Beverly Hills, CA: Sage.
Hunter, J. E., & Schmidt, F. L. (2000). Fixed effects vs. random effects meta-analysis models:
Implications for cumulative research knowledge. International Journal of Selection and
Assessment, 8, 275–292. doi:10.1111/1468-2389.00156Hunter, J. E., & Schmidt, F. L. (2004). Methods of meta-analysis: Correcting error and bias in
research findings. (2nd ed.) Newbury Park, CA: Sage.
Jackman, M. R. (1994). The velvet glove: Paternalism and conflict in gender, class, and race
relations. Berkeley, CA: University of California Press.
Jost, J. T., & Banaji, M. R. (1994). The role of stereotyping in system justification and the production
of false consciousness. British Journal of Social Psychology, 33, 1–27. doi:10.1111/j.2044-8309.1994.tb01008.x
Jost, J. T., Banaji, M. R., & Nosek, B. A. (2004). A decade of system justification theory: Accumulated
evidence of conscious and unconscious bolstering of the status quo. Political Psychology, 25,
881–919. doi:10.1111/j.1467-9221.2004.00402.x
744 Federica Durante et al.

Jost, J. T., & Kay, A. C. (2005). Exposure to benevolent sexism and complementary gender
stereotypes: Consequences for specific and diffuse forms of system justification. Journal of
Personality and Social Psychology, 88, 498–509. doi:10.1037/0022-3514.88.3.498Judd, C. M., James-Hawkins, L. J., Yzerbyt, V., & Kashima, Y. (2005). Fundamental dimensions
of social judgment: Understanding the relations between judgments of competence and
warmth. Journal of Personality and Social Psychology, 89, 899–913. doi:10.1037/0022-3514.89.6.899
Katz, I., & Hass, R. G. (1988). Racial ambivalence and American value conflict: Correlational and
priming studies of dual cognitive structures. Journal of Personality and Social Psychology, 55,
893–905. doi:10.1037/0022-3514.55.6.893Kay, A. C., Gaucher, D., Peach, J. M., Friesen, J., Laurin, K., Zanna, M. P., & Spencer, S. J. (2009).
Inequality, discrimination, and the power of the status quo: Direct evidence for a motivation to
view what is as what should be. Journal of Personality and Social Psychology, 97, 421–434.doi:10.1037/a0015997
Kay, A. C., & Jost, J. T. (2003). Complementary justice: Effects of “poor but happy” and “poor but
honest” stereotype exemplars on system justification and implicit activation of the justice
motive. Journal of Personality and Social Psychology, 85, 823–837. doi:10.1037/0022-3514.85.5.823
Kay, A. C., Jost, J. T., Mandisodza, A. N., Sherman, S. J., Petrocelli, J. V., & Johnson, A. L. (2007).
Panglossian ideology in the service of system justification: How complementary stereotypes
help us to rationalize inequality. Advances in Experimental Social Psychology, 39, 305–358.doi:10.1016/S0065-2601(06)39006-5
Kervyn, N., Bergsieker, H. B., & Fiske, S. T. (2012). The innuendo effect: Hearing the positive but
inferring the negative. Journal of Experimental Social Psychology, 48, 77–85. doi:10.1016/j.jesp. 2011.08.001
Kervyn, N., Yzerbyt, V. Y., & Judd, C. M. (2010). Compensation between warmth and competence:
Antecedents and consequences of a negative relation between the two fundamental dimensions
of social perception. European Review of Social Psychology, 21, 155–187. doi:10.1080/13546805.2010.517997
Lane, R. E. (1959). The fear of equality.American Political Science Review, 53, 35–51. doi:10.2307/1951729
Lipsey, M. W., & Wilson, D. B. (2001). Practical meta-analysis. Thousand Oaks, CA: Sage
Publications.
Loughnan, S., Kuppens, P., Allik, J., Balazs, K., de Lemus, S., Dumont, K., & Haslam, N. (2011).
Economic inequality is linked to biased self-perception. Psychological Science, 22, 1254–1258.doi:10.1177/0956797611417003
McClelland, D. C. (1961). The achieving society. New York, NY: D. Van Nostrand.
Mills, C. W. (1959). Sociological imagination. New York, NY: Oxford University Press.
Nisbett, R. E., & Cohen, D. (1996). Culture of honor: The psychology of violence in the South.
Boulder, CO: Westview.
Oishi, S., & Graham, J. (2010). Social ecology: Lost and found in psychological science. Perspectives
on Psychological Science, 5, 356–377. doi:10.1177/1745691610374588Oishi, S., Kesebir, S., & Diener, E. (2011). Income inequality and happiness. Psychological Science,
22, 1095–1100. doi:10.1177/0956797611417262Oishi, S., Kesebir, S., & Snyder, B. H. (2009). Sociology: A lost connection in social psychology.
Personality and Social Psychology Review, 13, 334–353. doi:10.1177/1088868309347835Oldmeadow, J. A., & Fiske, S. T. (in press). Contentment to resentment: Variation in stereotype
content across status systems. Analysis of Social Issues and Public Policy. doi:10.1111/j.1530-
2415.2011.01277.x
Rosenberg, S., Nelson, C., & Vivekananthan, P. (1968). A multidimensional approach to the
structure of personality impressions. Journal of Personality andSocial Psychology,9, 283–294.doi:10.1037/h0026086
Income inequality and ambivalent stereotypes 745

Schmitt,M.T., Branscombe,N.R.,&Kappen,D.M. (2003). Attitudes toward group-based inequality:
Social dominance or social identity? British Journal of Social Psychology, 42, 161–186. doi:10.1348/014466603322127166
Stott, C., & Drury, J. (2004). The importance of social structure and social interaction in stereotype
consensus and content: Is the whole greater than the sum of its parts? European Journal of
Social Psychology, 34, 11–23. doi:10.1002/ejsp.183Tajfel, H. (1981). Human groups and social categories. Cambridge: Cambridge University Press.
Wilkinson, R. G., & Pickett, K. E. (2007). The problems of relative deprivation: Why some societies
do better than others. Social Science & Medicine, 65, 1965–1978. doi:10.1016/j.socscimed.
2007.05.041
Wilkinson, R. G., & Pickett, K. E. (2009). Income inequality and social dysfunction. Annual Review
of Sociology, 35, 493–511. doi:10.1146/annurev-soc-070308-115926Wilkinson, R. G., & Pickett, K. E. (2010). The spirit level. Why equality is better for everyone.
London: Penguin.
Wilson, D. B. (2005).Meta-analysis macros for SAS, SPSS, and Stata. Retrieved from http://mason.
gmu.edu/~dwilsonb/ma.html
van Zomeren, M., & Klandermans, B. (Eds). (2011). Towards innovation in theory and research on
collective action and social change [Special issue]. British Journal of Social Psychology, 50(4).
doi:10.1111/j.2044-8309.2011.02078.x
Zinn, H. (1968). Disobedience and democracy: Nine fallacies on law and order. New York:
Vintage.
Received 4 August 2011; revised version received 22 June 2012
Supporting Information
The following supporting informationmay be found in the online edition of the article:
Appendix SI.A. Scales, main survey.
Appendix SI.B. Competence andwarmthmeans for eachcluster,within each sample.
Table SI.1. Demographic information, all samples, preliminary groups-listing study.
Table SI.2. Demographic information, all samples, main survey.
Please note:Wiley-Blackwell are not responsible for the content or functionality of any
supporting materials supplied by the authors. Any queries (other than missing
material) should be directed to the corresponding author for the article.
746 Federica Durante et al.