Embed Size (px)
Citation preview

National Survey Report of PV Power Applications in Sweden 2019
PV
PS
Task 1 Strategic PV Analysis and Outreach

Task 1 – National Survey Report of PV Power Applications in Sweden
What is IEA PVPS TCP?
The International Energy Agency (IEA), founded in 1974, is an autonomous body within the framework of the Organization for Economic Cooperation and Development (OECD). The Technology Collaboration Programme (TCP) was created with a belief that the future of energy security and sustainability starts with global collaboration. The programme is made up of 6 000 experts across government, academia, and industry dedicated to advancing common research and the application of specific energy technologies.
The IEA Photovoltaic Power Systems Programme (IEA PVPS) is one of the TCP’s within the IEA and was established in 1993. The mission of the programme is to “enhance the international collaborative efforts which facilitate the role of photovoltaic solar energy as a cornerstone in the transition to sustainable energy systems.” In order to achieve this, the Programme’s participants have undertaken a variety of joint research projects in PV power systems applications. The overall programme is headed by an Executive Committee, comprised of one delegate from each country or organisation member, which designates distinct ‘Tasks,’ that may be research projects or activity areas.
The IEA PVPS participating countries are Australia, Austria, Belgium, Canada, Chile, China, Denmark, Finland, France, Germany, Israel, Italy, Japan, Korea, Malaysia, Mexico, Morocco, the Netherlands, Norway, Portugal, South Africa, Spain, Sweden, Switzerland, Thailand, Turkey, and the United States of America. The European Commission, Solar Power Europe, the Smart Electric Power Alliance (SEPA), the Solar Energy Industries Association and the Cop- per Alliance are also members.
Visit us at: www.iea-pvps.org
What is IEA PVPS Task 1?
The objective of Task 1 of the IEA Photovoltaic Power Systems Programme is to promote and facilitate the exchange and dissemination of information on the technical, economic, environmental and social aspects of PV power systems. Task 1 activities support the broader PVPS objectives: to contribute to cost reduction of PV power applications; to increase awareness of the potential and value of PV power systems; to foster the removal of both technical and non-technical barriers and to enhance technology co-operation. An important deliverable of Task 1 is the annual “Trends in photovoltaic applications” report. In parallel, National Survey Reports are produced annually by each Task 1 participant. This document is the country National Survey Report for the year 2019. Information from this document will be used as input to the annual Trends in photovoltaic applications report.
Authors
Main Content: Johan Lindahl, Mårten Dahlberg Rosell and Amelia Oller Westerberg
Data: Swedish Energy Agency, Becquerel Sweden AB, Svenska Kraftnät and Energiföretagen
Analysis: Johan Lindahl and Jeffrey Berard
DISCLAIMER
The IEA PVPS TCP is organised under the auspices of the International Energy Agency (IEA) but is functionally and legally autonomous. Views, findings and publications of the IEA PVPS TCP do not necessarily represent the views or policies of the IEA Secretariat or its individual member countries.
COVER PICTURE
618 PV modules on 86 separate roof surfaces, Ramsvik Stugby & Camping, Bohuslän Sweden Foto: Apptek Teknik Applikationer AB

Task 1 – National Survey Report of PV Power Applications in Sweden
2
TABLE OF CONTENTS
1 Installation Data ................................................................................................................................... 4
Applications for Photovoltaics ................................................................................................ 4
Annual installed PV capacity .................................................................................................. 4
Total installed PV capacity ..................................................................................................... 7
PV market segments .............................................................................................................. 10
The geographical distribution of PV in Sweden ...................................................................... 12
Key enablers of PV development ........................................................................................... 14
PV in the broader Swedish power system .............................................................................. 16
2 Competitiveness of pv electricity .......................................................................................................... 18
Module prices ......................................................................................................................... 18
System prices ........................................................................................................................ 19
Financial parameters and specific financing programs .......................................................... 25
Specific investments programs .............................................................................................. 25
Additional Country information ............................................................................................... 26
Electricity prices ..................................................................................................................... 27
Global solar radiation ............................................................................................................. 31
Production costs of PV electricity ........................................................................................... 32
3 Policy Framework ................................................................................................................................. 36
National targets for PV ........................................................................................................... 37
Direct support policies for PV installations ............................................................................. 37
Self-consumption measures ................................................................................................... 44
Collective self-consumption, community solar and similar measures..................................... 49
Tenders, auctions & similar schemes ..................................................................................... 49
Utility-scale measures including floating and agricultural PV ................................................. 49
Social Policies ........................................................................................................................ 49
Retrospective measures applied to PV .................................................................................. 49
Indirect policy issues .............................................................................................................. 49
Financing and cost of support measures ............................................................................... 52
4 Industry ................................................................................................................................................ 53
Production of feedstocks, ingots and wafers .......................................................................... 53
Production of photovoltaic cells and modules ........................................................................ 53

Task 1 – National Survey Report of PV Power Applications in Sweden
3
Manufacturers and suppliers of other components ................................................................ 55
R&D companies and companies with R&D divisions in Sweden ............................................ 58
Installers, retailers and wholesalers of PV systems ............................................................... 61
Consultancy firms................................................................................................................... 63
5 Highlights of R&D ................................................................................................................................. 64
PV research groups ............................................................................................................... 64
Public budgets for PV research .............................................................................................. 66
6 PV in the Economy ............................................................................................................................... 66
Labour places ........................................................................................................................ 66
Business value ....................................................................................................................... 68
7 Interest From Electricity Stakeholders .................................................................................................. 69
Structure of the electricity system .......................................................................................... 69
Interest from electricity utility businesses ............................................................................... 69
Interest from municipalities and local governments................................................................ 70
8 Highlights and Prospects ..................................................................................................................... 71
Highlights ............................................................................................................................... 71
Prospects ............................................................................................................................... 71
9 References ........................................................................................................................................... 72

Task 1 – National Survey Report of PV Power Applications in Sweden
4
1 INSTALLATION DATA
The photovoltaic (PV) power systems market is defined as the market of all nationally installed (terrestrial) PV applications with a PV capacity of 40 W or more. A PV system consists of modules, inverters, batteries and all installation and control components for modules, inverters and batteries. Other applications such as small mobile devices are not considered in this report.
For the purposes of this report, PV installations are included in the 2019 statistics if the PV modules were installed and connected to the grid between January 1st and December 31st of 2019, although commissioning may have taken place at a later date.
Applications for Photovoltaics
The installation of grid connected PV systems in Sweden can be said to have taken off in 2006, when about 300 kW was installed that year. Before that only a few grid-connected systems were installed each year. Until 2006, the Swedish PV market almost exclusively consisted of a small but stable off-grid market where the majority constituted of systems for holiday cottages, marine applications and caravans. This domestic off-grid market has been quite stable throughout the years. But since 2007 more grid-connected capacity than off-grid capacity has been installed annually. The grid-connected market is almost exclusively made up by distributed roof-mounted systems installed by individual homeowners, companies, municipalities, farmers, etc. Already from the start, the Swedish distributed market has been driven by the self-consumption business model, as there has never existed a feed-in-tariff in Sweden. Capital subsidies in combination with different types of schemes that add value for the excess electricity has until now been crucial for this business model to work in Sweden. About 46 % of the installed grid-connected PV power are residential systems and 46 % are installed on commercial facilities.
With regards to Building-Integrated PV (BIPV) in the decentralized market segment, several companies offer different solutions and the feeling (without any backing of statistics) is that the number of BIPV projects in Sweden is increasing.
So far only a couple of relatively small ground-mounted centralized PV parks, 5 % of the grid-connected market, have been built. But the interest and activity in this market segment has increased a lot in 2019 and the number and sizes of centralized PV parks are expected to increase in the coming years.
Annual installed PV capacity
The installation rate of PV continues to increase at a high speed in Sweden. A total of 288.93 MW was installed in 2019, as shown in Figure 1 and Table 2. This means that the annual Swedish PV market grew with 83 % compared to the 157.92 MW that was installed in 2018.
In recent years, the market for grid-connected PV systems has grown rapidly in Sweden. This continued in 2019 as another 286.99 MW of grid-connected systems were installed under the year, an 88 % increase compared to the 155.89 MW installed in 2018.
Of the grid-connected PV capacity installed in 2019, 11.45 MW is estimated to be centralized PV parks and 275.55 MW distributed PV systems for primary self-consumption. By that, the annual market of centralized PV in Sweden grew with about 22 % and the distributed annual market by 61 % as compared with 2018, when approximately 9.40 MW of centralized and 170.75 MW of distributed PV was installed.
Sweden has a stable off-grid PV market. In 2017 and 2018, about 2.06 MW and 2.03 MW respectively of off-grid applications were sold. In 2019 the off-grid market decreased slightly to 1.94 MW.

Task 1 – National Survey Report of PV Power Applications in Sweden
5
Table 1: Annual PV power installed during calendar year 2019.
Installed PV capacity in 2019 [MW] AC or DC
PV capacity
Off-grid 1.94 DC
Decentralized 275.55 AC
Centralized 11.45 AC
Total 288.93 AC
Table 2: PV power installed during calendar year 2019.
Installed PV
capacity [MW]
Installed PV
capacity [MW]
AC or DC
Grid-
connected
BAPV Residential
275.55
131.71 AC
Commercial 142.90 AC
Industrial 0.94 AC
BIPV Residential Unknown
(Included in BAPV)
Unknown AC
Commercial Unknown AC
Industrial Unknown AC
Utility-scale
Ground-mounted
11.45
6.65 AC
Floating 0 AC
Agricultural 4.80 AC
Off-grid Residential
1.94
0.69 DC
Commercial 0.14 DC
Mobile applications 1.11 DC
Total
288.93 AC
Figure 1: Annual installed PV capacity in Sweden.

Task 1 – National Survey Report of PV Power Applications in Sweden
6
Table 3: Data collection process
Is the data reported in AC or DC? The reported data is in AC
Is the collection process done by an official body or a private company/Association?
Public body, the Swedish Energy Agency (grid connected data)
Company, Becquerel Sweden (off-grid data)
Link to official statistics (if this exists) http://www.energimyndigheten.se/statistik/den-officiella-statistiken/statistikprodukter/natanslutna-solcellsanlaggningar/
The numbers for total installed PV capacity by the end of 2019 listed in this report are based on two data sources. All the grid-connected PV capacity is collected through surveys sent out by Statistics Sweden, SCB, (Statistiska Centralbyrån) on behalf of the Swedish Energy Agency (Energimyndigheten) to all the Swedish grid operators [1]. As it is mandatory to notify the grid operator when a PV system is connected to the grid, the grid operators should have all the grid-connected PV systems within their grid area registered, and they are obliged to share this information with the Swedish Energy Agency. The accuracy of the grid connected capacity is therefore judged to be high.
The official collection of grid-connected PV capacity by the surveys to the grid operators has only been carried out for the years of 2016, and thereafter. The historic numbers for the installed grid-connected PV capacity (and off-grid PV capacity) in Sweden until the end of 2015 are therefore exclusively based on the yearly collection of the sales statistics by the Swedish representatives in IEA PVPS task 1. For 2016 and 2017 weighted average number between the sales statistics and the statistics from the grid operators has been used due to uncertainties about the quality of the grid operators’ statistics these years. For a more detailed description see the 2018 version of National Survey Report of PV Application in Sweden [2].
Data for off-grid PV systems are by definition impossible to get from the grid operators. The information about installed off-grid PV capacity is therefore based on cumulative sales statistics that have been collected directly from company representatives throughout the years by the Swedish representatives in IEA PVPS task 1. Off-grid systems older than 20 years are assumed to have been decommissioned by now and are therefore withdrawn from the cumulative sales statistics to obtain the total off-grid capacity in Sweden. The companies that have contributed off-grid data for 2019 are listed in section 4.6. Older Swedish National Survey Reports list the active companies for the sales statistics for their respective year. The accuracy of the off-grid capacity is judged to be much lower than for the grid connected capacity.

Task 1 – National Survey Report of PV Power Applications in Sweden
7
Total installed PV capacity
The total grid-connected capacity at the end of 2019 was 698.05 MW, according to the grid operators. Out of this capacity about 30.52 MW is estimated to be centralized PV and 667.53 MW to be distributed. In addition, a total of 18.27 MW of off-grid PV applications have been sold in Sweden since 1993, wherein 15.82 MW is estimated to still be in operation.
By adding the off-grid and the grid-connected PV capacities together, one can conclude a total of 713.87 MW of electricity producing PV power by the end of 2019, illustrated in Figure 2 and summarized in Table 4. The total installed PV capacity grew by 68 % in 2019, which is in line with the marked development over the five previous years, where the total market grew by 59 % (2018), 46 % (2017), 47 % (2016), 63 % (2015) and 85 % (2014).
The strong overall growth in recent years started with the introduction of the direct capital subsidy system (see section 3.2.1) in 2006, and has since then been fuelled by the declining system prices (see section 2.2), high popularity among the public (see section 1.6.2), a growing interest from utilities (see 7.2) and an ongoing reformation work from the Government to simplify the rules for micro-producers (see section 3.3).
In total there were 43 944 grid-connected PV systems in Sweden by the end of 2019. The number of off-grid systems is unknown. A majority of the grid-connected PV systems, 37 656, are small systems below 20 kW. 6 277 are in between 20 kW – 1000 kW and only eleven systems are above 1 MW according to the official statistics (summarized in Table 5). However, the official statistics count everything behind one single connection point to the grid as one system. Several of the centralized PV parks built in Sweden have several connection points to the low voltage distribution grid. These PV parks are divided into several systems in the statistics, and often in sizes below 1 MW. So, the actual number of PV systems above 1 MW in Sweden is larger than eleven the way most people would see it.
With regards to the number of installed PV systems in Sweden, statistics are available for grid-connected system for the years 2016 to 2019. The number of systems at the end of each year, and the corresponding average system size is presented in Table 6. As can be seen at the end of 2019, Sweden had 43 994 grid-connected PV system, and the corresponding average system size was about 16 kW. That is a relatively small system size and it clearly illustrates that the Swedish PV market mainly consist of small distributed PV systems.
Figure 2: Total installed PV capacity in Sweden.
Task 1 – National Survey Report of PV Power Applications in Sweden
8
Table 4: The cumulative installed PV power in 3 sub-markets.
Year Off-grid [MW] Grid-connected
distributed [MW]
Grid-connected
centralized [MW] Total [MW]
1992 0.80 0.01 0.00 0.80
1993 1.03 0.02 0.00 1.04
1994 1.31 0.02 0.00 1.34
1995 1.59 0.03 0.00 1.62
1996 1.82 0.03 0.00 1.85
1997 2.03 0.09 0.00 2.13
1998 2.26 0.11 0.00 2.37
1999 2.46 0.12 0.00 2.58
2000 2.68 0.12 0.00 2.81
2001 2.88 0.15 0.00 3.03
2002 3.14 0.16 0.00 3.30
2003 3.39 0.19 0.00 3.58
2004 3.67 0.19 0.00 3.87
2005 3.98 0.25 0.00 4.24
2006 4.30 0.56 0.00 4.85
2007 4.57 1.68 0.00 6.24
2008 4.83 3.08 0.00 7.91
2009 4.97 3.54 0.06 8.57
2010 5.34 5.12 0.25 10.71
2011 5.78 8.47 0.35 14.60
2012 6.38 14.92 1.08 22.37
2013 7.31 32.14 1.81 41.26
2014 8.20 63.81 4.14 76.14
2015 9.16 109.19 5.83 124.17
2016 10.43 165.20 7.05 182.68
2017 12.27 245.50 9.67 267.44
2018 14.09 391.98 19.07 425.14
2019 15.82 667.53 30.52 713.87

Task 1 – National Survey Report of PV Power Applications in Sweden
9
Table 5: Other PV market information.
2019
Number of PV systems in operation in Sweden
Grid connected PV
Under 20 kW 37 656
20 kW – 1000 kW 6 277
Above 1000 kW 11
Total 43 944
Off-grid PV Unknown
Decommissioned PV systems during the year [MW] 204 kW of off-grid system is estimated to have
been decommissioned
Repowered PV systems during the year [MW] Unknown
Total capacity connected to the low voltage distribution grid [MW]
Unknown
Total capacity connected to the medium voltage distribution grid [MW]
Unknown
Total capacity connected to the high voltage transmission grid [MW]
Unknown
Table 6: Number and average sizes of grid connected PV systems in Sweden at the end of each year.
2016 2017 2018 2019
Number of systems 10 006 15 251 25 486 43 994
Average size per system [kW] 14.0 15.1 16.1 15.9

Task 1 – National Survey Report of PV Power Applications in Sweden
10
PV market segments
The official statistics of the grid operators, collected by the Swedish Energy Agency, only include segmentation in PV system sizes (power) in the ranges 0–20 kW, 20–1000 kW and >1000 kW. The total installations at the end of 2019, according to this source, are summarized in Table 7.
Table 7: Total installations of grid connected PV capacity and number of systems at the end of 2019,
according to the grid operators [1].
0–20 kW 20–1000 kW >1000 kW
Total grid-connected PV capacity according to the grid operators collected by the Swedish Energy Agency [MW]
347.12 332.41 18.52
Total number of grid-connected PV systems according to the grid operators collected by the Swedish Energy Agency [#]
37 656 6 277 11
However, for market segmentation there is another data source. In the database of the Swedish direct capital subsidy (see section 3.2.1), called Svanen, all PV systems that have been granted support from the start of the subsidy programme in 2009 until now are recorded. By cross-referencing between this database and Sweden’s national business directory, a business sector can be assigned to each system owner. By doing this, the database can be divided into centralized, industry, commercial or residential systems. It is also possible to sort the PV systems based on if they were installed on “ground (mark)”, “single-family houses/small buildings (småhus)”, “multi-family houses (flerbostadshus)”, “facilities (lokaler)” or “other (annat)”. The Swedish standard classification names for the different type of buildings are added within the parenthesis to make it easier for the Swedish readers as there in some cases are no straightforward translations into English for these building types. The “other (annat)” classification includes all installations that do not fit into the other building types. This could be decentralised ground mounted systems, systems on churches or other cultural buildings and systems on schools just to mention a few.
A problem with the Svanen database is however that a lot of systems have been recorded in an incorrect way, for example with the wrong power rating, granted subsidy or organization. When it is obvious that the information has been recorded incorrectly, these systems have manually been removed for the analysis within this report.
The installed PV capacity in the Svanen database for 2019 is lower than the total installed as recorded by the Swedish Energy Agency. However, by dividing the annual installed PV capacity in Svanen for each market segment by the total installed PV capacity in Svanen, the different market segments share of the annual installations can be estimated. The historic development of these shares is presented is presented in Figure 3.
As Figure 3 clearly illustrates, the biggest market segments in Sweden have been residential single-family houses and commercial facilities. A slight variation over the years can be seen in Figure 3, but these two segments have always been the biggest. The reason for that is that the self-consumption business model is easy to implement for these types of buildings.

Task 1 – National Survey Report of PV Power Applications in Sweden
11
The low shares of the other market segments, such as centralized PV parks, industry and residential multi-family houses can all be explained by the current policy structure in Sweden.
The reason for the underdeveloped Swedish market of centralized PV parks, as compared to in many other countries, is that the current support schemes has not been enough do drive PV park development in Sweden until now. The two support schemes that has been available has been the renewable electricity certificate system (see section 3.2.3) and a maximum 1.2 million SEK per system from the direct capital subsidy programme (see section 3.2.1). However, this is a market sector that is expected to grow in the coming years. At the time of writing there are thirteen commenced PV parks in Sweden that are larger than 1 MW. Besides those mentioned, the authors are aware of additional plans for several larger PV parks. It seems as though this sector is on the brink of managing without any subsidies, with the help of innovative business models such as PPA-contracts and PV cooperative models (see section 2.4).
The almost absent market segment of PV systems on industry properties can be explained by the current tax laws. First, the manufacturing industry in Sweden has a reduced energy tax. Instead of paying the full energy tax of 0.347 SEK/kWh they only pay 0.005 SEK/kWh. Therefore, the value of self-produced and consumed electricity becomes lower for manufacturing industries as compared with actors that pay the full energy tax. The other major policy obstacle for this market segment is the 255-kW limit (see section 3.3.2), where an owner of a system larger than 255 kWp pay energy tax on the self-produced and consumed electricity as well. Many larger industries consider PV systems of <255 kWp too small to consider, and therefore do not invest in PV, even if they have excellent roofs and high electricity consumption.
The general obstacle for residential multi-family houses is the current tax laws which makes it complicated to self-consume PV electricity in the apartments of a multi-family house. The most common situation is that the apartments have their own meter and contract with the grid operators and the whole multi-family house has one separate meter and contract for the electricity consumed in common areas of the house, e.g. elevators, laundry room, lighting. With this arrangement it is only possible to use the produced PV electricity (from a PV system on the building) for the electricity consumption of the common areas. If the owner of the multi-family house wants to sell the PV electricity to the apartments, the owner becomes a retailer of the electricity and must follow the regulations which come along with that role including the Swedish energy tax that is applied to the electricity (even if it has not left the building). Hence, it is difficult to reach a high degree of self-consumption in multi-family houses arranged this way. The value
Figure 3: Various market segments share of the annual installed PV capacity in Sweden in 2019. Based on
statistics from the capital subsidy database Svanen. The written percentages in the graph represents the
total shares of Residential, Commercial, Industry and Centralized.

Task 1 – National Survey Report of PV Power Applications in Sweden
12
of the excess electricity exported to the grid drops if the fuse exceeds 100 amperes (see section 3.3.5), thus it becomes hard to achieve a decent profitability for such installations. However, it is possible to self-consume the PV electricity in the apartments without taxes if the whole multi-family building, including the apartments, share one single meter and contract with the grid operator. This arrangement requires that the electricity consumption in the apartments is included in the general rent of the apartments. And then it is up to the owner of the multi-family house to decide if the residents in the apartments should pay a fixed price for the electricity regardless of their consumption, or handle the metering of the electricity consumption themselves and vary the level of the monthly rent for the residents depending on their electricity consumption. The latter solution becomes more and more common in Sweden, but the general complexity to move to this arrangement is one reason for the low installation numbers for multi-family houses. Several proactive housing and property companies have however experienced added values after investments in PV, such as sustainability, fair cost, and induced innovativeness [3]. These experiences are likely to spread over time to other actors and motivate them to overcome the perceived legislative barriers.
The geographical distribution of PV in Sweden
The data from the grid operators’ statistics about the installed PV power in Sweden has a geographical resolution down to municipality-level. This data has been used to illustrate the geographical distribution of PV in Sweden in Figure 4 and Figure 5 for most of the municipalities in Sweden. However, some municipalities are marked as blank by the public Swedish Energy Agency due to confidentiality reasons. For these municipalities, data from the green electricity certificate system (see section 3.2.3) has been used to complement the grid operators’ data in creating Figure 4 and Figure 5.
In 2016 these municipalities were Ale, Arjeplog, Arvidsjaur, Bjurholm, Dorotea, Fagersta, Gällivare, Habo, Haparanda, Hedemora, Hofors, Jokkmokk, Kalix, Kiruna, Ljusnarsberg, Ludvika, Lycksele, Lysekil, Malå, Munkedal, Munkfors, Nordmaling, Pajala, Sala, Sorsele, Storuman, Sundbyberg, Sävsjö, Tanum, Tidaholm, Täby, Umeå, Vilhelmina, Vännäs, Åsele, Älvsbyn, Örebro and Överkalix.
In 2019 these municipalities were Ale, Arjeplog, Arvidsjaur, Borgholm, Haparanda, Hultsfred, Norberg, Skellefteå, Sorsele, Storuman, Surahammar, Åmål, Överkalix.
Figure 4 and Figure 5 clearly show that the expansion of PV takes place at different speeds in Sweden's municipalities. When it comes to most installed PV capacity, Gothenburg, followed by Uppsala and Stockholm were in the top at the end of 2019 with 22.6, 18.9 and 17.0 MW, respectively. Gothenburg, who overtook the lead from Linköping in 2018, was much helped by the 5 MW PV park that was finalised on Hisingen in December 2018. The local utility company is building another 5 MW PV park in 2020.
When the installed PV capacity is divided by capita, as in Figure 5, Sjöbo municipality overtook the last year’s leader Heby in 2019. The main reason for that is that Sweden’s so far biggest PV park, “Sparbanken Solcellspark” at 5.8 MWp was commissioned in Sjöbo last summer. Sjöbo only has about 19 200 inhabitants, so the PV park had a huge effect. The top three municipalities then became Sjöbo, Heby and Simrishamn with 405.2, 242.8 and 230.5 W/capita, respectively. It is no coincidence that Heby and Simrishamn also are in the forefront. In Heby, Swedens first PV cooperative was started already in 2009 (see section 2.4) and in 2018 Swedens largest roof-mounted PV system was installed on a logistics center. In Simrishamn the utility E.On is running a smart grid project in the village Simiris where they will run the whole village on solely locally produced wind and PV electricity in an island mode every fifth week.
The Swedish electricity market is from the first of November 2011 divided into four bidding areas by decision of the Swedish National Grid (Svenska Kraftnät), marked as SE1, SE2, SE3 and SE4 in Figure 4 and Figure 5. The reason is that northern Sweden has an excess of electricity production, since that is where a lot of the wind power and a majority of the hydropower is situated, while the demand is larger than the production in southern Sweden. This has resulted in transmission bottlenecks, and the borders between the bidding areas have been drawn where there are congestions in the national grid. The idea of the four bidding areas is to make it clear where the national grid needs to be expanded and where an increased electricity production is required to better meet the consumption.

Task 1 – National Survey Report of PV Power Applications in Sweden
13
From this perspective, it is positive that a majority of the PV capacity is being installed in southern Sweden and mainly in the densely populated municipalities, as Figure 4 shows.
The value of the PV electricity is also higher in SE4 and SE3, as the average value factor between 2014 and 2019 (see section 2.6 for further explanation and discussion) of PV in these bidding areas was 1.028 and 1.025 respectively, as compared to 1.024 in both SE2 and SE1 respectively [4].
Figure 4: Total power of the PV systems in each of Sweden's municipalities. For some municipalities data
from the green electricity system has been used instead of grid operators’ data due to confidentiality reasons.
Figure 5: Total power of the PV systems per capita in each of Sweden's municipalities. For some
municipalities data from the green electricity system has been used instead of grid operators’ data due to confidentiality reasons.

Task 1 – National Survey Report of PV Power Applications in Sweden
14
Key enablers of PV development
1.6.1 Other technologies For four years the surveys that went out to the installation companies included questions about grid connected battery capacity that had been installed. According to the installations companies a total battery capacity of 6 362 kWh was installed in 2019,, a slight increase compared to 2018 Table 8: Annual installed grid connected stationary battery capacity installed by PV installation companies. illustrates. The general global trend of decreasing battery prices [5], signals that a growing battery market in Sweden is expected. In 2018 a clear shift can be seen Table 8: Annual installed grid connected stationary battery capacity installed by PV installation companies., as compared to previous years, where the battery market for private households became larger than the market for commercial systems. This development can be explained by the introduction of the capital subsidy programme for storage (see section 3.9.3), which now has an effect on the storage market.
The reader should be aware that this battery capacity is not the total annual installed grid connected battery capacity in Sweden. It is only the battery capacity that PV installation companies have installed in connection to distributed PV systems.
Table 8: Annual installed grid connected stationary battery capacity installed by PV installation companies.
Year Private system Commercial system Total
2016 177 kWh 1 365 kWh 1 542 kWh
2017 1 143 kWh 1 288 kWh 2 431 kWh
2018 2 414 kWh 1 520 kWh 3 934 kWh
2019 3 406 kWh 2 956 kWh 6 362 kWh
The battery capacity of the electrical cars in Sweden was 2 395 MWh in the end of 2019 [6]. If one adds the total battery capacity of stationary grid connected batteries connected to PV systems installed between 2016 and 2019 the total battery capacity at the end of 2019 became 2 409 MWh.
Table 9: Information on key enablers. Values are at the end of 2019.
Description Annual Volume Total Volume Source
Distributed storage systems [kWh]
Grid-connected private and commercial battery systems
4 204 kWh > 12 066 kWh1 This report
Heat Pumps [#] Single-family houses 52 723 ~ 1 400 000 [7]
Electric cars [#]
Battery electric vehicles
14 957 34 228
[6] Plug-in hybrid electric
vehicles 17 054 66 336
1Data collection started in 2016. So, the total number is for sure higher than the cumulative value of 2016–2019 data.

Task 1 – National Survey Report of PV Power Applications in Sweden
15
1.6.2 The public opinion about PV The general opinion about PV in Sweden is very positive among the public. In an annual survey [8], sent out by the SOM-institute, randomly selected respondents have answered the question “How much should Sweden invest in the following energy sources during the next 5-10 years?”. The result is presented in Figure 6, indicating a strong majority of 82 % of the respondents want more investments in PV in Sweden, which makes the PV technology by far the most popular electricity production technology in that aspect.
When it comes to the willingness of homeowners to install PV on their house, the results from two different surveys conducted with national representative samples of Swedes, are presented in Figure 7. The survey presented in Figure 7a is from 2016 [9] and the one presented in Figure 7b from 2018 [10]. The results from the two surveys are similar and show that about 60 % of the homeowners in Sweden are interested in having a PV system on their roof. Finally, there is also a great interest for larger PV systems, and scientific analysis has shown that the installation of PV systems creates a number of added values for commercial and multi-family building owners [3].
Figure 6: The public opinion in Sweden about different electricity production technologies.
Figure 7: The result of two different surveys conducted with a national representative sample of Swedes.
In (A) the question was “If you had the opportunity, would you then like to produce your own electricity?” In (B) the question was “As a homeowner, have you installed PV or are you planning to do so?”.

Task 1 – National Survey Report of PV Power Applications in Sweden
16
PV in the broader Swedish power system
The complete statistics of the Swedish electricity production of 2019 is not yet available. In Figure 9 the Swedish electricity production in 2018 is presented. The electricity production data used in Figure 9 and Figure 8, along with Table 10, were retrieved from Svenska Kraftnät [11] but with complementary data from SCB [12] with regards to the fuels used in the Swedish CHP power plants. The exception is the produced PV power. Since a large share of the total PV power production is self-consumed by prosumers it is not registered in the statistics from Svenska Kraftnät as they only measure electricity fed into the grid. The PV production used in the figures and table below were therefore instead generated through simulations using a model that have a proven high correlation of 0.95–0.99 to reported historical production data [13].
The simulation result was generated in proportion to the geographical location of the population and the available solar radiation, this was done in order to ensure that the solar production was distributed realistically. For each year the production was calculated from the average installed power at the beginning and the end of the year and was weighted against values on the installed capacity.
Figure 9: Total electricity production in Sweden in 2018.
Figure 8: Annual electricity production in Sweden from 1990 to 2018.

Task 1 – National Survey Report of PV Power Applications in Sweden
17
As can be seen in Figure 8, the Swedish electricity has historically been produced by technologies that have a low CO2-footprint. This along with the low electricity prices (see section 2.6) counts as the two main reasons why the Swedish PV deployment started late compared to other European markets and still is rather small.
Table 10: PV power and the broader national energy market.
2018 numbers 2019 numbers
Total power generation capacities [MW] 39 782 40 822
Total renewable power generation capacities (including hydropower) [GW]
27 864 29 714
Total electricity demand [TWh] 135.2 132.1
Total electricity production [TWh] 152.7 158.6
Change in generation capacity [MW] + 928 + 1 040
Change in renewable power generation capacity (including hydropower) [MW]
+ 1 028 + 1 850
Estimated total PV electricity production (including self-consumed PV electricity) in [GWh]
347 543
Total PV electricity production as a % of total electricity consumption
0.26 0.41

Task 1 – National Survey Report of PV Power Applications in Sweden
18
2 COMPETITIVENESS OF PV ELECTRICITY
Module prices
Module prices in Sweden are heavily dependent on the international module market. Sweden saw a very rapid decline in price for PV modules between 2008 and 2013 due to a growing domestic market, which allowed retailers to import larger quantities. But also due to the overall price decline of modules on the international market. Between 2013 and 2016, the price decline in Sweden was more moderate.
One of the reasons for the stabilization of module prices in this time period was the import duties on Chinese PV modules and cells that were introduced in 2013 by the European Commission [14]. In these measures, a minimum import price (MIP) was introduced, which means that no silicon solar cells or modules could be imported to the European Union at a price lower than 0.56 €/Wp, which corresponded to about 5.2 SEK/Wp.
In September 2018 the European Commission terminated the duties on Chinese modules. After the termination of the duties many Swedish retailers lowered their module prices towards the Swedish installation companies with 20-30 percent. That resulted with the price of a typical module to the end consumer going down by 15 % in 2018, which continued in 2019 with an additional average price drop of 9 % (see Table 11), according to sales statistics.
Table 11: Typical module prices for a number of years. The prices are reported by Swedish installers and
retailers. The prices are the prices to the end costumer, not the import price for the installers and retailers.
Year Lowest price of a standard module crystalline silicon
[SEK/Wp]
Highest price of a standard module crystalline silicon
[SEK/Wp]
Typical price of a standard module crystalline silicon
[SEK/Wp]
2004 - - 70
2005 - - 70
2006 - - 65
2007 - - 63
2008 - - 61
2009 - - 50
2010 20 68 27
2011 12 50 19
2012 9.5 40 14
2013 6.0 16 8.9
2014 6.0 12 8.2
2015 5.1 10 7.6
2016 4.5 9.3 7.1
2017 4.1 6.6 5.3
2018 3.2 6.6 4.5
2019 2.2 5.4 4.1

Task 1 – National Survey Report of PV Power Applications in Sweden
19
System prices
Sweden has experienced a large decrease in PV system prices since 2010, especially before 2013, as Figure 10 shows. The major reason for the decline in system prices in Sweden is that the prices of modules and the balance of system (BoS) equipment has dropped in the international market. Another reason is that the Swedish market is growing, providing the installation firms a steadier flow of orders and an opportunity to streamline the installation process, thus reducing both labour and cost margins. A clear trend of decreasing yearly full-time labour positions per installed MW is illustrated in Table 33 further corroborate this hypothesis. Competition in the market has also increased. In 2010 the author of this report was aware of 37 active companies that sold and/or installed modules or PV systems in Sweden. In the end of 2019, the corresponding figure had gone up to 314.
2.2.1 Estimated PV system prices by the sales statistics When it comes to PV system prices, there are two different data sources. One is the sales survey that yearly goes out to the Swedish installers and retailers as part of the collection of data for this and previous Swedish National Survey Reports. These surveys have been conducted the same way since 2010, and they collect statistics about prices that the installer and retailer companies regard as typical for some standard PV systems for their company. The reported prices have for the years 2010–2017 been weighted with regards to the number of kWp each company installed in that market segment. For the 2018 and 2019 numbers, the reported prices have not been weighted (as the collection of installation data from the installation companies after 2017) and the reported prices are a regular average. The price information from the sales surveys are presented in Figure 10 and Table 11.
.
Figure 10: Historic development of the weighted average typical prices for turnkey photovoltaic systems
(excluding VAT), reported by Swedish installation companies.
Task 1 – National Survey Report of PV Power Applications in Sweden
20
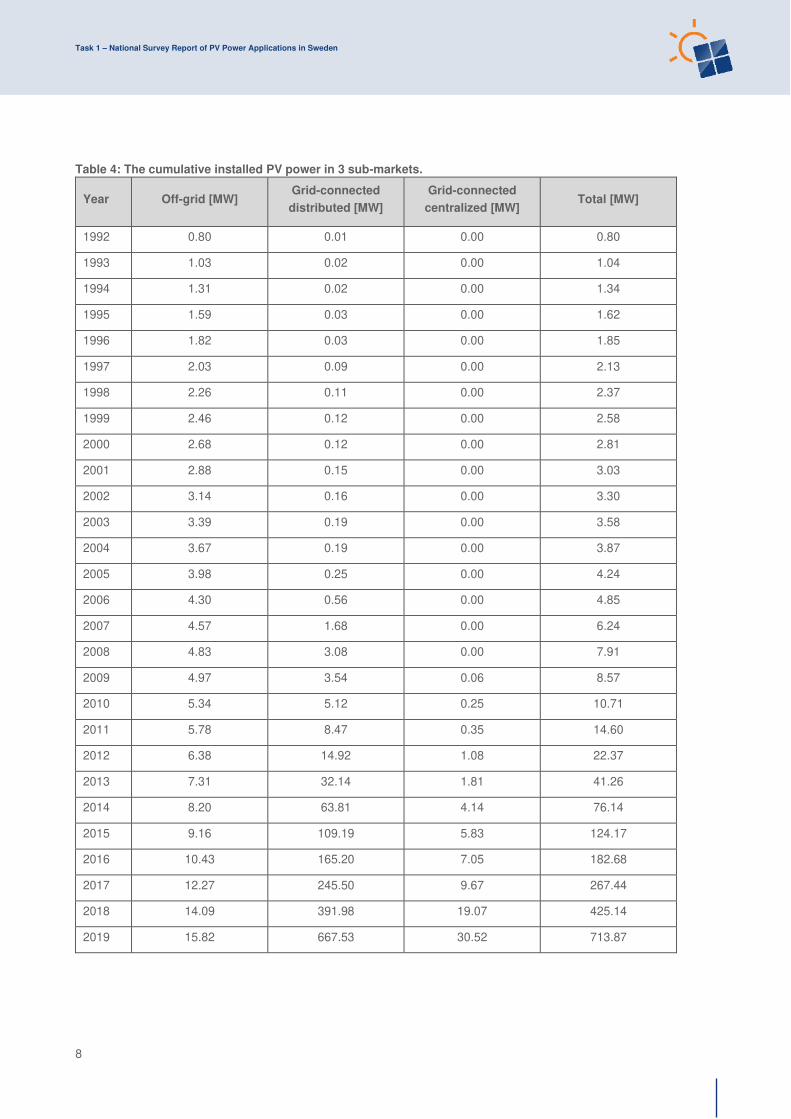
Table 12: National trends in system prices for different applications.
Year
Residential BAPV
Grid-connected, roof-mounted, distributed
PV system ~5 kW
[SEK/Wp]
Small commercial
BAPV
Grid-connected, roof-mounted, distributed PV systems ~15 kW
[SEK/Wp]
Large commercial
BAPV
Grid-connected, roof-mounted, distributed
PV systems ~100
[SEK/Wp]
Small centralized PV
Grid-connected, ground-mounted,
centralized PV systems >0.5 MW
[SEK/Wp]
2007
2008 96.00 67.00
2009 76.00 47.00
2010 63.33 45.89 40.79
2011 32.07 28.77 24.44
2012 21.43 20.29 16.13
2013 16.68 15.09 13.62 12.73
2014 15.28 13.81 12.63 11.77
2015 15.13 13.20 11.82 10.69
2016 15.07 12.48 11.56 9.03
2017 14.81 12.22 10.70 9.30
2018 14.76 12.09 10.31 8.18
2019 14.29 11.74 10.12 7.50
2.2.2 PV system prices recorded in the direct capital subsidy programme The other source for system price statistics is the database of the Swedish direct capital subsidy, called Svanen. As described more in detail in section 1.4 it is possible to sort the PV systems by market segment, meaning if they have been installed on “ground (mark)”, “single-family houses/small buildings (småhus)”, “multi-family houses (flerbostadshus)”, “facilities (lokaler)” or “other (annat)”. The Swedish standard classification names for the different type of buildings are added within the parenthesis to make it easier for the Swedish readers as there is some cases are no straightforward translations into English for these building types. So, most PV systems in the database can be divided into centralized, industry, commercial and residential systems, and as the system sizes (in kWp), prices and commission dates are also recorded, it is possible to extract price information within the different market and size segments, as well as follow the price development over the years.
When it comes to the prices of turn-key grid connected roof-mounted PV systems there is of course a wide range, even for systems with similar size and type of owner. The range depends on many factors, such as type of building, type of roof, type of module and BoS, etcetera. Furthermore, it is not possible to derive if the PV systems are building applied (BAPV) or building integrated (BIPV), or if the owner has carried out some of the installation work by him/herself. These factors result in several recorded PV system prices (especially in the segment of small residential single-family systems) that are unusually high >30 SEK/Wp or low <10 SEK/Wp.
Furthermore, there is also the economies of scale, where larger systems are comparatively cheaper to install due to the fact that some costs, such as for example designing of the system, erection of scaffolding, commissioning etc, depends little on the number of modules that are being installed.

Task 1 – National Survey Report of PV Power Applications in Sweden
21
For this report several size (power) ranges for residential and commercial systems have been selected and an average has been derived within these size ranges for PV systems. The reason for choosing these size intervals is because the number of systems should suffice to derive a reasonable average price and that the economies of scale become less profound the larger the system becomes. For the residential sector the size ranges are 5–10 kWp and 10–20 kWp for single-family houses, and 20–50 kWp and 50–100 kWp for multi-family houses. The average prices for residential systems are presented in Figure 11 and Table 13. For the commercial sector the size ranges are 10–20 kWp, 20–50 kWp, 50–100 kWp and 100–255 kWp, presented in Figure 12 and Table 14. The reason for choosing 255 kWp as the upper boundary for the largest commercial systems is due to the current tax legislation (see section 3.3.2). Table 13 and Table 14 also list how many systems that the presented average prices have been derived from, in order for the reader to get a sense of relevance of the average price presented.
The reason for only presenting prices from 2013 and onwards, and not to include 2009–2012 even if they exist in the database, is that the number of systems installed those years is so small and the spread of prices between them so high that deriving an average price of these systems would be precarious and misleading.
Figure 11: Average prices for turnkey grid-connected residential PV systems (excluding VAT) from the
database of the direct capital subsidy programme.
Figure 12: Average prices for turnkey grid-connected commercial PV systems (excluding VAT) from the
database of the direct capital subsidy programme.

Task 1 – National Survey Report of PV Power Applications in Sweden
22
Table 13: Average prices for turnkey grid-connected residential PV systems (excluding VAT) from the
database of the direct capital subsidy programme, along with the number of PV systems of that specific
type and power range that the average price has been derived from.
Year
Single-family houses,
5–10 kWp
Single-family houses,
10–20 kWp
Multi-family houses,
20–50 kWp
Multi-family houses,
50–100 kWp
Average
price
[SEK/Wp]
#
systems
Average
price
[SEK/Wp]
#
systems
Average
price
[SEK/Wp]
#
systems
Average
price
[SEK/Wp]
#
systems
2013 15.49 343 15.13 71 19.26 15 20.62 3
2014 15.00 476 13.35 207 17.62 39 16.88 11
2015 14.56 522 12.42 260 15.31 32 14.57 11
2016 14.69 988 13.25 426 15.33 62 13.38 19
2017 14.19 1 422 12.57 875 16.53 78 13.54 21
2018 14.64 3 627 12.66 2 798 14.62 111 13.21 39
2019 14.26 3 728 12.12 3 660 14.47 34 12.56 10
Table 14: Average prices for turnkey grid-connected commercial PV systems (excluding VAT) from the
database of the direct capital subsidy programme, along with the number of PV systems of that specific
type and power range that the average price has been derived from.
Year
Commercial facilities,
10–20 kWp
Commercial facilities,
20–50 kWp
Commercial facilities,
50–100 kWp
Commercial facilities,
100–255 kWp
Average
price
[SEK/Wp]
#
systems
Average
price
[SEK/Wp]
#
systems
Average
price
[SEK/Wp]
#
systems
Average
price
[SEK/Wp]
#
systems
2013 20.07 29 19.33 53 15.24 12 15.75 5
2014 14.22 78 15.05 89 16.74 24 16.11 10
2015 14.04 135 13.62 143 13.64 43 14.56 18
2016 13.76 203 13.40 243 13.22 67 13.51 34
2017 13.83 320 13.19 343 12.31 107 12.09 58
2018 13.46 481 12.80 560 12.56 177 11.85 98
2019 13.52 564 12.90 728 12.53 297 11.58 204

Task 1 – National Survey Report of PV Power Applications in Sweden
23
2.2.3 PV system price discussion The fast decrease in PV system prices in Sweden the last few years has slowed down, but a declining price trend can still be seen. For small PV systems on residential single-family houses of approximately 5 to 10 kWp, both table 12 (that is based on the installations companies estimates) and Table 13 (that is based on prices statistics derived from the Swedish direct capital subsidy programme) show that the price decreased in 2019, with around 3–4 % to reach an average of 14.2 SEK/Wp. The price of somewhat larger PV systems on residential single-family houses of about 10–20 kWp also declined with about 4 %, as the average prices in this market segment went down from 12.7 to 12.1 SEK/Wp (see Table 13Table 13). For residential PV systems on multi-family houses the prices went down with 1 % and 5 % within the size ranges of 20–50 kWp and 50–100 kWp respectively in 2019.
For roof-mounted PV systems on commercial buildings the price decline seems to have followed the same pace as the prices went down with 2 % for ~100 kWp systems and 3 % for ~15 kWp systems according to installation companies (see Table 12). However, Table 14 show that prices for commercial facilities were about the same in 2019 as in 2018.
It is interesting to note that for small residential single-family houses the installation companies estimate typical system prices at the same level as what have actually been recorded in the direct capital subsidy programme, namely on average 14.2 SEK/Wp, while for large commercial systems of about 100 kWp the installation companies estimate lower typical system prices (10.1 SEK/Wp) as compared to the average of the recorded systems in the direct capital subsidy programme (11.6 SEK/Wp). Looking in the database of the direct capital subsidy programme a few outlier systems with system prices >30 SEK//Wp are noted in this category, which pull up the average prices. Consequently, it seems like the typical price for a large commercial PV system of about ~100 kWp was closer to 10 SEK/Wp in 2019.
The largest price decline in 2019 occurred for centralized utility scale PV parks, where the typical price went down with 8 % from 8.2 SEK/Wp to 7.5 SEK/Wp (see Table 12). An explanation is that five >1 MWp PV parks were commissioned in Sweden in 2019.
The general slowdown of the price reduction of PV system is expected as it is impossible to continue with such a fast price reduction as was seen a couple of years ago when the Swedish market was catching up the international market prices. The stagnation of the prices for the residential and small commercial sector might be explained by the very high demand for PV in Sweden. The fact that the subsidy levels in the Swedish direct capital subsidy system haven’t been lowered since 2014 until it was changed in May 2019, may be another reason (see section 3.2.1). This means that the installers could charge the same prices, as the customers have the same profitability, even if module and other hardware costs has continued to go down.
Table 15 summarizes the PV system prices in 2019. The price ranges presented are appraisals made by the authors and are based on data from both the installer and retailers’ surveys and the Svanen-database of the direct capital subsidy.

Task 1 – National Survey Report of PV Power Applications in Sweden
24
Table 15: Turnkey PV system prices of different typical PV systems in 2019.
Category/Size Typical applications and brief details Current prices
[SEK/Wp]
Off-grid
2 kW
A stand-alone PV system is a system that is installed to generate electricity to a device or a household that is not connected to the public grid. The price is for a small off-grid system on a cottage for seasonal use (summer) that is not connected to main grid.
25–30
Residential BAPV
5-10 kW
Grid-connected, roof-mounted, distributed PV systems installed to produce electricity to grid-connected households. Typically roof-mounted systems on villas and single-family homes.
11–17
Small commercial BAPV
10-100 kW
Grid-connected, roof-mounted, distributed PV systems installed to produce electricity to grid-connected commercial buildings, such as public buildings, multi-family houses, agriculture barns, grocery stores etc.
8–16
Large commercial BAPV
100-250 kW
Grid-connected, roof-mounted, distributed PV systems installed to produce electricity to grid-connected large commercial buildings, such as public buildings, multi-family houses, agriculture barns, grocery stores etc.
7–14
Industrial BAPV
>250 kW
Grid-connected, roof-mounted, distributed PV systems installed to produce electricity to grid-connected industrial buildings, warehouses, etc.
7–13
Small centralized PV
1-20 MW
Grid-connected, ground-mounted, centralized PV systems that work as central power stations. The electricity generated in this type of facility is not tied to a specific customer and the purpose is to produce electricity for sale.
5–9
Large centralized PV
>20 MW
Grid-connected, ground-mounted, centralized PV systems that work as central power station. The electricity generated in this type of facility is not tied to a specific customer and the purpose is to produce electricity for sale.
not applicable

Task 1 – National Survey Report of PV Power Applications in Sweden
25
Financial parameters and specific financing programs
The interest rate (reporäntan) of the central bank of Sweden (Riksbanken) started at -0.5 % in 2019, but was increased to -0.25 % on the 9th of January and was then kept at that level for the entire year [15]. Changes in interest rate by the central bank have a direct impact on the market rates, which therefore have been quite low in 2019. The cost of capital for a PV system has consequently been low.
In Table 16 the average mortgage rate in 2019 has been used for residential installations. For commercial installations in Sweden a realistic loan rate has been reported to be the STIBOR rate plus 450 dps. A study to derive the levelized cost of electricity (LCOE) of Swedish centralized PV parks projects under 2019 and 2020 are taking place right now, and preliminary average weighted average cost of capital (WACC) from this study is used for industrial and ground-mounted installations in Table 16.
Table 16: PV financing information in 2019.
Different market segments Loan rate [%]
Average rate of loans – residential installations [16] 1.6 %
Average rate of loans – commercial installations [17] 4.3 %
Average cost of capital – industrial and ground-mounted installations 4.0 %
To the knowledge of the authors, the first loan specifically directed to PV installations in Sweden was launched in 2019. It is Sparbanken Syd that now offer private persons to finance their investment in PV systems on their house by a specific PV loan [18].
Specific investments programs
Already in 2009, the first PV cooperative, Solel i Sala & Heby ekonomisk förening, started in Sweden. This PV cooperative has a FiT agreement with the local utility company Sala-Heby Energi, that buys the electricity from the cooperatives PV systems. Since the start in 2009 the cooperative has now built six systems with a total capacity of 599 kWp. Other examples of PV cooperatives that has built co-owned PV systems are Solel i Bergslagen ekonomisk förening, with two systems totalling 112 kWp, and Zolcell 1:1 ekonomisk förening, with 2 systems totalling 27 kWp.
Table 17: Summary of existing investment schemes.
Investment Schemes Introduced in Sweden
Third party ownership (no investment) Yes
Renting Yes
Leasing Yes
Financing through utilities Yes
Investment in PV plants against free electricity Yes
Crowd funding (investment in PV plants) Yes
Community solar Yes
International organization financing No

Task 1 – National Survey Report of PV Power Applications in Sweden
26
PV cooperative models have in later years been adapted by utility companies that have built large PV parks or systems. Any private person or company can buy a share in such a park and the shares represent a certain yearly production, which the utility company deduct from the share owner’s electricity bill. One examples of this is the 1 MWp park with solar tracking outside of Västerås, which the utility company Mälarenergi and the installation company Kraftpojkarna manage together. Another example is Kalmar Energi that installed a crowdfunded 600 kWp system on the roof of a local farm called Nöbble Gård. Following the positive response of Nöbble Gård Kalmar Energi is now building big crowd funded PV park close to the Kalmar Airport. This park will be built in four stages of 750 kWp each. The first one was finalized in the end of September 2017, the second in June 2018 and the third in May 2019. The first stage, 0.6 MW, of their crowd funded PV park was finalized in April 2019, the second stage of another 0.6 MW was in June 2019 and at the time of writing 60 % of a third stage has been financed.
In 2014 there was no company offering PV leasing contracts. However, in 2015, the company Eneo Solutions AB started to offer solar leasing contracts to owners of commercial and public buildings. In 2016 two utility companies, Umeå Energi and ETC El started to offer solar leasing contracts to private homeowners.
Additional Country information
Sweden is a country in northern Europe. With a land area of 407 284 km² [19], Sweden is the fifth largest country in Europe. In January 2017 Sweden passed ten million inhabitants for the first time in history [20]. The population density of Sweden is therefore low with about 25 inhabitants per km², but with a much higher density in the southern part of the country. About 85 % of the population lives in urban areas.
Table 18: Country information.
Retail Electricity Prices for a household (range) 1.2–2.2 SEK/kWh (including grid charges and taxes)
Retail Electricity Prices for a commercial company (range)
1.2–1.8 SEK/ kWh (including grid charges and taxes)
Retail Electricity Prices for an industrial company (range)
0.6–1.0 SEK/kWh (including grid charges and taxes)
Population at the end of 2019 [20] 10 327 589
Country size (km2) [19] 407 284
Average PV yield in kWh/kWp [21][22] 900 kWh/kWp (750–1100 kWh/kWp)
Name and market share of major electric utilities
Electricity production
(2018)
[23]
Share of grid
Subscribers (2017)
[24]
Number of retail
customers (2018)
[25]
Vattenfall 44 % 16 % 20 %
Uniper 15 % - -
Fortum 14 % - 21 %
Statkraft 4 % - -
Skellefteå Kraft
2 % 1 % 4 %
E.ON - 19 % 15 %
Ellevio - 17 % -

Task 1 – National Survey Report of PV Power Applications in Sweden
27
Electricity prices
In Sweden, the physical electricity trading takes place on the Nordic electricity retailing market, Nord Pool Spot market. Historically, electricity prices in Sweden have primarily been dependent on the rainfall and snow melting, the availability of the nuclear reactors and the outside temperature. In recent years, a lot of wind power has been built and more transmission connections to surrounding countries have come online, which affect the spot prices on windy days.
The Swedish electricity market is from the first of November 2011 divided into four bidding areas by decision of the Swedish National Grid (Svenska Kraftnät). The reason is that northern Sweden has a surplus of electricity production compared to the demand, while there is a higher demand than production in southern Sweden. That has resulted in transmission capacity problems and the borders between the bidding areas have been drawn where there are congestions in the national grid. The idea of the four bidding areas is to make it clear where in Sweden the national grid needs to be expanded and where in the country increased electricity production is required to better meet consumption, and thus reduce the need to transport electricity long distances. The geographical borders of the areas are marked in Figure 4 and Figure 5.
Figure 13: Daily average day-ahead spot prices in area 1 (Luleå) and area 4 (Malmö) in 2019.
Figure 14: Weekly average day-ahead spot prices in area 1 (Luleå) and area 4 (Malmö) in 2014–2019.

Task 1 – National Survey Report of PV Power Applications in Sweden
28
In 2019 the spot prices were quite stable over the year, as Figure 13 illustrates, and the yearly average ended up at 0.401 in SE1, 0.401 in SE2, 0.405 in SE3 and 0.421 in SE4. The very small difference between the areas does not influence the distribution of PV systems over the country to the same extent as solar radiation (see section 2.7) and the population distribution does (see section 1.4). Looking back over the last six years, the spot prices have varied quite substantially in Sweden, as Figure 14 and Table 19 illustrates, which makes it harder to predict the business case of centralized PV parks. With more in-depth analysis of the production profile of PV and the spot price variation, the market value of the PV electricity and the value factor can be derived [26]. The market value points to whether the production profile of power generation from a specific energy resource matches the spot price variation, and is the average of the production share at times the corresponding spot price pt at every specific timestep t. This is expressed by the equation: 𝑝𝑚 = ∑ 𝑎𝑡𝑝𝑡𝑇𝑡=1∑ 𝑎𝑡𝑇𝑡=1
where T is the number of time steps in the examined period. The value factor VF is the market value divided with the average spot price �� in the examined period: 𝑉𝐹 = 𝑝𝑚 ��
A value factor greater than one indicates that the value of electricity generation exceeds the average spot price for a certain period (typically one year), and vice versa for value factors under one. A value factor over one for a power supply indicates that the electricity market is demanding electricity production that is in line with the power supply's production profile.
As can be derived from Table 19 the market value of PV electricity in Sweden has on average been higher than the spot prices in Sweden under the time period 2014 to 2019. On average a PV system received 10 SEK more per MWh than the average spot price. One can also see that the market value of PV electricity is higher in the two southern price areas (SE3 and SE4) than in the two northern ones (SE1 and SE2). This is fortunate, as the average global radiation is higher in the southern part of Sweden.
Table 19: The average day-ahead spot prices, the market value of PV and the value factor of PV [4].
2014 2015 2016 2017 2018 2019 Average 2014–2019
Average day-ahead spot prices [SEK/MWh]
SE1 286.0 198.0 275.1 297.1 454.6 401.0 318.6
SE2 286.0 198.1 275.1 297.1 454.6 401.0 318.6
SE3 287.8 205.9 277.8 300.9 457.8 405.5 322.6
SE4 290.5 214.3 280.6 310.0 476.6 420.9 332.1
Average 287.5 204.1 277.1 301.3 460.9 407.1 323.0
The market value of PV [SEK/MWh]
SE1 306.7 182.0 289.7 312.2 489.5 390.6 328.4
SE2 306.7 182.1 289.7 312.2 489.5 390.6 328.5
SE3 309.4 191.2 290.1 317.4 492.4 393.1 332.3
SE4 310.5 204.8 291.4 323.1 520.6 409.2 343.3
Average 308.3 190.0 290.2 316.2 498.0 395.9 333.1
The value factor of PV
SE1 1.072 0.919 1.053 1.051 1.077 0.974 1.024
SE2 1.072 0.919 1.053 1.051 1.077 0.974 1.024
SE3 1.075 0.929 1.044 1.055 1.076 0.969 1.025
SE4 1.069 0.956 1.039 1.042 1.092 0.972 1.028
Average 1.072 0.931 1.047 1.050 1.080 0.972 1.025

Task 1 – National Survey Report of PV Power Applications in Sweden
29
Analysing the value factor of PV, Table 19 show that the value factor has varied over the years. In 2015 and 2019 it was below 1.0, while it was higher than 1.0 in 2014, 2016, 2017 and 2018. The highest value factor was achieved in 2018, which was also the year with highest global radiation records in Sweden (see section 2.7). High production and a high value factor do not necessarily have a correlation. The reason for the high value factor and an irregularly high production by PV in 2018 was actually the low production by other power sources in Sweden, due to the long periods of anticyclone weather (with high barometric pressure). In the Swedish power mix wind power and hydro stands for large shares (see Figure 8 and Figure 9), which are both production sources that depend on low barometric pressure weather, as this typically leads to higher wind speeds and precipitation. Furthermore, the electricity production from Swedish CHP plants are heavily dependent on heat demand from the well-developed Swedish district heating networks, and the heat demand was of course very low due to long periods of sunny and warm weather that year. This led to a situation with much higher electricity prices in the summer, compared to in the winter.
If one compares the value factor of PV with the value factor of the other power sources [4], one can see that hydro power, PV and CHP in general has value factors above 1.0, while nuclear and wind power consistently have value factors below1.0. A simplified conclusion is that the price indicates that the Swedish electricity system would benefit if production with the production profiles similar to either hydro power, PV or CHP would be added. However, this does not by default correlate with profitability for these power sources.
Table 20: Summary of the market value over the different price areas for the most common power sources
in Sweden from 2014 to 2019.
Table 21: Summary of average value factors over the different price areas for the most common power
sources in Sweden from 2014 to 2019.
2014 2015 2016 2017 2018 2019 Average 2014–2019
Hydro 294.4 205.4 284.0 313.2 469.4 419.0 330.9
Nuclear 283.4 202.3 271.8 294.2 458.8 400.3 318.5
CHP 283.0 227.5 284.3 300.4 451.8 426.8 329.0
Wind 275.2 194.4 268.2 282.4 442.3 384.5 307.8
PV 308.3 190.0 290.2 316.2 498.0 395.9 333.1
2014 2015 2016 2017 2018 2019 Average 2014–2019
Hydro 1.024 1.006 1.025 1.040 1.018 1.029 1.024
Nuclear 0.986 0.991 0.981 0.976 0.995 0.983 0.985
CHP 0.984 1.115 1.026 0.997 0.980 1.061 1.027
Wind 0.957 0.953 0.968 0.937 0.960 0.945 0.953
PV 1.072 0.931 1.047 1.050 1.080 0.972 1.025

Task 1 – National Survey Report of PV Power Applications in Sweden
30
As the electricity mix in Sweden changes, (more wind and PV are expected to be built while the two nuclear reactors at Ringhals 1 and Ringhals 2 face decommissioning as of 30 of December 2019 and 31st of December 2020) the value factor of the different power sources will change. E.g. in a recent study it was simulated that the value factor of PV will go from in general being above 1.0 to in general be below 1.0 if PV reaches above 5 % of the total power production in the electricity mix [27].
Household electricity costs consist of several components. The base is the Nord Pool Spot price of electricity. On top of that, energy tax, the cost of green electricity certificates, the variable grid charge, the fixed grid charge, VAT and sometimes an electricity surcharge and a fixed trading fee are added. Figure 15 illustrates the evolution of the average electricity price for the average end consumer over the years [28]. In Figure 16 the variable part of the electricity price, which is what can be saved if the micro-producer replaces purchased electricity with self-generated PV electricity, is illustrated. Furthermore, the value of the excess electricity is shown for two base cases with the
Nord Pool spot price as a base compensation offered by electricity trading utility companies (see section 7.2), energy compensation from the grid owner (see section 3.3.6), the tax credit system (see section 3.3.5) and with and without the green electricity certificate, since few PV owners are using the green electricity certificate system (see section 3.2.3).
Figure 15: Evolution of the average electricity price (in January) for private end consumer with a single-
family house with electric heating.

Task 1 – National Survey Report of PV Power Applications in Sweden
31
The reader should note that the electricity price in Figure 16 was the lowest achievable in May 2019, and that most customers payed more. It is also worth noting that some utility companies offer higher compensations than the Nord Pool spot price, so with all current possible revenue streams, both the self-consumed electricity and the excess electricity would have been higher than in the figure.
Global solar radiation
The total amount of solar radiation that hits a horizontal surface is called the global radiation. The global solar radiation thus consists of the direct radiation from the sun and the diffuse radiation from the rest of the sky and the
Figure 16: The lowest available electricity price for a typical house with district heating in Stockholm with
an annual electricity consumption of about 10 000 kWh/year, a 16-ampere fuse and Vattenfall as the grid
owner in May 2019. Furthermore, the compensation for the excess electricity, with and without the extra
remuneration from green electricity certificates.
Figure 17: Average global solar radiation in Sweden in one year.

Task 1 – National Survey Report of PV Power Applications in Sweden
32
ground. The solar radiation therefore depends on the weather, on the position on the globe and the season of the year. The distribution of annual average global radiation over Sweden is presented in Figure 17 [29].
In the long-term variation of global radiation in Sweden a slight upward trend has been noted and the average solar radiation has increased by about 8 % from the mid-1980s until today, from about 900 kWh/m2 in 1985 to the current level of the recent years, which has varied between 900–1 000 kWh/m². In 2019 annual average accumulated global radiation reached 976 kWh/m² [29]. From a PV production perspective, a rather good year, but far below the historic record of 1050,8 kWh/m2 in 2018, when long periods of anticyclone weather (where barometric pressure is high) over Scandinavia gave very sunny weather during May and July.
Production costs of PV electricity
The most common way to estimate the production cost of electricity is to calculate the levelized cost of electricity (LCOE). For calculating the LCOE for PV the following equation can be used;
𝐿𝐶𝑂𝐸 = 𝐶𝐴𝑃𝐸𝑋 + ∑ {[ 𝑂&𝑀𝑓𝑖𝑥(1 +𝑊𝐴𝐶𝐶𝑛𝑜𝑚)𝑡] + [𝑂&𝑀𝑣𝑎𝑟 ∗ 𝑌 ∗ (1 − 𝐷𝑔)𝑡−1(1 +𝑊𝐴𝐶𝐶𝑛𝑜𝑚)𝑡 ]}𝑁𝑡=1 + 𝑅𝑒𝐼𝑛𝑣(1 +𝑊𝐴𝐶𝐶𝑛𝑜𝑚)𝑥 + 𝑅𝑒𝑠𝑉𝑎𝑙𝑢𝑒(1 +𝑊𝐴𝐶𝐶𝑛𝑜𝑚)𝑁∑ [ 𝑌 ∗ (1 − 𝐷𝑔)𝑡−1(1 +𝑊𝐴𝐶𝐶𝑟𝑒𝑎𝑙)𝑡]𝑁𝑡=1
Where t is the year number ranging from 1 to N, N the lifetime of the power plant, Y the initial annual yield in year 0, Dg the annual degradation of the nominal power of the system, CAPEX the total capital expenditure of the system, made in year 0, O&Mfix the yearly fixed operation and maintenance cost, O&Mvar the variable operation and maintenance cost per produced kWh, ReInv major reinvestment needed to reach expected lifetime, x the time in years after operation start when the major reinvestment ReInv occur and ResValue the residual value or cost of the system at the end of the lifetime. WACCnom stands for nominal weighted average cost of capital per annum and is calculated by; 𝑊𝐴𝐶𝐶𝑛𝑜𝑚 = [𝐷 ∗ 𝐶𝑑 ∗ (1 − 𝐶𝑇) + 𝐸 ∗ 𝐶𝑒]𝐷 + 𝐸
where D is the total dept financing, Cd the interest rate of dept financing (Cost of dept), CT the corporate tax rate, E the total equity financing and Ce the interest rate of equity financing (Cost of equity).
Figure 18: The annual average accumulated global solar radiation in Sweden between 1984 and 2019.
Task 1 – National Survey Report of PV Power Applications in Sweden
33
The relationship between the nominal weighted average cost of capital per annum and the real weighted average cost of capital per annum WACCreal is expressed by; 𝑊𝐴𝐶𝐶𝑟𝑒𝑎𝑙 = [(1 +𝑊𝐴𝐶𝐶𝑛𝑜𝑚)(1 + 𝐼𝑛𝑓𝑙) ] − 1
were Infl stands for the annual inflation rate.
The LCOE of PV electricity very much depend on the size of the PV system and the type of actor owning the system, as the CAPEX and WACC parameters are the two most influential ones for the end result. In this report the assumptions made for the LCOE of a small residential BAPV systems on a single-family house (hereafter called villa systems) is discussed, while preliminary assumptions derived from an upcoming interview study for centralized PV parks are just listed.
The general lifetime of a villa-system is today unknown as very few PV systems in Sweden (or internationally) have been operated for longer than 20 years. The PV modules usually have a warranty of 25 or 30 years, which could be used as an indicator of the economic lifetime. It is difficult to prove that the warranty holds for PV systems in Swedish climate and determine what the degradation rate is in a northern climate, as very few studies have been made. But one study made on modules from a PV system installed 1981 on Bullerön showed that the PV modules degraded 2 % over 25 years [30]. This corresponds to a degradation rate of only 0.08 %/year. It is hard to tell from just one study if these silicon modules were of very good quality or if the Swedish climate with lower temperatures give lower module degradation in general. There are some unpublished measurements of old systems that indicate that the latter holds, so a degradation rate of 0.2 % has been assumed for the LCOE calculations.
With regards to the first-year yield of villa systems in Sweden a study summarizing the actual production of 828 (2017) and 1380 (2018) decentralized PV systems concluded that the average specific yield for Sweden adjusted to average solar irradiation was 801 kWh/kWp for 2017 and 790 kWh/kWp for 2018. Therefore, we assume a first-year yield of an average villa system to be 800 kWh/kWp. This number can of course be higher for individual systems as it depends significantly on local factors such as azimuth, tilt, shadowing effects and geographical location in Sweden (see Figure 17).
As concluded in section 2.2 the typical villa system price, both estimated by the installations companies and as average of registration systems in the Swedish direct capital subsidy programme was 14.3 SEK/kWp. Adding the Swedish VAT of 25 % the final CAPEX then becomes 17.9.
The yearly fixed operation and maintenance costs of villa systems are harder to estimate. It is believed that most of the homeowner’s take care of the administrative work, follow the PV systems production (electricity monitoring) and take care of module cleaning without reflecting over the cost of their time. Other typical O&M costs does not apply to homeowners. E.g. the insurance costs of PV systems are usually covered by the normal home insurance, there is no additional real estate tax if the PV system is mounted on the roof of a villa and there is usually no electricity and balancing cost, nor additional annual grid expenses for villa systems. The later because the law states [31] that an electricity user who has a fuse subscription of no more than 63 amperes and who produces electricity whose feed in can be made with a power of maximum 43.5 kilowatts shall not pay any fee for the feed in if the electricity user has extracted more electricity from the grid than he/she has fed in to the grid within a year. However, some cost estimations associated to the fixed operation and maintenance for homeowners can be made. One example is that Checkwatt (see section 4.4.1.2) offers a visualization product that includes an alarm if the PV production falls outside expectations to an annual cost of 420 SEK. This can be viewed as an annual electricity monitoring service. Furthermore, some utilities charge an administrative fee to handle the initial administration of renewable certificates (see section 3.2.3) and guarantees of origin (see section 3.3.7). This fee is usually a one-time fee of about 950 SEK, but it is usually not included in turnkey PV system prices. If this one-time administrative cost is distributed over the 15 years that one can get renewable electricity certificates and for a 10 kWp system, it becomes 6 SEK/kWp/a.

Task 1 – National Survey Report of PV Power Applications in Sweden
34
There are usually no variable costs associated to PV system as no fuel is consumed, nor are there any moving parts that wear out with regards to each kWh produced. However, as initial grid connection cost is included in the CAPEX and annual fixed grid cost in the O&Mfix a consistent methodology calls for that all variable costs (or income) from the grid operator is accounted for in the variable operation and maintenance. Hence, the grid benefit compensation (see section 3.3.6) that a villa system owner receives, can be regarded as a negative variable cost. The grid benefit compensation typically varies between 0.02 and 0.10 SEK/kWh for different grid operators but seems to be around 0.04 SEK/kWh on average.
It is usually assumed that the major reinvestment needed to achieve 30 years lifetime of a PV system is a one-time replacement of the inverters. No Swedish study has been conducted about the future cost of inverters, but from international studies a common derived price is 25 €/kWp [32][33], which corresponds to 260 SEK/kWp.
The residual value/cost of a PV system is very hard to estimate today, as very few PV systems have been decommissioned so far. It has been estimated that the global cumulative PV panel waste will amount to 1.7–8 million tonnes by 2030, and that the corresponding total potential material value recovered through PV panel treatment and recycling could be 450 million USD. Even if the global PV waste streams still are relatively small, an international recycling industry is starting to take form [34][35]. However, it is still difficult to speculate what the dismantling costs and recycled material value will be 30 years into the future. A common assumption is that the value of the material that is possible to recycle correspond to the cost of decommission a system and take care of all components, which leads to a residual value of 0 SEK in total. This assumption is very uncertain but the best we can do with the knowledge of today.
The estimation of the WACC for private individuals is also tricky. When it comes to the cost of equity, few people think about things like discount rate and risk for his/her personal investments. To simplify, we have therefore assumed a 100 % dept financing and that a PV system is financed through an enlargement of the mortgage loans, which rates on average was 1.6 % in 2019. As a private homeowner does not pay any corporate tax rate, the nominal weighted average cost of capital per annum becomes 1.6 %. As the goal of the Swedish National Bank (Sveriges Riksbank) is to keep the inflation at 2 % [36], the real weighted average cost of capital per annum becomes -0.4 %.
All LCOE assumptions are summarized in Table 22, and with these assumptions the LCOE of a 10 kWp villa system becomes 0.74 SEK/kWh. This is with no subsidies whatsoever. If the direct capital subsidy is used, which gives a 20 % rebate on the CAPEX, the LCOE becomes 0.6 SEK/kWh. These 0.6 SEK/kWh in production cost can be compared with the revenues of the self-consumed electricity and excess electricity in Figure 16 for assessments of profitability of small residential systems in Sweden in 2019.
With the assumptions for a 5 MWp centralized PV park listed in Table 22, the LCOE becomes 0.43 SEK/kWh. Comparing this production cost with the market value of PV the last six years in Table 19, it can be concluded that profitability for a merchant business model would only be reached with spot prices at levels seen in 2018. Hence, for market of centralized PV parks in Sweden it is still important that additional value to PV electricity is added through, either subsidies such as the renewable electricity certificates (see section 3.2.3), or by business models such as PPAs or cooperative owned PV parks (see section 2.4).
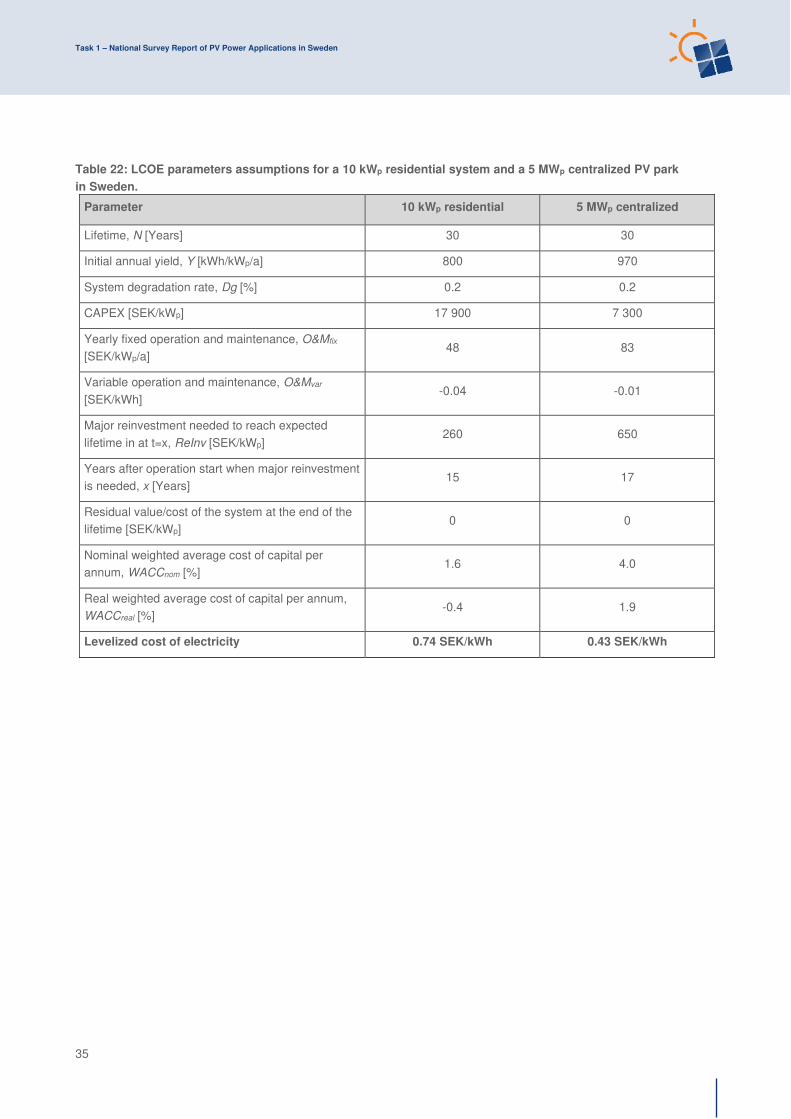
Task 1 – National Survey Report of PV Power Applications in Sweden
35
Table 22: LCOE parameters assumptions for a 10 kWp residential system and a 5 MWp centralized PV park
in Sweden.
Parameter 10 kWp residential 5 MWp centralized
Lifetime, N [Years] 30 30
Initial annual yield, Y [kWh/kWp/a] 800 970
System degradation rate, Dg [%] 0.2 0.2
CAPEX [SEK/kWp] 17 900 7 300
Yearly fixed operation and maintenance, O&Mfix [SEK/kWp/a]
48 83
Variable operation and maintenance, O&Mvar [SEK/kWh]
-0.04 -0.01
Major reinvestment needed to reach expected lifetime in at t=x, ReInv [SEK/kWp]
260 650
Years after operation start when major reinvestment is needed, x [Years]
15 17
Residual value/cost of the system at the end of the lifetime [SEK/kWp]
0 0
Nominal weighted average cost of capital per annum, WACCnom [%]
1.6 4.0
Real weighted average cost of capital per annum, WACCreal [%]
-0.4 1.9
Levelized cost of electricity 0.74 SEK/kWh 0.43 SEK/kWh

Task 1 – National Survey Report of PV Power Applications in Sweden
36
3 POLICY FRAMEWORK
This chapter describes the support policies aiming directly or indirectly to drive the development of PV. Direct support policies have a direct influence on PV development by incentivizing, simplifying or defining adequate policies. Indirect support policies change the regulatory environment in a way that can push PV development.
Table 23: Summary of PV support measures.
Category Residential Commercial +
Industrial
Centralized
Measures in 2019 On-going New On-going New On-going New
Feed-in tariffs - - - - - -
Feed-in premium (above market price)
Yes - (Yes)1 - - -
Capital subsidies Yes - Yes - Yes -
Green certificates Yes - Yes - Yes -
Renewable portfolio standards with/without PV requirements
- - - - - -
Income tax credits Yes2 - (Yes)2 - - -
Self-consumption Yes - Yes - - -
Net-metering - - - - - -
Net-billing - - - - - -
Collective self-consumption and virtual net-metering
Yes - - - - -
Commercial bank activities e.g. green mortgages promoting PV
Yes Yes - - - -
Activities of electricity utility businesses
Yes - Yes - Yes -
Sustainable building requirements
Yes - Yes - - -
BIPV incentives - - - - - -
Guarantees of origin Yes - Yes - Yes -
1 Only small commercial system can benefit from the tax credit system.
2 The feed in premium is compensated as income tax credits. It is the same system.

Task 1 – National Survey Report of PV Power Applications in Sweden
37
National targets for PV
There is no official target for future PV installation in Sweden. However, there exist a political agreement that sets a goal that Sweden will have a 100% renewable electricity system by 2040, while still planning to be a net exporter of power. The agreement is not a political stop date for nuclear, but in order to reach the goal, this implies phasing out the Swedish nuclear reactors that are coming of age and continuously pushing for new renewable energy production. Many of the introduced legislation changes in the coming years are expected to spring from this political agreement, and the Swedish PV market will most likely benefit from it.
Direct support policies for PV installations
3.2.1 Direct capital subsidy for PV installations
The current capital subsidy for solar cells was introduced on July 1, 2009. Prior to that, there was support for energy efficiency in public premises, where solar cells were included as eligible investments that could be applied for. In this program, PV systems could get 70 % of the installation costs covered and the program got the grid-connected PV market started in Sweden. The support program for public premises was introduced in 2005 and ended after 2008.
In the beginning of 2009, there was a gap with no direct support for grid-connected PV and the installation rate went down in 2009, as can be seen in Table 4. However, a new subsidy program was introduced in mid-2009, now open for all actors [37]. Support rates were 55% for large companies and 60% for all others. Originally, 50 million SEK was deposited annually for three years. This support program has since been extended, support levels have changed, and more money has been allocated, summarized in Table 24 and Table 25.
Table 24: Summary of changes in the direct capital subsidy ordinance, support level and duration [38].
Ordinance Start date Maximum coverage of the
installation costs
Initial stop
date
2005:205 Energieffektivisering i offentliga lokaler
2005-04-14 70 % 2008-12-31
2009:689 Stöd till solceller 2009-07-01 55 % for large companies
60 % all others 2011-12-31
2011:1027 ändring av 2009:689 2011-01-01 45 % 2012-12-31
2012:971 ändring av 2009:689 2013-02-01 35 % 2016-12-31
2014:1582 ändring av 2009:689 2015-01-01 30 % companies
20 % all other 2016-12-31
2016:900 ändring av 2009:689 2016-10-13 30 % companies
20 % all other 2019-12-31
2017:1300 ändring av 2009:689 2018-01-01 30 % 2020-12-31
2019:192 ändring av 2009:689 2019-05-08 20 % 2020-12-31

Task 1 – National Survey Report of PV Power Applications in Sweden
38
The original program was planned to end by the 31st of December 2011 but has been prolonged several times.
In 2017 the budget was increased even more as the government added 200 million SEK for 2017 and 525 million SEK for each of the years 2018–2020. Later another 170 million SEK was added to the 2018 budget, summing up to 1,085 million SEK in total. After the election in autumn 2018 the parliament passed an autumn budget which decreased the annual budget for the direct capital subsidy to 436 million SEK for 2019. In the spring of 2019, the new formed government added 300 million SEK to the budget and later another 500 million SEK in the next autumn budget. At the same time, it was communicated that the original budget for 2020 would be 835 million SEK. In the spring budget of 2020, another 200 million SEK was added. The budget over the years is summarized in Figure 19.
Since its introduction, the interest in the capital subsidy program has always been greater than the budget allocated. When the support was introduced the 1st of July 2009, there had been a gap since the 31st of December 2008 when support for public premises was ended, and many actors were prepared to invest. The 50 million SEK that were allocated for 2009 were therefore all applied for already in day 3 [38]. Ever since then, the amount of money applied for each year has been much higher than the allocated budget. Therefore, a long queue to get the subsidy has arisen as applications do not fall out of the line at the end of a year. When the situation was at its peak in 2016, average waiting time was on average 722 days, i.e. almost 2 years [38]. The effect of the previous long waiting times led to that the program not solely stimulated, but also constituted an upper cap of the Swedish PV market.
Until 2011 the new version of the subsidy covered 60 % (55 % for large companies) of the installation costs of PV systems, including both material and labour costs. For 2012 this was lowered to 45 % to follow the decreasing system prices in Sweden and was lowered further in 2013 to 35 %. From 2015 the level was decreased to maximum 30 % for companies and 20 % for other stakeholders. From January 1st, 2018 the Swedish government increased the subsidy level for “others” to 30 % so that all actors had the same level. From the 8 th of May 2019 the level has been decreased to 20 % for all following the decline of PV prices and increase in electricity prices for end consumers.
In the current version of the statute, funds can now only be applied for if the system costs are less than 37 000 SEK excluding VAT/kWp. Solar power/heat hybrid systems can cost up to 90 000 SEK plus VAT/kWp. If the total system costs exceed 1.2 million SEK, capital support is only granted for the part of the system cost that is less than this value (see Table 25). The 1.2 million SEK cap effectively lowers the subsidy level available for big PV systems. For example, if a large centralized PV park of 10 MW at a cost of 70 million SEK receives the 1.2 million SEK subsidy, it will only cover 1.7 % of the total system cost.
Figure 19: The annual budget of the direct capital subsidy program.

Task 1 – National Survey Report of PV Power Applications in Sweden
39
Table 25: Summary of the Swedish direct capital subsidy program [38][39][40].
Maximum
coverage of
the
installation
costs
Upper
cost
limit per
PV
system
[MSEK]
Maximum
system
cost per W
[SEK/W]
Budget
[MSEK]
Granted
funds1
[MSEK]
Disbursed
funds
[MSEK]
Yearly PV
capacity
with
support
from the
direct
capital
subsidy2
[MWp]
Yearly total
installed
grid
connected
PV capacity
[MWp]
Total
2006
–2008
70% Only for
public
building
5.0 - 138 138 138 2.96 2.83
2009 55 %
Companies
60 % Others
2.0 75 212
28.43 0.05 0.20 0.52
2010 74.12 33.23 2.07 1.78
2011 70.99 81.02 3.13 3.44
2012 45% 1.5 40 57.5 57.70 78.35 6.31 7.18
2013 35% 1.3
37
210 108.64 73.16 11.73 17.96
2014 58.94 75.60 22.30 34.00
2015 30 %
Companies
20 % Other 1.2
90 71.65 78.17 30.10 47.07
2016 316 223.04 138.79 52.58 57.23
2017 585.6 321.86 235.71 78.66 82.92
2018 30% 1085 1069.79 601.70 171.60 155.89
2019 20% 1236 828.416 676.53 206.39 286.99
Total - - - 3930.10 3051.58 2210.30 587.75 698.05
1Extract from Boverket's database 2020-05-31. The granted resources are expected payments which may change if the circumstances change in
individual cases.
2The numbers are probably higher for several of the later years, as there is a large delay in the system due to the long ques.
Since the start of the first program in 2006 until the end in 2019, 3 051.58 million SEK had been granted and 2 210.30 million SEK had been disbursed [40]. This capital has supported a total installation of 593.12 MWp so far. This means that the average subsidy for all PV systems since 2006 to 2019 has been 3.7 SEK/Wp, down from 11.8 SEK/Wp in 2015, 8.9 SEK/Wp in 2016, 5.3 SEK/Wp in 2017 and 4.6 SEK/Wp in 2018.
Listed in Table 25 is the annual installed PV capacity that has received support from the direct capital subsidy as compared to the statistics of yearly installed grid connect PV capacities. The statistic from direct capital subsidy program correlates well with the yearly installation statistics, except for 2009, 2018 and 2019. For 2009 it can be explained with a backlog of installations from the older direct capital subsidy program. The difference in the statistics for 2018 can probably be related to the switch from sales statistics to collecting the statistics from the grid owner. The explanation for the incoherence of 2019 is probably a delay in disbursement of support to already commissioned systems. A general explanation for the higher number of annual installed capacities compared to yearly PV capacity with support from the direct capital subsidy is that nowadays it is more common to complete the installation of the PV system without first being granted the direct capital subsidy. This can be seen in the database

Task 1 – National Survey Report of PV Power Applications in Sweden
40
of the program where there are several systems that have a registered system completion date that is earlier than the granted support date.
3.2.2 Direct capital subsidy program for renewable energy production in the agriculture industry
In 2015 the Swedish Board of Agriculture (Jordbruksverket) introduced a direct capital subsidy for production of renewable energy. The subsidy can be applied for if a company has a business in agriculture, gardening or herding. The subsidy is given to support production of renewable energy for both self-consumption in agricultural activities and for sale. This may be in the form of biomass, wind, hydropower, geothermal or PV [41].
The subsidy is granted for the purchase of materials, services of consultants to plan and carry out the investment, but not salary to employees or work done by the applicant. The level of the direct capital subsidy is 40 % of the total expenses. The maximum amount of aid a company can receive is decided by the respective County Administration (Länsstyrelse) or by the Sami Parliament (Sametinget) [41].
The support level of this direct capital subsidy is higher than in the national direct capital subsidy program for PV installation. This can be motivated by the fact that many agricultural companies pay a lower level of the Swedish energy tax (see section 3.3.1), which makes the value of self-consumed electricity lower than for regular electricity consumers and therefore a PV system or any other renewable system is less profitable. A higher subsidy level increases the profitability of PV installations on barns and other agriculture buildings, which is a market segment with large potential [42].
Until the end of 2019, the program has granted and disbursed support to 101 PV projects with a total capacity of 3 725 kW for a total amount of 15 744 718 SEK, in accordance with Table 26.
Table 26: Summary of the PV projects in the direct capital subsidy program for renewable production in the
agriculture industry.
Year Number of financed PV
projects
Disbursed funds
[SEK]
Installed PV capacity
[kWp]
Average cost
per kWp
2016 5 1 026 096 203 13.6
2017 25 2 865 775 632 13.2
2018 31 5 180 719 1109 12.3
2019 40 6 672 128 1781 11.9
Total 101 15 744 718 3725 12.4
3.2.3 The renewable electricity certificate system The basic principle of the renewable electricity certificate system is that producers of renewable electricity receive one certificate from the Government for each MWh produced. Meanwhile, certain electricity stakeholders are obliged to purchase certificates representing a specific share of the electricity they sell or use, the so-called quota obligation. The sale of certificates gives producers an extra income in addition to the revenues from electricity sales. Ultimately it is the electricity consumers that pay for the expansion of renewable electricity production as the cost of the certificates is a part of the end consumers' electricity price. The energy sources that are entitled to receive certificates are wind power, some small hydro, some biofuels, solar, geothermal, wave and peat in power generation, and each production facility can receive renewable electricity certificates for a maximum of 15 years and limited to the end of year 2045.
The quota-bound stakeholders are: electricity suppliers; electricity consumers who use electricity that they themselves produced if the amount used is more than 60 MWh per year and it has been produced in a plant with an installed capacity of more than 50 kWp; electricity consumers that have used electricity that they have imported or purchased on the Nordic power exchange; producers who produce electricity to a grid which is used without

Task 1 – National Survey Report of PV Power Applications in Sweden
41
support of grid concession (nätkoncession), provided the electricity used amounts to more than 60 MWh per year and if the electricity is commercially supplied to consumers who use the electricity on the same grid; and electricity-intensive industries that have been registered by the Swedish Energy Agency (Energimyndigheten).
The system was introduced in Sweden in 2003 to increase the use of renewable electricity. The goal of the certificate system at that time was to increase the annual electricity production from renewable energy sources by 17 TWh in 2016 compared to the levels of 2002. In 2012 Sweden and Norway joined forces and formed a joint certificate market. The objective then was that the electricity certificate system would increase the production of electricity from renewable sources by 26.4 TWh between 2012 and 2020 in Sweden and Norway combined. In the common market there is the opportunity to deal with both Swedish and Norwegian certificates to meet quotas [43]. In March 2015, the Swedish and Norwegian governments made a new agreement that raised the common goal of 2 TWh to 28.4 TWh until 2020. This increase will only be funded by Swedish consumers [44].
Furthermore, in the wake of the broad political agreement on the future Swedish electricity system (see section 3.1) it was decided in 2017 that the electricity certificate system will be extended to 2030 with another 18 TWh of renewable electricity. The prolongation involves a linear escalation of the 18 TWh with 2 TWh per year from 2022 to 2030. However, due to the rapid construction of wind power, the Swedish Energy Agency anticipate that the 2030 goal could be reached by as early as 2021 [45]. To avoid that the prices of the certificates drops down to zero due to over-establishment of renewable energy sources, which would be detrimental to early investors, a new proposition was circulated on March 18th, 2020. This proposition suggests that no power production constructed after 2021 will be eligible for certificates, and that the termination of the certificate system be advanced to 2035 rather than the current 2045 end date [46].
In 2019, the average price for a certificate was reduced to 90.5 SEK/MWh from the average price of 145.7 SEK/MWh in 2018 [47] and the quota obligation was increased to 30.5 %, from 29.9 % in 2018 [48]. The established trend in the level of the quota duties is summarized in Figure 21 and the price trend in Figure 20. Since the start in 2003 until the end of 2019, certificates corresponding to 294.4 TWh has been issued in Sweden with PV accounting for 463.7 GWh of them [47].
Figure 21: The quota levels in the renewable electricity certificate system [48].
Figure 20: The price development of the renewable electricity certificates [47].

Task 1 – National Survey Report of PV Power Applications in Sweden
42
Until 2005 there were no PV systems in the electricity certificate system [49]. However, as Table 27 show, the number of approved PV installations increased over the years and a majority of the approved plants in the certificate system are now PV systems. However, these systems only make up for a very small part of the total installed power and produced certificates. As can be seen in Figure 22, most of the certificates go to wind and biomass power, which produce more in the winter months. Even after considering the electricity consumption in Sweden, which is higher in the winter, the allocation of certificates is higher in the winter months. By comparing Figure 22 and Figure 23, it is easy to see the potential for solar to level out the seasonality of certificate issuance. However, the installed solar capacity would have to increase dramatically in magnitude.
340.1 MW of PV power was accepted in the certificate system at the end of 2019 [49], making it 49 % of the total installed PV grid connected capacity. As Figure 24a shows, that share has been rather constant over the years.
Figure 23: Renewable electricity certificates issued to PV produced electricity [47].
Figure 24: (a) Percentage of the installed PV power in Sweden that is approved for renewable electricity
certificates. (b) Allocated certificates to PV electricity divided by the theoretical yearly PV production[47].
Figure 22: The allocation of renewable electricity certificates to different technologies [47].
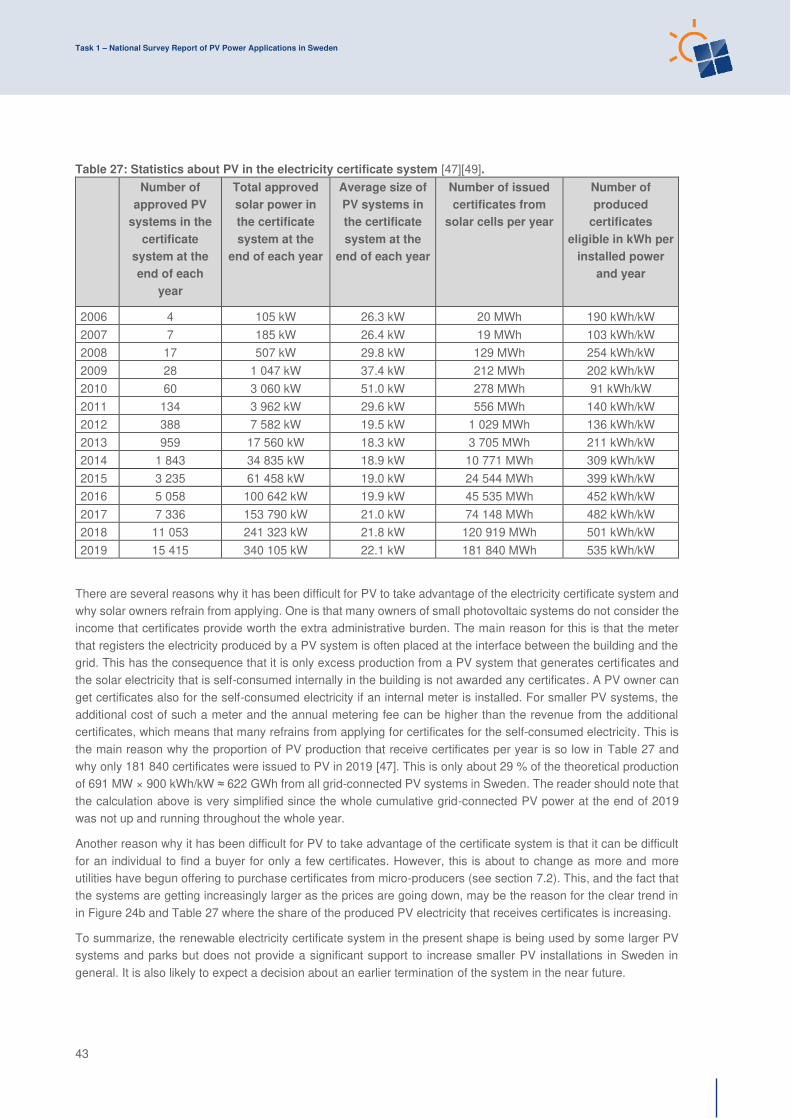
Task 1 – National Survey Report of PV Power Applications in Sweden
43
Table 27: Statistics about PV in the electricity certificate system [47][49].
Number of
approved PV
systems in the
certificate
system at the
end of each
year
Total approved
solar power in
the certificate
system at the
end of each year
Average size of
PV systems in
the certificate
system at the
end of each year
Number of issued
certificates from
solar cells per year
Number of
produced
certificates
eligible in kWh per
installed power
and year
2006 4 105 kW 26.3 kW 20 MWh 190 kWh/kW
2007 7 185 kW 26.4 kW 19 MWh 103 kWh/kW
2008 17 507 kW 29.8 kW 129 MWh 254 kWh/kW
2009 28 1 047 kW 37.4 kW 212 MWh 202 kWh/kW
2010 60 3 060 kW 51.0 kW 278 MWh 91 kWh/kW
2011 134 3 962 kW 29.6 kW 556 MWh 140 kWh/kW
2012 388 7 582 kW 19.5 kW 1 029 MWh 136 kWh/kW
2013 959 17 560 kW 18.3 kW 3 705 MWh 211 kWh/kW
2014 1 843 34 835 kW 18.9 kW 10 771 MWh 309 kWh/kW
2015 3 235 61 458 kW 19.0 kW 24 544 MWh 399 kWh/kW
2016 5 058 100 642 kW 19.9 kW 45 535 MWh 452 kWh/kW
2017 7 336 153 790 kW 21.0 kW 74 148 MWh 482 kWh/kW
2018 11 053 241 323 kW 21.8 kW 120 919 MWh 501 kWh/kW
2019 15 415 340 105 kW 22.1 kW 181 840 MWh 535 kWh/kW
There are several reasons why it has been difficult for PV to take advantage of the electricity certificate system and why solar owners refrain from applying. One is that many owners of small photovoltaic systems do not consider the income that certificates provide worth the extra administrative burden. The main reason for this is that the meter that registers the electricity produced by a PV system is often placed at the interface between the building and the grid. This has the consequence that it is only excess production from a PV system that generates certificates and the solar electricity that is self-consumed internally in the building is not awarded any certificates. A PV owner can get certificates also for the self-consumed electricity if an internal meter is installed. For smaller PV systems, the additional cost of such a meter and the annual metering fee can be higher than the revenue from the additional certificates, which means that many refrains from applying for certificates for the self-consumed electricity. This is the main reason why the proportion of PV production that receive certificates per year is so low in Table 27 and why only 181 840 certificates were issued to PV in 2019 [47]. This is only about 29 % of the theoretical production of 691 MW × 900 kWh/kW ≈ 622 GWh from all grid-connected PV systems in Sweden. The reader should note that the calculation above is very simplified since the whole cumulative grid-connected PV power at the end of 2019 was not up and running throughout the whole year.
Another reason why it has been difficult for PV to take advantage of the certificate system is that it can be difficult for an individual to find a buyer for only a few certificates. However, this is about to change as more and more utilities have begun offering to purchase certificates from micro-producers (see section 7.2). This, and the fact that the systems are getting increasingly larger as the prices are going down, may be the reason for the clear trend in in Figure 24b and Table 27 where the share of the produced PV electricity that receives certificates is increasing.
To summarize, the renewable electricity certificate system in the present shape is being used by some larger PV systems and parks but does not provide a significant support to increase smaller PV installations in Sweden in general. It is also likely to expect a decision about an earlier termination of the system in the near future.

Task 1 – National Survey Report of PV Power Applications in Sweden
44
3.2.4 BIPV development measures
There were no specific BIPV measures in Sweden in 2019.
Self-consumption measures
Self-consumption of PV electricity is allowed in Sweden and is the main business model that is driving the market. Several utilities offer various agreements for the excess electricity of a micro-producer.
Since the spring of 2014 an ongoing debate about what tax rules that apply to micro-producers has been under way, and consequently several changes in the different tax laws has occurred since then. Listed in this section are some specific tax laws that affect self-consumption and micro-producers.
Table 28: Summary of self-consumption regulations for small private PV systems in 2019
PV self-consumption 1 Right to self-consume Yes
2 Revenues from self-consumed PV Savings on the electricity bill
3 Charges to finance Transmission, Distribution grids & Renewable Levies
None
Excess PV electricity 4 Revenues from excess PV electricity injected into the grid
Various offers from utilities + 0.6 SEK/kWh + Green certificates + Feed in compensation from the grid owner
5 Maximum timeframe for compensation of fluxes
One year
6 Geographical compensation (virtual self-consumption or metering)
On site only
Other characteristics 7 Regulatory scheme duration Subject to annual revision
8 Third party ownership accepted Yes
9 Grid codes and/or additional taxes/fees impacting the revenues of the prosumer
Grid codes requirements
10 Regulations on enablers of self-consumption (storage, DSM…)
Storage investment subsidy
11 PV system size limitations 1.Below 43.5 kWp and 63 A, and net-consumer on yearly basis, for free feed-in subscription towards the grid owner.
2.Below 100 A and maximum 30 MWh/year for the tax credit.
3.Below 255 kWp for no energy tax on self-consumed electricity.

Task 1 – National Survey Report of PV Power Applications in Sweden
45
12 Electricity system limitations None
13 Additional features Feed in compensation from the grid owner
3.3.1 General taxes on electricity In Sweden, taxes and fees are charged at both the production of electricity and at the consumption of electricity. Taxes that are associated with the production of electricity are property taxes (see section 3.6.1), taxes on fuels and taxes on emissions to the atmosphere.
The taxes associated with electricity consumption are mainly the energy tax on electricity and the value added tax (VAT). The manufacturing and agriculture industry paid 0.005 SEK/kWh in energy tax in 2019. The Energy tax rate has been increased in steps for residential customers the last couple of years after the Swedish Energy Commission (see section 3.1) decided to remove the specific tax on nuclear and finance that with a higher energy tax [50]. The latest increase occurred the first of January 2020 when the energy tax was increased from 0.347 SEK/kWh (excluding VAT) to 0.353 SEK/kWh. The exception is some municipalities in northern Sweden where the energy tax now is 0.257 SEK/kWh (excluding VAT) [51]. Additionally, a VAT of 25 % is applied on top of the energy tax. Altogether, roughly 40 % of the total consumer electricity price (including grid fees) was taxes, VAT and certificates in 2019.
3.3.2 Energy tax on self-consumption There has been an ongoing modernization of the Swedish tax rules when it comes to taxation on self-consumed electricity. The current rules, which were implemented on July 1st, 2017, can be can be summarized as [51]:
• A solar electricity producer that owns one or more PV systems whose total power amounts to less than 255 kWp does not have to pay any energy tax for the self-consumed electricity consumed within the same premises as where the PV systems is installed.
• A solar producer that owns several PV systems, which total power amounts to 255 kWp or more, but where all the individual PV systems are smaller than 255 kWp, pays an energy tax of 0.005 SEK/kWh on the self-consumed electricity used within the same premises as where the PV systems is installed.
• A solar producer that owns a PV system larger than 255 kWp pays the normal energy tax of 0.347 SEK/kWh on the self-consumed electricity used within the same premises as where the PV systems is installed, but 0.005 SEK/kWh in energy tax for the self-consumed electricity from the other systems if they are less than 255 kWp.
The current legislation has the effect that few PV systems over 255 kWp are built for self-consumption in Sweden. The full energy tax on self-consumed electricity limits the profitability for those systems. This leads to that the large technical potential of PV systems within the industrial sector currently is unexploited.
When it comes to systems smaller than 255 kWp the main economic obstacle for real estate owners that plan to build several small PV systems has been removed with this legislation. However, the administrative burden of measuring and reporting the self-consumed electricity if the total power limit of 255 kWp is exceeded remains.
However, there is an ongoing discussion on how to tax self-consumption, and it is not unlikely that changes to this legislation will take place in the near future. One positive prospect in this matter is that the government has declared their purpose to remove the 0.005 SEK/kWh energy tax for real estate owners that own several small systems, and thereby remove the administrative barrier, by sending in a state aid notification to the EU Commission [52].
3.3.3 Deduction of the VAT for the PV system Sweden has a non-deductible VAT for permanent residents. The possibility to deduct the input VAT for a PV system therefore depends on whether all produced electricity is sold, or if a portion of the generated electricity is consumed directly for housing and only the excess electricity is sold to an electricity supplier [53].

Task 1 – National Survey Report of PV Power Applications in Sweden
46
If only the excess electricity is sold to an electricity supplier and the PV system also serves the private facility, then deduction of the VAT for the PV system is not allowed. If all generated electricity is delivered to an electricity supplier, then the PV system is used exclusively in economic activity and deduction of the VAT for the PV system is allowed.
However, according to Case 6174-18 of the Swedish Supreme Administrative Court, it is stated that the VAT deduction waiver for permanent housing does not include homeowner’s association's (BRF) acquisition of PV systems. The homeowner’s association is granted the right of deduction for VAT as long as the acquisition is attributable to the association's VAT liable sales of surplus electricity. In summary, this means that a homeowner’s association may deduct VAT on the investment in a PV system corresponding to the proportion of electricity that will be sold to the electricity grid.
3.3.4 VAT on the revenues of the excess electricity A PV system owner that sells the excess electricity will receive compensation from the electricity trading utility company and from the grid owner (see section 3.3.5). If the total renumeration from the property (including other revenue streams than selling excess electricity) under a tax year exceeds 30 000 SEK, excluding VAT, the house owner needs to register for VAT and handle the VAT streams between the utilities that buy the excess electricity and the tax agency (see Figure 25). If the total annual sales do not exceed 30 000 SEK the PV system owner are exempted from VAT [54].
At a reimbursement from a utility company of 0.5 SEK/kWh, 60 000 kWh can be sold per year before reaching the limit. At a self-consumption rate of 50 % it corresponds to a PV system of a size of about 120 kWp. Hence, as a general rule of thumb, the 30 000 SEK limit corresponds to PV systems of 100–200 kWp, which is a very large PV system size for regular homeowners.
The limit of 30 000 SEK was implemented the 1st of January 2017 and is an improvement for the Swedish PV market. In 2016 a private homeowner needed to go through the administration of registering for VAT and reporting the VAT to the Government. The new set of rules makes it much easier for a household to invest in PV in Sweden. Furthermore, it has also reduced the administration for the tax agency as it doesn't need to handle the registration of several thousands of private PV owners. As the Government is not losing any tax income, as illustrated in Figure 25, it is a win-win situation for all parties as compared to before the 1st of January 2017.
3.3.5 Tax credit for micro-producers of renewable electricity The 1st of January 2015, an amendment to the Income Tax Act was introduced [55]. The tax credit is 0.60 SEK/kWh for renewable electricity fed into the grid. The right to receive the tax credit applies to both physical and legal persons. To be entitled to receive the tax credit the PV system owner must:
• feed in the excess electricity to the grid at the same connection point as where the electricity is received, • not have a fuse that exceed 100 amperes at the connection point, • notify the grid owner that renewable electricity is produced at the connection point.
Figure 25: Illustration of the revenue and VAT streams for the excess electricity for a private PV owner
before and after the 1st of January 2017.

Task 1 – National Survey Report of PV Power Applications in Sweden
47
The basis for the tax reduction is the number of kWh that are fed into the grid at the connection point within a calendar year. However, the maximum number of kWh for which a system owner can receive the tax credit may not exceed the number of kWh bought within the same year. In addition, one is only obliged to a maximum of 30 000 kWh per year. The grid owner will file the measurement on how much electricity that has been fed into and out of the connection point in one year and the data will be sent to the Swedish Tax Agency (Skatteverket). The tax reduction will then be included in the income tax return information, which should be submitted to the Swedish Tax Agency in May the following year.
The tax credit of 0.60 SEK/kWh is received on top of other compensations for the excess electricity, such as compensation offered by electricity retailer utility companies (see section 7.2), the grid benefit compensation (see section 3.3.6) and revenues for selling renewable electricity certificates and guarantees of origins (see section 3.2.3 and 3.3.7). The tax credit system can be seen as a feed-in premium for the excess electricity. However, unlike the case in other European countries, the Swedish tax credit system does not offer a guaranteed revenue over a specific period. This means that the extra income that a micro-producer receives from the tax credit system when feeding electricity to the grid can be withdrawn, increased or decreased by a political decision.
According to the Swedish Tax Agency 29 512 micro-producers of renewable electricity received a total 74 884 654 SEK for excess electricity fed into the grid in 2019. This amount is based on 124 807 MWh of excess electricity fed into the low voltage grid by micro producers, reported by the grid operators to the Swedish Tax Agency. The average production fed into the grid per micro-producer with a capacity of less 100 amperes was thereby 4 229 kWh in 2019, as summarized in Table 29.
Table 29: Statistics about tax credit for micro-producers of renewable electricity.
Year
Number of micro-
producers
Paid funds each year
[SEK]
The basis (excess
electricity) of the tax
reduction [kWh]
Average electricity fed
into the grid per
micro-producer
[kWh/micro-producer]
2015 5 391 11 421 003 19 035 005 3 531
2016 8 161 19 545 400 32 575 667 3 992
2017 12 138 30 068 341 50 113 902 4 129
2018 20 350 57 098 546 95 164 243 4 676
2019 29 762 75 682 222 126 137 037 4 238
Total - 193 815 512 323 025 853 -
These numbers contain, not only PV, but all small-scale renewable production. To get an estimation of the share of PV in the tax reduction one can look at the power of systems that had a production capacity below 69 kW (which corresponds to the 100-ampere limit of the tax reduction) in the green electricity certificate system. In total there was 224 677 kW of systems with a power less than 69 kW by 2019-12-31. Of this power 220 111 kW was PV, and the rest was 2 372 kW wind, 1 235 kW hydro and 959 kW biofuel or peat system [49]. If one uses this relationship, a rough estimation is that 189 876 695 SEK of the total 193 815 512 SEK has been paid to PV system owners through the tax credit for micro-production system until the end of 2019. This calculation is just a rough estimation since both the total produced electricity in a year and the self-consumption ratio differ between the different renewable energy technologies and between all the individual production facilities.
3.3.6 Grid benefit compensation A micro-producer is entitled to reimbursement from the grid owner for the electricity that is fed into the grid. The compensation shall correspond to the value of the energy loss reduction in the grid that the excess electricity entails [31]. The compensation varies between different grid owners and grid areas and is typically between 0.02 and 0.10 SEK/kWh.

Task 1 – National Survey Report of PV Power Applications in Sweden
48
3.3.7 Guarantees of origin Guarantees of origin (GOs), were introduced in Sweden on December 1st in 2010, and are electronic documents that guarantee the origin of the electricity. Electricity producers receive a guarantee from the Government for each MWh of electricity. The electricity producer can then sell GOs on an open market. The buyer is usually a utility company who wants to sell that specific type of electricity. Utilities buy guarantees of origin corresponding to the amount of electricity they would like to sell. GOs are issued for all types of power generation and applying for guarantees of origin is still voluntary.
When the electricity supplier has bought the GOs and sold electricity to a customer, the GOs are nullified. The nullification ensures that the amount of electricity sold from a specific source is equivalent to the amount of electricity produced from that source.
Table 30: Statistics about solar guarantees of origin [47].
Year
Solar GOs
issued in
Sweden
Solar GOs
transferred
within
Sweden
Solar GOs
imported to
Sweden
Solar GOs
exported from
Sweden
Solar GOs
nullified in
Sweden
Solar GOs
that expired in
Sweden
2011 194 96 - - 0 0
2012 378 173 - - 104 90
2013 2 337 1 373 - - 324 294
2014 7 846 4 563 - - 1 510 972
2015 18 953 11 301 - - 5 314 2 830
2016 36 702 22 183 - - 11 966 9 454
2017 58 806 65 936 1 481 437 69 279 96 442 16 146
2018 111 143 1 306 626 568 810 1 467 852 317 167 29 499
2019 166 670 894 568 1 527 014 526 292 976 716 51 935
A utility company that wants to sell, for example, electricity from PV can do so in two ways. Either by nullify guarantees of origin from its own PV-system, or by purchasing guarantees of origin from a PV-system owner and nullify them when the supplier sells the electricity to the end customer.
The GO act (2010:601) and regulation (2010:853) was changed the first of June 2017 to enable the Swedish Energy Agency to issue GOs for electricity that can be transferred to another EU Member State [56]. Thus, the Swedish GO system now has been adapted to the EECS standard.
As a result of the new legislation and due to the increase of PV system the trading with solar GOs in Sweden increased dramatically, as can be seen in Table 30. In 2017 a lot of solar GOs was imported to Sweden, and in 2018 a lot of them was exported. 2019 is once again seeing an increase in imported solar GOs, along with a three-fold increase in nullification from the year before.
The trading volumes of solar GOs are still too small in Sweden for the system to really generate an actual market price. But according to Svensk Kraftmäkling (SKM), the largest brokerage firm in the Nordic electricity market, Solar GOs were generally traded in Europe for 60 €-cents/MWh in 2019, which would translate to the value 0.006 SEK/kWh. However, some Swedish utilities buy solar GOs issued in Sweden from small-scale PV owners for a much higher price.
Task 1 – National Survey Report of PV Power Applications in Sweden
49
Collective self-consumption, community solar and similar measures
Collective self-consumption from a PV system in an apartment building is allowed in Sweden if all the apartments share the same grid subscription. A number of housing companies and housing societies are using this option. The general approach for such a solution is that the whole apartment building share one electricity contract with the utility and that the electricity is included in the rent, but that electricity consumption is being measured internally by the housing company/society and the monthly rent is affected by this consumption.
Collective self-consumption where the electricity is transported over a grid that is covered by a grid concession is currently not allowed.
Tenders, auctions & similar schemes
There were no national or regional tenders or auctions in 2019 in Sweden. However, commercial PPAs for PV exists in Sweden.
Utility-scale measures including floating and agricultural PV
There were no specific national or regional subsidies for utility-scale PV in Sweden in 2019. The support and measures accessible for utility-scale PV are the general support schemes of the direct capital subsidy (see section 3.2.1) but with a cap of 1.2 million SEK per system which lowers the benefits of utility-scale centralized PV parks, the green electricity certificate system (see section 3.2.3) and the guarantees of origin system (see section 3.3.7).
3.6.1 Property taxes Power generation facilities in Sweden are charged with a general industrial property tax. Today the PV technology is not defined as power generation technology in the valuation rules for power production units in the real estate law (Fastighetstaxeringslagen). The tax agency has so far classified the few large PV parks that exist as “other building” and taxed them as an industrial unit. Currently the property tax of an industrial unit represents 0.5 % of the assessed value of the facility [57].
Social Policies
There were no social policy measures directed to PV in Sweden in 2019.
Retrospective measures applied to PV
There are currently no retrospective measures applied to any subsidies for PV in Sweden.
Indirect policy issues
3.9.1 Rural electrification measures There were no rural electrification measures in Sweden in 2018.
3.9.2 Exemption for building permits for solar energy systems As from the first of August 2018 PV and solar thermal system installations on buildings are exempted from building permits in general. Some installations still require building permits, and that is when the one of following situations applies [58]:
• When the PV or solar thermal system does not follow the shape of the current building. • When the PV or solar thermal system is installed within a residential area that is classified as valuable
from either a historical, cultural, environmental or artistic point of view.

Task 1 – National Survey Report of PV Power Applications in Sweden
50
• When the PV or solar thermal system is installed within a residential area where the municipality in the detailed development plan defined that building permits are required for solar systems.
• When the PV or solar thermal system is installed within an area that are of national interest for the military. Maps over these areas are located can be found here.
In these cases, a regular building permit must be submitted to the municipality.
3.9.3 Direct capital subsidy for storage of self-produced electricity
To help increase individual customers possibility to store their own produced electricity the Swedish Government has introduced a direct capital subsidy for energy storage owned by private households. The subsidy is given for energy storages that fulfil these criteria [59];
• connected to an electricity production system for self-consumption of renewable electricity, • connected to the grid, • helps to store electricity for use at a time other than the time of production, • which increases the annual share of self-produced electricity used within the property to better meet the
electricity consumption.
The state aid is not given to installations of storage that has received the ROT tax deduction (see section 3.9.7) or any other public support. Eligible costs are the costs of installing electrical energy storage systems, such as batteries, cabling, control systems, smart energy hubs and installation work. The subsidy is only granted to individuals with a maximum of 60 % of the eligible costs, but no more than 50 000 SEK [59].
For other end consumers than private households, that want to invest in PV with storage, the storage can be included in the overall system cost in the regular direct capital subsidy for PV (see section 3.2.1)
The state aid for storage program was introduced in November 2016, but all storage installations that meet the criteria and were installed in 2016 are entitled to apply for the subsidy. The budget for the storage subsidy program is 25 million SEK for 2016 and 50 million per year for 2017 to 2019. However, the budget for this subsidy has not been used in any single year. The total granted and disbursement of funds as of the end of 2019 was 51 766 639 SEK and 23 817 471 SEK, respectively.
3.9.4 Future aggregated grid subscriptions
From 2021 it will be possible to subscribe for aggregated grid contracts for connection points in areas where Svenska Kraftnät previously refused increased grid connection capacities. The prerequisite is that there are connection agreements for the points and that it is technically possible to connect them. An aggregated subscription means that the grid customer is given the opportunity to transfer power between the different connection points that are included in the aggregated subscription. These can be used to alleviate the situation in areas where there is a lack of grid capacity. The change is being implemented in the existing tariff structure in order to be able to facilitate the rapidly emerging markets relatively quickly.
3.9.5 Support for electric vehicles
3.9.5.1 The Bonus-Malus systems
The Bonus Malus system was introduced the 1st of July 2018 to replace the previously existing system of five-year tax exemption for vehicles classified as a green vehicle.
The main cause for the new law was to increase the share of vehicles with low carbon footprint and to lower the dependency of fossil fuels in the fleet of vehicles. For cars and light trucks taken into use from the 1st of July 2018, an individual can get up to 60 000 SEK as a capital subsidy. For every gram of carbon dioxide per kilometre that the vehicle emits, the bonus is reduced by a set amount. If the vehicle was sold and taken into use prior to 2020, the bonus is reduced by 833 SEK per additional gram. For vehicles taken into use in 2020 or later, the bonus is reduced by 713 SEK per additional gram. The lowest bonus was 10 000 SEK at 60 gCO2/km and from there the

Task 1 – National Survey Report of PV Power Applications in Sweden
51
bonus ceases. However, as of 2020, the lowest bonus can now be obtained for vehicles with emissions at 70 gCO2/km. Furthermore, the maximum bonus cannot exceed 25 percent of the vehicles’ price [60].
A company can also get a bonus. However, for companies it is up to 35 percent of the price difference between the price of the low emitting vehicles’ and the price for the closest comparable vehicle [61].
For petrol- and diesel-powered vehicles, an increased vehicle tax (malus) is added for the first three years. The tax increase is based on how much carbon dioxide the vehicle emits. If the vehicle emits 96-140 gCO2/km the tax increase is 82 SEK per gram carbon dioxide emitted per kilometre. If the vehicle emits more than 140 gCO2/km the tax increase is 107 SEK per gram carbon dioxide emitted per kilometre.
For 2019, there was 1.28 billion SEK administered by the Swedish Transport Agency [62]. Year 2020 has an increased budget of 1.76 billion SEK.
3.9.5.2 Subsidies for charging infrastructure
To favour the development of the electrical vehicle market it is important to create a liable charging infrastructure. In 2015 a capital subsidy (Klimatklivet) was established, aimed at supporting local and regional investments that lower carbon dioxide emissions. The grant is administered by the Swedish Environmental Protection Agency (Naturvårdsverket) and can be applied by everyone besides private individuals. Investments in charging infrastructure is one of the types of projects that can be subsidised. Since 2015 to 2019, 2061 charging infrastructure projects have been granted adding up to 409.7 MSEK [63]. The grant is up to 50 percent of the eligible costs [64]. Eligible costs are the costs needed to achieve the objectives of the project. A basic requirement for the cost to be eligible is that it must be necessary for the implementation of the project.
From 2015 the applications for Klimatklivet could be granted for charging infrastructures for both public and private use. But in 2019 another type of grant was established for charging infrastructure for private persons [65]. The capital subsidy for private charging infrastructure is also administrated by the Swedish Environmental Protection Agency (Naturvårdsverket) but will no longer be a part of Klimatklivet. This new subsidy program was implemented to make the application procedure easier. The capital subsidy is up to 50 percent of the eligible costs, however, there is a maximum of 15,000 SEK per charging point. Eligible costs are the material and labour costs that are needed to install the charging point, such as the cost for the charging box and for the electrical wiring. Costs that has received any other public support do not qualify as eligible costs [65].
In December 2017 the government decided to implement a grant for investments in charging infrastructure for electrical vehicles. The grant (Ladda-hemma) is only given to private individuals and the charging point must be installed on a property that the applicant owns [66]. The grant is up to 50 percent of the eligible costs, however, there is a maximum of 10,000 SEK per property. Eligible costs are the material and labour costs that are needed to install the charging point, such as the cost for the charging box and for the electrical wiring. Labour costs that have received the ROT tax deduction (see section 3.9.7) or any other public support do not qualify as eligible costs [66].
In 2019 the grant (Ladda-hemma) for charging infrastructures was renamed to “Ladda bilen” and was extend so that also companies, housing cooperatives and municipalities can apply for money. A single home can still get up to 10,000 SEK, while other actors can get up to 15,000 SEK per charging point.
3.9.6 Curtailment policies There were no rules when it comes to curtailment of renewable electricity in Sweden in 2018.
3.9.7 ROT tax deduction The ROT-program is an incentive program for private persons that buy services from the construction industry in Sweden in the form of tax credits. ROT is a collective term for measures to renovate and upgrade existing buildings, mainly residential properties. Reparations and maintenance as well as conversions and extensions are counted as ROT work and are therefore tax deductible, provided that such work is carried out in close connection with a residence that the client owns and in which he or she lives, or if it is a second home, like a recreational summerhouse [67].

Task 1 – National Survey Report of PV Power Applications in Sweden
52
The ROT-tax deduction in 2019 was 30 % of the labour cost and of maximum 50 000 [67] for the installation of a PV system. The requirements are that the house is older than five years and that the client has not received the direct capital subsidy for PV. Installation or replacement of solar panels are entitled ROT, while services of solar panels are not.
According to the Swedish Tax Agency labour costs are estimated at 30 % of the total cost, including VAT. The total deduction for the whole PV systems was therefore 9 % in 2019. If it can be proved that the labour costs constitute a higher proportion than 30 %, the total deduction then consequently becomes higher.
The upside of the ROT-tax deduction scheme is that there is no queue and that the PV owner can be sure of receiving this subsidy. Some homeowners therefore install their PV systems with the ROT tax deduction and later pay this back to the Government if they receive the direct capital subsidy for PV.
Financing and cost of support measures
In the first version of the direct capital subsidy program 142 531 152 SEK were disbursed and in the second version a total of 2 072 296 562 SEK has been disbursed from 2009 to the end of 2019 (see section 3.2.1). This system is financed by the Swedish state budget and the money is distributed by the 21 county administrations.
In addition, the direct capital subsidy for renewable energy production in the agriculture industry program has under 2015–2019 granted a total support of 15 744 718 SEK to PV systems (see section 3.2.2). This system is financed by the European Agricultural Fund for Agricultural Development (EJFLU), meaning the funding comes from the European Union.
Furthermore, PV systems have benefited from the renewable electricity certificate system and had at the end of 2019 received a total of 463 720 certificates over the years (see section 3.2.3). By taking the monthly average prices for the certificates and multiplying these prices with the number of certificates that has been issued to PV in each month the total support to PV by the end of 2019 becomes 53 434 745 SEK [47]. The renewable electricity certificate system is financed by electricity consumers, except for electricity-intensive industries that have certificate costs only for the electricity that is not used in the manufacturing process.
Finally, a rough estimation is that a total of 189 876 695 SEK (see section 3.2.7) has been paid to small scale PV system owners through the tax credit for micro-producers of renewable electricity subsidy under 2015–2019. This subsidy financed by the Swedish state budget.
Adding all the above subsides the Swedish PV market had at the end of 2019 in total received about 2 458 million SEK in direct subsidies.

Task 1 – National Survey Report of PV Power Applications in Sweden
53
4 INDUSTRY
The Swedish PV industry mainly contains of small to medium size installers and retailers of PV modules or systems. At the writing of this report the author was aware of 314 companies that sold and/or installed PV modules and/or systems in the Swedish market (see section 4.6) in 2019. In addition, the author was also aware of 41 consultancy firms working with different aspects of PV in Sweden (see section 4.7).
With regards to the upstream industry there were 2 active module producers in Sweden in 2019 (see section 4.3), even if the production volumes were small, and 12 companies active in manufacturing of production machines or balance of systems equipment (see section 4.4). Furthermore, the author was aware of 11 companies that can be classified as R&D companies, or companies that had R&D divisions in Sweden (see section 4.5) in 2019.
Unfortunately, there is a trend of fewer and fewer upstream PV industry companies in Sweden. Several Swedish module manufacturers shut down or went bankrupt around 2010-2012, namely ArticSolar, Eco Supplies, Latitude Solar, PV Enterprise and REC Scanmodule. In recent years several Swedish start-ups, R&D companies and manufacturers of BoS products have been forced to close down, e.g. Optistring Technologies AB (in 2017), Box of Energy AB (in 2018), Sol Voltaics AB (2019), Solibro Research AB (in 2019), Solar Wave (in 2019), and Solarus Sunpower AB (in 2020).
4.1.1.1 Svensk Solenergi
Svensk Solenergi is a trade association which, with about 260 professional members, representing both the Swedish solar energy industry and market as well as the research institutions active in the solar energy field. Since the Swedish PV market is still rather small, the association's resources have so far been rather limited. However, the organisation is growing, and the activity is increasing.
Production of feedstocks, ingots and wafers
Sweden did not produce any feedstock or wafers in 2019 and there are currently no plans for this kind of production in the future.
Production of photovoltaic cells and modules
Module manufacturing is defined as the industry where the process of the production of PV modules (the encapsulation) is done. A company may also be involved in the production of ingots, wafers or the processing of cells, in addition to fabricating the modules with frames, junction boxes etc. The manufacturing of modules may only be counted to a country if the encapsulation takes place in that country.
In the beginning of 2011, there were five module producers in Sweden that fabricated modules from imported silicon solar cells. In the acceleration of PV module price reductions on the world market in 2011 and 2012 the Swedish module manufacturers struggled (along with the rest of the module production industry) and at the end of 2012 only SweModule AB of the Swedish companies remained in business. In 2015 also SweModule was filed for bankruptcy, and there is no longer any large-scale module production in Sweden. Renewable Sun Energy Sweden AB, who bought the production equipment and the brand SweModule produced 1 MW of commercial modules as part of their product development in 2019. Furthermore, CIGS thin film equipment manufacturer Midsummer AB inaugurated a BIPV production line in Sweden in October 2019 and did produce some BIPV modules that same year. In total 1.36 MWp of modules where therefore produced in Sweden in 2019. However, both SweModule And Midsummer has announced plans to produce larger quantities in 2020.
Total PV cell and module manufacturing together with production capacity information is summarised in Table 31 below.
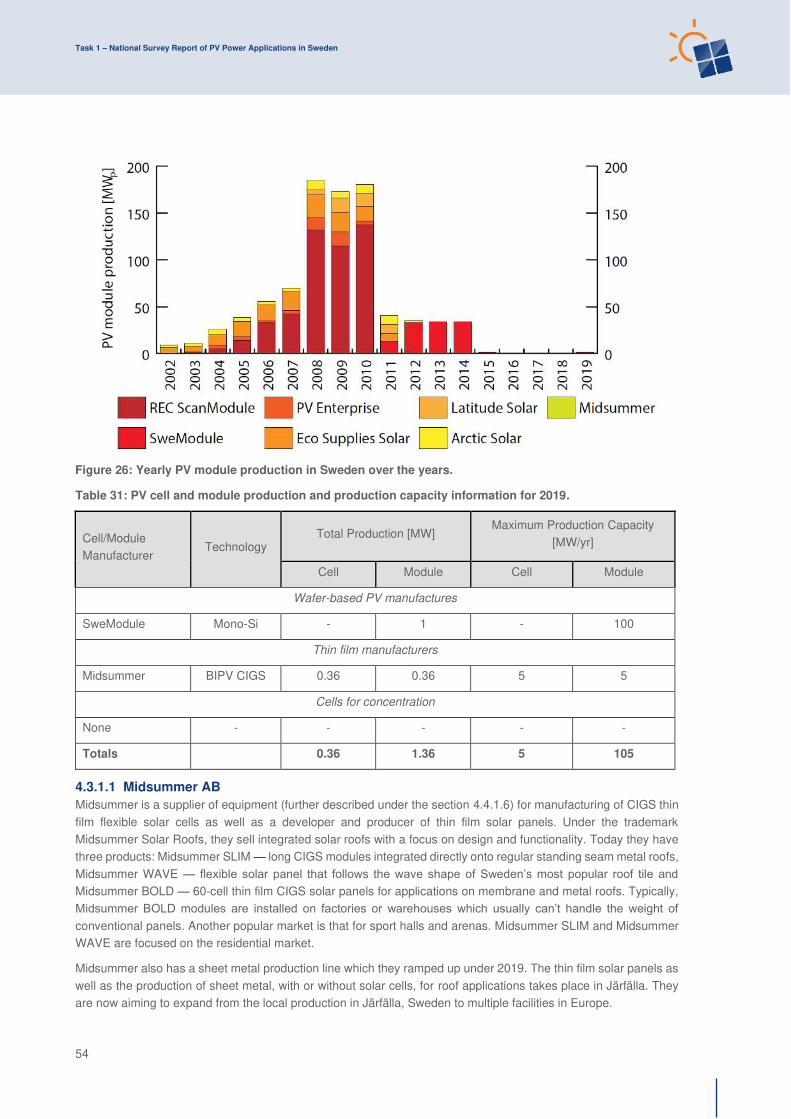
Task 1 – National Survey Report of PV Power Applications in Sweden
54
Table 31: PV cell and module production and production capacity information for 2019.
Cell/Module Manufacturer
Technology Total Production [MW]
Maximum Production Capacity [MW/yr]
Cell Module Cell Module
Wafer-based PV manufactures
SweModule Mono-Si - 1 - 100
Thin film manufacturers
Midsummer BIPV CIGS 0.36 0.36 5 5
Cells for concentration
None - - - - -
Totals 0.36 1.36 5 105
4.3.1.1 Midsummer AB
Midsummer is a supplier of equipment (further described under the section 4.4.1.6) for manufacturing of CIGS thin film flexible solar cells as well as a developer and producer of thin film solar panels. Under the trademark Midsummer Solar Roofs, they sell integrated solar roofs with a focus on design and functionality. Today they have three products: Midsummer SLIM — long CIGS modules integrated directly onto regular standing seam metal roofs, Midsummer WAVE — flexible solar panel that follows the wave shape of Sweden’s most popular roof tile and Midsummer BOLD — 60-cell thin film CIGS solar panels for applications on membrane and metal roofs. Typically, Midsummer BOLD modules are installed on factories or warehouses which usually can’t handle the weight of conventional panels. Another popular market is that for sport halls and arenas. Midsummer SLIM and Midsummer WAVE are focused on the residential market.
Midsummer also has a sheet metal production line which they ramped up under 2019. The thin film solar panels as well as the production of sheet metal, with or without solar cells, for roof applications takes place in Järfälla. They are now aiming to expand from the local production in Järfälla, Sweden to multiple facilities in Europe.
Figure 26: Yearly PV module production in Sweden over the years.

Task 1 – National Survey Report of PV Power Applications in Sweden
55
4.3.1.1 SweModule
Module production has taken place in Glava, Värmland since 2003 when REC ScanModule AB built a module production facility there. In end of 2010 REC ScanModule AB closed down their production, but the facilities were taken over by SweModule AB that continued to produce modules from imported silicon solar cells. In 2015 SweModule went bankrupt. In total, over 2 500 000 multi crystalline silicon modules, corresponding to 500 MW, have been produced at the site since 2003. However, it seems like these numbers will increase in the coming years as the production facilities in September in 2016 were acquired by the newly formed company Renewable Sun Energy Sweden AB. The company begun with refurbishment and repairing of some of the equipment in 2016 and in 2017 the equipment was upgraded to be able to produce monocrystalline modules with four- and five-busbars. Under 2018 the certification process of their four- and five-busbars modules was finalised, and the factory is now ready to produce larger quantities. Under 2016, 2017 and 2018, small quantities of approximately 100, 250 and 500 modules respectively were produced to test the equipment. In 2019, the company produced about 3 000 modules, which was sold mainly to the Swedish and African PV market.
4.3.1.2 Windon AB
Windon was started in 2007 after a year of product development of different PV equipment. In 2011 Windon became an OEM by producing PV modules with its own brand in SweModules production facility in Glava, Sweden. Since the closure of the production facility in Glava in 2015, the company first moved their OEM production of modules to a factory in Poland, but since the beginning of 2017 almost all of Windons modules are produced on two production lines in a facility in northern Italy by Windon’s own staff. For 2020 Windon plans to expand their module production by also producing some quantities in Latvia in addition to the production in Italy. In addition to the module production the company also produces mounting material and inverters (see section 4.4.1.12).
Manufacturers and suppliers of other components
4.4.1.1 ABB
ABB, with origin in Sweden, is a global company group specialized in power and automation technologies. Based in Zurich, Switzerland, the company employs 135 000 people and operates in approximately 100 countries. ABB employs 9 000 people in Sweden and has operations in 30 different locations. At an international level, ABB produces and provides a wide portfolio of products, systems and solutions along the solar PV value chain that enable the generation, transmission and distribution of solar power for both grid-connected and micro-grid applications.
ABB's offering includes, low-voltage and grid connection, stabilization and integration products, complete electrical balance of plant solutions as well as a wide range of services including operations and maintenance, and remote monitoring. In Sweden ABB manufactures breakers, contactors, electricity meters, enclosures, miniature circuit breakers, pilot devices, power supply relays, residual current devices, surge suppressors, switch disconnectors, and terminal blocks, which all can be used in PV systems.
4.4.1.2 Checkwatt AB
Emulsionen Ekonomiska Förening has for many years been offering a metering system, which includes equipment and an IT system to micro-producers so they can receive the green electricity certificate system (see section 3.2.3) for the self-consumed electricity as well. The system sits directly by the solar or wind power inverter and reports the gross production for allocation of certificates. In 2017 the consultant company Emulsionen placed their metering concept in the newly formed Checkwatt AB so that this company could solely focus on the metering business.
The actual meter of Emulsionen/Checkwatt is manufactured in China, but the company assembles the data logger in Sweden. In total Emulsionen/Checkwatt has sold about 2 000 units over the years. Of these around 800 were sold under 2018. Under 2017 Checkwatt also developed their product so that the meter and the IT system are compatible with the data that the grid operator have and to data provided by solar radiation sensors. Among other services, Checkwatt offers; Power meters – MID-certified with gateway communicating with cloud server and associated visualisation and monitoring services, management of Green Electricity Certificates and Guarantees of Origin as a service for renewable electricity producers, equipment for sensor and system integration services, data

Task 1 – National Survey Report of PV Power Applications in Sweden
56
collection from DSO of client’s electricity production and consumption, solar irradiance sensors for precise solar photovoltaics system evaluation and Solmolnet – tailor made IT system providing data management of metering and photovoltaics solar production for electricity retailers.
4.4.1.3 Comsys AB
PV modules produces DC current, which in traditional systems is converted via inverters to AC current. The AC current is in most installations later converted back to DC to run different applications such as lighting systems, servers, routers etc. Comsys, formerly Netpower Labs, is a company that develops DC-based backup power systems for data centres and tele-/datacom systems. They have developed hardware and a concept with DC-UPS systems with integrated PV regulators for running servers and lighting systems directly on DC current without conversions, thereby reducing the losses significantly. Comsys also has a product called ADF, which remove interference from the grid through AC filters.
The production of the components occurs at two locations in Sweden, Malmö and Söderhamn. The interest in DC current powering data centres, commercial buildings and lighting systems is increasing, which probably means that interest of using PV in these kinds of systems will be become more and more attractive. Comsys has installed the DC power system in more than 30 data centres and commercial buildings since 2011, 10 of which have integrated PV. In addition to data centres in 2019 Comsys helped a metal manufacturer in Gnosjö, Sweden, with installing a DC micro-grid which can go into island mode at the event of a power outage. This system is complete with a 100 kW PV system and batteries that can run the factory’s servers and other critical equipment for 8 hours.
4.4.1.4 Ferroamp Elektronik AB
Ferroamp was founded in 2010 and has developed a product that they call an EnergyHub. The EnergyHub technology offers a new system design that enables a better utilization of renewable energy in buildings by introducing a local DC nanogrid ecosystem with smart power electronics. PV solar production and energy storage is closely integrated on a DC grid, reducing conversion losses as solar energy is stored directly in the batteries without multiple conversion steps as common in traditional system designs. The EnergyHub offers cost effective backup power functionality for selected DC loads such as servers, LED lights and DC fast charging of electric vehicles. Ferroamp has also developed a platform for energy efficiency measures with a service portal for partners and customers, which extends operation hours to nights and winter months with dynamic power peak management and selective load control. During 2019 the company supplied its DC grid technology for the world's largest DC powered office building in Gothenburg including 180 kW PV, 230 kWh energy storage, 100 kW HVAC system and 1 500 luminaires all powered by 380/760 VDC.
In 2014 Ferroamp reached a milestone as they started the shipment of their EnergyHub ACE system for energy efficiency, hence going from a solely R&D company to a production company. In the end of 2015 Ferroamp released its PV solar and energy storage solutions. The battery cells come from China, but the production and mounting of all the components takes place in Sweden. Shipments of scalable PV solar and Energy Storage solutions started in 2016. 2018 started with a listing on Global Clean Tech top 100 list for game changing technologies and in June 2019, Ferroamp won the 2018 Intersolar Smarter E Award for its PowerShare technology. PowerShare allows buildings to share PV solar, energy storage and EV charge control via a local DC grid. Benefits include increased self-consumption, better utilization of energy storage and the potential to create Local Energy Communities with controlled energy flows.
Ferroamp currently has 20 such DC grids in operation in Sweden. The company has installed over 1 000 systems to date ranging from small residential systems to larger commercial facilities with integrated PV solar up to 300 kW and Energy Storage of 300 kWh.
4.4.1.5 MAPAB
MAPAB (Mullsjö Aluminiumprodukter AB) manufactures aluminium structures for the assembly of PV modules. The company provides solutions for mounting on roofs, facades or the ground. Previously, most of the production was exported to the European market, but in 2012 MAPAB started to deliver more to the growing Swedish PV market
Task 1 – National Survey Report of PV Power Applications in Sweden
57
and in 2017 approximately 98 % of their mounting products were sold in Sweden. In 2017 MAPAB also started to produce and sell PV module frames for export.
4.4.1.6 Midsummer AB
Midsummer is a supplier of equipment for manufacturing of CIGS thin film flexible solar cells as well as a developer and producer of thin film solar panels (further described under the section 4.3.1.1). Midsummer was founded in 2004 by people with a background from the optical disc manufacturing equipment and the photo mask industry. The head office is in Stockholm, Sweden. Midsummer's compact turnkey manufacturing line called DUO produces 6-inch wafer-like CIGS thin film solar cells deposited on stainless steel substrates using a proprietary all sputtering process. With the rapid price decline of PV products, Midsummer has developed a niche with flexible modules that weigh about 25 % of a corresponding crystalline silicon module. Midsummer's equipment customers are thin film solar cell manufacturers all over the world.
In 2016-2019 Midsummer, has secured multiple orders for their DUO thin-film solar cell sputtering tool from Asia, Russia and Europe. Midsummer's customers are mainly focusing on the BIPV-market and especially the roof-top segment.
4.4.1.7 Nilar AB
Nilar, founded in 2000, is a company within the stationary electrical energy storage sector. They currently have over 100 patents and manufacture high-tech batteries on an industrial scale. The first scalable and fully automated production line was implemented in 2014, during 2018 they commercialized their second-generation battery. Today, they have nearly 200 employees located in Sweden and the US. They produce their solutions locally in the company's factory in Sweden. The target markets for their products are home and small-scale storage, smart grid infrastructure, and commercial and industrial support. Nilar produce fully recyclable batteries, free of cadmium, mercury and lead. The patented Nilar Hydride® battery is based on a bi-polar design, where cells are laid horizontally and stacked on top of one another to gain space efficiency. By placing their flat cells in a layered structure in their building block the battery packs that can be varied in sizes.
Nilar, together with Ferroamp, has developed a complete solution that integrates energy storage with power electronics which facilitates both installation and utilization of the systems. Nilar also works closely with Enequi. Enequi’s technology works by harvesting the energy when it’s available either from PV or at a low cost from the grid. The energy is then stored in the built-in Nilar battery packs that can allocate and manage the total energy needs of the property.
During 2019 Nilar launched an energy storage solution to meet the growing demands from the residential market. The new cabinet is powered by 6 kWh of Nilar Hydride® batteries. It allows the user to take full advantage of peak shaving and time shifting applications. During the same year, Nilar delivered more than 200 systems.
4.4.1.8 Northvolt
Northvolt was founded in 2016, and is establishing its position as a European supplier of sustainable, high-quality battery cells and systems, by creating a European supply system of production facilities:
• Northvolt Labs, the demonstration line and research facility outside Västerås, Sweden, started its production in 2019 and will ramp up to 350 MWh of battery capacity per year. A pilot plant for recycling will be established during 2020.
• Northvolt Battery Systems Jeden, located in Gdansk, Poland, builds battery modules and energy storage solutions. It started production in 2019 and is ramping up capacity to 10,000 modules/year initially.
• Northvolt Ett, the company's first Gigafactory is being constructed in Skellefteå, Sweden, and will serve as Northvolt's primary production site, hosting active material preparation, cell assembly, recycling and auxiliaries. Large-scale production will begin in 2021. Ramping up to full capacity, Northvolt Ett will produce at least 32 GWh of battery capacity per year. An application for an environmental permit has been made that would allow for the expansion to 40 GWh per year.

Task 1 – National Survey Report of PV Power Applications in Sweden
58
• Northvolt Zwei, the second Gigafactory, will be established in Salzgitter, Germany. Construction will begin in 2021. The facility is scheduled to start manufacturing battery cells for Volkswagen from late 2023 or early 2024.
The company currently employs more than 600 people.
4.4.1.9 Sapa Building Systems AB
Sapa has for long been producing aluminium mounting systems for doors, windows, glass roofs and glass facades. Most of the production are situated in Vetlanda, Sweden. Since 2015, they are also manufacturing and selling aluminium profiles for BIPV.
4.4.1.10 SolarWave AB
The solar driven water purification system producer SolarWave entered a controlled liquidation in September 2019. The systems SolarWave produced in Järfälla, Sweden, included solar cells with a total power of 0.5 kWp. The target market of the company was mainly developing countries in Africa, and the company produced and delivered approximately 650 solar driven water purification systems from the start until the shut-down of the production. Of these about 150 systems were sold in 2019.
4.4.1.11 Weland Stål AB
Weland Stål in Ulricehamn manufactures a range of roof safety products. In the last years, the company has experienced a growing interest in their products from the Swedish PV market. In the wake of this, Weland Stål developed a new line of attachment parts for mounting solar panels on roofs in 2014. The production is situated in Ulricehamn and the products have so far only been sold at the Swedish market, but since 2017 some products have been exported to other parts of Scandinavia.
4.4.1.12 Windon AB
Windon AB has developed their own mounting materials which they produce in the Swedish town Tranås. Originally, it was only a ground mounted mounting system suitable for Windons own module brand. But in 2019, Windon also developed and started to produce roof mounting systems, which are compatible with many different module brands. The aluminium profiles for Windon’s mounting systems are produced by an OEM contract with SAPA in Vetlanda, while all the sheet metal and steel details are produced by Windon in Tranås.
In 2014 Windon also started to develop inverters with an individual capacity range of 1–20 kWp. The manufacturing of inverters started in 2016. Approximately 300 units were sold in 2016, 300 in 2017, 700 in 2018 and 700 in 2019. The parts for the inverters come from all over the world but are assembled at an OEM production facility in China. However, Windon plans to move the assembling of the inverters to Tranås as soon as the annual quantities reaches around 1000 units.
R&D companies and companies with R&D divisions in Sweden
4.5.1.1 Dyenamo AB
Dyenamo offers chemical components, manufacturing equipment and characterization equipment for research and production of chemistry-based solar technologies, primarily dye-sensitized solar cells, perovskite solar cells and solar fuels. Parallel to this, the company coaches their customers on their way to optimize device-chemistry, processes and/or strategic decision-making. Dyenamo is part of the ESPRESSO consortium, which has been granted a three-year EU-funded Horizon 2020 project on perovskite solar cells.
4.5.1.2 Eltek Valere AB
Eltek is a strategic technology partner for power solutions. The company is a global leader in telecom power including solar solutions for remote areas with installations all over the world. Eltek also has a range of flexible and modular PV solutions, scalable to meet any micro-grid requirement in an off or poor grid environment. As a part of the Delta group, Eltek also has a wide range of grid tied string and central inverters. The company has R&D divisions in Sweden and Norway that develop and construct inverters, both for grid-connected and off-grid systems. But the

Task 1 – National Survey Report of PV Power Applications in Sweden
59
focus is on off-grid systems. These inverters are then manufactured in China. They observed a growing interest in solar energy projects in the telecom and regional rail transit market in 2019 and expect the growth to continue.
4.5.1.3 Epishine
Epishine was founded 2016 with the aim to commercialize organic polymer solar cells. They are a spin-off from Linköping University based on decades of research resulting in process break-troughs that they think is part of the tipping point for printed OPV, where global research simultaneously has proven interesting performance and life-length.
Their first manufacturing site in Linköping focuses on small modules optimized for indoor ambient lighting, targeting the growing number of battery-driven wireless products, specifically the IoT-market where Epishine initially focuses on replacing batteries in low power devices such as sensors and consumer electronics.
The manufacturing process, although on a small scale, is constructed as a roll-to-roll process with a conscious focus on establishing manufacturing methods that can be scaled up to larger formats in the next step that will target the BIPV-market.
4.5.1.4 Exeger Sweden AB
Exeger is one of the companies in the world that has made the most progress in commercializing the dye-sensitized solar technology. Already in 2014 Exeger demonstrated that the solar cells could be produced by screen-printing. The product they have developed is called Powerfoyle, and the material is engineered to generate power with indoor light and indirect sunlight.
Since 2014 Exeger have been building the world's largest DSC production plant located in Stockholm. In this production facility Exeger print lightweight flexible and aesthetic solar cells that can be integrated into products such as consumer electronics, automobile integrated photovoltaics, building integrated and building applied photovoltaics. In 2016 Exeger worked with several partners to develop commercial consumer electronics prototypes. Fortum also invested 5.2 million Euros in the company, which enabled Exeger to increase their production capacity in their new factory from 10 to 15 million units of e-reader sized cells annually. Furthermore, Exeger received further investment from Softbank in 2019, which enabled planning of a second factory. The company also entered an agreement with ABB that will design the production robots for the second factory.
In 2019 JBL launched solar powered self-charging headphones with integrated Exegers cells. The company also announced a collaboration with POC, with the aim of integrate Exegers cells into smart helmets. The production of these products was planned to start in late 2019, but due to the close down of the Chinese industry at that time (in an effort to control the COVID-19 outbreak) the production has been post-pone. Exeger has however been ready to deliver the cells for these headphones and helmets during this period.
4.5.1.5 Peafowl Solar Power AB
Peafowl Solar Power is a spin-off company from Uppsala University developing a new kind of plasmonic solar cell technology. The solar cells are highly transparent and suitable for outdoor and indoor usage. The current focus is design of manufacturing processes, establishment of industrial partnerships and product development together with pilot customers. During 2019 Peafowl Solar Power started collaborating with ChromoGenics to test if their solar cells can power the ChromoGenics dynamic glass.
4.5.1.6 Samster AB
Samster has developed a "Cold PVT" which is a panel that supplies both electrical and thermal energy. The product consists of solar thermal pipes under a regular PV module and is specially made for operating at cold temperature. Samster is using commercial PV modules and the thermal parts are produced in Germany. Samster is responsible for development, assembly and sales. The Cold PVTs are optimal for boosting and rescuing geothermal heating systems. At the same time as the hybrids deliver more electric power due to cooling, they also lower the electricity consumption and prolongs the life span of the geothermal heat pump.
Task 1 – National Survey Report of PV Power Applications in Sweden
60
4.5.1.7 Solarus Sunpower Sweden AB
Solarus is a solar energy company with their roots in Sweden. The company has two different solar panel product lines, one thermal and one combined PV and solar thermal. Their systems use modules that in part receive direct sunlight and in part receive focused light from a reflective trough mounted underneath the module. The energy from the sunlight is collected by water pipes and/or solar cells on the backside and on top of the modules. The commercial focus lies on the PV/T module, which produces 230 W of electricity and 1 200 W heat under peak conditions. In 2014 Solarus moved to new R&D facilities in Gävle and also started to build a larger production facility in Venlo in the Netherlands. This production facility is owned by the Dutch sister company Solarus Sunpower BV. The production was ramped up in 2015 and around 400 PV/T modules was produced in the first year. This number increased to around 700-800 PV/T modules in 2017. In total, the plant has a production capacity of 30 000 modules per year. During 2017 the PV/T module stared a testing process at TÜV and Solarus Sunpower started installing their PV/T solar systems on several hotels in South Africa. The systems perform according to expectations and in some cases even better than expected. Solarus Sunpower AB filed for insolvency in the beginning of 2020 and started ramp down business in 2019.
4.5.1.8 Solibro Research AB
The CIGS thin film solar cell company Solibro started as a spin-off company from Uppsala University and Solibro was in September 2012 acquired from Q-cells by Hanergy, a Chinese group focused on power production. From September 2013 Solibro Research was owned by Hanergy Thin Film Power Group Ltd. Solibro gResearch AB was put into liquidation, along with all the other Solibro companies in the group, at the end of 2019.
The task of Solibro Research AB was to further develop the Solibro technology. In 2014 the company achieved a new world record for the efficiency of a thin film solar cells of 21.0 %. Solibro beat its own internal record, in 2017, by producing a small-scale CIGS cell with a conversion efficiency of 22.9 %.
In 2017 Solibro Research also started a new development project with perovskite solar cells and thin film tandem solar cells with a perovskite layer on top of a CIGS layer. During 2018 the research started reaching competitive levels and in 2019 they managed to produce a CIGS cell with perovskites on top with a conversion efficiency of 23.6 %. This technology and knowledge will live on as several senior employees of former Solibro Research in the beginning of 2020 started the start-up Evolar AB. This company will further develop the technology of putting perovskites on top of different type of solar cells (not only CIGS) to achieve higher conversion efficiencies.
4.5.1.9 SolTech Energy Sweden AB
Stockholm based Soltech Energy Sweden is listed on Nasdaq First North Growth Market and develops and sells three different proprietary BIPV products besides standard solar energy products. Their products are ShingEl, RooF and Façade. ShingEl and RooF are a type of a BIPV roof tile that has the same dimensions and specifications as Benders roof tile Carisma. The ShingEl and RooF tile, which feature CdTe thin film solar cells, can thereby in an aesthetic way be integrated in a regular tile roof. Façade is for BIPV facades. These three BIPV solutions are sold on the Swedish market through the company’s subsidiaries Soltech Sales & Support, Swede Energy, NP-Gruppen Soldags, Merasol and Takorama. They are also distributed by Rexel and Kraftpojkarna. The product development of the different technologies is carried out by Soltech in Sweden, while production of the products is being subcontracted/outsourced to producers in China.
Another area of business for Soltech Energy is solar as a service. The company's business within this area is in China, where they sold and installed about 139 MW until the end of 2019 through their joint venture company ASRE.
4.5.1.10 Sol Voltaics AB
Sol Voltaics was a company that developed methods of improving the efficiency of solar cells by the use of thin film of nanowires. The company filed for bankruptcy in the beginning of 2019. For further information about the company’s previous activities, please check older versions of the Swedish National Survey Report.
4.5.1.11 Swedish Algae Factory
Swedish Algae Factory was founded in 2014 around the discovery of the traits of certain diatom species. This specific trait is their ability to harvest light in a very efficient way through their nanostructured silica shell. The

Task 1 – National Survey Report of PV Power Applications in Sweden
61
company has developed an algae cultivation and wastewater treatment system from which they harvest this silica frustule of the algae. The actual organic algae biomass that is left after the extraction of the silica frustule, could be utilized in several applications such as for feed production or energy and organic fertilizers. The silica material on the other hand has been identified as a higher value product and in 2016 the company started to test this material's ability to enhance the efficiency of solar cells. Initial lab tests have shown that the nanostructured silica material can be utilized to enhance the efficiency of silicon solar panels with over four relative percentage, due to its light trapping and light manipulating properties.
Under 2017 the company started product testing together with partners to further test this material’s ability to enhance the efficiency of silicon solar panel by being incorporated into coatings in and on silicon solar panels, reaching an enhancement of 5 % in panel efficiency so far. The company also further validated the potential of the material to enhance the efficiency of DSSC (dye sensitized solar cell) and concluded in 2019 in an article a potential of over 38 %. In 2018 Swedish Algae Factory built a large pilot facility with a yearly production capacity of 300 m2 diatoms in Kungshamn, Sweden. The company will in 2020 start to build commercial production plant with a capacity of up to 3000 m2, which is planned to be finalized in 2021.
Meanwhile they are developing two types of commercial products. One is to use their material as coatings in PV modules during the actual production of the modules. The other is to offer retrofit coatings on top of the glass of already installed modules, as a way of increasing the performance of old modules.
Installers, retailers and wholesalers of PV systems
The list below contains all the companies that were known to the author at the time of writing that either sold and/or installed PV modules and/or systems in Sweden in 2019. If the reader knows of any other active company, please contact the author at: [email protected]
24 Volt 2electrify 7 Energy
Affärsverken Karlskrona AG Gruppen Agera Energi
Agronola Air By Solar Sweden Aktiv Sol i Nöbbele
Albinsons Energicenter Alcasol Nordic Aldu Solenergi
Alfa SolVind i Skåne AM Villutiken APM Avesta Persienn & Markis
Apptek Teknik Applikationer Aprilice Artic Sunlight Innovation
Atlas Solenergi Attemptare Awimex International
Baltic Suntech BayWa r.e. Scandinavia Be-Lo Elektriska
Better Solar Nordic A/S Bevego Byggplåt & Ventilation Bixia
BLS Energy Brael Norden Bråvalla Solteknik
Braxel Solutions Bredsands El & Solteknik Brion Solenergi
C4 Elnät Cardipoint Caverion Sverige
Ce-Ce Elservice Cell Solar Nordic Co2Pro
Consize Creative Networks Solutions X Dalakraft
Dalasolenergi Dalaträhus Energi Delglava
DT Micro Computer Systems E.ON Energilösningar Ecoklimat Norden
EcoKraft Sverige Effecta Energy Solutions Ekologisk Energi Vollsjö
El & Energi i Skåne El & Projektering El av Sol Nordic
El-agenten i Skillingaryd El-B-man El o Energiteknik Electrotec Energy
Elektra Elektriker'N Jimmy Wilhelmsson Elektroline i Kungsbacka
Elkatalogen i Norden Elkontakten i Ale Elproduktion i Stockholm
Elteknik i Bräcke Elterm i Alingsås Eneo Solutions
Energi & Innovation i Norden Energi Solvind ESV Energibyggarna i Väst
Energi-Center Nordic EnergiEngagemang Sverige Energiförbättring Väst
Energihem i Sverige Energihuset i Vimmerby Energiprojekt Stockholm
Energiteknik i Kungälv Energy Effective Solutions i Mälardalen Enkla Elbolaget i Sverige

Task 1 – National Survey Report of PV Power Applications in Sweden
62
Enstar Ergus El-Konsult Erntec
Et energi ETC El Everöds Elbyrå
EWF ECO EWS GmbH & Co. KG Extra Arbetskraft i Uppland
Falu Solenergi Fasadglas Bäcklin Fire Mountain
Flens Solel Forsbergs VVS & Energiteknik Fortum
Free Energy Sverige Freebo Friendly Power
Fronius Danmark Aps Fueltech Sweden Futura Energi
Fyrfasen Energi Fyrstads El Garo Elflex
GermanSolar Sverige GFSol Gislaved Energi
Gisle Innovations Gosol Energi Gotlands Elförsäljning
Gridcon Solcellsteknik Grön Sol GruppSol
Gävle Energi Göteborg Energi Helio Solutions
Herrljunga Elektriska HESAB Highlands International
Holje-El HPSolartech HS Energi & Klimat
HS-Solteknik Höjentorps Solenergi IBC Solar
IKEA Implementa Sol Indsol Group
INKA Energi Iq Energi JJ Solkraft
JN Solar JoDatec HB Johanneshovs El
JSS Tjänst Jämtkraft Jönköping Energi
Jöta El Kalmar Energi KAMA Fritid
Karlstads Energi Kjells Elektronik & Digital-Tv Center Klimatprojekt i Mälardalen
Knuttes El Kopernicus Kostal Solar Electric GmbH
Kraftpojkarna Kraftringen Energi Krannich Solar
Kretsloppsenergi Kummelnäs Krylbo Elmontage Kungälv Energi
K-Utveckling Engineering KWh Sverige Bygg & konsult Lambertsson Sverige
Laxviks El och Solpanel Lego Elektronik LEVA i Lysekil
Levins Elektriska Lorex Luleå Energi
Lundgrens El Lundgrens Elektriska MagnusEnergy
MeraSol Miljö & Energi Ansvar Sverige Miljö- VVS- & Energicenter
Modern Miljöteknik i Varberg Monier Roofing MR Service & Teknik
Mälar Bygg & Montageservice MälarEnergi Mölndal Energi
NaturWatt NIBE Energy Systems WFE Nirosys
Nordens Solvärme Nordh Energy Solar Nordic Energy Partner
Nordic Solar Sweden Nordpolen Energi Nordströms Elektriska Byrå
Northern-Nature-Energy Nossebro Energi Försäljnings Orust Engineering
OTM Eko Energi Otovo OX2 Distributed Solutions
Paneltaket Parkys Solar Penthon Installation
PFA Solteknik PiteEnergi PMC El
PPAM Solkraft Prolekta Gotland Rexel Sverige
Rigora RK Sol & Energiteknik RoslagsSOL-Forslund & Co
Rustabo Sverige Råådalens Energi Rågård rör och teknik
S:t Eriks Sala-Heby Energi Samvets Elteknik
Sandhult-Standareds Elektrisk Save-by-Solar Sweden SEBAB
Sell Power Nordic Senergia Sesol
SEV Strängnäs Energi SHS Gruppen Signalmekano
Skellefteå Kraft Skånska Energi Sol & Byggteknik i Grythyttan
Solandia Solar Supply Sweden SolarClarity Group
SolarEdge Technologies Sweden Solarenergy Scandinavia Solarit
Solaritet Solarlab Sweden Solarwork Sverige
Solcellsbyggarna Boxholm Soldags i Sverige Solect Power

Task 1 – National Survey Report of PV Power Applications in Sweden
63
Solelexperten Umeå Solelgrossisten Solenergi Göteborg
Solenergi i Nynäshamn Solenergi Norr Solenergi Sverige
Solenergimontage i Sverige Solenergispecialisten i Norden SolensEnergi i Skåne
Solexperterna Värmland Solfriken Ugglum Solgruppen Norden
Soliga Energi Solinnovation i Värnamo Solkatten
Solkompaniet Sverige Solkraft EMK Solkraft i Viby
Sollentuna Energi & Miljö SolNord Solorder
Solortus Solteamet i Västerbotten SolTech
Solverket Alfa Solvio Solvision
Spindel Stockholm Exergi Storuman Energi
Sun Energy Nordic Sun of Sunne Sun4energy
Sunavia SUNBEAMsystem Group Suncellhouse Solenergi
SunDoSparks SunnyFuture Sunroof
Sunsolutions by Telecontracting Sunwind Gylling Susanna — Sustainle and Natural
SVEA Renewle Solar Svenska Solenergigruppen Svenska Solenergiparker
Svenska Solpanelmontage Svenskt Byggmontage Svesol Värmesystem
Swede Energy Power Solutions Swedensol Energi Switch Nordic Green
Sydpumpen Södra Hallands Kraft Södra Solmontage
Söne El Teknisk Fastighetsservice i Norrland Tekniska Verken i Linköping
Telge Energi Tellux Tranås Energi
Trollhättan Energi Tröingebergs EL&VVS Täta Tak Entreprenad Sverige
Umeå Energi Upplands Energi Utellus
VallaCom Vancos Munka Ljungby Varberg Energi
Vårgårda Solenergi Värmekällan Väst Varmitek Energisystem
Vattenfall Veosol Teknik Viessmann Värmeteknik
Villavind VOE Service West El
Wettersol Windforce Airbuzz Holding Windon
WOJAB Yokk Solar Öresundskraft
Östgöta Solel
Consultancy firms
The list below contains all the consultancy companies that were known to the author at the time of writing that offered different services with regards to PV in Sweden in 2019. In additions to these companies several of the companies listed as installers and retailers of PV systems also have consultancy sections and offers. If the reader knows of any other active company than in the list below, please contact the author at: [email protected]
AddSolar Advokatforman Lindahl Afry
Aktea Energy Andersson & Hultmark Artic Sunlight Innovation
Bengt Dahlgren Bjerking Bodecker Partners
Emulsionen Ekonomiska Förening Enable Energy Sve Energibanken
Enklare Husliv BIM Esam Fasadglas Bäcklin
Franzén Energiteknik Hemsol IATEK
Incoord Installationscoordinator Ingenjörsfirman Flemming Åkesson JB EcoTech
M2 Bioenergi Norconsult Paradisenergi
PE Teknik och Arkitektur Profu Ramböll Sverige
Redlogger Rejlers Sweden Solcellskollen
Solelsbyggarna Tribera Net Spotscale Sunwide
Sustain le Business Partner Sustain le Energy Nordic Sweco Systems
Temagruppen Watt-s White Arkitekter
WSP Sverige Åkerby Solenergi

Task 1 – National Survey Report of PV Power Applications in Sweden
64
5 HIGHLIGHTS OF R&D
PV research groups
The Swedish solar cell related research consists largely of fundamental research in new types of solar cells and photovoltaic materials. Several of the research groups in this category are at the forefront and are highly regarded internationally. Furthermore, there are some smaller groups that focus on PV systems and PV in the energy system-oriented research. In the table below the different Swedish PV or battery research groups are summarized.
Table 32: Research groups in Sweden that conducts research on either PV or battery related topics.
Research group name Research topics
Estimated
number of
full-time
jobs in
2019
Center of Molecular Devices Dye-sensitized, perovskite and quantum dot solar cells
35
Chalmers, Architecture and Civil Engineering Roof renovation with PV 0.5
Chalmers, Chemical physics Surface physics and catalysis by advanced calculation methods
1
Chalmers, Chemistry and Biochemistry, Abrahamsson Research Group
Photocatalytic conversion of CO2 with light 2.5
Chalmers, Chemistry and Biochemistry, Albinsson Research Group
Technology for down and up conversion of sunlight
5
Chalmers, Chemistry and Chemical Engineering
Organic solar cells 4
Chalmers, Material Physics Battery material research 17
Chalmers, Electrical Engineering Studies and modelling of PV systems integrated to the grid and simulations of the campus system
1
Chalmers, Molecular Materials, Moth-Poulsen Research Group
Design and synthesis of new self-collecting materials based on molecules and nanoparticles
6
Chalmers, Technology Management and Economics
Business models for PV deployment
1
Dalarnas University, Center for Solar Research System research, PV and heat pump smart systems, micro-systems and smart grid business models
6
Karlstad University, Characterizing and Modeling of Materials
Multi crystalline silicon solar cells 6
Karlstad University, Molecular Materials for Electronics
Polymer-based and perovskite solar cells 5
KTH Royal Institute of Technology, Applied Thermodynamics and Refrigeration
PV system in Swedish housing associations and PV with heat pumps
2
KTH Royal Institute of Technology, Concentrating Solar Power and Techno-economic Analysis
Techno-economic analyses, design and experimental verification for CSP
4
KTH Royal Institute of Technology, Electric Power Systems
Power grid control at coordinated input of PV electricity
0.5

Task 1 – National Survey Report of PV Power Applications in Sweden
65
KTH Royal Institute of Technology, Material and Nanophysics
Direct III-V/Si heterocycle for solar cells and silicon-based tandem cell
3
Linköping University, Biomolecular and Organic Electronics
Plastic solar cells 10
Linköping University, Organic Electronics Solar heat-charged super capacitor as energy storage
2
Luleå University of Technology, Electric Power Engineering
Stochastic planning of smart electricity distribution networks, PV electricity quality and reliability from a grid perspective
4
Luleå University of Technology, Experimental Physics
New nanomaterials for third generation solar cells
11
Lund University, Chemical Physics Dye-sensitized, plastic and quantum dot solar cells, along with semiconductor nanowires and organometal halide perovskites
15
Lund University, Energy and Building Design Social issues with regards to solar energy, urban planning and building design
1
Lund University, International Environmental Institute
Social studies of private persons barriers and motives for PV investments
1
Lund University, Nanolund Tandem transitions in nanowire solar cells and perovskites on nano wires
5
Lund University, Polymer and Materials Chemistry
Nano-structured materials for higher PV efficiency
2
Lund University. Centre for analysis and synthesis
Iron based solar cells and iron complexes as photosensitizers in solar cells
18
Mid Sweden University, Electronic Construction
Development of converters and supercapacitor, and grid stabilization studies
5
Mid Sweden University, Fibre Science and Communication Network
Lithium-ion batteries and super capacitors 8
Mälardalen University, Future Energy Center PV in agriculture and the built environment, PV modelling software
5
RISE, Research Institute of Sweden AB Testing of PV components, systems and batteries, BIPV and micro-grid research etc.
17
Swerea IVF Dye-sensitized solar cells and implementation of PV in real estates
1
Umeå University, The Organic Photonics and Electronics Group
Photonic and electronic devices based on novel organic compounds and perovskite solar cells
1
University of Gävle, Energy Systems and Building Technology
PV system operation and performance of PVT receivers
2
Uppsala University, Built Environment Energy Systems
PV grid integration studies and modelling of; PV systems, building systems, self-consumption and solar-powered transports
7
Uppsala University, Solid State Electronics CIGS and CZTS thin film solar cells and materials
25
Uppsala University, Ångström Advanced Battery Centre
Li-ion batteries and the combination of Li with other materials
85
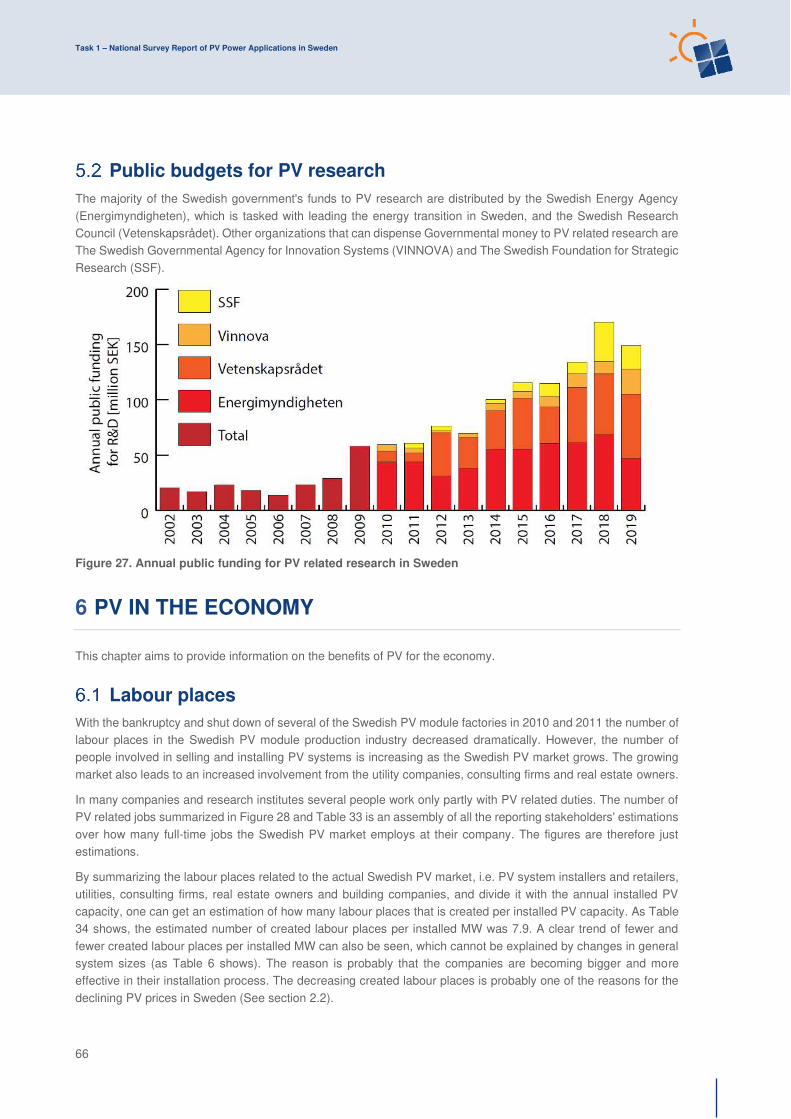
Task 1 – National Survey Report of PV Power Applications in Sweden
66
Public budgets for PV research
The majority of the Swedish government's funds to PV research are distributed by the Swedish Energy Agency (Energimyndigheten), which is tasked with leading the energy transition in Sweden, and the Swedish Research Council (Vetenskapsrådet). Other organizations that can dispense Governmental money to PV related research are The Swedish Governmental Agency for Innovation Systems (VINNOVA) and The Swedish Foundation for Strategic Research (SSF).
6 PV IN THE ECONOMY
This chapter aims to provide information on the benefits of PV for the economy.
Labour places
With the bankruptcy and shut down of several of the Swedish PV module factories in 2010 and 2011 the number of labour places in the Swedish PV module production industry decreased dramatically. However, the number of people involved in selling and installing PV systems is increasing as the Swedish PV market grows. The growing market also leads to an increased involvement from the utility companies, consulting firms and real estate owners.
In many companies and research institutes several people work only partly with PV related duties. The number of PV related jobs summarized in Figure 28 and Table 33 is an assembly of all the reporting stakeholders' estimations over how many full-time jobs the Swedish PV market employs at their company. The figures are therefore just estimations.
By summarizing the labour places related to the actual Swedish PV market, i.e. PV system installers and retailers, utilities, consulting firms, real estate owners and building companies, and divide it with the annual installed PV capacity, one can get an estimation of how many labour places that is created per installed PV capacity. As Table 34 shows, the estimated number of created labour places per installed MW was 7.9. A clear trend of fewer and fewer created labour places per installed MW can also be seen, which cannot be explained by changes in general system sizes (as Table 6 shows). The reason is probably that the companies are becoming bigger and more effective in their installation process. The decreasing created labour places is probably one of the reasons for the declining PV prices in Sweden (See section 2.2).
Figure 27. Annual public funding for PV related research in Sweden

Task 1 – National Survey Report of PV Power Applications in Sweden
67
Table 33: Estimated PV-related full-time labour places in 2019.
Market category Number of full-time labour places
PV module manufacturers 44
Machinery and balance of systems manufactures 134
Research and development companies 214
PV system installers and retailers 1914
Utilities 194
Consulting firms 83
Real estate owners and building companies 29
National and regional agencies 26
Universities, foundations and educations companies 199
Others 21
Total 2858
Table 34: Estimated number of yearly full-time labour places created per installed PV capacity.
2010 2011 2012 2013 2014 2015 2016 2017 2018 2019
PV market related labour places
59 89 173 285 321 447 592 881 1464 2219
Annual installed capacity [MW]
2.43 4.09 7.97 19.12 35.17 48.31 55.52 63.94 182.69 281.31
Labour places
created per MW 25.2 21.8 21.7 14.9 9.1 9.3 10.1 10.4 9.3 7.7
Figure 28: Estimated total full-time jobs within the Swedish PV industry over the years.
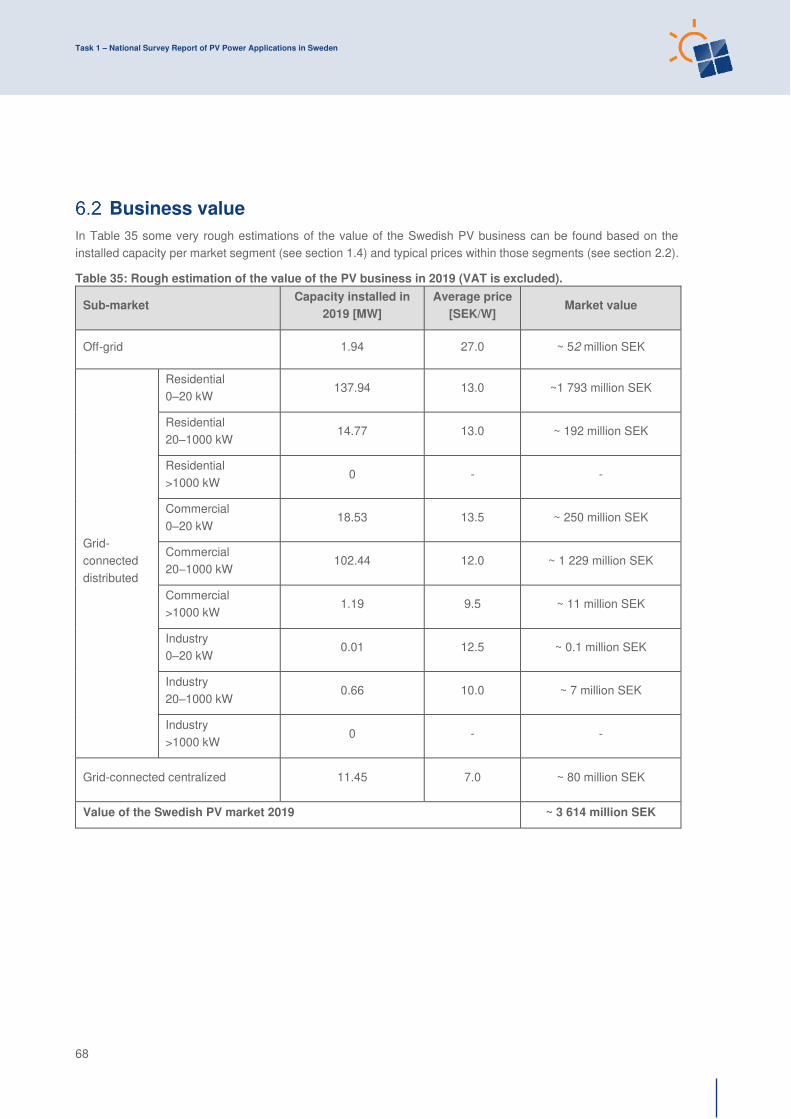
Task 1 – National Survey Report of PV Power Applications in Sweden
68
Business value
In Table 35 some very rough estimations of the value of the Swedish PV business can be found based on the installed capacity per market segment (see section 1.4) and typical prices within those segments (see section 2.2).
Table 35: Rough estimation of the value of the PV business in 2019 (VAT is excluded).
Sub-market Capacity installed in
2019 [MW]
Average price
[SEK/W] Market value
Off-grid 1.94 27.0 ~ 52 million SEK
Grid-connected distributed
Residential 0–20 kW
137.94 13.0 ~1 793 million SEK
Residential 20–1000 kW
14.77 13.0 ~ 192 million SEK
Residential >1000 kW
0 - -
Commercial 0–20 kW
18.53 13.5 ~ 250 million SEK
Commercial 20–1000 kW
102.44 12.0 ~ 1 229 million SEK
Commercial >1000 kW
1.19 9.5 ~ 11 million SEK
Industry 0–20 kW
0.01 12.5 ~ 0.1 million SEK
Industry 20–1000 kW
0.66 10.0 ~ 7 million SEK
Industry >1000 kW
0 - -
Grid-connected centralized 11.45 7.0 ~ 80 million SEK
Value of the Swedish PV market 2019 ~ 3 614 million SEK

Task 1 – National Survey Report of PV Power Applications in Sweden
69
7 INTEREST FROM ELECTRICITY STAKEHOLDERS
Structure of the electricity system
In Sweden electricity is transported from the major power stations to the regional electricity grids (40–130 kV) via the national grid (220 kV and 400 kV). From the regional grids, electricity is transported via local, low voltage grids (40 kV or less) to the electricity consumers. The voltage in the wall sockets in Sweden is 230 V.
The backbone of the electrical grid, the national grid, is owned by the Swedish state and managed by the Swedish National Grid (Svenska Kraftnät), whereas power utility companies own the regional and local grids. The Energy Markets Inspectorate (Energimarknadsinspektionen) is the regulatory authority over the electricity market. Since the grid is a monopoly, there is only one network owner in each area that is licensed.
The base price of the electricity is daily set by the Nordic electricity retailing market, Nord Pool. Electricity trading companies then use this price as basis for their pricing in the competition for customers. The Swedish electricity market was deregulated in 1996, which resulted in that the customers could change their electricity supplier more easily.
There was 134 electricity trading companies and 173 grid owners in Sweden in 2017 [68]. However, the Swedish grid market is dominated by Vattenfall, E.ON and Ellevio that covers 52 % of all customers. The retail market is dominated by three companies; Vattenfall, Fortum and E.ON, which together have 56 % of all customers.
Interest from electricity utility businesses
Several utility companies startedmarketeing small turnkey PV systems suited for roofs of residential houses in 2012. The utility companies that the author is aware of that offered these kinds of turnkey PV systems in 2019 were: Affärsverken Karlskrona, Bixia, C4 Energi, Dalakraft, E.ON, Enkla Elbolaget, ETC El, Fortum, Fyrfasen Energi, Gislaved Energi, Gotlands Elförsäljning, Gävle Energi, Jämtkraft, Jönköping Energi, Kalmar Energi, Kraftringen, Kungälv Energi, LEVA i Lysekil, Luleå Energi, MälarEnergi, Mölndal Energi, Nossebro Energi, Piteå Energi, Sala-Heby Energi, Sandhult-Standareds Elektrisk, SEVAB Strängnäs Energi, Skellefteå Kraft, Skånsk Energi, Sollentuna Energi & Miljö, Stockholm Exergi, Storuman Energi, Switch Nordic Green, Södra Hallands Kraft, Telge Energi, Tekniska Verken i Linköping, Trollhättan Energi, Umeå Energi, Upplands Energi, Utellus, Varbergs Energi, Vattenfall, Västra Orust Energitjänst and Öresundskraft. These utility companies are also listed as retailers of PV systems in section 4.6. Most of these utilities collaborate with local Swedish installation companies that provide the actual system and execute the installation. Only a few of them have the installation competence and product distribution lines in-house.
One utility company, Umeå Energi also offer leasing of PV system to private persons.
Furthermore, in 2011, several utility companies started introducing compensation schemes for buying the excess electricity produced by micro-producers. This trend continues, as more and more utility companies now have various offers for the micro-producer's excess electricity, their green electricity certificates and guarantees of origin. The offers and compensation vary between the utilities. Most of them have in common that the demand that the micro-producer is a net consumer of electricity during a year and that they buy their electricity from the utility company. Some buy the GO's and the green electricity certificates, while some don't. The overall compensation from utilities for the electricity, plus GO's and the green electricity certificates, varies between 0.25 and 0.70 SEK/kWh. Some utilities offer even higher compensation if the customer buys the PV system from the company.
Since 2014 a few utilities have started to work with centralized PV parks. Since there are no subsidies for large-scale PV parks in Sweden, except for the green electricity certificate system (see section 3.2.3) and the maximum 1.2 million SEK from the direct capital subsidies (see section 3.2.1), the proactive utility companies that have started to work with PV parks have had to test different financial arrangements and business models such as share-owned PV parks, power purchase agreements and PV electricity offers to end consumers. The utility companies that have

Task 1 – National Survey Report of PV Power Applications in Sweden
70
built PV parks over 1 MWp are Mälarenergi, Arvika Kraft, Varberg Energi, ETC El, Kalmar Energi, Luleå Energi, Göteborg Energi, Affärsverken, Vallebygdens Energi and Jämtkraft.
Interest from municipalities and local governments
As can be seen in Figure 4 and Figure 5 there are some municipalities in Sweden that stand out in installed PV in total and by capita. Important factors for the high local PV diffusion rates are in general peer effects [69] and local organisations that promote PV. Research has shown that the influence of local initiatives from different stakeholders has played a major role in the deployment of PV in many of the municipalities with the highest PV penetration in Sweden [70]. In several cases local electric utilities, often owned by the municipality, have successfully taken an active role in supporting PV with action such as purchasing the excess electricity of PV adopters, selling PV systems and dissemination of information. Other local initiatives that have influenced the adoption of PV are seminars and information meetings arranged by local actors. One example to highlight is the Swedish Energy Agency financed information campaign for residential PV adoption that occurred in Sweden in 2017, in which 41 % of Sweden’s municipalities participated and led to a positive effect on PV adoption rates [71].
Some Swedish municipalities and local government have introduced ambitions goal for PV. Examples are:
• In Örebro County, the goal is to produce 150 GWh of PV electricity by 2030, which would correspond to about 4 percent of the county's electricity use [72].
• The municipality of Uppsala that has set a goal to have approximately 30 MWp of PV by 2020 and about 100 MWp by 2030 [73].
• The municipality of Helsingborg has set an ambition that local production of solar power corresponds to 10 percent of electricity demand in 2035 [74].
• Kristianstad's goal is for the municipal group to produce 2 GWh of solar energy per year in 2020, and 40 GWh per year in the municipality by 2030 [75].
Another activity several municipalities have implemented is the fabrication of so called “sun maps” to help potential stakeholders in PV to easier assess the potential for their roof. These “sun maps” illustrate in colour scale the incoming solar radiation on all the roofs in the city, sometimes considering the tilt of the roof and shadowing effects of nearby buildings or building elements. At the time of writing the sun maps that the author is aware of are; Ale, Alingsås, Borlänge, Borås, Botkyrka, Danderyd, Ekerö, Eskilstuna, Eslöv, Falkenberg, Falun, Forshaga, Gävle, Göteborg, Haninge, Helsingborg, Huddinge, Håbo, Härnösand, Härryda, Höganäs, Hörby, Järfälla, Kalmar, Karlshamn, Karlskrona, Karlstad, Katrineholm, Kramfors, Kristianstad, Kumla, Köping, Landskrona, Lidingö, Lidköping, Linköping, Ljungby, Lomma, Ludvika, Luleå, Lund, Malmö, Motala, Munkfors, Mölndal, Nacka, Norrköping, Norrtälje, Nykvarn, Nynäshamn, Olofström, Ronneby, Salem, Sigtuna, Skövde, Smedjebacken, Sollefteå, Sollentuna, Solna, Stockholm, Strängnäs, Strömstad, Sundbyberg, Sundsvall, Södertälje, Sölvesborg, Timrå, Trosa, Tyresö, Täby, Umeå, Upplands Väsby, Upplands-bro, Uppsala, Vallentuna, Varberg, Vaxholm, Vellinge, Värmdö, Värnamo, Västerås, Ånge, Ängelholm, Örebro, Örnsköldsvik, Östersund and Österåker.
There are 15 regional energy agencies (Energikontoren) in Sweden whose purpose is to promote energy efficiency and the use of renewable energy at local and regional level. With support from the Swedish Energy Agency (Energimyndigheten) they coordinate national initiative project with the municipality's energy and climate advisers.
The largest local PV promoting project is probably the association Solar Region Skåne, which started in 2007 as a collaboration between the municipality of Malmö, the regional energy agency of Skåne (Energikontoret Skåne) and Lund University. Solar Region Skåne is a network and knowledge centre for solar energy activities in the Skåne province.

Task 1 – National Survey Report of PV Power Applications in Sweden
71
8 HIGHLIGHTS AND PROSPECTS
Highlights
The positive PV market development in Sweden continued in 2019 as the annual market grew with 83 % to a yearly installed power of 289 MW. This led to Sweden passing the 700 MW threshold as the cumulative installed capacity at the end of 2019 was 714 MW. The PV system prices continued to decrease with about 2–4 % in 2019 for both residential and commercial grid connect roof-mounted systems. The price decline seems to have been higher, about 8 %, for centralized ground mounted PV parks.
The major policy change in 2019 that affect the Swedish PV market was the lowering of the support level from 30 % to 20 % in the direct capital subsidy programme as of May 2019. This policy change might actually have a positive effect on the market, since a lower support level enables support for larger a PV capacity within the limited programme budget.On the industry side, basically no module production occurred in Sweden. Some Swedish companies focusing on new PV technologies or balance of system components continued to develop in a healthy way, while others were forced to liquidate their business. Furthermore, the Swedish PV industry is becoming broader as more and more actors with other core businesses, such as utilities and real estate owners, are taking an increasing interest in the PV technology.
Prospects
In the very short term, the Swedish PV market is facing three major uncertainties. The first one is how the COVID-19 pandemic and the resulting economic recession will affect the PV market. Due to the restrictions implemented to slow down the spread of virus, the overall activity in Sweden has gone down, leading to inter alia lower electricity prices, higher unemployment and less profitability of companies. The lower electricity prices have a negative impact of the profitability of new and existing PV systems, while higher unemployment and reduced profitability of companies has a negative impact of the available capital and the willingness to invest this in PV.
The second uncertainty is that the current ordinance of the major subsidy in Sweden, the direct capital subsidy programme, will end as of the last of December 2020. For private individuals the government has presented a proposal to replace the direct capital subsidy with a tax reduction for installing green technology [76], which is similar to the current ROT tax deduction. In this memorandum it is suggested the tax reduction for installation of green technology is provided with 15 percent of the charged labour and material costs for the installation of solar cells and with 50 percent of the charged labour and material costs for installation of storage of self-produced electric energy and installation of charging point for electric vehicles. The suggested tax reduction amount to a maximum of 50,000 SEK per taxation year. Even if the support level is lower than in the current direct capital subsidy programme, this transition to a tax reduction could be very beneficial for the residential sector as it will decrease the amount of administration as there will be no need for private homeowners to be granted money, which in some cases has taken more than a year with the current direct capital subsidy programme. However, it is uncertain what will happen with the commercial sector. Companies are not allowed to apply for the tax reduction. If no other support scheme is introduced, this market segment might take a hit as the support level drops from 20 % to zero as of 2021.
Thirdly, an unexpected communication from the Government on June 10, 2020, the government introduced an application deadline for photovoltaic support as of July 7, 2020. Individuals and companies that were considering installing solar cells in the fall of 2020 thus had less than a month to make the decision and apply for photovoltaic support of 20 percent after the communication.
In the medium term, it is expected that the Swedish PV market continues to grow. The introduction of the tax credit for micro-producers in 2015, the applied (and coming) reforms to reduce the administrative burdens for PV investors, the launch of an information platform by the Swedish Energy Agency and the increase of activity from utilities have made the situation quite good for homeowners and small companies to invest in PV. One example of

Task 1 – National Survey Report of PV Power Applications in Sweden
72
an up-coming suggested reform that will make it easier for investors in small PV system is the harmonization of the definition “micro-producer” that is defined different in different laws [55][31]. Another suggested regulatory change is that property owners should be allowed to build small micro grids that connect different buildings within their premises [77].
Large centralized PV parks has been a marginal occurrence in Sweden until now. However, this market segment is believed to grow a lot in the coming years, as it seems to be on the brink of manage without any subsidies.
In the long term, the Swedish PV market is in a good position to grow. In general, there is a growing interest for PV in Sweden and the public is very positive towards the technology. In October 2016, the Swedish Energy Agency presented a broad PV strategy for Sweden. This strategy includes a vision that 5 to 10 % of Sweden's total electricity demand could come from PV in 2040, which would correspond to roughly 7–14 TWh [78]. Furthermore, the goal of the broad political agreement of The Swedish Energy Commission that Sweden shall have a 100 % renewable electricity consumption by 2040 [79] forebodes a policy framework in which PV should be able to flourish.
9 REFERENCES
[1] Energimyndigheten, “Nätanslutna solcellsanläggningar,” 2019. [Online]. Available: http://www.energimyndigheten.se/statistik/den-officiella-statistiken/statistikprodukter/natanslutna-solcellsanlaggningar/. [Accessed: 16-Jun-2020].
[2] J. Lindahl, C. Stoltz, A. Oller-Westerberg, and J. Berard, “National Survey Report of PV Power Applications in Sweden 2018,” Knivsta, 2019.
[3] M. Warneryd and K. Karltorp, “The role of values for niche expansion: The case of solar photovoltaics on large buildings in Sweden,” Energy. Sustain. Soc., vol. 10, no. 1, 2020, doi: 10.1186/s13705-020-0239-7.
[4] A. Bråve, N. Ekström, S. Särnblad, and K. Vanky, “The Value of Value Factors — Time-Dependent Development of Value Factors on the Swedish Electricity Market,” 2020.
[5] B. Nykvist and M. Nilsson, “Rapidly falling costs of battery packs for electric vehicles,” Nat. Clim. Chang., vol. 5, no. 4, pp. 329–332, 2015, doi: 10.1038/nclimate2564.
[6] Power Circle, “Elbilsstatistik,” 2019. [Online]. Available: https://www.elbilsstatistik.se/elbilsstatistik. [Accessed: 25-Jun-2019].
[7] Svenska Kyl & Värmepump Föreningen, “Statistik — Värmepumpsförsäljning,” 2019. [Online]. Available: https://skvp.se/aktuellt-o-opinion/statistik/varmepumpsforsaljning. [Accessed: 01-Jul-2019].
[8] S. Persson and Sören, “Åsikter om energi och kärnkraft — Den svenska miljö-, energi- och klimatopinionen 1998–2019,” Göteborg, 2020.
[9] P. Blomqvist and T. Unger, “Teknisk-ekonomisk kostnadsbedömning av solceller i Sverige,” Göteborg, 2018.
[10] YOUGOV, “Bygmabarometern, Bygma,” 2018. [11] Svenska Kraftnät, “Elstatistik.” [Online]. Available:
https://www.svk.se/aktorsportalen/elmarknad/kraftsystemdata/elstatistik/. [Accessed: 09-Jun-2020]. [12] SCB, “Bränsleförbrukning för elproduktion i Sverige efter produktionsslag och bränsletyp. År 1990–2018.”
[Online]. Available: https://www.statistikdatabasen.scb.se/pxweb/sv/ssd/START__EN__EN0105/BrforelAR/. [Accessed: 08-Jun-2020].
[13] D. Lingfors and J. Widén, “Development and validation of a wide-area model of hourly aggregate solar power generation,” Energy, vol. 102, pp. 559–566, 2016, doi: 10.1016/j.energy.2016.02.085.
[14] European Commission, “The European Union´s measures against dumped and subsidised imports of solar panels from China,” 2015.
[15] Riksbanken, “The deposit and lending repo rate,” 2019. [Online]. Available: https://www.riksbank.se/sv/statistik/sok-rantor--valutakurser/reporanta-in--och-utlaningsranta/. [Accessed: 10-Jun-2020].
[16] SCB, “Bolåneräntor till hushåll fördelat på räntebindningstid,” 2019. [Online]. Available:

Task 1 – National Survey Report of PV Power Applications in Sweden
73
http://www.statistikdatabasen.scb.se/pxweb/sv/ssd/START__FM__FM5001__FM5001C/RantaT04/. [Accessed: 10-Jun-2020].
[17] Nasdaq, “Fixed income — Sweden — STIBOR,” 2019. [Online]. Available: http://www.nasdaqomx.com/transactions/trading/fixedincome/fixedincome/sweden/stiborswaptreasuryfixing/historicalfixing. [Accessed: 10-Jun-2020].
[18] S. Syd, “Solcellslån.” [Online]. Available: https://www.sparbankensyd.se/lana-pengar/solcellslan/. [Accessed: 10-Jun-2020].
[19] SCB, “Land- och vattenareal i kvadratkilometer efter region, arealtyp och år.” [Online]. Available: http://www.statistikdatabasen.scb.se/pxweb/sv/ssd/START__MI__MI0802/Areal2012/http://www.statistikdatabasen.scb.se/pxweb/sv/ssd/START__MI__MI0802/Areal2012N/. [Accessed: 10-Jun-2020].
[20] SCB, “Preliminär befolkningsstatistik per månad 2019,” 2019. [Online]. Available: https://www.scb.se/hitta-statistik/statistik-efter-amne/befolkning/befolkningens-sammansattning/befolkningsstatistik/pong/tabell-och-diagram/manadsstatistik--riket/preliminar-befolkningsstatistik-per-manad-2020/. [Accessed: 10-Jun-2020].
[21] Varberg Energi, “Solsidan — Energiproduktion.” [Online]. Available: http://solsidan.varbergenergi.se/. [Accessed: 25-Mar-2020].
[22] E. Schelin, “Photovoltaic system yield evaluation in Sweden — A performance review of PV systems in Sweden 2017–2018,” 2019.
[23] Energiföretagen, “Energiåret 2018 — Elproduktion: Excel-fil med tabeller.” [Online]. Available: https://www.energiforetagen.se/statistik/energiaret/. [Accessed: 08-Jun-2020].
[24] Energimarknadsinspektionen, “Särskilda rapporten lokalnät — teknisk data.” [Online]. Available: https://www.ei.se/Documents/Publikationer/arsrapporter/el/sammanstallningar_over_elnatsforetagens_arsrapporter_lokalnat/Sarskild_rapport_teknisk_data_lokalnat.xlsx. [Accessed: 10-Jun-2020].
[25] B. Stattin and B. Forsberg, “Branschens viktigaste framtidsfrågor 2018,” Energimarknaden, 2018. [26] L. Hirth, “Market value of solar power: Is photovoltaics costcompetitive?,” in IET Renewable Power
Generation, 2015, vol. 9, no. 1, pp. 37–45, doi: 10.1049/iet-rpg.2014.0101. [27] D. Lingfors, M. Åberg, and J. Widén, “Effekt- och elprisscenarier vid hög andel solel i det svenska
elsystemet,” 2019. [28] Energiföretagen, “Energiåret 2018 — Elmarknaden,” 2019. [29] SMHI, “Klimatindikator — globalstrålning,” 2019. [Online]. Available:
http://www.smhi.se/klimatdata/meteorologi/stralning/stralning-1.17841. [Accessed: 21-May-2019]. [30] J. Hedström and L. Palmblad, “Performance of old PV modules — Measurement of 25 years old crystalline
silicone modules,” 2006. [31] Sveriges Riksdag, Svensk författningssamling — Ellag (1997:857). Sweden, 1997. [32] E. Vartiainen, G. Masson, C. Breyer, D. Moser, and E. Román Medina, “Impact of weighted average cost
of capital, capital expenditure, and other parameters on future utility‐scale PV levelised cost of electricity,” Prog. Photovoltaics Res. Appl., no. July, pp. 1–15, 2019, doi: 10.1002/pip.3189.
[33] Agora Energiewende, J. N. Meyer, S. Philipps, N. Saad Hussein, T. Schlegl, and C. Senkpiel, “Current and Future Cost of Photovoltaics — Long-term Scenarios for Market Development, System Prices and LCOE of Utility-Scale PV Systems,” Berlin, 2015.
[34] G. De Clercq, “Europe’s first solar panel recycling plant opens in France,” Reuters, 2018. [Online]. Available: https://www.reuters.com/article/us-solar-recycling/europes-first-solar-panel-recycling-plant-opens-in-france-idUSKBN1JL28Z. [Accessed: 10-May-2019].
[35] C. Teh, “Sembcorp and Singapore Polytechnic to work on solar panel recycling technology,” The Strait
Times, 2019. [Online]. Available: https://www.straitstimes.com/singapore/sembcorp-and-singapore-polytechnic-to-work-on-solar-panel-recycling-technology. [Accessed: 10-May-2019].
[36] S. Riksbank, “Penningpolitik.” [Online]. Available: https://www.riksbank.se/sv/penningpolitik/#:~:text=Penningpolitik Penningpolitik-,Penningpolitik,kring 2 procent per år. [Accessed: 29-Jun-2020].
[37] Sveriges Riksdag, Svensk författningssamling — Förordning (2009:689) om statligt stöd till solceller. Sweden, 2009.
[38] Energimyndigheten, “Förenklad administration av solcellsstödet — ER 2018:19,” Eskilstuna, 2018. [39] Boverket, A. Carlsson, U.-C. Götherström, A. Lindén, and J. Molinder, “Utformningen reducerade effekterna
— Boverkets utvärdering av OFFrotstödet,” Karlskrona, 2009.

Task 1 – National Survey Report of PV Power Applications in Sweden
74
[40] Boverkets statistiksystem, “Stöd för installation av solceller — månadsrapport april 2019,” 2019. [Online]. Available: http://www.energimyndigheten.se/globalassets/fornybart/solenergi/manadsrapporter/2020/solel-manadsstatistik_maj20.pdf. [Accessed: 02-Jun-2019].
[41] Jordbruksverket, “Investeringsstöd till förnybar energi.” [Online]. Available: https://nya.jordbruksverket.se/stod/fornybar-energi/investeringsstod-for-fornybar-energi. [Accessed: 02-Jun-2020].
[42] I. Norberg et al., “Solel i lantbruket — Realiserbar potential och nya affärsmodeller,” Uppsala, 2015. [43] Energimyndigheten, “Elcertifikatsystemet — ett stödsystem för förnybar elproduktion,” Eskilstuna, 2012. [44] Sveriges Regering and Norges Regering, Avtal mellan konungariket Sveriges regering och konungariket
Norges regering om ändring av avtal om en gemensam marknad för elcertifikat. 2015. [45] Energimyndigheten, “Kontrollstation för elcertifikatsystemet 2019,” 2019. [46] Infrastrukturdepartementet, “Elcertifikat - stoppregel och kontroll,” 2020. [47] Energimyndigheten, “Cesar — Sveriges kontoföringssystem för elcertifikat och ursprungsgarantier.”
[Online]. Available: https://cesar.energimyndigheten.se/default.aspx. [Accessed: 24-May-2019]. [48] Energimyndigheten, “Kvotnivåer.” [Online]. Available:
http://www.energimyndigheten.se/fornybart/elcertifikatsystemet/kvotpliktig/kvotnivaer/. [Accessed: 31-May-2019].
[49] Energimyndigheten, “Godkända anläggninar i elcertifikatsystemet.” [Online]. Available: http://www.energimyndigheten.se/fornybart/elcertifikatsystemet/marknadsstatistik/. [Accessed: 02-Jun-2019].
[50] Energikommissionen, B. Diczfalusy, A. Steen, G. Andrée, and C. Hellner, “Kraftsamling för framtidens energi — SOU 2017:2,” Stockholm, 2017.
[51] Sveriges Riksdag, Svensk författningssamling — Lag (1994:1776) om skatt pa energi. Sweden, 1994. [52] Finansdepartementet, “Ytterligare utvidgning av skattebefrielsen för egenproducerad el,” 2018. [53] Skatteverket, “Avdragsrätt för mervärdesskatt vid inköp och installation av en solcellsanläggning för
mikroproduktion av el,” 2018. [Online]. Available: https://www4.skatteverket.se/rattsligvagledning/368691.html?date=2018-03-01. [Accessed: 04-Jun-2020].
[54] Sveriges Riksdag, Svensk författningssamling — Mervärdesskattelag (1994:200). Sweden, 1994. [55] Sveriges Riksdag, Svensk författningssamling — Inkomstskattelag (1999:1226). Sweden, 1999. [56] Energimyndigheten, Statens energimyndighets föreskrifter om ursprungsgarantier för el, no. june 2017.
Sweden, 2017. [57] Sveriges Riksdag, Svensk författningssamling — Fastighetstaxeringslag (1979:1152). Sweden, 1979. [58] Boverket, “Solfångare och solcellspaneler.” [Online]. Available: https://www.boverket.se/sv/PBL-
kunskapsbanken/lov--byggande/anmalningsplikt/bygglovbefriade-atgarder/andring-av-byggnaders-yttre-utseende/sol/. [Accessed: 18-Aug-2019].
[59] Sveriges Riksdag, Svensk författningssamling — Förordning (2016:899) om bidrag till lagring av
egenproducerad elenergi. Sweden, 2018. [60] Regeringskansliet, “Bonus-Malus och bränslebytet.” [Online]. Available:
https://www.regeringen.se/artiklar/2017/09/bonus-malus-och-branslebytet/. [Accessed: 21-Jun-2020]. [61] Miljöfordon, “Bonus-malus.” [Online]. Available: https://www.miljofordon.se/ekonomi/bonus-malus/.
[Accessed: 21-Jun-2020]. [62] Transportstyrelsen, “Bonus — till bilar med låga utsläpp.” [Online]. Available:
https://www.transportstyrelsen.se/sv/vagtrafik/Fordon/bonus-malus/bonus/berakna-din-preliminara-bonus/. [Accessed: 21-Jun-2020].
[63] Naturvårdsverket, “Resultat för Klimatklivet.” [Online]. Available: https://www.naturvardsverket.se/Stod-i-miljoarbetet/Bidrag/Klimatklivet/Resultat-for-Klimatklivet/. [Accessed: 21-Jun-2020].
[64] Naturvårdsverket, “Stöd till publika laddningsstationer.” [Online]. Available: https://www.naturvardsverket.se/Stod-i-miljoarbetet/Bidrag/Klimatklivet/Bidrag-till-laddstationer-/Stod-till-publika-laddningsstationer/. [Accessed: 21-Jun-2020].
[65] Sveriges Riksdag, Svensk författningssamling — Förordning (2019:525) om statligt stöd för installation av
laddningspunkter för elfordon. Sweden, 2019. [66] Sveriges Riksdag, Svensk författningssamling — Förordning (2017:1318) om bidrag till privatpersoner för
installation av laddningspunkt till elfordon. Sweden, 2017. [67] Skatteverket, “Så här fungerar rot- och rutavdraget.” [Online]. Available:
Task 1 – National Survey Report of PV Power Applications in Sweden
75
https://www.skatteverket.se/privat/fastigheterochbostad/rotochrutarbete/saharfungerarrotochrutavdraget.4.d5e04db14b6fef2c866097.html#Rotochrutavdragetsstorlek. [Accessed: 27-May-2019].
[68] Energimarknadsinspektionen, “Ny modell för elmarknaden,” Eskilstuna, 2017. [69] A. Palm, “Peer effects in residential solar photovoltaics adoption — A mixed methods study of Swedish
users,” Energy Res. Soc. Sci., vol. 26, pp. 1–10, 2017, doi: 10.1016/j.erss.2017.01.008. [70] A. Palm, “Local factors driving the diffusion of solar photovoltaics in Sweden: A case study of five
municipalities in an early market,” Energy Res. Soc. Sci., vol. 14, pp. 1–12, 2016, doi: 10.1016/j.erss.2015.12.027.
[71] A. Palm and B. Lantz, “Information dissemination and residential solar PV adoption rates: The effect of an information campaign in Sweden,” Energy Policy, vol. 142, p. 111540, 2020, doi: 10.1016/j.enpol.2020.111540.
[72] Region Örebro län and Länsstyrelsen Örebro län, “Energi- och klimatprogram för Örebro län 2017–2020,” 2017.
[73] Uppsala kommun, “Miljö- och klimatprogram 2014–2023,” Uppsala, 2015. [74] Helsingborgs stad, “Klimat- och energiplan för Helsingborg 2018–2024,” 2018. [75] Kristianstads Kommun, “Klimat- och energistrategi — Kristianstads kommun,” 2018. [76] Finansdepartementet, “Skattereduktion för installation av grön teknik — Fi2020/002314/S1 Skattereduktion
för installation av grön teknik Maj,” 2020. [77] S. O. Utredningar, “Moderna tillståndsprocesser för elnät — SOU 2019:30,” Stockholm, 2019. [78] Energimyndigheten, “Förslag till strategi för ökad användning av solel,” Eskilstuna, 2016. [79] Energikommissionen, “Ramöverenskommelse mellan Socialdemokraterna, Moderaterna, Miljöpartiet de
gröna, Centerpartiet och Kristdemokraterna,” Stockholm, 2016.

Task 1 – National Survey Report of PV Power Applications in Sweden
1

![Svensk sammanfattning 1 - Solcellsbyggarna · Svensk sammanfattning av IEA-PVPS National Survey Report of PV power applications in Sweden 2014 E˜ekt [MW] Johan Lindahl ... Fristående](https://img.dokumen.tips/doc/110x75/5f0a77267e708231d42bc4cb/svensk-sammanfattning-1-svensk-sammanfattning-av-iea-pvps-national-survey-report.jpg)