Embed Size (px)
Citation preview

NATIONAL OPEN UNIVERSITY OF NIGERIA
SCHOOL OF SCIENCE AND TECHNOLOGY
COURSE CODE: CHM312
COURSE TITLE: Instrumental Methods of Analysis

2
Module 1: Spectroscopic Analyses
Unit 1: Spectroscopic Techniques
Page
1.0 Introduction - - - - - - - - - - - - - - - - - - - - - - - - - - - - - - - - - - - - - - - - - - 2
2.0 Objectives - - - - - - - - - - - - - - - - - - - - - - - - - - - - - - - - - - - - - - - - - - - - 2
3.0 Definition - - - - - - - - - - - - - - - - - - - - - - - - - - - - - - - - - - - - - - - - - - - - - - - - - 2
3.1 Interaction of radiation and matter - - - - - - - - - - - - - - - - - - - - - - - - - - - - - - - 2
3.2 Electromagnetic radiation - - - - - - - - - - - - - - - - - - - - - - - - - - - - - - - - - - - - - 3
3.3 Absorption of radiation - - - - - - - - - - - - - - - - - - - - - - - - - - - - - - - - - - - - - - - 4
3.4 Emission of radiation - - - - - - - - - - - - - - - - - - - - - - - - - - - - - - - - - - - - - - - - 4
3.5 Types of spectroscopy - - - - - - - - - - - - - - - - - - - - - - - - - - - - - - - - - - - - - - - 4
4.0 Conclusion - - - - - - - - - - - - - - - - - - - - - - - - - - - - - - - - - - - - - - - - - - - - - - - 5
5.0 Summary - - - - - - - - - - - - - - - - - - - - - - - - - - - - - - - - - - - - - - - - - - - - - - - - 5
6.0 Tutor-Marked Assignment (TMA) --------------------------------------------------------- 5
7.0 Further reading/ References - - - - - - - - - - - - - - - - - - - - - - - - - - - - - - - - - - 6

3
1.0 Introduction
Spectroscopic method of analysis involves the measurements of the intensity and wavelength of radiation that is either absorbed or transmitted. This provides the basis for sensitive methods of detection and quantitation. Absorption spectroscopy is most frequently used in the quantitation or estimation of molecules and some atoms .Emission spectroscopy covers several techniques that involve the emission of radiation by either atoms or molecules, but varies in the manner in which the emission is induced. This method of analysis involves the use of equipment, which may be simple and inexpensive, or extremely complex, with design features involving the latest technological development.
2.0 Objectives
At the end of this unit, student should be able to:
• Explain the meaning of spectroscopy;
• Describe the nature of electromagnetic radiation; • Describe the interaction of radiation with matter; • Distinguish between absorption and emission spectroscopy; and
• State the different types of spectroscopy.
3.0 Definition of spectroscopy
Spectroscopy is a technique which concerned with the study of the frequencies involved when electromagnetic radiation interacts with matter.
3.1 Interaction of radiation and matter
Radiation is a form of energy which could either be absorbed or transmitted. The interaction of radiation in spectroscopy involves transition between the different energy levels of atoms or molecules. The other types of interactions such as reflection, refraction and diffraction, are often related to the bulky properties of materials rather than to energy levels of specific atoms or molecules. Generally, the absorption or emission of radiation by matter involves the exchange of energy. Thus, to understand the principle of this exchange, it is necessary to know the distribution of energy within an atom or molecule. The internal energy of a molecule is due to the energy associated with:
The electrons Vibrations between atoms The rotation of various groups of atoms within a molecule
The energy levels can be altered by the absorption or emission of radiant energy. This is because atoms exist only within a limited number of energy levels. A study of the wavelength

4
or frequency of radiation absorbed or emitted by an atom or molecule will give information about its identity. This technique is known as qualitative spectroscopy.
3.2 Electromagnetic radiation
Radiation is a form of energy which has both magnetic and electrical properties, hence called electromagnetic radiation. The electromagnetic radiation covered a long range of radiations which are described or characterised by either wavelength or frequency.
Wavelength ( is defined as the distance between the successive peaks which is measured in the unit nanometers (nm).
Frequency (of radiation is defined as the number of successive peaks passing a given point in 1 second.
The relationship between the two parameters is:
But, the energy (E) is directly proportional to the frequency and inversely proportional to wavelength.
. .
, !
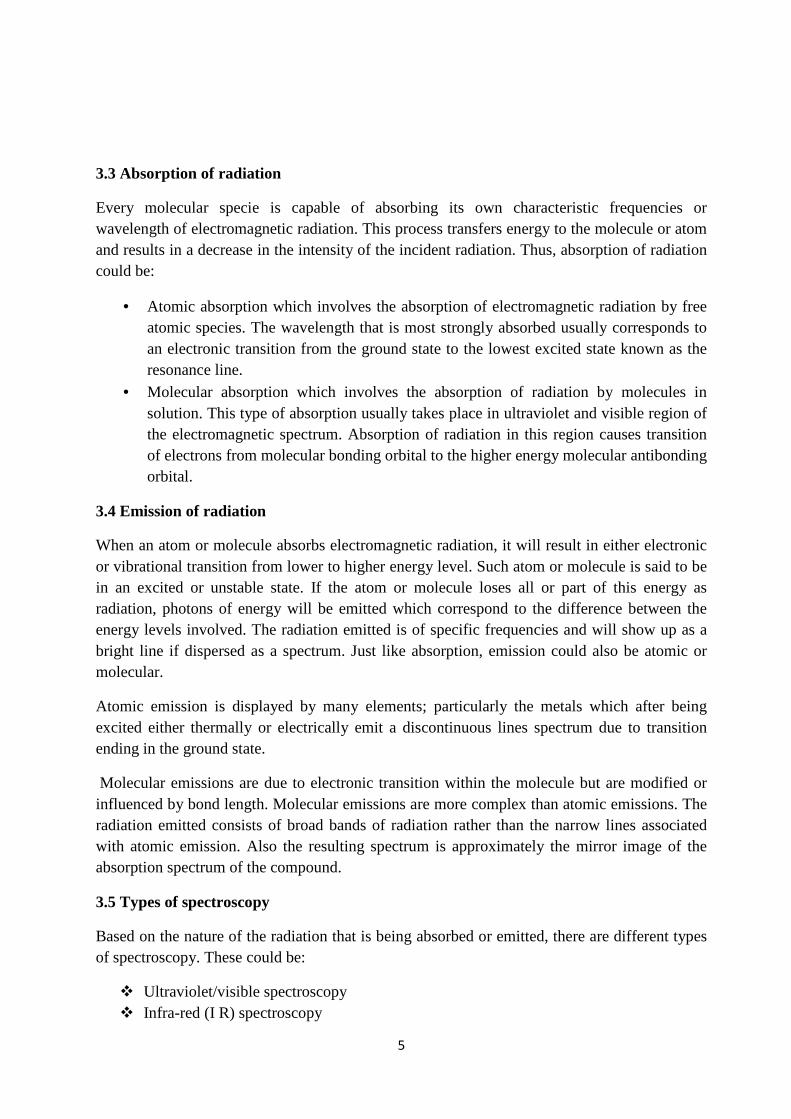
The electromagnetic radiation consists of:
Gamma rays"#in the range of 10&' 10&( X-rays in the range of 1 to 103 A0 Ultraviolet radiation in the range of 180 to 380nm Visible region in the range of 380 to 780nm Infra red region in the range of 0.78)( 50)( Microwave in the range of 10-2 to 10cm Radiowave in the range of 10+ 10, (
This can also be represented as bellow:
Fig. 1.1: Range of electromagnetic radiation
10-4
105
10-2
107
1
109 10
-3
10-12
10-10
10-1
10-8
10
10-6
103
γ-rays X-rays
Ult
rav
iole
t
Vis
ible
Infrared
Mic
row
av
es
Ra
dio
wa
ve
s
Source: Holme, D.J. and Hazel, P. 1998.
Wavelength (m)
Wavelength (nm)
5
3.3 Absorption of radiation
Every molecular specie is capable of absorbing its own characteristic frequencies or wavelength of electromagnetic radiation. This process transfers energy to the molecule or atom and results in a decrease in the intensity of the incident radiation. Thus, absorption of radiation could be:
• Atomic absorption which involves the absorption of electromagnetic radiation by free atomic species. The wavelength that is most strongly absorbed usually corresponds to an electronic transition from the ground state to the lowest excited state known as the resonance line.
• Molecular absorption which involves the absorption of radiation by molecules in solution. This type of absorption usually takes place in ultraviolet and visible region of the electromagnetic spectrum. Absorption of radiation in this region causes transition of electrons from molecular bonding orbital to the higher energy molecular antibonding orbital.
3.4 Emission of radiation
When an atom or molecule absorbs electromagnetic radiation, it will result in either electronic or vibrational transition from lower to higher energy level. Such atom or molecule is said to be in an excited or unstable state. If the atom or molecule loses all or part of this energy as radiation, photons of energy will be emitted which correspond to the difference between the energy levels involved. The radiation emitted is of specific frequencies and will show up as a bright line if dispersed as a spectrum. Just like absorption, emission could also be atomic or molecular.
Atomic emission is displayed by many elements; particularly the metals which after being excited either thermally or electrically emit a discontinuous lines spectrum due to transition ending in the ground state.
Molecular emissions are due to electronic transition within the molecule but are modified or influenced by bond length. Molecular emissions are more complex than atomic emissions. The radiation emitted consists of broad bands of radiation rather than the narrow lines associated with atomic emission. Also the resulting spectrum is approximately the mirror image of the absorption spectrum of the compound.
3.5 Types of spectroscopy
Based on the nature of the radiation that is being absorbed or emitted, there are different types of spectroscopy. These could be:
Ultraviolet/visible spectroscopy Infra-red (I R) spectroscopy
6
Nuclear Magnetic Resonance (NMR) spectroscopy Mass spectroscopy X- ray spectroscopy
Apart from the above classification, spectroscopy can also be broadly classified into three categories:
Electronic spectroscopy Vibrational spectroscopy Rotational spectroscopy
The electronic spectroscopy involves the movement of electrons between their various energy levels, as a result of absorption or emission of electromagnetic radiation. The energy required for electronic transition comes from ultraviolet or visible region.
Vibrational spectroscopy is concerned with the vibrations of molecules when photons of radiation are absorbed. Molecules can vibrate with particular amounts of energy whose values are determined by a quantum number. The energy needed for vibration of molecule comes from the infra red region.
Rotational spectroscopy is concerned with the energy that causes the rotation of a molecule. The energy of the rotational level depends on the rotational quantum numbers. The energy required for the molecular rotation is provided by the micro wave region of the spectrum.
4.0 Conclusion
Spectroscopic method of analysis, is a technique which involves the measurements of the intensity of radiation that is either absorbed or transmitted.
5.0 Summary
In this unit we have learnt that:
Spectroscopy is a technique which involves the study of the absorption and emission of radiation by matter.
Electromagnetic radiation or spectrum covers a long range of radiations measured in the unit of frequency or wavelength.
Absorption spectroscopy measures electromagnetic radiation that is taken in by atoms or molecules.
Emission spectroscopy measures the radiation that is given out by atoms or molecules Spectroscopy could be electronic, infra-red (or Vibrational) and microwave (or
rotational). 6.0 Tutor Marked Assignment (T M A)
1. What is meant by spectroscopy? 2. Distinguish clearly between absorption and emission spectroscopy 3. Calculate the corresponding energy of a UV-radiation having a wavelength of 250nm
7
7.0 Further reading/ References
1.0 Robert, M.S., Clayton, G.B. and Terence, C.M., (1974). Spectrometric Identification of Organic Compounds, 3rd Edition, Wiley International
2.0 David, J.H. and Hazel, P., (1998). Analytical Biochemistry, Third edition, Longman
3.0 Douglas, A.S. , Donald, M.W., James, F.H. and Stanley, R.C., (2004). Fundamentals of Analytical Chemistry, Eight Edition.

8
Unit 2 : Spectrochemical optical methods
Pages
1.0 Introduction - - - - - - - - - - - - - - - - - - - - - - - - - - - - - - - - - - - - - - - - - - - - - - - 8
2.0 Objectives - - - - - - - - - - - - - - - - - - - - - - - - - - - - - - - - - - - - - - - - - - - - - - - - 8
3.0 Definition - - - - - - - - - - - - - - - - - - - - - - - - - - - - - - - - - - - - - - - - - - - - - - - - - 8
3.1 Types of optical methods of analysis - - - - - - - - - - - - - - - - - - - - - - - - - - - - - - 8
3.2 Molecular absorption analysis - - - - - - - - - - - - - - - - - - - - - - - - - - - - - - - - - - - 8
3.2.1 Beer’s Law - - - - - - - - - - - - - - - - - - - - - - - - - - - - - - - - - - - - - - - - - - - - - - 9
3.2.2 Lambert’s Law - - - - - - - - - - - - - - - - - - - - - - - - - - - - - - - - - - - - - - - - - - - - 9
3.2.3 Limitation of Beer’s law - - - - - - - - - - - - - - - - - - - - - - - - - - - - - - - - - -- - - 10
3.2.4 Absorbance and Transmittance - - - - - - - - - - - - - - - - - - - - - - - - - - - - - - - - - 11
3.3 Colorimetry - - - - - - - - - - - - - - - - - - - - - - - - - - - - - - - - - - - - - - - - - - - - - - - - 11
3.3.1 Mode of operation of colorimeter - - - - - - - - - - - - - - - - - - - - - - - - - - - - - - - 11
3.4 Spectrophotometry - - - - - - - - - - - - - - - - - - - - - - - - - - - - - - - - - - - - - - - - - - - - 12
3.4.1 Radiation source - - - - - - - - - - - - - - - - - - - - - - - - - - - - - - - - - - - - - - - - - - 12
3.4.2 Monochromator - - - - - - - - - - - - - - - - - - - - - - - - - - - - - - - - - - - - - - - - - - 13
3.4.3 Detector - - - - - - - - - - - - - - - - - - - - - - - - - - - - - - - - - - - - - - - - - - - - - - - - 13
3.5 Differences between colorimeter and spectrophotometer - - - - - - - - - - - - - - - - - - - - - 13
4.0 Conclusion - - - - - - - - - - - - - - - - - - - - - - - - - - - - - - - - - - - - - - - - - - - - - - - - - - - 14
5.0 Summary - - - - - - - - - - - - - - - - - - - - - - - - - - - - - - - - - - - - - - - - - - - - - - - - - - - - - 14
6.0 Tutor Marked Assignment - - - - - - - - - - - - - - - - - - - - - - - - - - - - - - - - - - - - - - - - - 14
7.0 Further Reading / References - - - - - - - - - - - - - - - - - - - - - - - - - - - - - - - - - - - - - - - 14
9
Unit 2: Spectrochemical optical methods
1.0 Introduction
Optical method of analysis involves the measurement of light intensity. To relate optical measurement to the amount of a particular substance in a sample, it is necessary to exploit the ability of atoms or molecules to absorb or emit light radiation when exposed to a particular set of conditions. Thus this method of analysis involves the use of instrument with varying degrees of sophistication.
2.0 Objectives
At the end of this unit the student should be able to:
• Explain the different types of optical method of analysis; • Explain the operational principle of molecular absorption method of analysis;
• State the basic laws of light absorption; • Differentiate between colorimetry and spectrophotometry; and • Name the basic components of colorimeter and spectrophotometer and state their
functions.
3.0 Definition
Optical methods are spectroscopic techniques that are based on the absorption or emission of ultraviolet, visible and infrared radiation.
3.1 Types of optical methods of analysis
Colorimetry which involves the measurement of the absorption of light radiation by a coloured solution.
Spectrophotometry which measures the absorption of light of a narrow wavelength band by molecules in solution.
Atomic absorption analysis which measures the absorption light radiation by a free atomic specie.
Flourimetry which involves the estimation of the amount of fluorescent substance in a given sample.
Atomic emission analysis which based on the emission light atoms in exited electronic state.
3.2 Molecular absorption analysis
The absorption of light by a compound in solution increases with the concentration of the compound and this effect is fully exploited in colorimetry and spectrophotometry. Coloured compounds can be estimated directly while other compounds which give coloured derivatives with particular chemical reagents can also be analysed.

10
The absorption of light radiation by solutions can be elucidated by a combination of the laws of Beer and Lambert. These two laws relate the absorption to concentration and to the thickness of the absorbing layer respectively.
3.2.1 Beer’s law
This law states that the absorption of light is directly proportional to the number of the absorbing molecules. That is, the transmittance decreases exponentially with the number or concentration of the absorbing molecules.
Mathematically, Beer’s law is represented as:
-!./.
/0 1 -!.
/.
/ 21
, -!./.
/ 33"4 , 1 2
/. ! , / ( !
This law can also be represented as: 4 0 1 4 51
3.2.2 Lambert’s law
This law states that same proportion of incident light is absorbed per unit thickness irrespective of its intensity, and that each successive unit layer absorbs the same proportion of light falling on it. For example, if the incident light is 100% and 50% of it is absorbed per unit layer, the intensity of light will decrease exponentially as follows: 50%, 25%, 12.5%, 6.25%, etc .
Thus, according to this law, -!.67
60 !.
67
6
Note that: absorbance (A) = !.67
6
Where, ! .
The two laws are combined together and called Beer-Lambert’s law:
Light Intensity
Thickness of solution
I0 I
Fig 2.1: Light Intensity decreasing while passing through a solution

11
4 !.68
6 0 1 !.
68
6 2
where, 2 is a constant called molar extinction coefficient (or molar absorptivity) which is numerically equal to the absorbance of a molar solution in a cell of 1cm path length.
Note: While Lambert’s law holds for all cases, Beer’s law is only obeyed by dilute solutions. This because at certain concentrations association of absorbing molecules occur which causes a tailing off in the absorption of light. Hence, estimation of the unknown is carried out in the concentration range which Beer’s law is obeyed. It is usual to plot a standard curve or graph of absorbance against concentration to determine the concentration range in which Beer’s law is obeyed.
3.2.3 Limitations of Beer’s Law
Beer’s law describes the absorption behaviour only for dilute solutions, hence it is limited. At concentrations exceeding 0.01M, the average distances between the absorbing ions or molecules are reduced to a point where each particle affects the charge distribution, and the extent of absorption of its neighbours. Since the extent of interaction depends on concentration, the occurrence of this phenomenon causes deviations from the linear relationship between absorbance and concentration. On the other hand, at certain concentrations, association of absorbing molecules is thought to occur, which causes a tailing off in the absorption of light. Hence, Beer’s law is only obeyed by dilute solutions, but Lambert’s law holds for all cases.
Fig. 2. 3: Graph showing the limitations of Beer’s Law
Concentration
Range in which Beer’s
law is obeyed
Ab
sorb
ance
Ab
sorb
an
ce (
A)
Concentration(C) Fig. 2.2: A graph of Absorbance against Concentration

12
3.2.4 Absorbance and transmittance
The absorbance (A) is the measure of the fraction of light radiation that is absorbed by a given sample solution, while transmittance (T) is the fraction of incident light that is not absorbed (i.e. transmitted by the solution). Transmittance is often expressed as a percentage called percent transmittance.
Percentage transmittance (T) 6
68 9 100
But, absorbance is related to transmittance as follows:
4 !.100
:
Note that as the absorbance of a solution increases, the transmittance decreases.
3.3 Colorimetry
This method of analysis involves the measurement of the absorption of visible radiation of light by a coloured solution. This type of measurement is carried out by the use of an instrument called colorimeter. The colorimeter consists of:
Light source (tungsten lamp) Monochromator (filter) Slit Optical cell or cuvette Photo electric cell Galvanometer
The instrumental set up is as bellow:
3.3.1 Mode of operation
White light from a tungsten lamp passes through a condenser lens to give a parallel beam which falls on the filter that is positioned to select radiation of specific wavelength to impinge on a glass cuvette containing the solution. As the light is passing through the solution, some
Fig. 2.4: Schematic diagram of a simple Colorimeter
Optical cell Light source Monochromator Detector
Slit

13
part of it is absorbed by the sample component, while the part that is not absorbed is transmitted, and detected by a photo electric cell (detector). In order to measure the absorbance of a solution, the meter reading is first adjusted to 100% transmittance (zero absorbance) with a blank solution. The sample is then inserted in place of the blank and the absorbance is read directly. The concentration corresponding to the absorbance of the sample is then obtained from the standard or calibration graph.
3.4 Spectrophotometry
This method of analysis involves the measurement of the absorption of a narrow wavelength band of radiation by molecules in solution. The instruments that are used to study or to measure the absorption or emission of electromagnetic radiation as a function of wave length are called spectrometers or spectrophotometers. The optical and electronic principles employed in these instruments are basically the same for all the regions of the spectrum.
The essential components of a spectrophotometer include:
stable source of radiant energy system of lenses, mirrors and slits which define collimate(make parallel) and focus the
beam of light monochromator to resolve the radiation into its individual wavelength cuvette or cell for holding the sample radiation detector with an associated read out system(meter or recorder)
Below is a schematic diagram of a typical spectrophotometer:
3.4.1 Radiation source
The source of ultraviolet radiation is provided by hydrogen and deuterium lamps. These lamps consist of a pair of electrodes which are enclosed in a glass tube provided with a quartz window and filled with hydrogen or deuterium gas at low pressure. These lamps provide radiation in the range of 180 – 350nm.
A tungsten filament lamp is the most satisfactory source of visible and near infrared radiation. This lamp provides radiation in the region between 350 and 2500nm. Other sources of radiation include: xenon lamp , Globar and Nernst glower.
Radiation source Monochromator
Sample
cell
Detector Meter
Fig. 2.5: Components of a Spectrophotometer
Source: Analytical biochemistry by David J. Holme and Hazel Peck, 1998
14
3.4.2 Monochromator
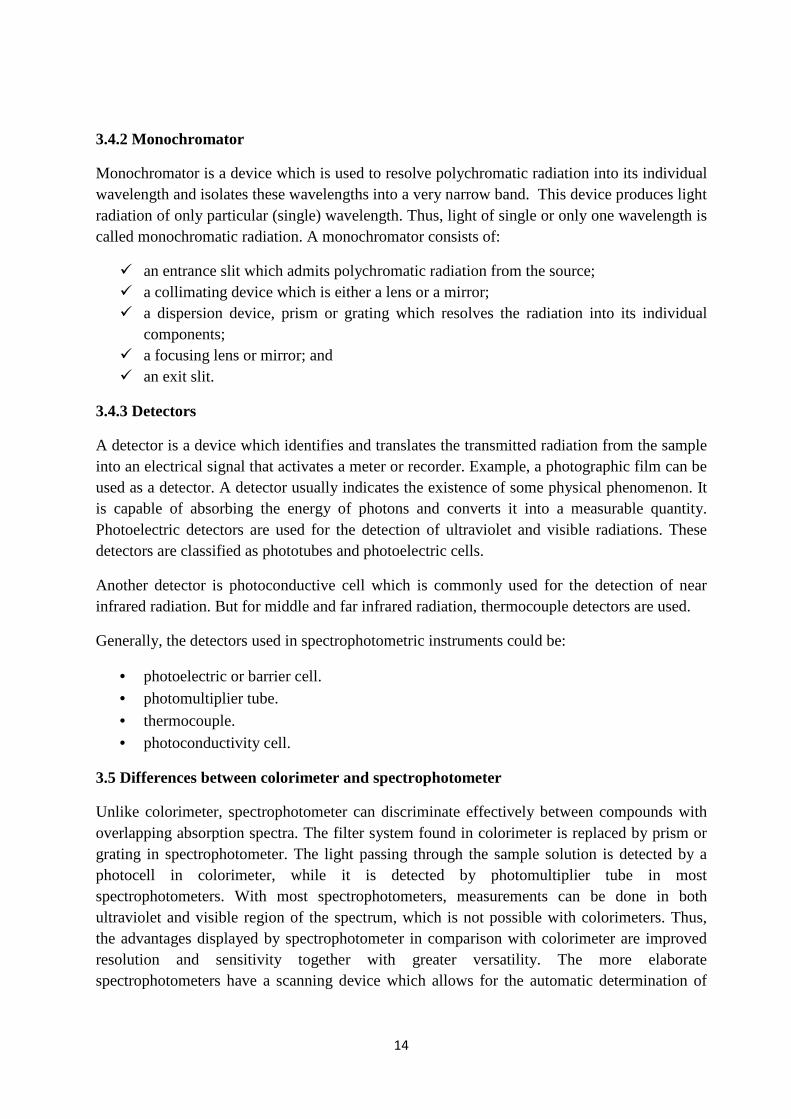
Monochromator is a device which is used to resolve polychromatic radiation into its individual wavelength and isolates these wavelengths into a very narrow band. This device produces light radiation of only particular (single) wavelength. Thus, light of single or only one wavelength is called monochromatic radiation. A monochromator consists of:
an entrance slit which admits polychromatic radiation from the source; a collimating device which is either a lens or a mirror; a dispersion device, prism or grating which resolves the radiation into its individual
components; a focusing lens or mirror; and an exit slit.
3.4.3 Detectors
A detector is a device which identifies and translates the transmitted radiation from the sample into an electrical signal that activates a meter or recorder. Example, a photographic film can be used as a detector. A detector usually indicates the existence of some physical phenomenon. It is capable of absorbing the energy of photons and converts it into a measurable quantity. Photoelectric detectors are used for the detection of ultraviolet and visible radiations. These detectors are classified as phototubes and photoelectric cells.
Another detector is photoconductive cell which is commonly used for the detection of near infrared radiation. But for middle and far infrared radiation, thermocouple detectors are used.
Generally, the detectors used in spectrophotometric instruments could be:
• photoelectric or barrier cell. • photomultiplier tube.
• thermocouple. • photoconductivity cell.
3.5 Differences between colorimeter and spectrophotometer
Unlike colorimeter, spectrophotometer can discriminate effectively between compounds with overlapping absorption spectra. The filter system found in colorimeter is replaced by prism or grating in spectrophotometer. The light passing through the sample solution is detected by a photocell in colorimeter, while it is detected by photomultiplier tube in most spectrophotometers. With most spectrophotometers, measurements can be done in both ultraviolet and visible region of the spectrum, which is not possible with colorimeters. Thus, the advantages displayed by spectrophotometer in comparison with colorimeter are improved resolution and sensitivity together with greater versatility. The more elaborate spectrophotometers have a scanning device which allows for the automatic determination of
15
the absorbance of a solution as a continuous function of wavelength. Spectrophotometers with direct reading device are also available.
4.0 Conclusion
Spectrochemical optical method of analysis is concerned with the measurement of the light radiation that is either absorbed or emitted by molecules in solution. This is achieved by the use of different types of equipment which may be simple or complex.
5.0 Summary
In this unit we have learnt that:
• Optical methods are spectroscopic techniques that are based on the absorption or emission of ultraviolet, visible and infrared radiation.
• There are different types of optical methods of analysis such as colorimetry, spectrophotometry, etc.
• The absorption of light radiation increases with the corresponding increase in concentration of the molecules in solution.
• Colorimetry involves the measurement of light absorption by coloured solution • Spectrophotometry is the method which involves the measurement of the absorption of
a narrow wavelength band by molecules in solution.
6.0 Tutor Marked Assignment
1. a. State Beer’s and Lambert’s laws. b. What is the relationship between absorbance and transmittance?
2. a. Distinguish clearly between a colorimeter and a spectrophotometer b. Several spectrophotometers have scales that are read either in absorbance or in
% transmittance. What would be the absorbance reading at 20% T and 80% T respectively?
7.0 Further reading/References
1. David, J. H. And Hazel, P. (1998) . Analytical biochemistry, third edition, Longman.
2. Robert, M.S., Clayton, G.B. and Terence, C.M. (1974). Spectrometric Identification of Organic Compounds, 3rd Edition, Wiley International.
3. Daniel, C. H., (1982). Qualitative Chemical Analysis, 2nd Edition.

16
Unit: 3 Infrared spectroscopy Page
1.0 Introduction - - - - - - - - - - - - - - - - - - - - - - - - - - - - - - - - - - - - - - - - - - - - - 16
2.0 Objectives - - - - - - - - - - - - - - - - - - - - - - - - - - - - - - - - - - - - - - -- - - - - - - - - - - 16
3.0 Definition - - - - - - - - - - - - - - - - - - - - - - - - - - - - - - - - - - - - - - - - - - - - - - - 16
3.1 Basic principles of infrared spectroscopy - - - - - - - - - - - - - - - - - - - - - - - - - - 16
3.2 Types of molecular vibrations - - - - - - - - - - - - - - - - - - - - - - - - - - - - - - - - - - 17
3.3 Group frequencies - - - - - - - - - - - - - - - - - - - - - - - - - - - - - - - - - - - - - - - - - - 18
3.4 Instrumentation - - - - - - - - - - - - - - - - - - - - - - - - - - - - - - - - - - - - - - - - - - - - 19
3.4.1 Radiation source - - - - - - - - - - - - - - - - - - - - - - - - - - - - - - - - - - - - 19
3.4.2 Monochromator - - - - - - - - - - - - - - - - - - - - - - - - - - - - - - - - - - - - - 19
3.4.3 Detector - - - - - - - - - - - - - - - - - - - - - - - - - - - - - - - - - - - - - - - - - - - 19
3.5 Application - - - - - - - - - - - - - - - - - - - - - - - - - - - - - - - - - - - - - - - - - - - 19
4.0 Conclusion - - - - - - - - - - - - - - - - - - - - - - - - - - - - - - - - - - - - - - - - - - - - - - - 20
5.0 Summary - - - - - - - - - - - - - - - - - - - - - - - - - - - - - - - - - - - - - - - - - - - - - - - - - 20
6.0 Tutor Marked Assignment - - - - - - - - - - - - - - - - - - - - - - - - - - - - - - - - - - - -- - 20
7.0 Further reading / References - - - - - - - - - - - - - - - - - - - - - - - - - - - - - - - - - - - - 20

17
Unit 3: Infrared spectroscopy
1.0 Introduction
Infrared spectrophotometry is a branch of spectroscopy which is concerned with the measurement of absorption of electromagnetic radiation, by molecules due to their vibrational ability. It is very important here to note that atoms in a molecule usually vibrate within the bonds that link them together. The vibrational energy in a molecule is obtained within infrared region of the electromagnetic spectrum. Thus, when ever an infrared radiation of a specific frequency interacts with a molecule, the energy is absorbed leading to an increased vibrational energy of that bond. This can even lead to change in the dipole moment of the bond concerned. Thus, the infrared instrument (spectrophotometer) is designed to measure the energy absorbed by the bond in the molecule at different wavelengths (nm) or wave number ( cm-1) to produce a chart called infrared spectrum.
2.0 Objectives
By the end of this unit, student should be able to:
explain the basic principles of infrared spectrometry; describe the different types of molecular vibrations; describe the instrumental arrangement of infrared spectrophotometer; and interpret the IR spectrum.
3.0 Definition
Infrared spectroscopy is a method which involves the study of the absorption of electromagnetic radiation in the range of 0.78 to 300)(.
3.1 Basic principles of infrared spectrometry
Every molecule possess kinetic energy (E) which is responsible for its vibration or rotation. The total energy (Et) of a molecule is due to vibrational, rotational and translational energy within the molecule. Thus, the total kinetic energy (Et) is given by the expression:
; < = > = ;>
Where, < 3 !? , > !? ;> !?.
A molecule containing n atoms will have 3n mode degrees of freedom of motion. These are made of 3 rotational, 3 translational and 3n – 6 vibrational motions. Thus, for a non linear poly atomic molecule, the fundamental mode of vibration is 3n – 6 while a linear molecule has 3n – 5. With this, it is possible to predict theoretically the number of infrared bands that can be obtained from a given molecule.
Example: Ethylmethylketone,1@' A 1@B A 1C A 1@' which is made up of 13 atoms, has 33 theoretical mode of vibration. This is calculated as below:
18
I In 1@' A 1@B A 1C A 1@' , n = 13
Then, 3n -6 = (3 x 13) – 6 = 33
But, it is not possible to detect all of these vibrations in the IR spectrum because many of these bands may overlap, others may be symmetrical vibration which may not absorb any radiation. In a complex molecule, stretching and bending of bond is possible and these depend on the bond strength and masses of the corresponding atoms that form such bond.
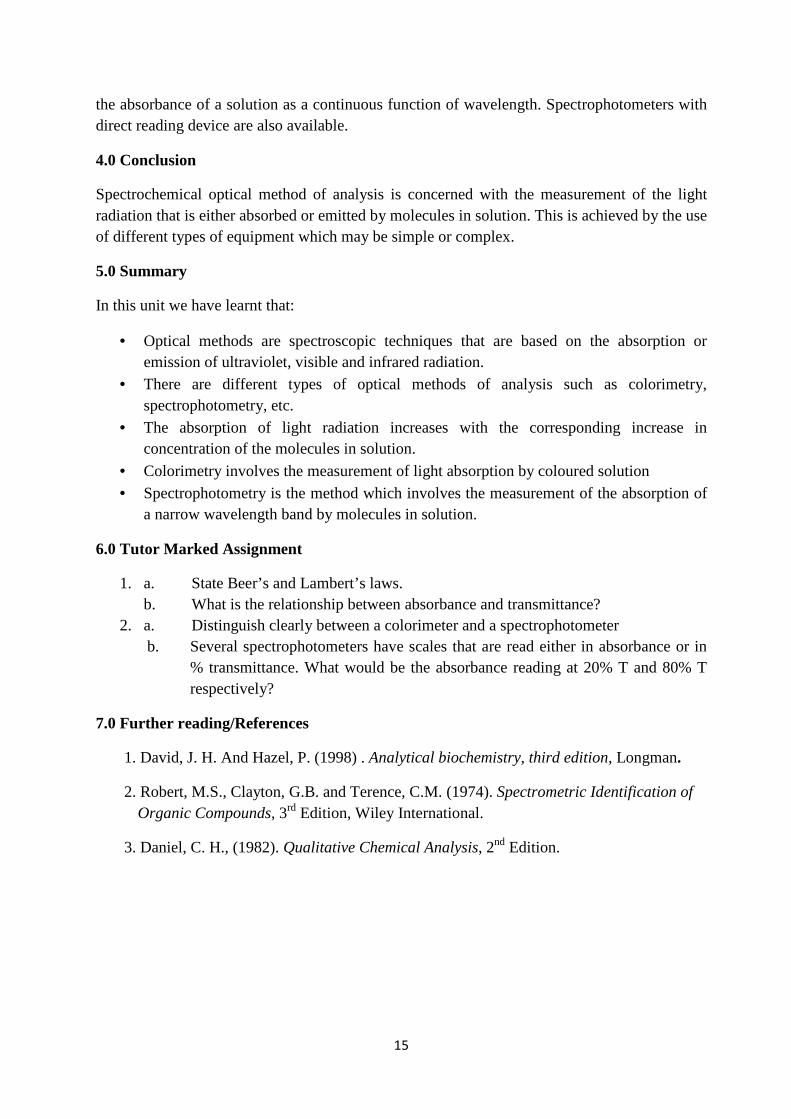
3.2 Types of molecular vibrations
In an organic molecule there are two major types of fundamental vibrations. These are:
Stretching of bond Bending of bond
The stretching vibration could either be symmetrical or asymmetrical. These are represented as above
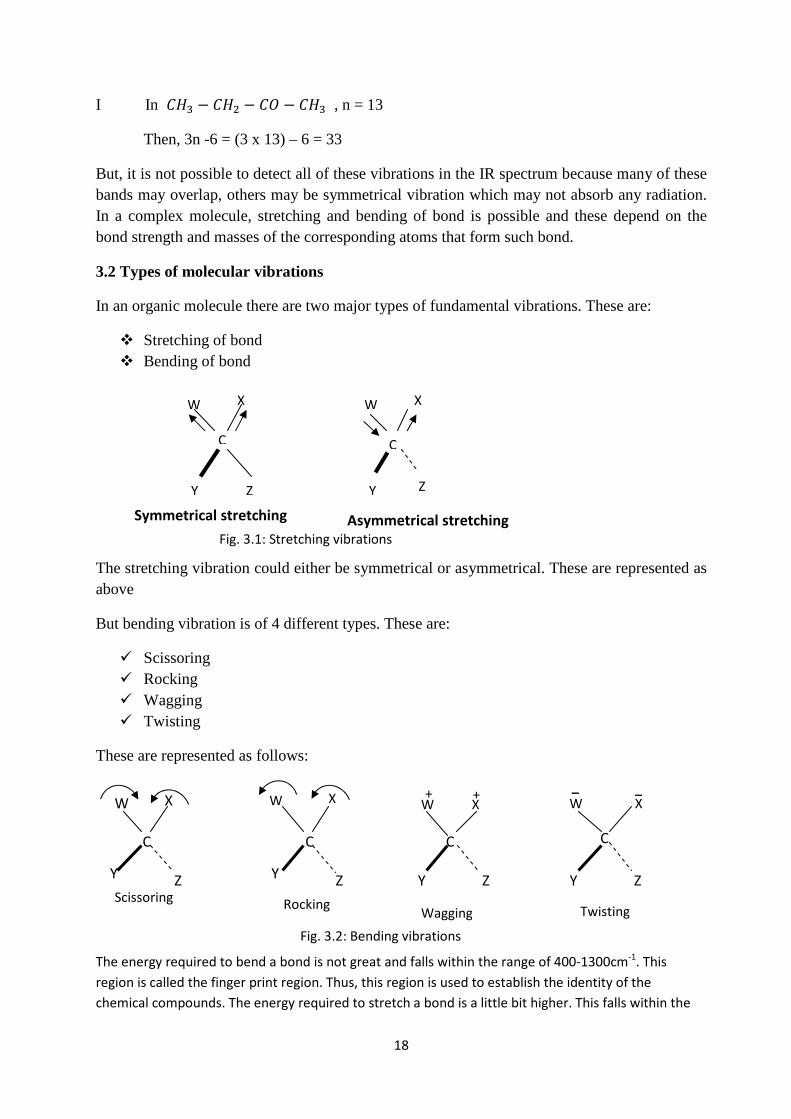
But bending vibration is of 4 different types. These are:
Scissoring Rocking Wagging Twisting
These are represented as follows:
The energy required to bend a bond is not great and falls within the range of 400-1300cm-1
. This
region is called the finger print region. Thus, this region is used to establish the identity of the
chemical compounds. The energy required to stretch a bond is a little bit higher. This falls within the
W X W X
Symmetrical stretching
Z Y Z
C C
Y
Asymmetrical stretching
Fig. 3.2: Bending vibrations
W X W X W X
Y Z
Y Z Y Z Y Z
C C C C
W X + +
_ _
Rocking Scissoring
Wagging Twisting
Fig. 3.1: Stretching vibrations

19
region of 1300 – 4000cm-1
. This signal is caused by groups such as OH, NH , C= O, C = C, CHO, etc.
These group frequencies are independent of other parts of the molecule and are used to detect the
functional groups in molecules.
3.3 Group frequencies
Group frequencies are the absorption bands or signals that occurs at certain frequencies due to stretching or bending vibration within a molecule. For example, the bands at 3300cm-1 and 1050cm-1 are characteristics of the OH group in alcohols. Group frequencies can change depending on the nature of the molecule and the solvent.
Example of some group frequencies are given below:
Vibration type of molecule group frequencies (cm-1)
1 A @DEFGEHI Alkanes, alcohols 2800 – 3000
1 A @J;>K; Aldehydes 2700 – 2900
C – Hstretch Alkenes 3010- 3095
O – Hstretch Alcohols, phenols 3200 – 3600
O – Hstretch Acids 2500 – 3000
O – Hbend Alcohol, phenol 1260 – 1410
N – Hstretch Amines 3300 – 3500
C = Cstretch Alkenes 1620 – 1680
C = Ostretch Aldehyde 1720 – 1740
1 L 1J;>K; Alkynes 2100 – 2140
1 L MJ;>K; Nitriles 2000 – 2500
C = Ostretch Ketones 1705 – 1725
C = Ostretch Carboxylic acid 1700 – 1725

20
3.4 Instrumentation
The instrument used is called infrared spectrophotometer. This instrument is basically similar to those used for the UV/ Visible measurements, but only differ from the energy or radiation sources, optical materials and the detection device.
3.4.1 Radiation source
The radiation source may be:
• Nernst glower which is a mixture of oxides of zirconium or thorium
• Globar unit which is a small rod of silicon carbide
3.4.2 Monochromator
This may be a prism or grating. The prism monochromator is usually made of sodium chloride crystals which disperse electromagnetic radiation between 4000 and 650cm-1. The grating systems monochromator have a better resolving power and disperse uniformly in all regions of electromagnetic radiation.
3.4.3 Detector
The detecting device is either a thermocouple or a bolometer. A thermocouple is made of two different metals connected together to which two sensitive galvanometers are attached from the other end. The I R radiation impinges on the junction of the metals to generate a thermo electromotive force which enables the current to flow. The current generated is proportional to the quantity of the radiation impinged on the metal.
3.5 Application
• Used for the identification of the identity or non identity of two samples. This is done mainly in the finger print region of the spectrum.
Spherical
mirror
Source of
radiation
Spherical
mirror
Sample cell
Reference cell
Comb
RM
Rotating prism
Pen
Recorder Amplifier
Detector
Fig. 3.3: The schematic diagram of infra-red spectrophotometer
Source: Peter R.S. Murray, 1983

21
• It is used for the detection of impurities. This is applied only when the impurities absorb strongly in the region where the main component is transparent(i.e. not absorbing any radiation)
• Identification of functional groups. I. R. Is very useful for the identification of some functional groups such as OH, CO, CHO, C = C, NH2 e.t.c.
4.0 Conclusion
Infrared spectroscopy is concerned with the absorption of electromagnetic radiation by molecules due to their vibrational ability. The type of spectrum obtained gives a vital information on the nature of the functional groups present in a given compound or sample.
5.0 Summary
In this unit we have learnt that:
Infrared spectrum possesses large number of absorption peaks as compared to that of UV/ Visible spectrum.
the absorption bands provide a good information on the structural arrangement the molecule.
almost all organic compounds absorb radiation in this region and convert it into vibrational energy.
the absorption of I R radiation causes the bond within a molecule to either stretch or bend.
6.0 Tutor Marked Assignment (T M A)
1. A sophisticated UV/ Visible near IR instrument has a wavelength range of 185 – 3000 nm. What are its wave number and frequency ranges?
2. At what range of wave numbers do the following functional groups give signal?
(i) OH, (ii) CHO, (iii) CO and (iv) NH2
7.0 Further Reading/ References
1. Robert, M.S., Clayton, G.B. and Terence, C.M. (1974). Spectrometric Identification of Organic Compound, 3rd Edition, Wiley International.
2. Allen, M.S., Barbara, A.G. and Melvin, L.D. (2000). Microscale and Miniscale Organic Chemistry Laboratory Experiment.
3. Peter R.S. Murray (1983). Principles of Organic Chemistry.

22
Unit 4 Flame Spectroscopy
1.0 Introduction 22
2.0 Objectives 22
3.0 Definition of Flame Spectroscopy 22
3.1 Differences between Flame Emission and Flame Atomic 23 Absorption Spectroscopy.
3.2 Working Principle of Flame Emission Spectrometry 23
3.3 Working Principle of Flame Atomic Absorption Spectrophotometry 23
3.4 Interference 24
3.4.1 Types of interference: 24
3.5 Application of the Techniques 25
3.6 Sensitivity and Detection Limit of Atomic Absorption Analysis 25
4.0 Conclusion 25
5.0 Summary 26
6.0 Tutor Marked Assignment (TMA) 26
7.0 Further Readings/References 26

23
Unit 4 Flame Spectroscopy
1.0 Introduction:
If a solution containing a metallic salt, e.g. sodium chloride is aspirated into a flame for
example, acetylene burning in air, a vapour which contains atoms of the metal may be
formed. Some of these gaseous metal atoms may be raised to an energy level which is
sufficiently high to permit the emission of radiation characteristics of the metal, e.g. the
characteristics yellow colour imparted to flames by compounds of sodium. This is the
basis of flame photometry. However, a much larger number of the gaseous metal atoms
will normally remain in an unexcited state or, in other words, in the ground state. These
grounds-state atoms are capable of absorbing radiant energy of their own specific
resonance wavelength, which in general is the wavelength of the radiation that the atoms
would emit if excited from the ground state. Hence, if light of the resonance wavelength is
passed through a flame containing the atoms in question, then part of the light will be
absorbed, and the extent of absorption will be proportional to the number of ground state
atoms present in the flame. This is the underlying principle of atomic absorption
spectroscopy (AAS).
2.0 Objectives:
By the end of this unit, you should be able to:
• distinguish between flame emission and flame atomic absorption spectroscopy;
• explain the working principles of flame emission spectrometry and flame atomic absorption spectrophotometry;
• enumerate the applications of flame emission and flame atomic absorption spectroscopy; and
• mention the interferences in flame emission spectrometry and flame absorption spectrophotometer.
3.0 Definition of Flame Spectroscopy
• Flame Emission Spectroscopy is a technique in which the emission of light by
thermally excited atoms in a flame or furnace is used to measure the concentration of
atoms, and Flame Atomic Absorption Spectroscopy is a technique in which the
absorption of light by free gaseous atoms in flame or furnace is used to measure the
concentration of atoms.

24
3.1 Differences between Flame Emission and Flame Atomic Absorption Spectroscopy.
Flame emission spectroscopy is basically the same as flame atomic absorption
spectroscopy. The difference is that no light source is needed in flame emission. Some
of the atoms in the flame are promoted to excited electronic states by collision with
other atoms. The excited atoms emit their characteristic radiation as they return to their
ground state. In flame emission spectroscopy, the emission intensity at a characteristic
wavelength of an element is nearly proportional to the concentration of the element in
the sample. For both absorption and emission, standard waves are usually used to
establish the relation between signal and concentration.
3.2 Working Principle of Flame Emission Spectrometry (FES)
The solution is introduced into the flame as a fine spray. The solvent evaporates leaving
the dehydrated salt. The salt is dissociated into free gaseous atoms in the ground state.
A certain fraction of these atoms can absorb energy from the flame and be raised to an
excited electronic state. The excited levels have a short lifetime and drop back to the
ground state, emitting photons of characteristic wavelength. These can be detected with
conventional monochromator-detector set up. The intensity of emission is directly
proportional to the concentration of the analyte in solution being aspirated. A schematic
diagram of a flame emission spectrometer is given below:
3.3 Working Principle of Flame Atomic Absorption Spectrophotometry (FAAS)
The sample solution is aspirated into a flame as in flame emission spectrometry and the sample
element is converted to atomic vapour. The flame then contains atoms of that element. Some
are thermally excited by the flame, but must remain in the ground state. These ground state
atoms can absorb radiation of a particular wavelength that is produced by a special source
Monochromator
of Filter Detector Amplifier
Meter Burner
Fig 4.1: A schematic diagram of a flame emission spectrometer
Source: Modern Methods of Chemical Analysis, 2nd Edition by R, L, Pecsok et al – Page 244

25
made from that element. The wavelength of radiation given off by the sources is the same as
those absorbed by the atoms in the flame. The absorption follows Beer’s Law, that is, the
absorbance is directly proportional to the path length in the flame and to the concentration of
atomic vapour in the flame. A schematic diagram of flame atomic absorption
spectrophotometer is given below:
3.4 Interference:
By interference, we mean any effect that changes the signal when analyte concentration remains unchanged. In the measurement of atomic absorption or emission signals, interference is widespread and easy to overlook. If you are clever enough to discern that interference is occurring, it may be corrected by counteracting the source of interference.
3.4.1 Types of interference:
Spectral: refers to the overlap of analyte signal with signals due to other elements or
molecules in the sample or with signals due to flame or furnace.
The best means of dealing with overlap between lines of different elements in the sample
is to choose another wavelength for analysis.
Chemical: is caused by any component of the sample that decreases the extent of
atomization of analyte. E.g. SO42- and PO4
3- hinder the atomization of Ca2+, perhaps by
forming non volatile salts. This can be solved by adding releasing agents which are
chemicals to a sample to decrease chemical interference, eg EDTA and 8 –
hydroxyquinoline protect Ca2+ from the above interference.
Ionization: In this, the ionization of analyte atoms decreases the concentration of neutral
analyte atoms in the flame, which results in the decrease of the desired atomic signal.
Hollow
Cathode
lamp
Chopper Flame
Sample
Monochromator Detector Meter
Source
(dc supply)
Fig 4.2: A schematic diagram of flame atomic absorption spectrophotometer
Source: Modern Methods of Chemical Analysis, 2nd Edition, R, L, Pecsok et al – Page 244
26
This is solved by adding an ionization suppressor to a sample so as to decreases the extent
of ionization of analyte.
3.5 Application of the Techniques (FES and FAAS).
• They are used in many laboratories particularly whenever trace metal analyses are required.
• Environmental samples are analyzed for heavy-metals contamination. • Pharmaceutical samples are analyzed for metal impurities using the atomic
spectrometric techniques.
• The techniques are used in the steel industry to determine minor components as well as major ones.
• The techniques are used in the measurement of sodium and potassium in serum and urine in diagnostic clinical analysis.
3.6 Sensitivity and Detection Limit in Atomic Absorption Analysis
Atomic absorption spectroscopy is a sensitive technique in the analysis of metals in trace concentration.
Sensitivity is defined as that concentration of an element in aqueous solution which absorbs 1% of the incident radiation passing through a cloud of atoms being determined.
Usually, a 1% absorbance corresponds to 99% transmittance or approximately 0.004 absorbance value.
While detection limit is the concentration of an element in solution which gives a signal equal to twice the standard deviation of the series of measurements near blank level or the background signal.
Note that both the sensitivity and detection limit vary significantly with flame temperature and spectral bandwidth. For example, the sensitivity of mercury is 2.2 mg/l, while the detection limit is 0.16 mg/l. Hence, it is necessary to specify the flame type to be used in any determination.
4.0 Conclusion
It is therefore clear that both flame emission and flame absorption techniques are based on
the measurement of either emitted or absorbed radiation to estimate the amount of alkali
metals (example sodium, potassium) and trace elements (e.g. lead, iron, copper etc)
respectively.

27
5.0 Summary
In this unit, it has been learnt that:
Flame emission is concerned with the measurement of the emitted radiation by thermally excited atoms.
Flame absorption techniques involves the measurement of the absorbed radiation by free atomic species.
The instrument used in flame emission is called flame photometer while that of flame absorption is called atomic absorption spectrophotometry.
In flame emission, the emitted radiation is proportional to the concentration of the atoms in solution.
Also, the amount of absorbed radiation is proportional to the number of the absorbing atomic species.
6.0 Tutor Marked Assignment (TMA) 1. (a) Compare and contrast between flame emission and flame absorption
spectroscopy.
(b) Explain clearly why flame emission is mainly restricted to the analysis of alkali metals.
2. (a) Outline major types of interferences encountered in atomic absorption analysis and describe how such problems can be overcome.
(b) With the aid of a well-labelled schematic diagram, briefly explain the working principle of atomic absorption spectrophotometer.
7.0 Further Readings/References
1. Metcalfe, E. (1987) Atomic Spectroscopy and Emission Spectroscopy, John Wiley, UK
2. Douglas, A. S., Donald, M.W., James, F.H. and Stanley, R.C., (2004), Fundamentals of Analytical Chemistry, 8th edition
3. Christian, G.D. and O’Reilly, J.E., (1986). Instrumental Analysis, 2nd Edition.

28
Unit 5 X-Ray Spectroscopy
Page
1.0 Introduction 28
2.0 Objectives 28
3.0 Definition 28
3.1 Sources of X- rays 28
3.2 X-ray Emission Spectrometers 29
3.3 X-ray Detector 29
3.4 Non dispersive X – ray Spectrometers 30
3.4.1 Applications 30
3.5 Application of X – ray Fluorescence Analysis 31
4.0 Conclusion 32
5.0 Summary 32
6.0 Tutor Marked Assignment 32
7.0 Further Reading/Reference 32

29
Unit 5 X-Ray Spectroscopy
1.0 Introduction:
X-rays are electromagnetic radiation ranging in wavelength from about 0.1 – 25 Å. The shorter the wavelength of the x-ray, the greater the energy and its penetration power. Both light and x-rays are produced by electronic transition. The only difference is that light rays are produced by the transition of the outer electrons, while x-rays are produced by the transition of inner electrons.
X-ray spectroscopy is concerned with the measurement of the absorption of x-rays when it interacts with matter.
2.0 Objectives:
By the end of this unit, you should be able to: • define x-ray spectroscopy;
• enumerate the different sources of x-rays; • explain the components of x-ray spectrometers;
• describe the different types of x-ray detectors; and • explain the working principle involved in x-ray spectroscopy.
3.0 Definition
X-ray spectroscopy is a technique which involves the study of the interaction between x-ray radiation with matter.
3.1 Sources of X- rays:
There are three common sources of X-rays for analytical purposes:
1. Electron bombardment of a metal target.
2. Irradiation of a target (sample) with primary beam of high energy x-rays to produce a secondary beam of fluorescent x-rays.
3. Exposure of a sample to a radioactive source which generates X-rays. The X-ray emission spectra produced from these sources may be continuous or discontinuous, or a combination of both.
Characteristic line spectra are produced by an electron beam. These are obtained when a fast moving electron excites an atom to a higher energy level, then x-ray emission follows when an outer electron falls onto the vacancy in the lower energy, inner shell, giving rise to a series of lines.
An X-ray fluorescence spectrum is produced by exciting the target atom with a beam of high energy x-ray that is sufficient enough to knock out k electrons. After a short time the excited ion returns to the ground state, producing a fluorescence spectrum similar to the emission spectrum. Unlike the line emission spectra, where the lines appear as spikes

30
superimposed on the continuous background, fluorescence spectra produce only the line spectrum without the continuous background. Hence fluorescence spectra show a much greater signal – background level and are preferred for analytical work.
3.2 X-ray Emission Spectrometers:
This is a device or instrument used to measure analytically the emission of the x-ray radiation by a sample. This instrument consists of :
1. Source of x-ray radiation called x-ray cooling tube,
2. Specimen chamber
3. Collimator made of a parallel fine tube
4. Crystal analyzer
5. Auxiliary collimator
6. Detector
In this instrument, the fluorescence spectrum is conveniently generated with high energy x-rays from a Coolidge tube, even though the sample could be made the target in an x-ray tube. No suitable transparent materials are available for the fabrication of lenses, therefore x-rays are collimated by passage through a series of slits or a collection of long narrow tubes. Likewise no prisms are available to disperse X-rays, but fortunately crystals of many salts are able to disperse X-rays by diffraction and serves as excellent monochromators. Such crystals are: Topaz, LiF, NaCl, ammoniumdihydrogenphosphate (ADP), ethylene diamine d-tartrate, etc. The large single crystal analyzer (monochromator) is usually rotated on its axis to obtain the spectrum.
3.3 X-ray Detector
Three types of detectors are used to measure the intensity of an x-ray beam.
1. The simplest detector is a photographic film or plate which will darken when exposed to x-rays. The developed film is then scanned with a densitometer to record the spectrum.
2. Gas ionization detectors, such as ionization chamber, proportional counters and Geiger tubes used to measure radioactivity, are suitable for x-rays.
3. Some crystals fluoresce in the ultraviolet or visible region when exposed to x-rays.
X-ray tube Specimen Collimator Crystal
analyzer Auxiliary
collimator
Detector
Fig. 5.1: Block diagram of X-ray emission spectrometer

31
These crystals may be incorporated in a scintillation counter that also utilizes a photomultiplier tube to measure the intensity of the fluorescence.
3.4 Non dispersive X – ray Spectrometers
These are compact, relatively inexpensive and give performance comparable to crystal monochromator instruments, except for somewhat poorer resolution of closely spaced lines.
3.4.1 Applications:
All types of solids are easily handled. If necessary, the sample may be placed in a thin walled cell or deposited as a film under cellophane. All elements above calcium (Z = 20) are readily detected, those between sodium (Z = 11) and calcium with difficulty, and the lighter elements not at all. X-ray emission spectroscopy is widely used for the analysis of steels and other alloys and for the determination of heavy elements in organic samples (e.g. lead and bromine in aviation fuels). It is highly specific with limits of detectability as low as a few parts per million.
3.5 X – Ray Absorption
The absorption of X-rays is similar to the absorption of other electromagnetic energy in the ultraviolet, visible or infrared regions. The only significant difference is the energy involved. Like the emission process, the absorption process also concerned with the innermost electron. This process identifies the element regardless of its environment. Absorption of the X-ray photon is most probable.
If the energy of the incident photon just equals the energy required to eject the electron. That is, the electron leaves with essentially zero kinetic energy. For example, the absorption spectrum of lead consists of a few broad peaks with sharp discontinuities called absorption edges. Each absorption edge corresponds to the energy required to eject a K or L electron. The wavelength of an absorption edge is slightly less than that of the
X –ray
Source
Window
Inlet Outlet Sample
Holder
Window
Detector
Pulse
Height
Analyser
Fig. 5.2: Non-dispersive x-ray spectrometer

32
corresponding emission line, because the energy required to eject electron completely from the atom is greater than the energy associated with an outer electron (already in the atom) falling into the vacancy.
Beer’s law is valid for the absorption of X – rays, and is usually written as
2.303 log (Io/I) = µx
where Io is the incident intensity and I is the intensity transmitted through a sample
thickness of x cm. The proportionality constant, µ is called the linear absorption coefficient.
The broad absorption bands as seen above, leads to the interference among neighbouring heavy elements. For the most part, X-ray absorption methods are limited to samples containing a single heavy element in an organic matrix (e.g. lead in gasoline or chlorine in chloro compounds).
3.5 Application of X – ray Fluorescence Analysis
X-ray fluorescence analysis has the advantage that it is non-destructive. It can be used for the analysis of works of art, valuable coins and forensic materials. Several elements can be determined in a few minutes, on only a tiny amount of material. The major disadvantages are
(i) elements lighter than sodium cannot be determined readily,
(i) lower concentrations are not so readily determined
0.1
1.0
10
100
1000
0.1 0.2 0.5 1.0 2.0 5.0 10
K
L A
bso
rpti
on
Wavelength (Å)
Fig. 5.3: A graph of absorption of x-ray against wavelength

33
(iii) the instruments are relatively costly and
(iv) the technique deals primarily with the surface of the sample whereas the composition of the outermost layer of a material may differ from that of the internal layer.
4.0 Conclusion:
X-ray spectroscopy is a method which deals with the study of the interaction between x-ray radiation with matter. The technique is very vital for the analysis of steel and alloys as well as for the determination of heavy metal concentration in different samples.
5.0 Summary
In this unit, we have learnt that
• X-rays are electromagnetic radiation ranging from about 0.1 – 2.5Å.
• There are three main sources of x-rays for analytical purposes. • X-rays are produced by exciting the target atom with a beam of high energy that is
sufficient enough for knock the inner electrons.
• Three types of detectors are used to measure the intensity of an x-ray beam namely photographic film, gas ionization detectors and some crystals which fluoresce.
• X-ray emission is used for the analysis of steel and alloys as well for determining the concentration of heavy metals
6.0 Tutor Marked Assignment
1.(a) Distinguish clearly between x-ray emission and x-ray absorption processes
(b) Calculate the frequency in hertz and energy in joules of an x-ray photon with a wavelength of 2.35Å
2.(a) How would you differentiate between an x-ray and other types of electromagnetic radiations
(b) Briefly explain the basic application of x-ray spectroscopic analysis.
7.0 Further Reading/Reference
1.0 Christian, G.D. and O’Reilly, J.E. (1986) Instrument Analysis, 2nd Edition Boston, Allyn and Bacon
2.0 Douglas, A.S., Donald, M.W., Holler, F.J., and Stanley, R.C. (2004) Fundamentals of Analytical Chemistry
34
MODULE 2: Basic Analytical Techniques
Unit 1 - X – Ray Diffraction Method
Page
1.0 Introduction 34
2.0 Objectives 34
3.0 Definition 34
3.1 Basic Concept of X-ray Diffraction 34
3.2 Types of X-ray Diffraction Experiments 35
3.3 The Effect of X-ray Diffraction on the Arrangement of Atoms 35
3.4 Bragg’s Equation 36
3.5 Application 36
4.0 Conclusion 36
5.0 Summary 37
6.0 Tutor marked Assignment 37
7.0 Further Reading/Reference 37

35
Unit 1 X – RAY DIFFRACTION METHOD
1.0 Introduction
X – rays are electromagnetic radiation with fairly high penetration power or energy. The rays have the normal properties of waves most especially, they can be diffracted.
Diffraction process usually occurs whenever a wave meets a barrier with one or more openings of about the same size as the corresponding wavelength. Usually, the atoms or ions in crystals are arranged in such a way that they are separated from one another by a particular distance. Such distances are in the right range to cause x – rays to be diffracted. Thus, the layers of atoms in a crystal act as a diffraction grating for x-rays.
2.0 Objectives
By the end of this unit, students should be able to:
• explain the meaning of x-ray diffraction; • explain the basic concept of x-ray diffraction; • describe the different types of x-ray diffraction experiment;
• describe the arrangement of planes in crystals; and • list the application of x-ray diffraction analysis.
3.0 Definition
X-ray diffraction is a phenomenon in which waves of x-rays spread and bend as they pass through small openings or around barriers.
Note: Diffraction is more pronounced when the opening, or aperture, or the barrier is similar in size to or smaller than the wavelength of the incoming wave.
3.1 Basic Concept of X-ray Diffraction
X-rays are electromagnetic waves in which the wavelengths are comparable in size to the spacing between the atoms in crystals. When these waves pass through crystals, they diffract (i.e. spread out or bend) and form interference patterns. These patterns can be analysed to gain information about geometric structure and properties of the crystals.
The main reason why atoms are able to produce diffraction patterns is due to the number of electrons they contain. The electric field of x-rays interacts with the electron cloud around the atom. Thus, the result of many of these interactions produces the diffraction pattern. Large atoms have many electrons. As a result, they produce the strongest patterns. Small atoms, such as hydrogen, have little effect on x-ray because of the few number of electrons.

36
3.2 Types of X-ray Diffraction Experiments
The first x-ray diffraction experiments were performed by bombarding Zinc Sulphide with high energy electrons. Then the X-rays were passed through a single crystal as shown below:
The second experiment involves the use of a powdered substance which is known as Powder Method. In this experiment, crystals of sample to be analysed are ground to a fine powder and then placed in a tube made of glass which has little effect on x-rays. The sample is surrounded by a cylindrical sheet of photographic paper. The x-rays are allowed to penetrate through a small hole in the cylinder and passed into the sample, where the diffraction occurs. A piece of lead which absorbs any x-rays that pass through the sample is placed opposite the entrance hole.
As can be seen, the powdered crystals are at the centre. The reflections of the x-rays produce curved lines on the photographic paper.
Note: the above diagram represents only one set of plane in a crystal. The separation between the planes is shown as an angle to the incoming x-rays. The angle is
represented as θ. Diffractions from crystals with their sets of planes at angle θ will be arranged in form of a cone. This is because the photographic film is in the shape of a cylinder; the reflections from the crystals produce a set of curved patterns on the film.
3.3 The Effect of X-ray Diffraction on the Arrangement of Atoms
Generally, the extent of diffraction depends on the nature and arrangement of the individual atoms within a crystal. Thus, the greater the number of electrons in an atom, the stronger the diffraction or reflection. If the intensities of the individual spots on X-ray photograph can be compared accurately, then it is possible to relate them with the
X-rays
Crystal
Two pieces of photographic paper
To
absorber
Spots appear on the paper where X-
rays interfere constructively
Fig. 1.1: A simplified diagram of scattering of x-ray by a crystal
Source: Advanced Chemistry: Physical and Industrial By Philip Mathews, Pg. 170
X-rays
Powdered
crystals
To
absorber
Fig. 1.2: Diffraction by powdered crystals
Source: Advanced Chemistry: Physical and Industrial By Philip Mathews, Pg. 170

37
nature of the electron cloud around the atoms. For accurate measurement of the intensities, an instrument called diffractometer is used. Thus, the intensities of the various reflections are measured directly by electronic means rather than by photographs. When the results are computerized, electron density maps can be produced.
3.4 Bragg’s Equation
Bragg’s proposed that the formation of diffraction patterns could be explained by assuming that the X-rays were reflected from the various planes of atoms in a crystal. According to Braggs’s explanation, it is possible to consider that both diffraction and reflection are equivalent to one another. Thus, when two rays are diffracted in two different planes, the difference in the distance travelled by these rays is 2d sinθ. So, for constructive interference, we have:
nλ = 2d sinθ
where nλ is referring to the path difference in crystals, n is a whole number, λ is a wavelength. If n = 1, reflection is said to be first order. If n = 2 it is a 2nd order reflection and so on.
Example: When X-rays of wavelength 1.54x 10⁻⁸ cm passed through Sodium Chloride, an intense cone is formed at θ = 15.870. If this is taken as first order reflection then
1.54 x 10⁻⁸ cm = 2 d sin (15.870)
∴∴∴∴ .NO 9 .PQ
B JRS N.T+ 2.82 9 10&T (
Note: d is referring to the spacing between the planes.
3.5 Applications
X-ray diffraction can be used to discover the structures of crystals. The diffraction patterns of X-ray can also be used to determine the arrangement of electrons around the atoms. This provides good evidence about the shapes of molecules.
X-ray diffraction has led to the discovery of the double helical structure of DNA.
4.0 Conclusion
X-ray diffraction is thus a method which involves the spreading and bending of the rays as they pass through a small opening or barriers. This method is useful in determining the arrangement of atoms in a molecule.

38
5.0 Summary
• X-ray diffraction is a method of determining atomic and molecular structures by measuring patterns of scattered X-rays after they pass through a crystalline substance.
• The diffraction pattern can be measured using single crystal or a powder.
• X-rays are diffracted from the layers of atoms or ions in a crystal according to Bragg’s equation nλ = 2d sinθ.
• The intensity of the spots on an x-ray diffraction photographs depends on the electron densities of the atoms or ions.
6.0 Tutor marked Assignment
1. (a) What is meant by X-ray diffraction? (b) The X-ray powder pattern of Sodium Chloride shows a cone of θ = 15.380 using x-rays of wavelength 1.65 x 10⁻⁸ cm. What would be the spacing between the planes?
2. (a) Describe briefly the basic concept of x-ray diffraction. (b) With the aid of a diagram, explain how an x-ray is diffracted by a crystalline substance.
7.0 Further Reading/Reference
Philip, M. (2003) Advanced Chemistry, Physical and Industrial. Cambridge University Press.
39
Unit 2 Nuclear Magnetic Resonance (NMR) Spectroscopy
1.0 Introduction 39
2.0 Objectives 39
3.0 Definition 39 3.1 Basic Principle of NMR 39
3.2 The Source of NMR Spectra 39
3.3 NMR Spectrum 40
3.4 Pattern of the Spectrum 40
3.5 The NMR Spectrometer 41
3.6 Operational Procedure 42
3.7 Application of NMR 42
4.0 Conclusion 42
5.0 Summary 42
6.0 Tutor Marked Assignment (TMA) 43
7.0 Further Reading/References 43

40
Unit 2 Nuclear Magnetic Resonance (NMR) Spectroscopy
1.0 Introduction:
Nuclear magnetic resonance (NMR) spectroscopic technique is based on the magnetic properties of certain atomic nuclei. Magnetic properties are only exhibited by molecules that have either atoms with odd mass number or an uneven number of electrons. The nucleus of atoms with odd mass number has both spin and magnetic properties. A spinning positively charged nucleus possesses a magnetic moment which is capable of interacting with an externally applied field.
2.0 Objectives
By the end of this unit, you should be able to:
• explain the meaning and basic concept of NMR spectroscopy; • describe the source and pattern of NMR spectra;
• explain the operation of NMR spectrometer; and • describe instrumental arrangement of NMR spectrometer.
3.0 Definition Nuclear magnetic resonance (NMR) spectroscopy is a technique that is based on quantization of the spin angular momentum of the nucleus.
3.1 Basic Principle of NMR
In order to produce an NMR spectrum, the nucleus must have a net spin. For a nucleus to have spin, it must contain an odd mass number. Thus, nuclei such as 1H, 13C, 9F and 31P are suitable, whereas atoms with even mass number, like 12C and 16O are not suitable for NMR. Hydrogen is the most important element that displays NMR properties then followed by Carbon. Hence, NMR studies enable the detection of the positions of these atoms within a molecule. This is possible because the magnetic properties of various atomic nuclei differ and therefore tend to determine their energy absorption in a magnetic field, when irradiated with electromagnetic radiation in the radio frequency region.
3.2 The Source of NMR Spectra
Atomic nuclei possess charge. Some isotopes such as 1H behave like a tiny spinning magnet. This is because they possess both electric charge and mechanical spin. A spinning charge generates a magnetic field. The nuclei of certain isotopes of atoms have spin quantum number
(l) which isW
B. Therefore, they can have either of two spin states: =
B or A
B corresponding to
the magnetic moment.
In the presence of an external field, the proton can have two orientations, either aligned with the field called parallel orientation or against the field called antiparallel orientation. The parallel orientation occurs at lower energy state while antiparallel at higher energy. In addition to this, the proton will also precess around the axis of applied magnetic field. The spinning frequency of the proton doesn’t change but precessional frequency is directly proportional to

41
the strength of the external field (H0). For example, a proton exposed to an external magnetic force of 14000 gauss will precess about 60 million times per second so that V = 60 MHz
When the precessing proton is irradiated with a beam of radio frequency, the low energy nuclei may absorb this energy and move to a higher energy state. This is possible only if the precessing frequency is equal to the frequency of the radio frequency radiation i.e. if the two are in resonance. Hence, the term is called nuclear magnetic resonance.
3.3 NMR Spectrum
In NMR experiments, a solution of substance under investigation is placed in a strong magnetic field. Then the solution is irradiated with radio frequency energy of appropriate frequencies. The energy absorbed by the protons is recorded as NMR spectrum.
3.4 Pattern of the Spectrum
The environment of each nucleus in a molecule is different depending on the orbital and bonding electrons. Also the absorption of energy by the nucleus is in accordance with its environment. This enables the hydrogens in a methyl group (- CH3) to be differentiated from those in the methylene group (- CH2), and hydroxyl group (- OH).
Example, consider the different environments of the hydrogen atoms in the ethanol molecule, CH3CH2OH. The frequency at which absorption occurs for the hydrogen atoms in the – CH3 groups is different from those in the – CH2 groups which in turn differs from those in the – OH group. As a result the NMR spectrum of ethanol shows three absorption peaks, caused by the hydrogen in each of these three groups.
Precessional orbit
Spinning orbit
H0
Proton precessing in a magnetic field,
H0 = strength of the magnetic field
Fig. 2.1: Proton precessing in a magnetic field H0

42
When it is highly resolved it will be:
The spectrum is calibrated against a standard, which is usually tetramethylSilane (TMS) and then interpreted.
3.5 The NMR Spectrometer
The basic components of an NMR spectrometer are as follows:
• Strong magnet • Radio frequency oscillator
• Radio frequency receiver • Recorder with calibrator and integrator. • Sample holder
• Temperature control
-OH
-CH2
-CH3
-OH -CH2 -CH3
TMS

43
3.6 Operational Procedure
For a non viscous liquid about 0.5 ml is used, while for solid samples 10 – 50 mg/0.5 ml solvent is used. The sample solution is filtered to remove any particles. About 0.5 ml is put into a glass sample tube with internal diameter of about 0.5cm. Few drops of the internal standard added. The sample is placed in the sample holder and left for some minutes for the temperature to equilibrate. The tube is spun at 30 – 60 rps. The spectrum is recorded, and then followed by integration of the peaks.
3.7 Application of NMR The main use of this technique is in the determination of the structure of organic compounds based on the absorptions of the hydrogen nuclei. The technique is also vital in the study of reaction rates and mechanisms.
4.0 Conclusion
Nuclear magnetic resonance is mainly used to detect the hydrogen atoms in a molecule.
In a magnetic field, the proton in the nucleus of each hydrogen atom changes its spin state when it absorbs the required amount of energy. The frequency of the radiation absorbed depends on the chemical environment of the proton.
5.0 Summary
In this unit , we have learnt that:
Fig. 2.3: Schematic diagram of an NMR Spectrometer
Source: Spectrometric Identification of Organic Compounds, Robert M.S., et al (1974)
Magnet Magnet
R.F.
Transmitter R.F. Receiver
Detector Recorder
Resonance
(Field) sweep
Transmitter Coil Spinning Sample
44
• Nuclear magnetic resonance spectroscopic technique is based on the magnetic properties of certain atomic nuclei which are exhibited by molecules containing atoms with odd mass numbers.
• In the presence of external magnetic field, the proton can either be aligned with the field (parallel orientation) or against the field (anti-parallel orientation).
• NMR enables the detection of positions of atoms within a molecule
6.0 Tutor Marked Assignment (TMA)
1. Explain the basic principle behind NMR spectroscopy 2. With the aid of a good schematic diagram, describe the instrumental arrangement of
NMR spectrometer.
7.0 Further Reading/References
1. Abraham R.J., Fischer J.P. and Loftus, P. (1992) Introduction to NMR Spectroscopy, John wiley, UK
2. Robert, M.S., Clayton, G.B., and Terence, C.M., (1974). Spectrometric Identification of Organic Compounds. 3rd edition Wiley International.
3. Willard, H.H., Merritt, L.L., Dean, J.A. and Settle, F.A. (1988). Instrumental Method of Analysis, 7th Edition.
45
Unit 3 Fluorescence Spectroscopy
1.0 Introduction 45
2.0 Objectives 45
3.0 Definition 45
3.1 Basic Concept of Molecular Fluorescence 45
3.2 Relationship between Excitation and Fluorescence Spectra 46
3.3 Fluorescence and Structure 47
3.4 Effects of Temperature and Solvent 47
3.5 Effect of Concentration 48
3.6 Instrumentation 49
3.7 Applications of Fluorescence Methods 49
4.0 Conclusion 50
5.0 Summary 50
6.0 Tutor Marked Assignment 50
7.0 Further reading/Reference 50

46
Unit 3 Fluorescence Spectroscopy
1.0 Introduction
Fluorescence is a photoluminescence phenomenon in which atoms or molecules are excited by absorption of electromagnetic radiation. The excited atoms then return to the ground state, while giving up their excess energy as photons. One of the most interesting features of molecular fluorescence is its inherent sensitivity which is an advantage over the conventional absorption spectroscopy. The fluorescence method also has a larger linear concentration range than those encountered in absorption spectroscopy. Fluorescence methods are much less widely applicable than the absorption methods because of the limited number of molecules that show appreciable fluorescence.
2.0 Objectives
By the end of this unit, students should be able to:-
• explain the meaning of molecular fluorescence spectroscopy; • highlight the basic concept of molecular fluorescence; • distinguish between excitation spectra and fluorescence spectra;
• relate fluorescence with the molecular structure; • describe the effect of temperature and solvent on fluorescence; and
• illustrate the basic arrangement of fluorescence instrument.
3.0 Definition
Fluorescence is a radiation produced by an atom or molecule that has been excited by photons to a singlet and excited state.
3.1 Basic Concept of Molecular Fluorescence
When a fluorescent substance absorbs a photon or quantum of light, one of its orbital electrons is raised to a remote orbit and consequently elevates the molecule to a transient high energy excited state. As the elevated electron drops back to its original orbit, the photon activated molecule regains its original low energy ground state by emitting part of the absorbed energy as specific light wavelengths. Such an emission is called fluorescence if the emitted light has a longer wavelength than the absorbed light and its emission commences almost immediately on exposure to the exciting short wavelengths and stops within 10-8 sec of termination of the source exposure.
The energy level diagram of fluorescence radiation is shown below:
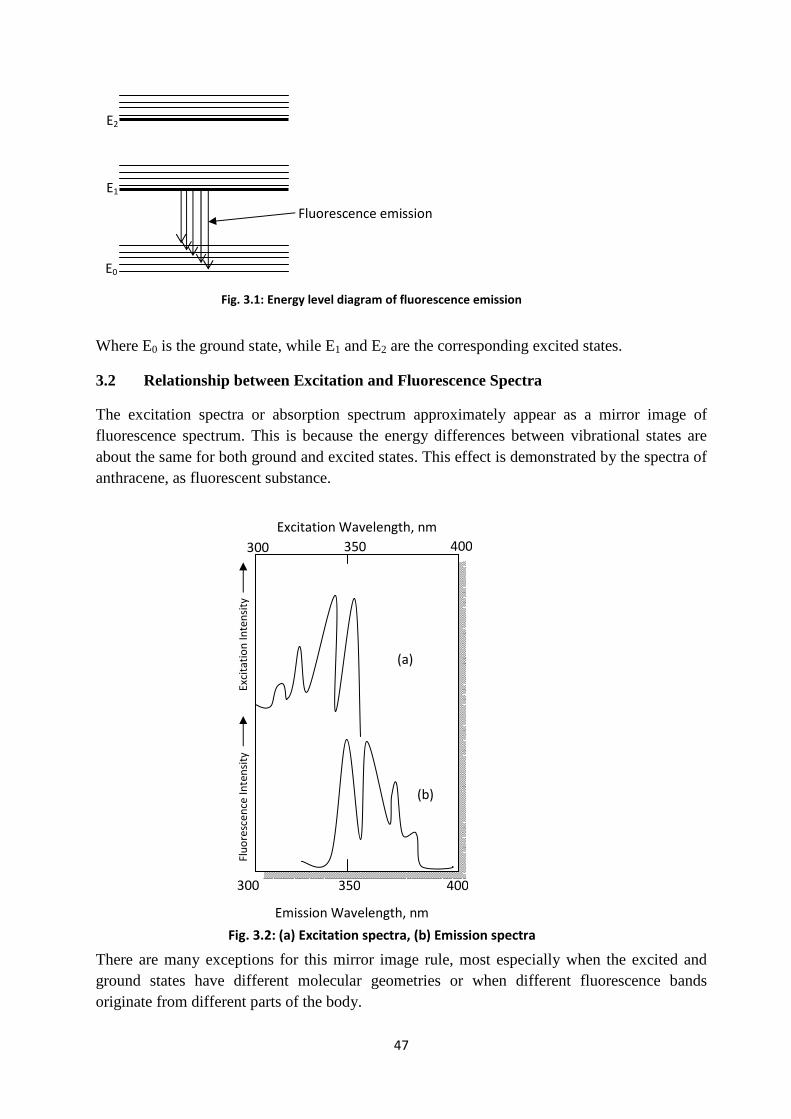
47
Where E0 is the ground state, while E1 and E2 are the corresponding excited states.
3.2 Relationship between Excitation and Fluorescence Spectra
The excitation spectra or absorption spectrum approximately appear as a mirror image of fluorescence spectrum. This is because the energy differences between vibrational states are about the same for both ground and excited states. This effect is demonstrated by the spectra of anthracene, as fluorescent substance.
There are many exceptions for this mirror image rule, most especially when the excited and ground states have different molecular geometries or when different fluorescence bands originate from different parts of the body.
E2
E1
E0
Fluorescence emission
Flu
ore
sce
nce
In
ten
sity
300
300
350 400
350 400
(a)
(b)
Exci
tati
on
In
ten
sity
Excitation Wavelength, nm
Emission Wavelength, nm
Fig. 3.1: Energy level diagram of fluorescence emission
Fig. 3.2: (a) Excitation spectra, (b) Emission spectra

48
3.3 Fluorescence and Structure
Under normal condition, compounds containing aromatic rings of benzene give the most intense and most useful molecular fluorescence emission. Certain aliphatic and alicyclic carbonyl compounds as well as the highly conjugated double bond compounds also fluoresce, but these are very few as compared to those of aromatic ring structure.
Most of the unsubstituted aromatic hydrocarbons fluoresce in solution and the efficiency increases with the number of rings and their degree of condensation. The simplest heterocyclic molecules such as pyridine, furan, thiophene and pyrole do not exhibit or possess molecular fluorescence properties. But fused ring compounds structures containing these rings often fluorescence. Also substitution on an aromatic ring causes the wavelength of absorption to shift as well as corresponding changes in the fluorescence peaks. Structural rigidity also increases the ability of a compound to fluoresce
Additionally, substitution affects the fluorescence efficiency.
Examples of fluorescent compounds include:
3.4 Effects of Temperature and Solvent
Generally, quantum efficiency of fluorescence decreases with increase in temperature. This is because the increased frequency of collision at elevated temperatures increases the probability of collisional relaxation. Also a decrease in solvent viscosity leads to similar effect.
Fig. 3.3: Typical aromatic compounds that fluoresce
N
N
Quinoline Isoquinoline
N
Indole

49
3.5 Effect of Concentration
The intensity of fluorescence radiation (F) is proportional to the radiant power of the exciting beam absorbed by the system.
ie F = K (I0 – I) (1)
Where I0 is the power of the incident beam on the solution and I is the power of the transmitted radiation, while K is a constant.
Thus, to relate F to the concentration (C) of the fluorescent substance, Beer’s law is applied as follows:
/
/. 10&XY
where ε is the molar absorptivity of the fluorescing molecule and εbc is the absorbance (A)
Generally, F α C or
F = KC
Thus, a plot of the emitted fluorescence intensity against the concentration of the solution gives a linear graph. This is because for dilute solution, Beer’s law is obeyed.
Note: At high concentration, the relationship is not linear. This effect is as a result of primary absorption in which the incident beam is absorbed so strongly that fluorescence is no longer proportional to concentration. At very high concentrations, F reaches a maximum and may even begin to decrease with increasing concentration because of secondary absorption. This process occurs due to absorption of the emitted radiation by other analyte molecules.
Fig. 3.3: A graph of emitted fluorescence intensity against the concentration of solution
Flu
ore
sce
nt
Inte
nsi
ty
Concentration

50
3.6 Instrumentation
Different types of fluorescence instruments are available. The optical diagram of the typical instrument for fluorescence measurement is shown below:
The source of radiation is a mercury lamp. The emission is measured at right angle to the mercury arc lamp source. Fluorescence radiation is emitted in all direction and the 90 degrees geometry avoids the detector viewing the source. The instrument uses two grating monochromators which allow the scanning of excitation spectra and emission spectra (emission wavelength scanned at a fixed excitation wavelength). It also synchronizes the two spectra together.
3.7 Applications of Fluorescence Methods
Fluorescence methods are used to study chemical equilibria and kinetics in the same way as absorption spectrophotometry is used. It is often possible to study chemical reactions at lower concentrations due to higher sensitivity of fluorescence technique. Fluorescent probes or tags can be attached covalently to specific site in molecules such as proteins for easy detection and monitoring. These tags can also be used to provide information about energy transfer processes.
Also, quantitative fluorescence methods have been developed for the analysis of inorganic, organic and biochemical molecules. The inorganic fluorescence methods could be done directly or indirectly. The direct methods are based on the reaction of the analyte with a
Source
M
Sample
cell
Readout
device
Transducer
Excitation monochromator
Excitation monochromator
Fig. 3.4: A typical Fluorescence Spectrometer
Source: Fundamentals of Analytical Chemistry by Skoog et al (2004).

51
complexing agent to form a fluorescent complex, while the indirect method depends on the decrease in fluorescence as a result of interaction of the analyte with a fluorescent agent.
With respect to organic and biochemical applications, fluorescence method is used to determine amino acids, proteins, coenzymes, vitamins, nucleic acids, alkaloid, flavonoids, steroids and many other metabolite. Also, fluorescence is widely used as a detection technique for liquid chromatographic methods, for fluoro-analysis methods and electrophoresis.
4.0 Conclusion
From what we have learnt, it is clear that fluorescence is a radiation produced by an atom or a molecule that has been excited by photons to a singlet state and the fluorescent compounds contain multiple conjugated bond systems or aromatic rings. The technique is very important for both qualitative and quantitative analysis.
5.0 Summary
In this unit, we have learnt that:
• Molecular fluorescence involves the emission of radiation as excited electrons return to the ground state.
• The wavelengths of the radiations emitted are different from those absorbed and useful in the identification of a molecule.
• The intensity of the emitted radiation can be used in quantitative method while the wavelength of maximum emission can be used qualitatively.
• Fluorescent compounds contain multiple conjugated bond systems or aromatic rings with associated delocalized electrons.
• Most molecules that fluoresce have rigid planer structures.
6.0 Tutor Marked Assignment
1. (a) How would you distinguish between excitation and fluorescence spectra? (b) Why do some absorbing compounds fluoresce while others do not?
2. (a) Explain why molecular fluorescence usually occurs at a longer wavelength than the exciting radiation? (b) Describe the components of a fluorometer and state why the instrument is double-beam in design.
7.0 Further reading/Reference
1. Willard, H.H., Merrit, L.L., Dean, J.A. and Settle, F.A. (1988) Instrumental Method of Analysis, 7th Edition Wadsworth Publishing, CO., USA
2. Douglas, A.S., Donald, M.W.,James, F.H., and Stanley, R.H. (2004). Fundamentals of Analytical Chemistry, 8th Edition.

52
Unit 4 Fluorimetry 1.0 Introduction 52
2.0 Objectives 52
3.0 Definition 52
3.1 Mode of Operation of the Instrument 52
3.2 Quenching 53
3.3 Sensitivity 53
3.4 Applications: 53
3.5 Precautions for usage 54
4.0 Conclusion 54
5.0 Summary 54
6.0 Tutor marked Assignment (TMA) 54
7.0 Further Reading/References 55
53
Unit 4 Fluorimetry
1.0 Introduction:
Molecules of some substances under certain conditions absorb radiant energy and after an
interval of 10-7 or 10-8 seconds, the excited electrons return to a lower energy level, and the
energy being emitted as visible light. This radiation is termed fluorescence. Under the
conditions of biological and biochemical analysis, this energy has a greater wavelength that is
lower energy than the exciting radiation. In fluorimetry, there is absorption and emission.
2.0 Objectives:
By the end of this unit, the student should be able to:
• describe a Fluorimeter;
• explain the mode of operation of the instrument;
• explain quenching and sensitivity of the instrument;
• state the application of a Fluorimeter; and
• enumerate the various precautionary measures to be observed when using Fluorimeters.
3.0 Definition:
An instrument that is designed to measure the intensity of fluorescence is called Fluorimeter.
3.1 Mode of Operation of the Instrument
In photoelectric Fluorimeters, a beam of ultraviolet light (< 400nm) of regulated uniform intensity from a mercury vapour lamp passes through a diaphragm to fall on either an incident wavelength selector or an exciter filter. This filter or selector transmits only such UV wavelengths which are close to the absorption maximum of the fluorescent substance to be estimated, and cuts off all other wavelength including those above 400nm. The UV wavelengths emerging from this selector or filter are focused by a lens system to the test solution in a transparent cuvettes or sample cell. The fluorescent solute in the solution emits long wavelengths of visible fluorescent light on absorbing UV rays. To avoid unabsorbed and undeflected UV rays being transmitted through the solution, long wavelength fluorescent rays, emerging from the sample cell at only an angle to the path of the exciting beam, are made to pass through an emitted wavelength selector or a barrier filter. This filter cuts off any UV ray which might have been deflected from the sample cell, and transmits only the specific long wavelengths of fluorescent rays to a lens system. The system focuses the fluorescent wavelengths to a photo cell which consequently generates a current in direct proportion to the intensity of fluorescence. This current pulse is amplified and measured.

54
A schematic diagram of a fluorometer is shown below:
3.2 Quenching:
When there is a reduction in the intensity of fluorescent due to the specific effects of constituents of the solution itself quenching occurs. For example, phosphate buffers quench fluorescence. When the fluorescent substance is responsible for the absorption of fluorescence, it is known as self-quenching. Quenching can also be caused by the transfer of energy by the collision of the excited molecules of the fluorescent material with molecules of solvents or solute.
3.3 Sensitivity:
For very low concentration of substances, the sensitivity of fluorescence is proportional to concentration, provided the exciting energy remains constant. At higher concentrations of solutions, this linear relationship tends to be destroyed.
Fluorescence is sensitive to such variables as solvent, pH, temperature, impurities and the presence of ions such as CNS-, I-, Br-, Cl-, which have all marked quenching effect, e.g. Cl- quenches the fluorescence of quinine.
Nevertheless, with more sensitive equipment, fluorimetric procedures can be more sensitive than spectrophotometric methods by an order of magnitude of at least 103 to 104.
3.4 Applications:
The instrument can be used for the analysis of:
1. Thiamine, vit B1 and Riboflavin 2. Ruthenium in the presence of other platinum metals. 3. Quinine in dilute sulphuric acid solution. 4. Riboflavin (vitamin B2) using their native fluorescence. 5. Histamine and histidine by reacting with o-phthalaldehyde. 6. Magnesium by reacting with 8-hydroxyquinoline and sulphuric acid.
Filter
UV Source
Sample
Filter 2
Detector
Fig. 4.1 A Simple Fluorimeter design
Source: Analytical Chemistry, Sixth Edition by Gary D. Christian

55
7. Amphetamines by reacting with formaldehyde and acetyl acetone.
3.5 Precautions for usage:
For practical purposes, the following precautions must be observed when using Fluorimeters:
1. The solvent used must be non-fluorescent and must not absorb radiation in the spectral regions used in the particular assay.
2. Pyrex or quartz cuvettes must be used because of the slight fluorescence or ordinary glass.
3. Filters should be checked for contribution to blank readings. 4. Stopcock and other greases give rise to problems and should be avoided. 5. pH and temperature must be carefully controlled. 6. Solutions must be free from gas bubbles, suspended solids and turbidity. 7. Exciting radiant energy sometimes done slowly changes the colour or intensity of
fluorescence reading and hence must be made rapidly. 8. Internal standards should be used to detect quenching or alteration in colour of
fluorescence – comparison should be made between an internal and external solution.
4.0 Conclusion
Fluorimetry is a method of analysis which measures the intensity of fluorescence that can be used in estimating the concentration of a fluorescent substance in solution.
5.0 Summary
In this unit we learned that:
• Fluorometry involves the measurement of the intensity of fluorescence radiation emitted by fluorescent substance.
• Fluorimeter is an instrument used to measure the intensity of the emitted fluorescence radiation from a given sample.
• Fluorometer consists of light source, filters and detector.
• Fluorimetric method can be used to analyse a variety of substances such as thiamine, riboflavin, quinine, etc.
6.0 Tutor marked Assignment (TMA)
1. What is meant by each of the following: i. Fluorimetry
ii. Fluorescent filter. iii. Quenching
2. (a) With the aid of a suitable schematic diagram, describe the mode of operation of a fluorimeter.

56
(b) Explain why pyrex or quartz cell must be used instead of a normal glass while measuring the emitted fluorescent radiation from a given sample.
7.0 Further Reading/References
1. Harris, D.A. and Bashford, C.L. (1987) Spectroscopy and Spectrofluorimetry – A Practical Approach, IRL Press, UK
2. Christian, G.D. and O’Reilly, J.E., (1986). Instrumental Analysis, 2nd Edition. Boston, Allyn and Bacon.
57
Unit 5: Fourier Transform Spectroscopy (Interferometry)
1.0 Introduction 57
2.0 Objectives 57
3.0 Definition 57
3.1 Interferometer 57
3.2 Instrumentation 58
3.3 Sample Application 59
3.4 Advantages of FTIR 59
4.0 Conclusion 59
5.0 Summary 59
6.0 Tutor Marked Assignment 59
7.0 Further Reading/References 59

58
Unit 5: Fourier Transform Spectroscopy
1.0 Introduction:
Fourier transform spectroscopy is a non dispersive technique which uses an array of detectors to measure the entire spectrum at once or simultaneously. The spectrum is spread into its individual component wavelengths and each small band of wavelength is directed onto one detector. Thus, Fourier analysis is a mathematical way to decompose a signal into its component wavelengths that can be determined at once.
2.0 Objectives:
By the end of this unit, you should be able to:
• explain the meaning of interferometry; • Describe the instrumental design of an interferometer;
• State the application of interferometry; and • List the advantages of FTIR in relation to interferometer device.
3.0 Definition:
The Fourier transform infrared (FTIR) instruments do not contain any dispersing device and all wavelengths are detected and measured simultaneously. In this case, instead of monochromator, a device called interferometer is used to produce interference patterns that contain the infrared spectral information. Hence, the technique is called interferometry.
3.1 Interferometer:
Interferometer is a non-dispersive device that obtains spectral information through constructive and destructive interference used in Fourier Transform Infrared instrument.
An interferometer is the heart of a FTIR spectrophotometer. It consists of a collimated light source, a stationary mirror at the top, a movable mirror at the right, a beam splitter and a detector. The light source may be a laser or sodium arc lamp. The mirrors are precision polished ultra-flat glass with a reflecting coating vapour deposited on their surface. The movable mirror is mounted on a very precise linear bearing that allows it to move along the direction of the light beam while remaining perpendicular to it.
The beam splitter is the key heart to the operation of the interferometer. It allows a fraction of the light to pass through the mirror and reflect the other fraction or part. The device works in both directions, so that light falling on either side of the beam splitter is partially reflected and partially transmitted.

59
3.2 Instrumentation:
The instrumental representation of an interferometer is shown below:
As seen in the above diagram, a beam from the light source falls on the splitter which then splits the beam into two parts. The two beams travel in separate paths and converge on the detector. The two beams (OS and OM) converge in the same region of space and form an interference pattern. As the movable mirror in the right is moved, the interference pattern shifts across the detector and modulates the optical signal. The resulting reference interferogram which is a plot of output light intensity against the wave number (1/λ) is recorded. This is used as a measure of the power of the incident beam at all wavelengths. An absorbing sample is then inserted into the beam, and a sample interferogram is recorded. The two interferograms are then used to compute the absorption spectrum of the sample.
Example,
Stationary mirror
Beam splitter Movable
mirror
Sample
position
Detector
Source
Fig. 5.1 A schematic diagram of interferometer
S
O M
Inte
nsi
ty
Wave number (1/λλλλ) cm-1
Fig: 5.2 an interferogram of the light source

60
3.3 Sample Application
In a Fourier spectrophotometer, the sample in a cell is usually placed between the output of the interferometer and the detector. As the light is passing through the sample, it then absorbs certain wavelengths of the incident light. Since the sample absorbs certain wavelengths of light, the interferogram contains the spectrum of the source minus the spectrum of the sample. An interferogram of a reference sample (blank) containing only the solvent is first recorded and transformed into a sample spectrum. The two interferograms are then used to compute the absorption spectrum of the sample.
3.4 Advantages of FTIR
The FTIR spectrophotometer is a very sophisticated instrument. It has advantages of : Speed, frequency accuracy, more efficient use of radiation by the interferometer, improved signal, a built data handling capabilities.
These advantages cause the rapid displacement of traditional dispersion instruments.
4.0 Conclusion
Interferometry is a technique which uses interferometer instead of a monochromator to produce an interference pattern that contains the infra red spectral information.
5.0 Summary
In this unit, we have learnt that:
• Interferometry involves the use of a device called interferometer.
• Interferometer is the heart of FTIR instrument. • An interferometer consists of a beam splitter, a stationary mirror and a movable mirror.
Reflection of the light from the two mirrors creates an interferogram. • Fourier analysis is a mathematical way to decompose a signal into its component
wavelengths.
6.0 Tutor Marked Assignment
1. (a) Explain briefly, the modifications made on Fourier Transform Infra-Red Spectrometry. (b) A typical FTIR spectrometer covers a wavelength range from 3 - 15µm. How would you express this in: (i) wave number and (ii) hertz?
2. How would you distinguish an infra red spectrometer from FTIR spectrometer.
7.0 Further Reading/References
1. Daniel, C.H. (1982). Qualitative chemical Analysis, 2nd Edition
2. Douglas, A.S., Donald, M.U., James, F.H. and Stanley, .C. (2004). Fundamentals of Analytical Chemistry, 8th Edition
61
Module 3: Electroanalytical and Other Optical Techniques
Unit 1 Polarography
Page
1.0 Introduction 61
2.0 Objectives 61
3.0 Definition 61
3.1 Mode of Operation of a Simple Polarograph 61
3.2 Shape of a Polarogram 62
3.3 Applications of Polarography 63
4.0 Conclusion 63
5.0 Summary 63
6.0 Tutor Marked Assignment (TMA) 64
7.0 Further Reading/References 64

62
Unit 1 Polarography
1.0 Introduction
Voltametry encompasses a sophisticated collection of analytical techniques in which the
relationship between voltage and current is observed during electrochemical processes. The
major subdivision of voltametry is polarography, a sensitive electro-analytical technique that is
especially useful for trace analysis. The second major classification within voltametry is
amperometry.
In polarography, the current flowing through the cell is measured as a function of the potential
of the working electrode. Usually, this current is proportional to the concentration of the
analyte. The most sensitive polarographic procedures have a detection limit near 10-9 M and a
precision around 5%. Less sensitive polarographic methods operating with ~10-3 M analyte are
capable of a precision of a few tenths of percent, though 2.3% is most common.
2.0 Objectives
By the end of this unit, you should be able to
• define polarography; • explain the mode of operation of a simple polarograph;
• describe the shape of a polarogram; and • enumerate the applications of polarography.
3.0 Definition
Polarography is a technique in which the current flowing into an electrolysis cell is measured
as a function of the applied potential.
3.1 Mode of Operation of a Simple Polarograph
Apparatus for a direct-current polarograph experiment is shown below. The mercury pool
provides a large area anode with little polarization. The attached mercury drop is the cathode
and the steady detachment of the drops minimizes contamination. The nitrogen keeps the
solution free from oxygen which affects the performance adversely. Potassium chloride
electrolyte is used to increase the conductivity because of large negative discharge potential of
the potassium ion.
The applied voltage is gradually increased and the variation in current is measured. The
potential of the cathode is determined by inserting into the solution, a standard electrode. Thus:

63
3.2 Shape of a Polarogram
A graph of current versus potential in a polarographic experiment is called a polarogram, and for a solution containing only one dischargeable species, Mn+, it has the form shown below:
Theoretically, the current should be zero when the voltage is insufficient to produce the
discharge potential in the cathode, but in practice, there will be some small current. When the
Nitrogen
Saturated solution
of KCl
Platinum
Mercury
Sintered glass
Variable voltage
Mercury drop
Fig: 1.0 A Polarography Apparatus
Source: Advances in Analytical Methods by G.R. Palin, Page 207
Cu
rre
nt
Half wave
Potential
Voltage
P
ID (Diffusion Current)
Fig. 1.1 A Polarogram
Source: Quantitative Chemical Analysis 2nd
Edition by Daniel C. Harris, Page 454

64
discharge potential of the ion Mn+ is reached, the current increases rapidly as the voltage is
increased until the concentration polarization becomes so great that the limiting current is
attained. Any further increase in the applied voltage will produce little or no charge in the
current. It has been shown that the half wave potential P is independent of the ionic
concentration, and for a given potassium chloride concentration, there is a fixed value of P
which corresponds to a given ionic species. This enables qualitative determinations to be
carried out. ID is known as the limiting diffusion current which is dependent on the
concentration of Mn+. Hence, quantitative determinations can also be possible.
3.3 Applications of Polarography
• The technique is effective in the qualitative identification of an unknown.
• Polarographic technique can be used to study the rates of chemical reactions that
compete with the electrode reactions.
• It can also be used to determine more than one ionic species in solution; but this
requires a series of steps of the same form which occurs when the discharge potential of
each species is reached.
• The technique is also effective in the determination of very dilute solutions.
4.0 Conclusion
Polarography is a method in which the amount of current flowing into an electrolytic cell is
measure as a function of the applied potential.
5.0 Summary
In this unit, we have learnt that:-
Polarographic method measures the amount of current flowing through an electrolytic
cell.
The amount of current is directly proportional to the concentration of the analyte.
A plot of current against the electrical potential produces a polarogram.
Polarographic method is used in qualitative identification of compounds and to study
the kinetic parameters of some chemical reactions.

65
6.0 Tutor Marked Assignment (TMA)
1. (a) Define the term polarography.
(b) With the aid of a diagram, describe the mode of operation of typical polarographic
equipment.
2. (a) State the application of polarography in analytical research.
(b) Give an illustration of a polarogram and explain the meanings of (i) halfway
potential, (ii) diffusion current.
7.0 Further Reading/References
1. Koryata J. (1993) Ions, Electrodes and Membrane 2nd Editon Wiley-Liss Inc., USA
2. A.J. Bard & L.R. Faulkner (1980). Electrochemical Methods, New York, Wiley, UK

66
Unit 2: Coulometry
1.0 Introduction 66
2.0 Objectives 66
3.0 Definition 66
3.1 A Typical Example of Coulometric Process 66
3.2 Types of Coulometry 67
3.2.1 Constant Current Coulometry 67
3.2.2 Controlled Potential Coulometry (Potentiostatic) 67
3.3 A Typical example of Coulometric Calculations 68
3.4 Current Efficiency requirements 68
3.5 Instrumentation 69
3.6 Advantages of Coulometric Titration Over the Conventional Titrations 70
3.7 Applications 71
4.0 Conclusion 71
5.0 Summary 71
6.0 Tutor Marked Assignment 73
7.0 Further Reading/References. 73

67
Unit 2: Coulometry
1.0 Introduction
Coulometry is an electro-analytical method of analysis. Faraday’s laws of electrolysis form the
basis of quantitative coulometric analysis. You should recall that according to this law: The
weight of substance liberated during electrolysis is directly proportional to the quantity of
electricity passed. Also the weight of substances liberated by the same quantity of electricity is
in direct proportion to their equivalent weights. Coulometric methods are performed by
measuring the quantity of electrical charge required to convert a sample of analyte
quantitatively to a different oxidation state.
2.0 Objectives
By the end of this unit, the students should be able to:
• define coulometry;
• describe the different types of coulometric analysis;
• itemise the steps involved in coulometric titrations; and
• Carry out some coulometric calculations.
3.0 Definition
Coulometry is an electrolytic method of analysis that is based on measuring the number of
electrons used in a chemical reaction.
3.1 A Typical Example of Coulometric Process
In coulometry, cyclohexene may be titrated with Br2 which is generated by electrolytic
oxidation of Bromide (Br-).
i.e. 2 Br- → Br2 + 2 e-
Then;
In the above reactions, enough of bromine is generated to react with all of the cyclohexene.
Thus, the number of moles of electrons liberated is twice that of Br2 and hence, twice the moles
of cyclohexene.
Br2 +
Br
Br Cyclohexene 1,2 – dibromo-
cyclohexane

68
In coulometry, the reaction between Br2 and cyclohexene is carried out using a coulometric
apparatus. During the process, enough Br2 is generated by the platinum electrode positioned at
the left side. The generated Br2 then reacts with cyclohexene. If all of the cyclohexene has been
reacted, the concentration of Br2 in the solution suddenly rises which indicates the end of the
reaction.
The rise in concentration of Br2 is detected by measuring the electric current that is applied in
the process. Thus, a small voltage is applied between the two electrodes but this is not enough
to electrolyze the solute. When the concentration of Br2 suddenly increases, a current flows as a
result of the reaction taking place in both cathode and anode. Thus, the sudden increase in
current is taken as the end point of cyclohexene titration.
3.2 Types of Coulometry
There are two common types of coulometric methods namely: Controlled potential and Constant current.
3.2.1 Constant Current Coulometry
In this type of analysis, a constant current is applied whenever the power is connected to the
electrodes. This method is called coulometric titration. If the current is known, the time
required for complete reaction is measured in order to count the coulombs.
i.e. q = It (1)
The power supply is built to automatically measure the time of operation. When the current is
multiplied by the time taken, the number of coulombs used in the titration is obtained.
3.2.2 Controlled Potential Coulometry (Potentiostatic)
In this method, the potential of the working electrode is kept at constant level in such a way
that only the analyte is responsible for conducting charge across the electrode and solution
interface. The charge required to transform the analyte into product is determined by recording
and integrating the current against time curve during the electrolytic process.
i.e. Z [ /;
. (2)
In this case the current is initially high and decreases exponentially as the concentration of
the analyte sample decreases. Thus, the current decreases with time. Also the power supply
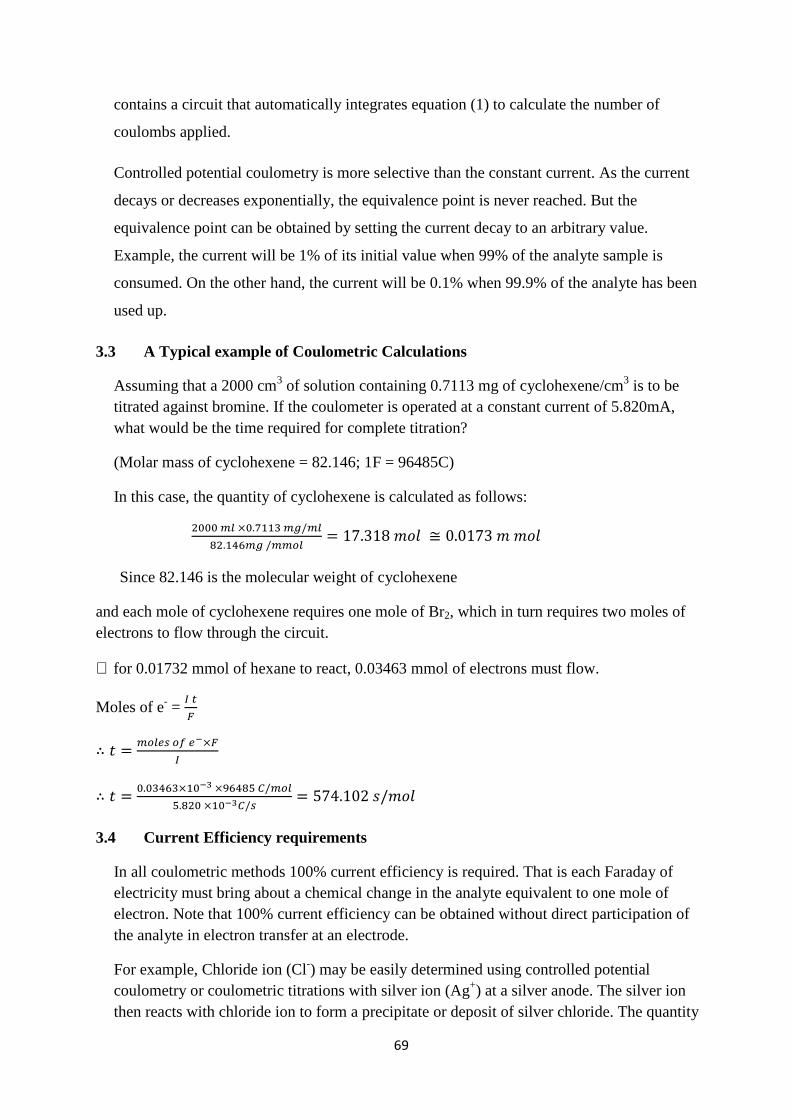
69
contains a circuit that automatically integrates equation (1) to calculate the number of
coulombs applied.
Controlled potential coulometry is more selective than the constant current. As the current
decays or decreases exponentially, the equivalence point is never reached. But the
equivalence point can be obtained by setting the current decay to an arbitrary value.
Example, the current will be 1% of its initial value when 99% of the analyte sample is
consumed. On the other hand, the current will be 0.1% when 99.9% of the analyte has been
used up.
3.3 A Typical example of Coulometric Calculations
Assuming that a 2000 cm3 of solution containing 0.7113 mg of cyclohexene/cm3 is to be titrated against bromine. If the coulometer is operated at a constant current of 5.820mA, what would be the time required for complete titration?
(Molar mass of cyclohexene = 82.146; 1F = 96485C)
In this case, the quantity of cyclohexene is calculated as follows:
B... \] 9..+' \^/\]
TB.O`\^ /\\a] 17.318 ( d 0.0173 ( (
Since 82.146 is the molecular weight of cyclohexene
and each mole of cyclohexene requires one mole of Br2, which in turn requires two moles of electrons to flow through the circuit.
∴ for 0.01732 mmol of hexane to react, 0.03463 mmol of electrons must flow.
Moles of e- = 6 ;
e
f \a]KJ ag KP9e
6
f ...'O`'9.Ph 9,`OTN i/\a]
N.TB. 9.Phi/J 574.102 /(
3.4 Current Efficiency requirements
In all coulometric methods 100% current efficiency is required. That is each Faraday of electricity must bring about a chemical change in the analyte equivalent to one mole of electron. Note that 100% current efficiency can be obtained without direct participation of the analyte in electron transfer at an electrode.
For example, Chloride ion (Cl-) may be easily determined using controlled potential coulometry or coulometric titrations with silver ion (Ag+) at a silver anode. The silver ion then reacts with chloride ion to form a precipitate or deposit of silver chloride. The quantity
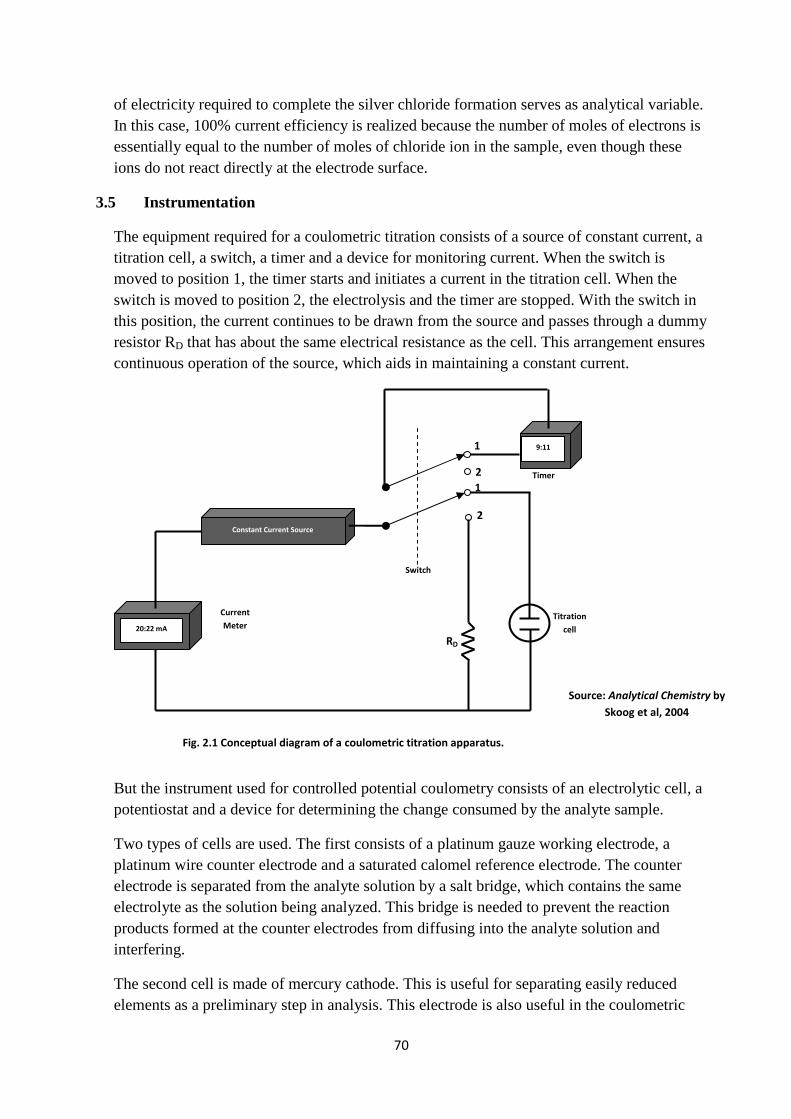
70
of electricity required to complete the silver chloride formation serves as analytical variable. In this case, 100% current efficiency is realized because the number of moles of electrons is essentially equal to the number of moles of chloride ion in the sample, even though these ions do not react directly at the electrode surface.
3.5 Instrumentation
The equipment required for a coulometric titration consists of a source of constant current, a titration cell, a switch, a timer and a device for monitoring current. When the switch is moved to position 1, the timer starts and initiates a current in the titration cell. When the switch is moved to position 2, the electrolysis and the timer are stopped. With the switch in this position, the current continues to be drawn from the source and passes through a dummy resistor RD that has about the same electrical resistance as the cell. This arrangement ensures continuous operation of the source, which aids in maintaining a constant current.
But the instrument used for controlled potential coulometry consists of an electrolytic cell, a potentiostat and a device for determining the change consumed by the analyte sample.
Two types of cells are used. The first consists of a platinum gauze working electrode, a platinum wire counter electrode and a saturated calomel reference electrode. The counter electrode is separated from the analyte solution by a salt bridge, which contains the same electrolyte as the solution being analyzed. This bridge is needed to prevent the reaction products formed at the counter electrodes from diffusing into the analyte solution and interfering.
The second cell is made of mercury cathode. This is useful for separating easily reduced elements as a preliminary step in analysis. This electrode is also useful in the coulometric
Switch
1
2
1
2
9:11
20:22 mA
Constant Current Source
RD
Titration
cell
Current
Meter
Timer
Fig. 2.1 Conceptual diagram of a coulometric titration apparatus.
Source: Analytical Chemistry by
Skoog et al, 2004

71
determination of several metallic cations that form metals that are soluble in mercury. In this application, there is only little evolution of H2 gas even at high applied potentials.
3.6 Advantages of Coulometric Titration Over the Conventional Titrations
Coulometric titration has a lot of advantages over a normal volumetric titration. Among the advantages is the elimination of the problems associated with the preparation, standardization and storage of standard solutions. This advantage is particularly significant with reagents that are not stable such as chlorine, bromine, etc. Another advantage is that coulometric method excels when small amounts of analyte is to be used in the titration. But with conventional titration, it is inaccurate and inconvenient to use very dilute solutions and small volumes.
In coulometric procedure, a single constant current source provides reagents for precipitation, complex formation, and neutralization or redox titrations. But this is not possible in normal volumetric titration. Finally coulometric titrations are more versatile and more accurate than the conventional volumetric process.
3.7 Application
Coulometric methods have been used to determine several elements in inorganic compounds and synthesize organic compounds.
But generally, coulometric titration is applied in:
• Neutralization titration
• Precipitation and complex formation reactions e.g coulometric titration with EDTA are carried out by reduction of the ammine mercury (II) EDTA chelate at mercury cathode.
• Oxidation – reduction (redox) titration – coulometric titrations have been applied for many redox titrations
4.0 Conclusion
Coulometry is a method of analysis which is based on measuring the number of electrons used in chemical reactions.
5.0 Summary
In this unit, we have learnt that:
• Coulometry comprises a series of analytical techniques in which the quantity of electricity needed to carry out a chemical reaction is used to measure the quantity of analyte present.
• Coulometric titrations are carried out at a constant current. • Controlled potential coulometry is operated at constant potential and is more selective
than coulometric titration.

72
• Measuring the electrons consumed in the reaction is achieved by electronic configuration of the current versus time curve.
6.0 Tutor Marked Assignment
1. (a) Differentiate between controlled – potential coulometry and constant – current coulometry. (b) Why is it necessary to isolate the working electrode from the counter electrode in a controlled – potential coulometric analysis?
2. In a certain coulometric experiment, 5.32 mA of current is passed for 964s for complete reaction of a 5.00 ml of a liquid of uknown cyclohexene solution (a) How many moles of electrons passed through the cell? (b) How many moles of cyclohexene reacted?
7.0 Further Reading/References.
1. Koryata J. (1993) Ions, Electrodes and Membranes, 2nd Edition, Willey – Liss Inc., USA
2. Koryata J., Dvorak and L. Kavan (1996) Principles of Electrochemistry, John Wiley, UK
3. Eggins, B.R. (1996) Biosensors, John Wiley, UK
73
Unit 3 Conductimetry
1.0 Introduction 73
2.0 Objectives 73
3.0 Definition 73
3.1 Basic Concepts of Conductance Analysis 73
3.1.1 Specific and Molar Conductance 74
3.2 Conductimetric Measurements 74
3.3 Experimental Precautions 75
3.4 Applications 75
4.0 Conclusion 77
5.0 Summary 77
6.0 Tutor Marked Assignment 77
7.0 Further reading/References 77

74
Unit 3 Conductimetry
1.0 Introduction
Conductimetry analysis involves the application of electrolytic cell to measure the conductance of a given solution. This is based on the electrical properties of ions present in the solution to be analyzed. When a current is passed through a solution containing negative and positive ions, such ions move towards the electrodes carrying the current into the solution. Positively charged ions migrate towards the cathode and negative ions towards the anode. But, the rate at which the ions move is influenced by a lot of factors such as the degree of the solvation of the ions, temperature and viscosity of the medium. Since the movement of ions is responsible for the conduction of electricity through the solution, the extent of flow of current is dependent on the number of ions per unit volume of solution (concentration), the ionic charge and the rate of migration towards the electrodes. Also, the extent of conduction depends on the potential difference across the solution.
2.0 Objectives
By the end of this unit, students should be able to:
• define conductimetric analysis;
• explain the principle of conductimetric analysis; and • list the basic applications of conductimetric analysis.
3.0 Definition
Conductimetry is an electrolytic technique that is used to measure the conductance of sample solution based on the electrical properties of the constituent ions.
3.1 Basic Concepts of Conductance Analysis
The current passing between the two electrodes is carried by the ions in the solution and is related to the number of ions present. This is as a result of both the molar concentration of the compound and its extent of ionization. The anions donate electrons to the anode while the cations accepts electron from the cathode. It is this transfer of electrons that determines the amount of current flowing and the contribution of each ionic specie is determined by its ionic mobility.
The current flowing through a conductor is defined by Ohm’s law which states that the electric current flowing through a conductor is directly proportional to the applied voltage and inversely proportional to the resistance of the conductor.
i.e. Current (I) = klmnopq "k
rqstsnouvq"r
But in terms of conductance (C),
I = C X V

75
3.1.1 Specific and Molar Conductance
The specific conductance (K) of a given solution is defined as the conductance per centimeter of a solution that has a cross-sectional area of 1 cm2, and is measured in Scm-1
(or in non SI unit of Ω-1cm-1).
The molar conductance (Λ) is the specific conductance of a solution corrected for the concentration of ions in the solution.
That is, Molar Conductance = Conductance x Volume of solution which contains 1 gram mole
NOTE: The value of conductance decreases as the concentration of the solution decreases, but the value for molar conductance will increase. This is due to increased dissociation of molecules in dilute solutions.
3.2 Conductimetric Measurements
The basic instrument used for conductimetric measurements is called conductivity meter. This instrument has a basic arrangement of a Wheatstone bridge. In this case, the conductance of solution is measured using an alternating current rather than a direct one. This is to prevent the accumulation of charges at the electrodes which would change the composition of the solution at the electrodes and introduce substantial errors in the measurement.
The basic circuit diagram of the instrument is given below:
With fixed resistance, R1 and R2, the variable resistance RV is adjusted until current just flows through the galvanometer. Under these conditions,
R1 x RV = Rcell x R2
This gives a value for resistance of the cell which can be converted to conductance by calculating the reciprocal.
The electrodes conductivity cells are usually made of platinum coated with platinum black with a known area. Despite that in many cells the distance between the electrodes is
R1
R2 Ry
Cell
Fig 3.1 : A Wheatstone
bridge
76
adjustable, but in any experiment it must be held constant and for many calculations the precise value is required. The cells must be thermostatically controlled because any changes in temperature will cause significance alteration of conductivity values.
3.3 Experimental Precautions
• Solvent purity The presence of ions in the water used in conductivity measurement can lead to serious errors particularly in the analysis of a very dilute solution where the measured conductance may be of nearly the same magnitude as the conductance of the dissolved impurities. Thus, in conductivity measurement de-ionized water has a specific conductance (conductivity) of 5.5 x 10⁻⁸ Ω-1cm-1
• Titrant Volume During conductimetric titrations, the concentrations of the conducting species should not change significantly; otherwise errors will be introduced into the measurements. Hence, the concentration of the titrants should be about 10 times that of the solution in the conductivity cell so that the increase in volume at, and beyond, the end point will be small.
• Temperature
The specific conductance of most ions usually increases by about 2% for each degree rise in temperature. It is therefore very important to control the temperature accurately in such measurements. For example, for titrations and other routine analysis, the temperature may be controlled for ± 0.250C which ensure a precision of ± 0.5%. But, for other purposes, such as the determination of dissociation constants, more accurate temperature control is required.
• Extraneous ions The presence of large concentrations of extraneous ions in solution to be analyzed is usually not required. This is because any change in conductance is being masked by such ions. This happens particularly if the limiting equivalent conductance of the foreign ions is similar to those of the ions to be analyzed. Such problem may be overcome by using high precision conductivity meters or bridges.
3.4 Applications
Conductimetry is a very useful phenomenon for the determination of various physical constants, such as dissociation and solubility constants. But its major application is for monitoring titrations.
• Solubility determination Conductimetry is applied in the determination of solubilities of sparingly soluble salts. It involves the measurement of the conductivity (k) for the saturated solution and then
followed by the calculation of the concentration (C) from the equation: Λ ...w
i

77
where Λ is the equivalent conductance or specific conductance of 1 cm3 solution containing 1 gram-equivalent of solute (molar conductance)
• Dissociation constant This is determined by calculating the degree of dissociation from the equivalent conductance of the analyte. For a weak acid HA, i.e.
xi y@zy4&
y@4
B1
1 A
where α is the degree of dissociation given by:
Λ
|
Λ where ΛC is the equivalent conductance before
dissociation while Λd is equivalent conductance after full dissociation.
• Precipitation titrations In these titrations, the conductance of a solution is measured as function of the volume of a titrant. The shape of the titration curve depends on the conductance of the ion in the cell (iC) and that of the ion in the titrant (it). If iC is greater than it, the conductance decreases at first, then increases after the endpoint as the concentration of the titrant ion increases. The end point is the intersection of the two lines.
• Acid-base titration As an acid is titrated with an alkali, the ionic composition of the mixture changes and this is reflected in the conductivity of the solution. In conductimetric titration, the conductivity can be plotted against the volume of the alkali that is being used. This gives rise to different titration curves as below:
Note: the end point is where the two lines intersect each other.
Co
nd
uct
ivit
y
Vol. of alkali Strong acid and strong base
Vol. of alkali
A weak acid and a strong base
Co
nd
uct
ivit
y
Co
nd
uct
ivit
y
Vol. of alkali Strong acid and weak base
Co
nd
uct
ivit
y
Vol. of alkali
A weak acid and weak base
Fig: 3.2

78
4.0 Conclusion
From what we have learnt, it is clear that conductimetric analysis involves the application of electrolytic process to measure the conductance of a given solution.
5.0 Summary
In this unit, we have learnt that:
• Conductimetry is an electrolytic technique that is used to measure the conductance of a sample solution based on electrical properties of the constituent ions.
• The electric current flowing through a conductor is directly proportional to the applied voltage and inversely proportional to the resistance of the conductor.
• Specific conductance of a given substance, is the conductance per cm of a solution that has a cross-sectional area of 1cm3 and is measured in Scm-1 or S.I. unit of Ω-1 cm-1.
• The basic instrument used for conductivity measurement is called a conductivity meter which has a basic arrangement of a Wheatstone bridge.
• Conductimetry is very useful in determining various physical constant such as dissociation constant and solubility constant. It is also very useful in titrimetric analysis.
6.0 Tutor Marked Assignment
1. (a) Explain the basic concept of conductimetric analysis.
(b) With the aid of a good diagram, describe the basic instrumental design of a conductivity meter.
2. Illustrate the different titration curves obtainable from condutimetric titration and indicate the end point of each titration.
7.0 Further reading/References
1. Douglas, A.S., Donald, M.W., James, F.H. and Stanley, R.C. (2004). Fundamentals of Analytical Chemistry, 8th Edition.
2. David, J.H. and Hazel, P. (1998). Analytical Biochemistry, 3rd Edition, Longman.
3. Daniel, C.H., (1982). Qualitative Chemical Analysis, 2nd Edition.

79
Unit 4 Polarimetry
1.0 Introduction 79
2.0 Objectives 79
3.0 Definition 79
3.1 Basic Principle of Polarimetry 79
3.2 Mode of Operation of a Polarimeter 80
3.3 Instrumentation 80
3.4 Uses of Polarimeter 81
4.0 Conclusion 81
5.0 Summary 82
6.0 Tutor Marked Assignment (TMA) 82
7.0 Further Reading 82

80
Unit 4 Polarimetry
1.0 Introduction
Polarimetry is the method of analysis which is based on the ability of a given compound in
solution to rotate a plane polarized light to a certain direction.
An ordinary light beam consists of waves oscillating in random directions. Each of the
vibrational directions can be resolved into two mutually perpendicular directions. But the
actual vibrational direction is the vector sum of the two components
If the ordinary light is collimated and passed through a crystal which allows only one
vibrational orientation to be transmitted, the transmitted light is said to be plane polarized.
Many natural crystals produce polarized light, but it is most conveniently obtained with
commercially available Polaroid materials.
2.0 Objectives
By the end of this unit, you should be able to:
• Explain what a polarimeter is; • draw a schematic diagram of a polarimeter; • explain the mode of operation of a polarimeter; and
• enumerate the uses of a polarimeter.
3.0 Definition
An instrument used in measuring the optical rotation of a substance in solution is called a polarimeter and the phenomenon, polarimetry.
3.1 Basic Principle of Polarimetry
Some compounds in solution have the power of rotating the plane polarized light to a certain direction. Such compounds are said to be optically active and, in the case of organic compounds, are found to have one or more asymmetric carbon atoms within the molecule. An asymmetric carbon atom is one with four different groups attached to it. The degree or
Vertical
component
Horizontal
component
Vibrational
direction

81
direction of the rotation is either to the right (called dextrorotatory, +) or to the left (called laevorotatory, -).
The extent of the degree of rotation of the plane polarized light is dependent on the:-
• nature of the compound;
• nature of the solvent; • depth of the solution through which the light passes;
• concentration of the solution; • temperature; and • wavelength of the light used.
The wavelength of the light normally used is that of sodium D line (589.3 nm), and the temperature is kept constant at 20 of 250C within the instrument.
3.2 Mode of Operation of a Polarimeter
Before operation, the analyzer prism of the polarimeter is rotated to make both halves of the
field of view equally bright; the circular scale reading for this position of the analyzer prism is
noted as its zero position. The polarimeter tube is then filled with the experimental solution, the
jacket around the tube is filled with water at a given temperature and the solution is allowed to
stand in the tube for some time to attain that temperature. On passing the monochromatic light
again through the polarimeter, the two halves of the field of view now look unequally
illuminated due to the rotation of the plane polarized light by the solution in the tube. The
analyzer prism is rotated until both halves look equally bright again. The difference in the
circular scale reading between the final position of the analyzer prism and its zero position
recorded initially, gives the angle of rotation of the polarized light.
3.3 Instrumentation
Optical rotation is usually measured by a polarimeter or polariscope and the phenomenon is
called Polarimetry. The polarimeter consists of a long hollow barrel carrying at its opposite
ends, a fixed polarizer Nicol prism and a rotating analyzer Nicol prism respectively. A hollow
polarimeter tube, encircled by a jacket, can be placed inside the barrel between the two prisms.
This tube of a given length is intended for carrying the solution under investigation while the
jacket around it may be filled with water at a given temperature. Between the polarizer prism
and the polarimeter tube, a quartz plate is located for obscuring half the field of view. Beyond
the analyzer prism are situated the telescopic eyepiece lenses. That end of the polarimeter
barrel carries a fixed circular scale graduated in degrees radian, the position of the analyzer
prism may be read on this scale. A schematic diagram of a polarimeter is given below:
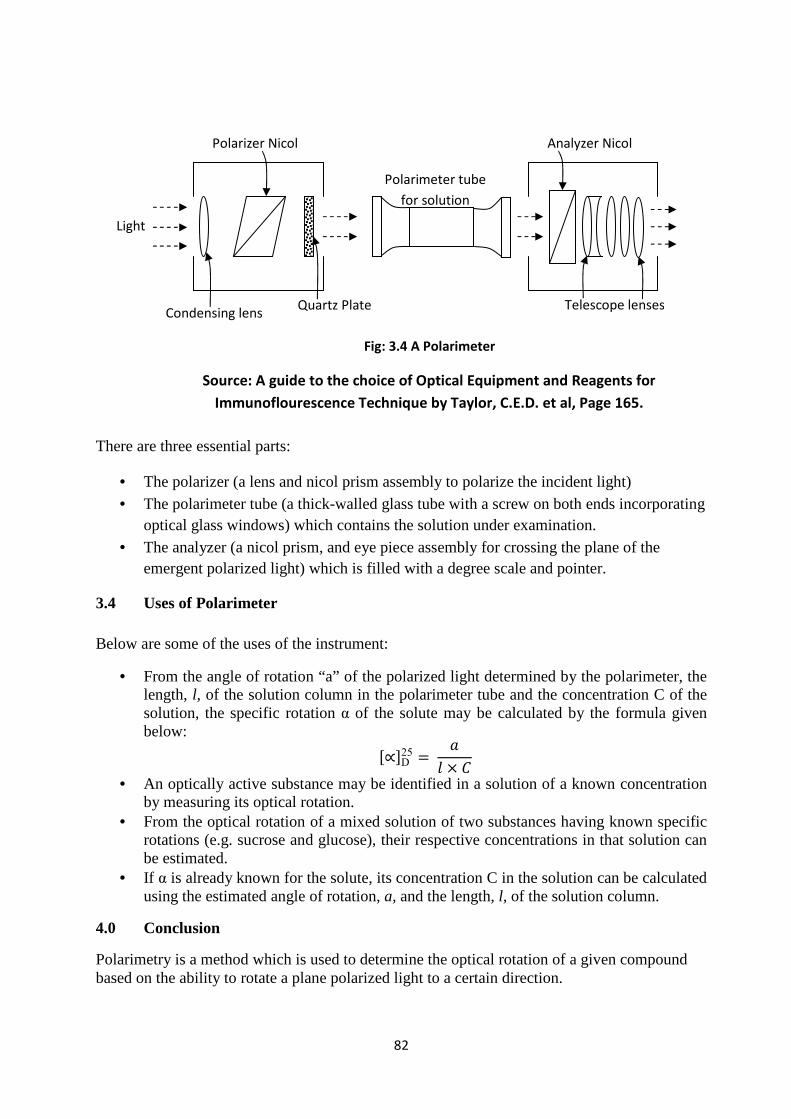
82
There are three essential parts:
• The polarizer (a lens and nicol prism assembly to polarize the incident light) • The polarimeter tube (a thick-walled glass tube with a screw on both ends incorporating
optical glass windows) which contains the solution under examination. • The analyzer (a nicol prism, and eye piece assembly for crossing the plane of the
emergent polarized light) which is filled with a degree scale and pointer.
3.4 Uses of Polarimeter
Below are some of the uses of the instrument:
• From the angle of rotation “a” of the polarized light determined by the polarimeter, the length, l, of the solution column in the polarimeter tube and the concentration C of the solution, the specific rotation α of the solute may be calculated by the formula given below:
y0D
25
9 1
• An optically active substance may be identified in a solution of a known concentration by measuring its optical rotation.
• From the optical rotation of a mixed solution of two substances having known specific rotations (e.g. sucrose and glucose), their respective concentrations in that solution can be estimated.
• If α is already known for the solute, its concentration C in the solution can be calculated using the estimated angle of rotation, a, and the length, l, of the solution column.
4.0 Conclusion
Polarimetry is a method which is used to determine the optical rotation of a given compound based on the ability to rotate a plane polarized light to a certain direction.
Light
Condensing lens
Polarizer Nicol
Prism
Quartz Plate
Polarimeter tube
for solution
Analyzer Nicol
Prism
Telescope lenses
Fig: 3.4 A Polarimeter
Source: A guide to the choice of Optical Equipment and Reagents for
Immunoflourescence Technique by Taylor, C.E.D. et al, Page 165.

83
5.0 Summary
In this unit, we have learnt that:
Polarimetry is a method of analysis which is based on the ability of a given optically active compound to rotate a plane polarized light.
The degree of rotation could be either to the right (D) or to the left (L) Sodium lamp is normally used to provide a specific wavelength (589.3 nm) for optical
rotation. Optically active compounds contain one or more asymmetric carbon or chiral centre.
6.0 Tutor Marked Assignment (TMA)
1. (a). Distinguish between dextrorotatory and laevorotatory
(b). With the aid of a schematic diagram, describe the instrumental arrangement of a
polarimeter and state the function of each part.
2. (a) A solution of 3 – phosphoglycerate (0.25 g/cm3) in water has an observed rotation of
– 2.160 in a 1 dm tube at 200C. What would be the specific rotation of the compound?
State whether the compound is L or D and give your reason.
7.0 Further Reading
1. Philip, M. (2003). Advanced Chemistry Physical and Industrial. 1st Edition, Cambridge
2. Allen, M.S., Barbara, A.G. and Melvin, L.D. (2000). Microscale and Miniscale Organic Chemistry Laboratory Experiments. McGraw-Hill Higher Education.

84
Unit 5 Refractometry
1.0 Introduction 84
2.0 Objectives 84
3.0 Definition 84
3.1 Basic Concept of Refraction 85
3.2 How to Calculate the Exact Refractive Index 85
3.3 How to Operate a Refractometer 86
3.4 Measuring the Refractive Index of a Substance 86
4.0 Conclusion 87
5.0 Summary 87
6.0 Tutor Marked Assignment (TMA) 87
7.0 Further reading/References 87

85
Unit 5 Refractometry
1.0 Introduction
In addition to absorption and emission, there are other interaction phenomena which are useful for both identification and structural studies. Hence, refraction is one of these important non-absorptive processes. When radiation passes from one medium to another, it is partially reflected and partially transmitted. The transmitted radiation retains its characteristic frequencies in the new medium, but both the velocity and direction of propagation may change. This can be illustrated by allowing a radiation to pass from air to glass medium. To explain this behavior, a ‘wave front’ perpendicular to the direction of propagation of the ray is considered. Thus if the ray strikes the surface of glass at an angle of incidence (φ), then one side of the wave front reaches the interface and enters the glass before the other. Therefore, while one side of the wave front is travelling in glass, the other side is still travelling in air.
2.0 Objectives
By the end of this unit, students should be able to
• explain the meaning of both refractive index and refractometry; • describe the basic concept of refractometry;
• calculate the exact refractive index of a substance based on the given data; and • explain the procedure for practical determination of refractive index.
3.0 Definition
Refractometry is a method which measures the refractive index of a substance.
The refractive index measures the angle at which a light ray will be bent when passing from one medium to another.
Incident ray
Wavefront
Refracted
ray
Air
Surface
Glass
φ1
φ2 Fig. 3.4

86
3.1 Basic Concept of Refraction
Refraction is the change in the direction of propagation of light waves as they cross the interface between two media of differing densities. When a ray of light passes from air into a dense medium (such as liquid), it is bent or refracted towards the normal. The ratio of the sine of the angle of incidence to the sine of that of refraction is constant and characteristic of that medium. This constant ratio (n) is called the refractive index. The refractive index, n, for a liquid or an isotropic solid is defined as the ratio of the phase velocity of light in vacuum to that in another medium.
~
~
RS
RS
Refractive index of a given substance is practically determined by the use of refractometer, which operates on the concept of the critical angle. This is the angle of
incidence (φmedium) for which the angle of refraction (φair) is exactly 900. The determination of refractive index involves only the determination of the two angles. These angles may be measured quite accurately and thus n may be determined with high degree of precision.
3.2 How to Calculate the Exact Refractive Index
The refractive index is an important physical property of inorganic liquids. The refractive index for many organic liquids can be found in chemical reference books such as The Handbook of Chemistry and Physics. The literature values are referenced to the D line of sodium lamp (589.3 nm) at 200C. Thus, a correction factor must be applied if the refractive index (n obs) is measured at temperatures, t, other than 200C.
This correction factor is :
B. aYJ = 0.00045 " A 20
where nobs is the observed refractive index from the refractometer, n20D is the correct
determined refractive index.
Example: A student measures the refractive index of an organic liquid. The value obtained at 180C is 1.2821. What is the corrected refractive index?
Using B. aYJ = 0.00045 " A 20
∴B. 1.2821 = 0.00045 "18 A 20
= 1.2821 + (0.00045 x -2)
= 1.2812

87
3.3 How to Operate a Refractometer
The following procedures are used for determining the refractive index of a sample with Abbe Refractometer:
1. Check the sodium arc to see that it is operating properly. 2. Check the temperature reading by the thermometer attached to the prism
housing. 3. Rotate the illuminating prism downwards and away from you. Wipe both the
prism surfaces gently with a fresh swab of cotton wool dampened with acetone. When the prism surfaces are cleaned and dried, rotate the illuminating prism upwards and towards you to restore the closed position.
4. Introduce a few drops of the sample into the entrance hole. 5. Rotate the prism until the boundary between light and dark fields appears in the
field of view. Adjust if necessary, the light source or the mirror to obtain the best illumination.
6. Also rotate if necessary, the prisms to eliminate the colour fringe and sharpen the boundary.
7. Make any necessary fine adjustments to bring the boundary between light and dark fields into coincidence with the intersection of the cross-hairs. Then turn the lamp that illuminates the scale and note the value of the refractive index of the sample.
8. Clean the prism surfaces with a fresh swab of cotton wool moistened with acetone and close the prism when clean and dry.
Application : Refractometer is essentially an analytical instrument used to determine the composition of binary mixtures or to determine the purity of compounds. Its most common industrial application is in the food and confectionery industry where it is used for the determination of the concentration of sugar in syrup. In addition to these, refractometry can be used to estimate molecular weights, molecular sizes and shapes, and to calculate properties such as reflectivity and optical dispersion.
3.4 Measuring the Refractive Index of a Substance
The sample of the unknown is obtained and recorded accordingly. Put about four drops of the liquid sample between the plates of the refractometer. Measure and record the refractive index of the liquid. Record the room temperature. If the temperature differs from 200C, apply a correction factor to the refractive index. Record the corrected refractive index. Then identify the unknown liquid by comparing the refractive index with the standard.

88
The refractive indices of some organic liquids are shown below:
Organic liquid Refractive index (nD20)
Acetonitrite 1.3442
Hexane 1.3751
1-propanol 1.3850
1-Butanol 1.3993
Cyclohexane 1.4266
Toluene 1.4961
4.0 Conclusion
Refractometry is a method of analysis which is based on determining the refractive index of a substance. The method is valuable in ascertaining the purity of a substance.
5.0 Summary
In this unit, we have learnt that:
• Refractometry is a technique which measures the refractive index of a substance. • Refractive index determines the angle at which a light ray is bending when passing
from one medium to another • A correction factor nD
20= 0.00045 (t-20) is used to obtain the exact refractive index of a substance.
• The technique is applied in food and confectionery industry to determine the concentration of sugar in syrup or other allied products.
6.0 Tutor Marked Assignment (TMA)
1. (a) What is meant by refraction and refractive index? (b) A student measures the refractive index of an oil suspected to be of plant origin. The value obtained is 1.3871 at 250C. Calculate the exact refractive index of the oil.
2. (a) How does the impurity affect the refractive index of a substance? (b) If two samples of organic liquids give the same value of refractive index, are the liquids similar? Explain.
7.0 Further reading/References
1. A.M. Schoftstall, B.A. Gaddis & M.L. Druelinger (2000) – Microscale and Miniscale Organic Chemistry laboratory Experiment.