Embed Size (px)
Citation preview

Surfactant Assisted Synthesis and Characterization of
High Surface Area Mesoporous Nanocrystalline Pure,
Eu3+
and Sm3+
doped Ceria for Selected Applications
Bappaditya Mandal
Department of Chemistry
National Institute of Technology Rourkela

Surfactant Assisted Synthesis and Characterization of High
Surface Area Mesoporous Nanocrystalline Pure, Eu3+
and Sm3+
Doped Ceria for Selected Applications
Dissertation submitted in partial fulfillment
of the requirements of the degree of
Doctor of Philosophy
in
Chemistry
by
Bappaditya Mandal
(Roll Number: 509CY608)
based on research carried out
under the supervision of
Prof.(Ms.) Aparna Mondal
September, 2016
Department of Chemistry
National Institute of Technology Rourkela

ii
Certificate of Examination
Roll Number: 509CY608
Name: Bappaditya Mandal
Title of Dissertation: Surfactant Assisted Synthesis and Characterization of High Surface
Area Mesoporous Nanocrystalline Pure, Eu3+
and Sm3+
doped Ceria for Selected
Applications
We the below signed, after checking the dissertation mentioned above and the official record
book (s) of the student, hereby state our approval of the dissertation submitted in partial
fulfillment of the requirements of the degree of Doctor of Philosophy in Department of
Department of Chemistry National Institute of Technology Rourkela. We are satisfied with
the volume, quality, correctness, and originality of the work.
Prof.(Ms.) Aparna Mondal
Principal Supervisor
Prof. Garudadhwaj Hota Prof. Kalipada Maity
Member, DSC Member, DSC
Prof.(Mrs.) Sabita Patel
Member, DSC External Examiner
Prof. V. Siva Kumar Prof. Saurav Chatterjee
Chairperson Head of the Department
iii
Prof.(Ms.) Aparna Mondal
Assistant Professor
Supervisor’s Certificate
This is to certify that the work presented in the dissertation entitled Surfactant Assisted
Synthesis and Characterization of High Surface Area Mesoporous Nanocrystalline Pure, Eu3+
and Sm3+
Doped Ceria for Selected Applications submitted by Bappaditya Mandal, Roll
Number Roll No.509CY608, is a record of original research carried out by him under my
supervision and guidance in partial fulfillment of the requirements of the degree of Doctor of
Philosophy in Department of Chemistry. Neither this dissertation nor any part of it has been
submitted earlier for any degree or diploma to any institute or university in India or abroad.
Prof.(Ms.) Aparna Mondal

iv
Dedication
Dedicated to my family
Signature

v
Declaration of Originality
I, Bappaditya Mandal, Roll Number 509CY608 hereby declare that this dissertation entitled
Surfactant Assisted Synthesis and Characterization of High Surface Area Mesoporous
Nanocrystalline Pure, Eu3+
and Sm3+
doped Ceria for Selected Applications presents my
original work carried out as a doctoral student of NIT Rourkela and, to the best of my
knowledge, contains no material previously published or written by another person, nor any
material presented by me for the award of any degree or diploma of NIT Rourkela or any
other institution. Any contribution made to this research by others, with whom I have worked
at NIT Rourkela or elsewhere, is explicitly acknowledged in the dissertation. Works of other
authors cited in this dissertation have been duly acknowledged under the sections “Reference”
or “Bibliography”. I have also submitted my original research records to the scrutiny
committee for evaluation of my dissertation.
I am fully aware that in case of any non-compliance detected in future, the Senate of NIT
Rourkela may withdraw the degree awarded to me on the basis of the present dissertation.
September 21, 2016
NIT Rourkela
Bappaditya Mandal

vi
Acknowledgment
First and foremost, I would like to express my deep sense of gratitude and reverence to my
advisor Prof. Aparna Mondal for her patient guidance, excellent advice, consistent support
and unflinching encouragement throughout the entire period of my research work.
I would like to express my sincere thanks to all my Doctoral Scrutiny Committee (DSC)
members Prof. K. P. Maity (Department of Mechanical Engineering), Prof. G. Hota, and
Prof. S. Patel along with DSC Chairperson Prof. V. Siva Kumar for their valuable comment
and discussion during the entire course of my work.
I would like to thank Prof. Saurav Chatterjee, Head, Department of Chemistry, NIT
Rourkela, for allowing me to avail all the facilities of the Department of Chemistry.
I am also thankful to all the distinguish professors of Department of Chemistry, NIT Rourkela
for their constructive suggestions.
I owe a depth gratitude to Prof. B. B. Nayak Head, Department of Ceramic Engineering, NIT
Rourkela, for his inspiring advice and valuable suggestion.
I wish to express my deep regard to all non-teaching staff of NIT Rourkela for their constant
practical assistance and help whenever required throughout the period.
I express my sincere thanks to the, Council of Scientific & Industrial Research, India for
financial support.
I have been blessed to be surrounded by many caring and loving friends, seniors and juniors
like Sarita, Arnab, Apu, Nihar bhai, Soumen, Animesh, Pijush, Avijit, Smruti.
I wish to express my thanks to my lab mates, Priyadarshini, Amar, Prakash, Shraban,
Tapaswini and all the research scholars of ours department. Their support and help during
my research work make my stay in this institute a memorable one.
Finally I would like to thank my parent and family members. Without their inspiration, help
and encouragement this work would not have been possible. A special thank goes to my elder
brother Kailash pati Mandal and elder sister Dr. Banashree Ghosh for all their affection
and for uplifting my spirit in need.
Date:
NIT Rourkela, India (Bappaditya Mandal)

vii
Abstract
CeO2 is one of the most interesting oxides industrially because it has been widely used as
a catalyst, metal polishing agent, three-way automotive catalytic converters for purification of
exhaust gases, oxygen ion conductor in solid oxide fuel cells, oxidative coupling of methane
and water-gas shift reaction, oxygen sensors, and so forth for long periods of time. Recently,
CeO2 nanoparticles has also emerged as a fascinating and lucrative material for environmental
remediation application as photocatalyst for degradation of toxic pollutants. The key for most
of the above mentioned applications of CeO2 based materials is its extraordinary ability to
release or uptake oxygen by shifting some Ce4+
to Ce3+
ions. Better catalytic performances of
CeO2 have been reported in the presence of Ce3+
and oxygen vacancy defects, which are
potentially potent surface sites for catalysis. The present work is undertaken on multigram
synthesis of high content of Ce3+
, high surface area and high quality mesoporous pure CeO2 as
well as Sm3+
, and Eu3+
doped CeO2 using cheaper metal inorganic precursor. The XRD results
showed that even as-prepared material has cubic fluorite structure of CeO2 with no crystalline
impurity phase. Thereby, confirming the ability of the present aqueous based synthetic
approach to prepare mesoporous crystalline CeO2 nanoparticles at a lower temperature of
100°C. All the nanopowder exhibited strong absorption in the UV region and good
transmittance in the visible region. Sm3+
and Eu3+
doped CeO2 nanopowder showed enhanced
photoluminescence in the red and orange region. Mesoporous Sm3+
doped CeO2 sample could
effectively photodegrade all types of cationic, anionic and nonionic dyes under natural
sunlight irradiation. These high surface area mesoporous materials exhibited notable
adsorption and effective removal of Cr(VI) from aqueous solutions at room temperature and
without any adjustment of pH. Mesoporous Sm3+
doped CeO2 samples also exhibited
excellent autocatalytical properties. The presence of increased surface hydroxyl group,
mesoporosity, and surface defects have contributed towards an improved activity of
mesoporous CeO2, which appears to be potential candidates for optical, environmental and
biomedical applications.
Keywords: Ceria; Mesoporous; Optical Nanopowder; Photocatalyst.

viii
Contents
Certificate of Examination ii
Supervisors’ Certificate iii
Dedication iv
Declaration of Originality v
Acknowledgment vi
Abstract vii
List of Figures xv
List of Tables xxi
1 General Introduction 1-40
1.1. Historical background 1
1.2. Cerium Dioxide (CeO2): Structure and Properties 3
1.2.1. Crystal structure of CeO2 3
1.2.2. Defect structure of CeO2 4
1.2.2.1. Intrinsic defect 5
1.2.2.2. Extrinsic defects (disorder) in CeO2 5
1.2.3. Oxygen storage capacity of CeO2 6
1.3 Modification of CeO2 7
1.4. Introduction of nanomaterials 10
1.5. Synthetic approaches to ceria based materials 13
ix
1.6. Porous materials and their classification 15
1.7. Synthesis of mesoporous materials 15
1.7.1. Soft-matter templating 17
1.7.2. Hard templating methods 22
1.8. Mesoporous CeO2 and CeO2 based materials 23
1.9. Applications of ceria based materials 26
1.10. Objectives of the thesis 28
References 29
2 Experimental Procedure and Measurements 41-62
2.1 Synthetic Methodology 42
2.1.1 Synthesis of pure CeO2 44
2.1.2 Synthesis of Sm3+
doped CeO2 45
2.1.2.1 Synthesis of Sm3+
doped CeO2 by using different surfactants via
conventional refluxing route
45
2.1.2.2 Synthesis of Sm3+
doped CeO2 by using SDS via microwave
refluxing
45
2.1.3 Synthesis of Eu3+
doped CeO2 by using SDS through conventional
and microwave refluxing
46
2.2 Characterization and measurements 47
2.2.1 Simultaneous thermal analysis (TGA/DSC) 48
2.2.2 X-ray diffraction (XRD) 48
2.2.3 Brunauer, Emmett and Teller (B.E.T.) measurements 50
2.2.4 Fourier transform-Infra red spectroscopy (FTIR) 51
2.2.5 UV-visible diffuse reflectance spectroscopy (UV-vis DRS) 52
2.2.6 Photoluminescence spectroscopy (PL) 53
2.2.7 X-ray photoelectron spectroscopy (XPS) 54
2.2.8 Field emission scanning electron microscopy (FESEM) 55
2.2.9 High resolution transmission electron microscopy (HRTEM) 56
2.2.10 Temperature programmed reduction (TPR) and temperature
programmed desorption (TPD)
57
2.3 Cr(VI) adsorption study 58

x
2.3.1 Effect of variable parameters 58
2.3.1.1 Effect of contact time 59
2.3.1.2 Effect of pH 59
2.3.1.3 Effect of amount of adsorbent 59
2.3.1.4 Effect of adsorbate concentration 59
2.3.1.5 Study of adsorption isotherms 59
2.3.1.6 Study of adsorption kinetics 61
References 61
3 High Surface Area Mesoporous Ceria Synthesized With and Without
Surfactant
63-88
3.1 Introduction 64
3.2. Experimental and characterization 65
3.3. Results and Discussion 65
3.3.1. TG–DSC 65
3.3.1.1. Effect of surfactant 65
3.3.1.2 Effect of Microwave refluxing 66
3.3.2 XRD 67
3.3.2.1. Effect of surfactant 67
3.3.2.2. Effect of calcination temperature 68
3.3.2.3. Effect of microwave reflux method 70
3.3.3 BET surface area 71
3.3.3.1 Effect of calcination temperature 71
3.3.3.2 Effect of microwave reflux methods 73
3.3.4. FTIR spectra 74
3.3.5. FESEM Micrograph 75
3.3.6. TEM, HRTEM Micrograph & SAED Pattern 76
3.3.7. UV–vis absorption spectra 78
3.3.7.1. Effect of surfactant and calcination temperature 78
3.3.7.2 Effect of Microwave heating 80
3.3.8 Photoluminescence (PL) spectra 80
3.3.8.1. Effect of surfactant 80

xi
3.3.8.2. Effect of calcination temperature 81
3.3.8.3. Fluorescent microscopy images 82
3.3.9. XPS Spectra 83
3.3.10. NH3-TPD profiles 84
3.3.11. TPR profiles 85
3.4. Conclusions 86
References 86
4 High Surface Area Sm3+
Doped Mesoporous CeO2 Nanocrystals 89-133
4.1 Introduction 90
4.2. Synthesis and characterization of Sm3+
doped CeO2 nanocrystals 91
4.3. Results and discussion 91
4.3.1 TG-DSC analysis of Sm3+
doped CeO2 91
4.3.1.1 Effect of dopant concentration 91
4.3.1.2 Influence of conventional and microwave refluxing 95
4.3.1.3 Influence of anionic, cationic and nonionic surfactant 96
4.3.2 X-ray diffraction pattern of Sm3+
doped CeO2 97
4.3.2.1 Effect of dopant concentrations 97
4.3.2.2 Effect of calcination temperatures 99
4.3.2.3 Effect of refluxing method 101
4.3.2.4 Effect of surfactants 102
4.3.3 N2 sorption isotherm of Sm3+
doped CeO2 103
4.3.3.1 Effect of dopant concentration 103
4.3.3.2 Effect of various calcination temperature 105
4.3.3.3 Influence of reflux methods 106
4.3.3.4 Effect of various surfactant 108
4.3.4 FTIR analysis 109
4.3.5 Microstructure analysis 112
4.3.5.1 FESEM images, EDAX analysis and elemental mapping 112
4.3.5.2 TEM & HRTEM images 115
4.3.6 UV-vis DRS studies 118
4.3.7. PL analysis 121

xii
4.3.7.1. PL emission spectra 121
4.3.7.2. PL excitation spectra 123
4.3.7.3. Fluorescent microscopy images 125
4.3.8 XPS analysis 126
4.3.9 H2-TPR analysis 128
4.3.10 NH3-TPD analysis 130
4.4 Conclusion 131
References 131
5 Characterization of High Surface Area Eu3+
Doped CeO2 Nanopowders 134-169
5.1 Introduction 135
5.2 Synthesis and characterization of Eu3+
doped CeO2 materials 136
5.3 Results and discussion 136
5.3.1 TG-DSC profiles of as-prepared Eu3+
doped CeO2 powders 136
5.3.1.1 Effect of dopant concentration 136
5.3.1.2 Effect of microwave refluxing 138
5.3.2. XRD patterns of Eu3+
doped CeO2 nanopowders 140
5.3.2.1. Effect of dopant concentrations 140
5.3.2.2. Effect of calcination temperature 141
5.3.2.3. Effect of microwave refluxing 143
5.3.3. N2-sorption analysis 145
5.3.3.1. Effect of dopant concentration 145
5.3.3.2. Effect of calcination temperatures 146
5.3.3.3 Effect of microwave refluxing 147
5.3.4. FTIR analysis 148
5.3.5. Microstructure analysis 149
5.3.5.1. FESEM images, EDAX analysis and elemental mapping 149
5.3.5.2. TEM and HRTEM images 152
5.3.6. UV-Vis diffuse reflectance spectroscopic studies 155
5.3.6.1. Effect of dopant concentration 155
5.3.6.2 Effect of calcination temperatures 156
5.3.6.3. Eu3+
doped CeO2 obtained via microwave refluxing 157

xiii
5.3.7. PL analysis 159
5.3.7.1. Effect of calcination temperature 159
5.3.7.2. Effect of dopant concentration 160
5.3.7.3. Fluorescent microscopy images 162
5.3.8. XPS analysis 162
5.3.9. H2-TPR analysis 165
5.3.10. NH3-TPD analysis 166
5.4. Conclusion 166
References 167
6 Applications of Pure and Doped CeO2 Nanopowders for Environmental
Remediation
170-205
6.1 Effective adsorption of hazardous Cr(VI) ions in aqueous
environment
171
6.1.1. Introduction 171
6.1.2 Experimental condition of Cr(VI) adsorption 173
6.1.3. Result and Discussion 174
6.1.3.1. Effect of various adsorbent 174
6.1.3.2. Effect of contact time 175
6.1.3.3. Effect of pH 176
6.1.3.4. Effect of adsorbent dose 177
6.1.3.5. Effect of initial concentration 178
6.1.3.6. Maximum adsorption capacity 178
6.1.3.7. Adsorption isotherm study 179
6.1.3.7.1. Langmuir isotherm 179
6.1.3.8.1. Freundlich isotherm 180
6.1.3.8. Adsorption kinetics 180
6.1.3.8.1. The pseudo first-order equation 180
6.1.3.8.2. The pseudo second-order equation 181
6.1.4. Conclusion 182
6.2. Evaluation of Photo degradation of Acid Orange 7 under natural
sunlight
182

xiv
6.2.1. Introduction 182
6.2.2. Experimental details 185
6.2.3. Result and discussion 186
6.2.3.1. Effect of various photocatalysts 186
6.2.3.2 Effect of catalyst dosage 187
6.2.3.3 Effect of pH of the medium 188
6.2.3.4. Effect of calcination temperature 188
6.2.3.5. Effect of irradiation time 190
6.2.3.6. FT-IR study on dye before and after photodegradation 191
6.2.3.7. Active species to attack dye molecule 192
6.2.4. Conclusion 196
6.3. Autocatalytic activity 196
6.3.1. Introduction 196
6.3.2. Evaluation of autocatalytic behavior 197
6.3.3 Toxicity analysis 197
6.3.4. Results and discussion 197
6.3.4.1. Autocatalytic properties 197
6.3.4.2. Effect of type of dopant 199
6.3.4.3 Effect of dopant concentration 200
6.3.4.4. Cytotoxicity test 202
6.4. Conclusion 202
References 203
7 Summary, Conclusion and Future Scope of the Work 206-210
7.1 Summary and Conclusion 206
7.2 New achievement and implication 209
7.3 Future Scope of the Work 210

xv
List of Figures
Fig No. Title Page No.
Fig. 1.1 The crystal structure of CeO2: (a) unit cell as a ccp array of cerium atoms.
The ccp layers are parallel to the [111] planes of the f.c.c. unit cell, (b) and
(c) the same structure redrawn as a primitive cubic array of oxygens.
[Adapted from ref. 93].
3
Fig. 1.2 The Lycurgus cup appears (a) green in reflected light, and (b) red in
transmitted light and this cup is preserved in the British museum in London.
10
Fig. 1.3 Different types of surfactant structures (adopted from ref. 263). 20
Fig. 1.4 Schematic representation of the different types of silica-surfactant
interfaces (adapted from ref. 252).
21
Fig. 2.1 Surfactants used in the synthesis of mesoporous CeO2 or doped CeO2. 42
Fig. 2.2 Schematic flow chart illustrating various steps involved for the synthesis of
pure CeO2.
43
Fig. 2.3 Schematic flow chart of various steps involved for the synthesis of Sm3+
or
Eu3+
doped CeO2.
46
Fig. 2.4 Photograph of Rigaku Ultima-IV diffractometer. 49
Fig. 2.5 Photograph of Quantachrome Autosorb-1 apparatus. 51
Fig. 2.6 Schematic diagram showing transitions giving rise to absorption
and fluorescence emission spectra.
54
Fig. 2.7 Photograph of Nova Nano SEM 450. 55
Fig. 2.8 Photograph of JEOL-JEM 2100 TEM. 56
Fig. 3.1 TG-DSC curves of (A) 100CSDSeasp and (B) 100Ceasp. 66
Fig. 3.2 TG-DSC curves of 100CeSDSMWasp. 67
Fig. 3.3 XRD patterns of the (a) 100Ceasp (b) 100CeSDSasp. 68
Fig. 3.4 XRD patterns of (a) 100CeSDSasp, and the samples calcined at (b) 500C,
(c) 650C, (d) 800C, and (e) 1000C.
69
Fig. 3.5 XRD patterns of the (a) 100CeSDSMWasp and calcined at (b) 500C (c)
650C and (c) 800
C.
70
Fig. 3.6 (A) N2 adsorption–desorption isotherms (B) BJH pore size distribution
curves of the (a) 100Ceasp and the samples calcined at (b) 500C, (c)
650C, and (c) 800C.
72
Fig. 3.7 (A) N2 adsorption–desorption isotherms and (B) BJH pore size
distribution of 100CeSDS samples (a) as prepared, calcined at (b) 500C,
(c) 650C, and (c) 800C.
73

xvi
Fig. 3.8 (A) N2 adsorption–desorption isotherms and (B) BJH pore size distribution
of 100CeSDSMW (a) as prepared samples, calcined at (b) 500C and (c)
650C.
73
Fig. 3.9 FTIR spectra of the (a) 100Ceasp and (b) 100ce500. 74
Fig. 3.10 FTIR spectra of the (a) pure SDS, (b) 100CeSDSasp and calcined at (c)
500C (d) 650
C for 2 h.
75
Fig. 3.11 FESEM micrographs of (a) 100Ce500 and (b) 100CeSdS500°C. 76
Fig. 3.12 (a) TEM image, (b) HRTEM image, (c) Lattice fringes and corresponding
(d) SAED pattern of 100Ce500°C.
76
Fig. 3.13 (a) TEM image, (b) HRTEM image, (c) Lattice fringes and corresponding
(d) SAED pattern of 100CeSDS500°C.
77
Fig. 3.14 UV-vis spectra of (a) 100Ce500 and (b) 100CeSDS500. 78
Fig. 3.15 UV-visible spectra of the (a) 100CeSDSasp and calcined at (b)500C, (c)
650C, (d) 800
C and (e)1000°C.
79
Fig. 3.16 UV-visible spectra of the (a) 100CeSDSMWasp and calcined at (b) 500C
(c) 650C and (c) 800
C.
80
Fig. 3.17 PL spectra of (a) 100Ce500 and (b) 100CeSDS500 samples excited at 335
nm.
81
Fig. 3.18 PL spectra of (a) 100CeSDSasp, and the samples calcined at (b) 500C, (c)
650C, (c) 800C, and (d) 1000C.
82
Fig. 3.19 (a-c) Fluorescent microscope images of 100CeSDS1000, excited at
wavelengths of (a) 350 nm, (b) 405 nm, and (c) 532 nm.
82
Fig. 3.20 Ce 3d XPS spectra of (a) 100CeSDS500 and (b) 100Ce500. 83
Fig. 3.21 O 1s core level photoemission spectra from (a)100CeSDS500C and
(b)100Ce500C.
84
Fig. 3.22 (A) TPD and (B) TPR profiles of pure CeO2 synthesized (a) 100Ce500C,
(b) 100CeSDS500C.
85
Fig. 4.1 TG-DSC curves of (a) 0.5, (b) 1, (c) 2, and (d) 5 mol% Sm3+
doped as-
synthesized CeO2 samples.
93
Fig. 4.2 TG-DSC curves of (a) 10 and (b) 20 mol% Sm3+
doped as-synthesized
CeO2 samples.
93
Fig. 4.3 (A) DSC and (b) TG curves of (B) 0.5, (b) 1.0, (c) 2.0, (d) 5.0, (e) 10 and
(f) 20 mol% Sm3+
doped as-prepared CeO2 samples.
94
Fig. 4.4 (A) DSC and (B) TG curves of 1SmCeSDSasp prepared via (a) without
refluxing, (b) normal refluxing, and (c) microwave refluxing method.
96
Fig. 4.5 (A) DSC and (B) TG curves of as-prepared 1SmCeSDSasp sample,
prepared using different surfactants of (a) SDS, (b) DDA, and (c) PEG.
97
xvii
Fig. 4.6 XRD patterns of as-prepared (a) 0.5, (b) 1.0, (c) 2.0, (d) 5.0, (e) 10 and (f)
20 mol% Sm3+
doped CeO2 nanopowders.
98
Fig. 4.7 XRD patterns of Sm3+
doped CeO2 (a) as-prepared precursor and calcined
at (b) 500°C, (c) 650°C and (d) 800°C for 2 h.
100
Fig. 4.8 XRD patterns of the as-prepared 1 mol% Sm3+
doped CeO2 powders
synthesized via (a) without refluxing, (b) normal refluxing, and (c)
microwave refluxing method.
102
Fig. 4.9 XRD patterns of the as-prepared 1 mol% Sm3+
doped CeO2 synthesized
using (a) SDS, (b) DDA, and (c) PEG by conventional refluxing method.
103
Fig. 4.10 (A) BET N2 adsorption–desorption isotherm and the (B) BJH pore size
distributions of (a) 0.5, (b) 1.0, (c) 2.0, (d) 5.0, (e) 10 and (f) 20 mol%
Sm3+
doped CeO2 powders and calcined at 500°C.
104
Fig. 4.11 (A) BET N2 adsorption–desorption isotherms and the (B) BJH pore size
distributions of 1 mol% Sm3+
doped CeO2 (a) as-prepared, and the samples
calcined at (b) 500°C, (c) 650°C, and (d) 800°C for 2 h.
105
Fig. 4.12 (A) N2 adsorption–desorption isotherms and (B) BJH pore size distribution
of the samples prepared via (a) without refluxing, (b) normal refluxing, and
(c) microwave refluxing method and calcined at 500C.
107
Fig. 4.13 (A) N2 adsorption–desorption isotherms (B) BJH pore size distribution of
the as-prepared 1 mol% Sm3+
doped CeO2 synthesized via (a) SDS, (b)
DDA, and (c) PEG by conventional refluxing method.
108
Fig. 4.14 FTIR spectra of 1 mol% Sm3+
doped CeO2 powders, (a) as-prepared, and
the samples calcined at (b) 500°C, and (c) 650°C for 2 h, synthesized using
SDS as surfactant.
109
Fig. 4.15 Expanded FTIR spectra of 1 mol% Sm3+
doped as-prepared CeO2. 110
Fig. 4.16 FTIR spectra of 1 mol% Sm3+
doped CeO2 nanopowders, (a) as-prepared,
and the samples calcined at (b) 500°C, and (c) 650°C for 2 h, synthesized
using DDA as surfactant.
111
Fig. 4.17 FTIR spectra of 1 mol% Sm3+
doped CeO2 nanopowders, (a) as-prepared,
and the samples calcined at (b) 500°C, and (c) 650°C for 2 h, synthesized
using PEG as surfactant.
111
Fig. 4.18 FESEM micrographs of (a) 0.5, (b) 1.0, (c) 2.0, and (d) 5 mol% Sm3+
doped CeO2 calcined at 500°C.
112
Fig. 4.19 EDS graphs of (a) 0.5, (b) 1.0, (c) 2.0, and (d) 5 mol% Sm3+
doped CeO2
calcined at 500°C.
113
Fig. 4.20 Elemental mapping of 1 mol% Sm3+
doped CeO2, (a) overall elemental
mapping, and of the (b) Ce, (c) Sm, and (d) O.
114
Fig. 4.21 FESEM micrographs of 1.0 mol% Sm3+
doped CeO2 synthesized through
(a) conventional refluxing, and (b) microwave assisted refluxing, and
calcined at 500°C.
114

xviii
Fig. 4.22 FESEM micrographs of 1 mol% Sm3+
doped CeO2, (a) asp, and calcined at
(b) 500°C (c) 650°C, and (d) 800°C.
115
Fig. 4.23 TEM images (right), and HRTEM images (left) of Sm3+
doped CeO2
powders (a) as-prepared precursor, and calcined at (b) and (c) 500°C, and
(d) 650C for 2 h. Selected part of (c) is enlarged and shown in the inset.
116
Fig. 4.24 TEM and HRTEM micrographs of 1 mol% Sm3+
doped CeO2, calcined at
800°C.
117
Fig. 4.25 UV-vis diffuse reflectance spectra of Sm3+
doped CeO2 powders (a) as-
prepared precursor and calcined at (b) 500°C (compared with that of pure
CeO2 in the inset), (c) 650C, (d) 800C, and (e) 1000C for 2 h.
118
Fig. 4.26 Plot of the transformed Kubelka–Munk function versus light energy for
Sm3+
doped CeO2 samples.
119
Fig. 4.27 UV-visible absorption spectra of (a) 0, (b) 0.5, (c) 1.0, (d) 2.0, (e) 5.0, (f) 10, and
(g) 20 mol% Sm3+
doped CeO2 nanopowders calcined at 500°C. 120
Fig. 4.28 PL emission spectra of (a) 0.5, (b) 1.0, (c) 2.0, and (d) 5 mol% Sm3+
doped
CeO2 nanopowders calcined at 500°C.
121
Fig. 4.29 PL emission spectra of Sm3+
doped CeO2 (a) as-prepared precursor, and the
samples calcined at (b) 500°C, (c) 650°C, (d) 800°C, (e) 1000°C, and (f)
1300°C for 2 h.
122
Fig. 4.30 PL excitation spectra of Sm3+
doped CeO2 (a) as-prepared precursor, and
calcined at (b) 500°C, (c) 650°C, (d) 800°C, (d) 1000°C, and (d) 1300°C for 2 h.
123
Fig. 4.31 PL excitation spectra of (a) 0.5, (b) 1.0, (c) 2.0, and (d) 10 mol% Sm3+
doped CeO2 nanopowders calcined at 500°C for 2 h.
124
Fig. 4.32 Energy transfer mechanism from CeO2 host to Sm3+
ions. 125
Fig. 4.33 Fluorescent microscope images of 1SmCeSDS1000 at excitation
wavelengths (a) 350 nm, (b) 405 nm and (c) 532 nm.
125
Fig. 4.34 High-resolution XPS spectrum and the corresponding deconvolution
components of Ce 3d from Sm3+
doped CeO2 calcined at 500°C.
126
Fig. 4.35 Sm 3d5/2 XP spectrum of Sm3+
doped CeO2 calcined at 500°C. 127
Fig. 4.36 O 1s XP spectra of CeO2 and Sm3+
doped CeO2 samples calcined at 500C. 127
Fig. 4.37 H2 consumption as a function of temperature for mesoporous CeO2 and
Sm3+
doped CeO2 calcined at 500C.
129
Fig. 4.38 NH3–TPD profiles of the (a) CeO2 and (b) Sm3+
doped–CeO2 calcined at
500C.
130
Fig. 5.1 TG-DSC profiles of as-prepared (a) 0.5, (b) 1.0, (c) 2.0, and (d) 5 mol%
Eu3+
doped CeO2 samples obtained via conventional refluxing.
137
Fig. 5.2 TG-DSC profiles of the as-prepared 1 mol% Eu3+
doped CeO2 sample,
obtained via microwave refluxing method.
139

xix
Fig. 5.3 Comparative (A) DSC and (B) TG profiles of the as-prepared 1 mol%
Eu3+
doped CeO2 samples obtained via (a) conventional, and (b)
microwave refluxing method.
139
Fig. 5.4 XRD patterns of (a) 0.5, (b) 1.0, (c) 2.0, and (d) 5 mol% Eu3+
doped CeO2
obtained via conventional refluxing method and calcined at 500°C for 2 h.
141
Fig. 5.5 XRD patterns 1 mol% Eu3+
doped CeO2 obtained via conventional
refluxing method (a) as-prepared, and calcined at (b) 500°C, (c) 650°C and
(d) 800°C for 2 h.
142
Fig. 5.6 XRD patterns of 1 mol% Eu3+
doped CeO2 obtained via microwave
refluxing method (a) as-prepared, and the samples calcined at (b) 500°C,
and (c) 800°C for 2 h.
143
Fig. 5.7 (A) N2-sorption isotherms, and (B) BJH pore size distribution curves of (a)
0.5, (b) 1.0, (c) 2.0, and (d) 5 mol% Eu3+
doped CeO2 obtained via
conventional refluxing method and calcined at 500°C for 2 h.
145
Fig. 5.8 (A) N2-sorption isotherms and the (B) BJH pore size distribution curves of
1 mol % Eu3+
doped CeO2 samples, (a) as-prepared and calcined powders
at (b) 500°C, (c) 650°C, and (d) 800°C for 2 h, obtained via conventional
refluxing.
147
Fig. 5.9 (A) N2-sorption isotherms, and (B) BJH pore size distribution curves of (a)
1EuCeSDSMWasp, (b) 1EuCeSDSMWasp, and (c) 1EuCeSDSMWasp.
148
Fig. 5.10 FTIR spectra of 1 mol% Eu3+
doped CeO2 (a) as-prepared, and the samples
calcined at (b) 500°C, and (c) 650°C.
149
Fig. 5.11 FESEM micrographs of 1 mol% Eu3+
doped CeO2, (a) as-prepared, and
the samples calcined at (b) 500°C, (c) 650°C, and (d) 800°C.
150
Fig. 5.12 FESEM micrographs of (a) 0.5, (b) 1.0, (c) 2.0, and (d) 5 mol% Eu3+
doped
CeO2 samples obtained via conventional refluxing and calcined at 500°C.
151
Fig. 5.13 Elemental mapping of 1 mol% Eu3+
doped CeO2 samples, (a) overall
elemental mapping, (b) Ce, (c) Eu, and (d) O.
151
Fig. 5.14 EDS of (a) 0.5, (b) 1.0, (c) 2.0, and (d) 5 mol% Eu3+
doped CeO2 calcined
at 500°C.
152
Fig. 5.15 (a) TEM, (b) HRTEM images, (c) lattice fringes, and corresponding (d)
SAED pattern of 1EuCeSDS500°C.
153
Fig. 5.16 HRTEM images and lattice fringes of (a) 0.5, (b) 1, (c) 2, and (d) 5 mol%
Eu3+
doped CeO2 samples obtained via conventional refluxing and calcined
at 500°C.
154
Fig. 5.17 HRTEM images of 1EuCeSDS650°C at dirrerent magnications. 155
Fig. 5.18 UV-vis absorbance spectra of (a) 0.5, (b) 1, (c) 2 and (d) 5 mol % Eu3+
doped CeO2 calcined at 500°C for 2 h.
156
Fig. 5.19 UV-vis absorbance spectra of Eu3+
doped CeO2 powders obtained via
conventional refluxing method, (a) as-prepared and calcined at (b) 500°C
(c) 650C, and (d) 800C for 2 h.
15

xx
Fig. 5.20 UV-Vis absorbance spectra of 1 mol% Eu3+
doped CeO2 powders obtained
via microwave refluxing method, (a) as-prepared and calcined at (b)
500°C, (c) 650C, and (d) 800C for 2 h.
158
Fig. 5.21 PL (A) emission and (B) excitation spectra of Eu3+
doped CeO2 obtained in
conventional refluxing method, and calcined at (a) 500°, (b) 650C, (c)
800C, and (d) 1000C for 2 h.
159
Fig. 5.22 PL (A) emission and (B) excitation spectra of (a) 0.5, (b) 1, (c) 2, and (d) 5
mol % Eu3+
doped CeO2 obtained via conventional refluxing method and
calcined at 800°C for 2 h.
160
Fig. 5.23 Energy transfer mechanism from CeO2 host to Eu3+
ions. 161
Fig. 5.24 Fluorescent microscope images of 1 mol% Eu3+
doped CeO2 obtained via
conventional refluxing method, and calcined at 800°C, excited at
wavelengths of (a) 350 nm, (b) 405 nm, and (c) 532 nm.
162
Fig. 5.25 High resolution XPS spectrum of the Ce 3d core level regions for the 1
mol% Eu3+
doped CeO2 obtained via conventional refluxing method and
calcined at 500°C for 2 h.
163
Fig. 5.26 High resolution XPS spectra of the (a) O1S and (b) Eu 3d core level
regions for the 1 mol% Eu3+
doped CeO2 obtained via conventional
refluxing and calcined at 500°C for 2 h.
164
Fig. 5.27 (A) H2 consumption as a function of temperature, and (B) NH3-TPD
profiles for (a) pure CeO2 and (b)1 mol% Eu3+
doped CeO2 calcined at
500°C for 2 h.
166
Fig. 6.1 Time profile of Cr(VI) removal with 1SmCeSDSasp without adjustment of
pH. The initial Cr(VI) concentration and the amount of adsorbent were 100
mgL-1
and 10 gL-1
, respectively. (b) Effect of pH (varied from 1.5 to 8) on
the Cr(VI) adsorption by 1SmCeSDSasp (time = 60 min, initial Cr(VI)
conc. = 100 mg L-1
, and amount of 1SmCeSDSasp= 10 gL-1
).
175
Fig. 6.2 Effect of (a) adsorbent dose and (b) adsorbate concentration on % Cr(VI)
adsorption by 1SmCeSDSasp (time: 60 min, initial Cr(VI) conc. 100 mgL-1
,
and without any further pH adjustment).
177
Fig. 6.3 Maximum adsorption capacity of 1SmCeSDSasp, variation with time (in
h), initial Cr (VI) conc 100 mg L-1
, amount of 1SmCeSDSasp 2 g L-1
, at pH 2.
178
Fig. 6.4 (a) Langmuir and (b) Freundlich adsorption isotherms for Cr(VI)
adsorption by 1SmCeSDSasp.
179
Fig. 6.5 Pseudo-first and (B) pseudo-second order kinetics for Cr(VI) adsorption by
1SmCeSDSasp.
181
Fig. 6.6 (a) Effect of 1SmCeSDSMW500 catalyst amount on UV–Vis spectra of
AO7 (photodegradation % in the inset) (b) Effect of initial pH value on the
photocatalytic degradation efficiency of AO7 in 10 h. during the
decolorization process at solar irradiation time of 1 h. pH neutral.
187
Fig. 6.7 (a) Effect of calcination temperatures of 1SmCeSDSMW catalyst on UV–
Vis spectra of AO7 (photodegradation % in the inset) during the
189
xxi
decolorization process at solar irradiation time of 1 h. pH neutral. (b)
Evolution of the UV–vis spectra with irradiated time for the photocatalytic
degradation of AO7 in aqueous solution in the presence of CeO2: Sm3+
catalyst calcined at 500°C. pH neutral.
Fig. 6.8 The photo of AO7 solutions in the presence of 1SmceSDSMW500 as
catalyst under solar irradiation at different time intervals (h) as marked
therein.
190
Fig. 6.9 FT–IR spectra of AO7 (a) isolated, (b) adsorbed on catalyst, and after
photodegradation at (c) 2 h, and (d) 6 h of irradiation.
191
Fig. 6.10 Control experiments of photocatalytic degradation of AO7 with the
addition of different radical scavengers: Isopropanol (scavenger for
hydroxyl radicals), CrO3 (scavenger for electrons), sodium oxalate (SOX,
scavenger for holes), and benzoquinone (BQ, scavenger for superoxide
radicals), over the optimum 1SmCeSDSMW500 under solar light
irradiation for 6 h.
192
Fig. 6.11 Proposed pathway for photocatalytic AO7 degradation. 194
Fig. 6.12 Transmittance spectra showing autocatalytic behavior of (a) Sm3+
doped
CeO2 calcined at 500C. Photographs [in the inset of (c)] of the aqueous
solution of the sample in absence and presence of H2O2 showing
characteristic reversible color changes. Transmittance spectra showing blue
shift for the CeO2 (blue line) and Sm3+
doped CeO2 samples (black: as-
prepared; and red: calcined at 500C) after addition of H2O2 (b) 30 min, (c)
3 days, and (d) 30 min and 10 days (showing shift difference).
199
Fig. 6.13 UV-visible transmittance spectra of (a) pure, Sm3+
and Eu3+
doped CeO2
calcined at 500°C for 2 h, after 3 days of H2O2 treatment, and (b) 0 to 10
mol% Sm3+
doped CeO2 calcined at 500°C for 2 h.
200
Fig. 6.14 Cell viability by MTT assay of mesoporous CeO2 and Sm3+
doped CeO2
calcined at 500°C after 1, 3 and 5 days incubation in MG-63 cell lines.
202
xxii
List of Tables
Table No. Title Page
No.
Table 1.1 Non-siliceous mesoporous oxides prepared by soft-templating
methods (adopted from ref. 264)
16
Table 1.2 Non-siliceous mesoporous oxides prepared by hard-templating
methods (Adopted from ref. 264)
17
Table 1.3 Mesostructured materials with different interactions between the
surfactant and the inorganic framework.
22
Table 2.1 List of chemicals used in the synthesis of pure as well as Sm3+
or
Eu3+
doped CeO2.
43
Table 2.2 Notations used in this thesis for pure, Sm3+
or Eu3+
doped CeO2
samples.
47
Table 3.1 Crystallize size and lattice parameters of the as-prepared CeO2
powders, (a) without, and (b) with surfactant.
67
Table 3.2 Crystallize size and lattice parameters of the 100CeSDSasp sample
and calcined at different temperatures.
69
Table 3.3 Crystallize size and lattice parameters of as-prepared 100CeSDSMW
samples and calcined at (b) 500C (c) 650C, and (c) 800C.
71
Table 3.4 Surface area, pore diameter and total pore volume of 100Ce sample
calcined at different temperatures.
72
Table 3.5 Surface area, pore diameter, and total pore volume of 100CeSDS
samples calcined at different temperatures.
72
Table 3.6 Surface area, pore diameter, and total pore volume of 100CeSDSMWasp
and the samples calcined at (b) 500C and (c) 650C.
74
Table 3.7 Band gap values of 100Ce, 100CeSDS and 100CeSDSMW samples
calcined at different temperatures.
79
Table 3.8 TPD data of 100Ce500 and 100CeSDS500. 85
Table 3.9 Comparison of TPR data of 100Ce500 and 100CeSDS500 samples. 86
Table 4.1 Weight loss% observed in as-prepared Sm3+
doped CeO2 samples
prepared through conventional refluxing method using SDS as
surfactant.
94
Table 4.2 Weight loss % of Sm3+
doped as-prepared CeO2 samples prepared
through without refluxing and microwave refluxing method.
94
Table 4.3 Weight loss % of Sm3+
doped CeO2, synthesized using DDA and PEG
assisted route by conventional refluxing method.
97
Table 4.4 Crystallite size and lattice parameters of Sm3+
doped CeO2
nanopowders.
99
Table 4.5 Crystallites size and lattice parameter values of Sm3+
doped CeO2
nanopowders calcined at different temperatures.
101

xxiii
Table 4.6 Crystallites size and lattice parameter values of 1 mol% Sm3+
doped
CeO2 powders synthesized via different routes.
102
Table 4.7 Crystallites size and lattice parameter values of 1 mol% Sm3+
doped
CeO2 powders synthesized using different surfactants.
103
Table 4.8 Comparison of N2 gas adsorption results for mesoporous Sm3+
doped
CeO2 nanopowders calcined at different temperatures.
104
Table 4.9 N2 gas adsorption results for mesoporous 1 mol% Sm3+
doped CeO2
nanopowders calcined at different temperatures.
106
Table 4.10 N2 gas adsorption results for mesoporous 1 mol% Sm3+
doped CeO2
nanopowders calcined at different temperatures.
107
Table 4.11 N2 gas adsorption results for mesoporous 1 mol% Sm3+
doped CeO2
nanopowders calcined at different temperatures.
108
Table 5.1 Weight loss % of Eu3+
doped CeO2 samples. 138
Table 5.2 Crystallite size, lattice parameters and lattice volumes of (a) 0.5, (b)
1.0, (c) 2.0, and (d) 5 mol% Eu3+
doped CeO2 samples obtained via
conventional refluxing method and calcined at 500°C for 2 h.
141
Table 5.3 Crystallite size, lattice parameters and lattice volume of 1 mol%
Eu3+
doped CeO2 samples obtained via conventional refluxing
method.
143
Table 5.4 Crystallite size, lattice parameters and lattice volume of
1.0EuCeSDSMW, 1.0EuCeSDSMW500, and 1.0EuCeSDSMW800.
144
Table 5.5 BET surface area, pore volume, and pore size of Eu3+
doped CeO2
samples obtained via conventional refluxing and calcined at 500°C.
146
Table 5.6 BET surface area, pore volume, and pore diameter of 1 mol% Eu3+
doped CeO2 samples calcined at different temperatures.
147
Table 5.7 BET surface area, pore volume and pore diameter of 1 mol% Eu3+
doped CeO2 samples obtained microwave refluxing route.
148
Table 5.8 Bandgap energy of (a) 0.5, (b) 1, (c) 2 and (d) 5 mol % Eu3+
doped
CeO2 obtained in conventional reflux method and calcined at 500°C
for 2 h.
156
Table 5.9 Bandgap energy of Eu3+
doped CeO2 powders obtained in
Conventional and Microwave refluxing method (a) as-prepared and
calcined at (b) 500°C (c) 650C and (d) 800C for 2 h.
158
Table 6.1 Comparison of Cr(VI) uptake by different pure and doped CeO2
nanopowders.
174
Table 6.2 Langmuir and Freundlich isotherm parameters for Cr(VI) adsorption
by 1SmCeSDSasp.
180
Table 6.3 Kinetic parameters for pseudo-first order and pseudo-second order
kinetic models.
182
Table 6.4 Comparison of photocatalytic degradation % of AO7 by different
CeO2 nanopowders during the decolorization process at solar
irradiation time of 1 h. pH neutral.
186
Chapter 1 General Introduction
1
Chapter 1
General Introduction
Outline: This chapter comprised a general introduction and thorough literature survey on
cerium oxide and its composite oxides including structural, properties, synthesis strategies
and potential applications. A short introduction of nanomaterials is also included. In addition
an extensive discussion of synthesis and application of mesoporous materials has been
discussed. Synthesis of mesoporous CeO2 and CeO2-based oxides via templating method
particularly, both the soft-templating and hard–templating methods are reviewed.
Applications of mesoporous CeO2 and CeO2-based oxides were also briefed with prominence
to adsorption and removal of organic pollutants from aqueous solution. The main objectives
of the present work are summarized towards the end of this chapter.
1.1. Historical Background
Rare earth (RE) elements has been considered as an ‘industrial vitamin’ and a ‘treasury’
of new materials due to their wide applications in technical progress and the development of
traditional industries along with information and biotechnology.1,2
Because of the well
shielded (by the filled 5s2 and 5p
6 shells) and partially filled 4f shell, the chemistry of rare
earth differs from main group elements and transition metals.1-3
This shielding is mainly
responsible for the unique catalytic, magnetic and electronic properties of the rare earth. In the
last decade rare earth elements have attracted to accomplish new types of applications due to
their unique features which are not possible with transition and main group metals.2,3
The
name ‘‘rare earth’’ is rather misleading since the lanthanides are neither ‘‘rare’’ nor ‘‘earth’’
like in properties.4 The name rare earths referring to elements to the difficulty in obtaining the
pure elements, and not to their relative abundances in the Earth's crust. Hence the name rare
earth has origins as they are never found as free metals in the Earth's crust and pure minerals
Chapter 1 General Introduction
2
of individual rare earths also do not exist. They are found as oxides which have proved to be
particularly difficult to separate from each other, especially to 18th
and 19th
century chemists.
All of the rare-earth elements are actually more abundant than silver, and some are more
abundant than lead. Rather, the name ‘‘rare earth’’ connotes that these elements were isolated
from uncommon minerals. Rather the term lanthanide, is the least confusing which means ‘‘to
lie hidden’’ and it originates from the fact that lanthanum was first discovered ‘‘hidden’’ in a
cerium containing mineral.4 According to IUPAC rare earths are consist of a set of seventeen
chemical elements, the fifteen lanthanides along with scandium and yttrium.5,6
Cerium is the
most abundant element among the rare earth family, which has crustal concentration (66.5
ppm) even more than that of copper (60 ppm) or tin (2.3 ppm).7,8
It was discovered from
cerite in 1803 by Jons Jakob Berzelius and Wilhelm Hisinger in Sweden, and Martin Heinrich
Klaproth in Germany.9 It was named after the dwarf planet Ceres, which was again named
after the Roman goddess of agriculture (particularly the growth of cereals).10
However, it was
not until 1839–1843 that the Swede C.G. Mosander first separated these earths into their
component oxides; thus ceria was resolved into the oxides of cerium and lanthanum and a
mixed oxide ‘didymia’ (a mixture of the oxides of the metals from Pr through Gd).11
Cerium dioxide commonly known as “ceria (CeO2)”, has been extensively researched in
chemistry, physics, material science, ceramic and biology has confirmed it unique and
irreplaceable role since the 1980s, when it was first employed as an oxygen storage
component of three way catalysts formulations,12-15
due to its ability of rapidly switching
its oxidation state under the reaction environment.16
Latter the application of ceria-based
materials in TWCs has been also reviewed by several authors.17-19
Trovarelli and coworkers
did a lot of work on the (redox) chemistry and catalysis of ceria-based materials.20,21
CeO2
because of its very interesting electrical properties is also consider as one of the most
important electrolyte material in solid oxide fuel cells.22-30
Understanding of CeO2 from this
point of view has enormously increased its technological important in the last decades and is
considered as one of the essential rare earth oxides.
In this context it is necessary to look into a number of unique properties of CeO2 such as
high mechanical strength, oxygen ion conductivity, and oxygen storage capacity31-33
strong
absorption and photoluminescence in the UV-vis range,34-44
high refractive index, good
transmission in visible and infrared regions, strong adhesion, and high stability against
Chapter 1 General Introduction
3
mechanical abrasion, chemical attack and high temperatures, high hardness,16,45-49
high
dielectric constant (ɛ=26) and wide-energy-gap (Eg = 5.5 eV).50,51
In addition to the above
mentioned application there are significant examples where ceria bestowed with such unique
properties have widely applied as low-temperature water–gas shift (WGS) reaction,33,52-59
oxygen sensors,60-62
oxygen permeation membrane systems,63-65
solar cells,66
high temperature
ceramics,67
glass polishing materials,31,39,68,69
sunscreen materials,70,71
UV-shielding
materials,72-75
hydrogen storage materials,76
free radical scavenging activity,77,78
antioxidant
agent,79,80
and luminescence.81,82
Beside this major application they are also currently being
used for the treatment of environmental pollutants for example remove organic and inorganic
pollutants from water. It was reported by several authors that CeO2 showed excellent removal
capacities of Cr(VI) from aqueous solution.83-86
The removal of organics pollutant such as
acid orange 7 from waste water by CeO2 has also been reported.87-90
Motivated by both of
their excellent properties and extensive applications, much attention has been directed to the
controlled synthesis of CeO2 materials.
1.2 Cerium Dioxide (CeO2): Structure and Properties
1.2.1. Crystal structure of CeO2
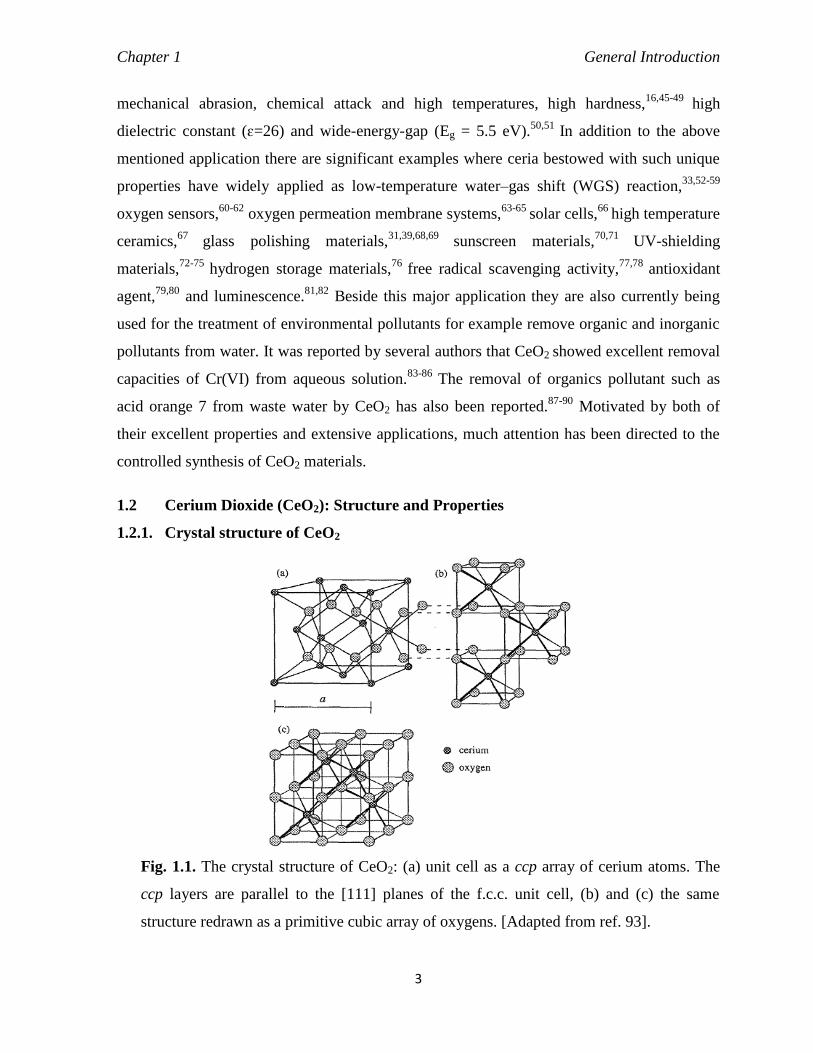
Fig. 1.1. The crystal structure of CeO2: (a) unit cell as a ccp array of cerium atoms. The
ccp layers are parallel to the [111] planes of the f.c.c. unit cell, (b) and (c) the same
structure redrawn as a primitive cubic array of oxygens. [Adapted from ref. 93].

Chapter 1 General Introduction
4
CeO2 is known to crystallize in the cubic fluorite crystal structure with space group
Fm3m over the temperature range from room temperature to the melting point.91
Figure 1.1
illustrates the structure of the CeO2, which consists of a face-centered cubic (f.c.c.) unit cell of
cations with anions occupying the octahedral interstitial sites.91,92
In this structure each cerium
cation is coordinated by eight equivalent nearest-neighbor oxygen anions at the corner of a
cube, while each oxygen anion is tetrahedrally coordinated by four nearest neighbor cerium
cations.93
This can also be seen as a cubic close-packed array of the metal atoms with oxygens
stuffing all the tetrahedral gaps. Figure 1.1 also showed that the eight coordination sites are
alternately empty and occupied by a cation which revealed that there are large amount of
vacant octahedral gaps in the structure and this become a significant feature when movement
of ions through the defect structure is considered. Even after losing considerable amount of
oxygen, CeO2 shows strong tendency to remain in the fluorite-structured lattice, which caused
to an elevated number of oxygen vacancies to stabilize the structure.
1.2.2. Defect structure of CeO2
A perfect crystal is an idealization; there is no such thing in nature. Atom arrangements
in real materials do not follow perfect crystalline patterns. There is also a fundamental physical
reason why the crystal is imperfect.94
Ceria in the cubic fluorite structure exhibits a few
defects,91
which influenced it many properties such as luminescence, conductivity, diffusion and
many other applications. The crystal lattice defects can be classified by their dimension. The 0-
dimensional defects alters the crystal pattern at a single point and affect isolated sites in the
crystal structure, hence it’s also called point defects. These types of defects are essentially
collections of atoms in non-regular lattice positions (interstitials), vacant lattice sites, and
occurrence of impurity atoms instead of host position. The 1-dimensional defects are termed
dislocations. They are lines along which the crystal pattern is broken. The 2-dimensional defects
are the external surface and the grain boundaries along which distinct crystallites are joined
together. The 3-dimensional defects alter the crystal pattern over a finite volume and also include
large voids or inclusions of second-phase particles. In general, there are two types of defects
associated in CeO2 lattice called intrinsic and extrinsic defects. Intrinsic defects is caused in a
crystal due to thermal disorder or can be created by reaction between the solid and the
surrounding atmosphere while extrinsic defects are formed by impurities incorporated in hosts
during its synthesis, introduction of alliovalent dopants or by the oxidation-reduction process.93
Chapter 1 General Introduction
5
1.2.2.1. Intrinsic defect
An intrinsic defect is formed if some of the lattice points in a crystal are unoccupied
i.e. an atom is missing in the crystal and creating a vacancy, or when an atom occupies an
interstitial position between the lattice point. Two most common types of intrinsic defects are
observed in ionic materials, Frenkel and Schottky defects. Frenkel defect arise when an atom
is displaced from its regular site to an interstitial site and creating a vacancy at the original
site. However, it is very unlikely to form oxygen Frenkel defetct. The other type of intrinsic
defect is Schottky defect which are formed when oppositely charged ions leave their lattice
sites and creating vacancies. In this case, vacancy defects must be formed in stoichiometric
units, to maintain an overall neutral charge in the lattice. In general when the anion and cation
differ significantly in size and the lattice polarization is pronounced leads to Frenkel disorder
whereas similar sized anions and cations results in Schottky disorder. In close packed
materials an interstitial ion can accommodate in the little lattice space available in the crystal
hence Frenkel defect is not favored in these materials, whereas CeO2 bearing open structure
readily exhibit Frenkel defect by forming a defect pair. The three possible intrinsic disorders
in stoichiometric CeO2 can be expressed by using Kröger-Vink notation.95
CeCeX + 2OO
X ↔ VCe′′′′ + VO
∙∙ + CeO2 Schottky (1.1)
CeCeX ↔ Cei
∙∙∙∙ + VCe′′′′
Anion Frenkel (1.2)
OOX ↔ OO
′′ + Ov∙∙ Cation Frenkel (1.3)
In ceria, the energies of anion Frenkel defects (2.81 eV) are lower than that of cation Frenkel
defects (8.86 eV/per defect) and Schottky defects (3.33 eV). Hence, the most likely form of
intrinsic disorder is anion Frenkel.
1.2.2.2. Extrinsic defects (disorder) in CeO2
Extrinsic defects appear in the compounds by impurities from oxidation or reduction
of the lattices or by the introduction of aliovalent dopants if they are intentionally added to the
material. Essentially, extrinsic disorder includes reaction with gaseous species from the
environment that are constituents of the lattice and reaction with species from the
environment that are not local to the lattice whereas intrinsic disorder includes only thermally
activated defect processes there is no reaction with the environment. If the foreign atoms are
added intentionally into the lattice, they are called solutes if they are not added intentionally
Chapter 1 General Introduction
6
are called impurities. The type of the solute can be classified by two categories, a
substitutional solute when it occupied in a lattice sites or interstitial solute when it fill in an
interstitial site. Since the interstitial sites are relatively small, small atoms are often found in
interstitial sites whereas larger atoms are usually substitutional. In ceria the extrinsic defects
arises from the oxidation-reduction (redox) processes, which certainly produces
nonstoichiometry in lattices. The reduction of ceria in oxygen deficient environment can be
described by using so called “Kröger-Vink” notations.
2OOX + CeCe
X → 2Ov˙˙ + CeCe
X + O2(g) + 4e′ (1.4)
While the process of reduction in the hydrogen rich environments may be represent as,
OOX + 2CeCe
X + H2(g) → Ov˙˙ + 2CeCe
X + H2O(g) (1.5)
1.2.3. Oxygen storage capacity of CeO2
CeO2 is considered as one of the most important components industrially because of
its ability to undergo rapid redox cycles by releasing and storing oxygen,33,96
consequently
creating a high oxygen storage capacity.97
Oxygen storage capacity (OSC) is defined as the
ability of CeO2 to release oxygen under reducing conditions and absorb oxygen under
oxidizing conditions,98-100
which leads to the comparative ease of oxygen vacancy formation
in CeO2.101,102
The formation of oxygen vacancy defects removing the oxygen from CeO2
lattice, which induces the stoichiometry change from CeO2 to CeO2-x.91
In the
nonstoichiometric ceria it is generally agreed that the oxygen vacancy formation leads to an
increase of Ce3+
fraction in order to compensate the electro-neutrality of the lattice.103,104
In
the fluorite structure of CeO2 the oxygen atoms which are all in a plane, undergo rapid
diffusion as a function of the number of oxygen vacancies92,105 without changing its structural
type.106
Oxygen vacancies forming process can be described by the following defect reaction
OXO ↔ VO
●● + 2e′ +1
2O2(g) (1.6)
where OXO, VO
●● and 𝑒′ are oxide ions in the lattice, doubly charged oxygen vacancies, and
electrons in the conduction band made up of Ce 4f energy states, respectively.91
The ability to
undergo rapid exchange between the reduced and oxidized states enhances the process of the
oxygen vacancy formation. More defects are formed on increasing the Ce3+
concentration of
total cerium.107
Chapter 1 General Introduction
7
The remarkable oxygen storage capability of CeO2 is the consequence of a unique and
delicate balance between numerous factors such as structural (phase formation), kinetic (rate
of redox of Ce) and textural (presence of surface cerium sites) factors.108
To learn about the
oxygen storage behavior of CeO2, it is therefore great important to understand the mechanism
of oxygen vacancies formation in CeO2. The processes of oxygen vacancy formation involve
the Mars-van Krevelen (MvK) mechanism109,110
where the surface lattice oxygen may act as
an oxidant and can be summarized as follows:
A molecule at the surface accepts an oxygen atom from the ceria surface. A void
(vacancy) is created in the surface.
The vacancy migrates across the surface and eventually accepts an oxygen atom from
another molecule. The vacancy becomes annihilated.
According to the mechanism the capability of the material to take up and release oxygen
increases with increasing the number and mobility of oxygen vacancies. Hence any chemical
modification which improving the number of structural disorder (oxygen vacancies) should
provide a material with a higher oxygen storage capacity. The oxygen storage capacity of
ceria can be modified by two ways. The first one is by promoting the ceria reduction,111
and
the second one is the doping of foreign metals with other transition or rare-earth elements into
the ceria lattice.112
1.3. Modification of CeO2
Despite its wide applicability, pure CeO2 is associated with some drawbacks like
thermal sintering and deactivation of the redox properties, which strongly decreases the
oxygen storage capacity and catalytic activity of CeO2.113-115
Therefore, it is very necessary to
improve the thermal properties of CeO2 to avoid sintering and retention of it’s high surface
area at high temperatures for various applications. Thermal stability of CeO2 and doped CeO2
was investigated in detail by Pijolat et al.116
However, the drawbacks of pure CeO2 have been
eliminated by doping with different cations which significantly stabilize the CeO2 against
sintering and enhance the redox properties and chemical activity of pure CeO2. Ozawa et al.
reported that among many different cations, the incorporation of Zr into the CeO2 lattice is
very effective in the inhibition of the sintering.117
Recently the textural, structural,
morphological and catalytic activity of nanosized CeO2–MOx (M = Mg2+
, Al3+
, and Si4+
)
Chapter 1 General Introduction
8
mixed oxides have been investigated.118
They suggested that alumina could act as a very
effective surface stabilizer and CeO2–Al2O3 mixed oxides exhibited high surface area among
these mixed oxides. CeO2–Al2O3 mixed oxide also showed highest catalytic activity for CO
oxidation which might be due to its excellent textural/structural properties, good
homogeneity, and redox abilities.118
Tian et al. observed that doping of Fe (or Co, Ni) in CeO2
steep absorption peaks at lower energy ranging from 1.0 eV to 2.0 eV as compared with the
undoped CeO2, which could be used for visible light absorption applications.119
It is reported
that OSC and redox properties of CeO2 can be significantly improved by doping with
transition metals.120-126
Incorporation of transitions metals in CeO2 lattice also provide ultra-
high thermal stability, which is necessary to meet the requirements of high-temperature
catalytic reactions.127-128
Ce1-xMxO2 solid solution (M = Ti, Zr, and Hf) has been found to
exhibit high catalytic activity for hydrogen reduction and ethanol reforming reactions, which
make these nanomaterials efficient candidate for applications in catalysis and solid oxide fuel
cells.129
Kehoe et al. reported that the doping of CeO2 with divalent noble metal ions lead to
improved its reducibility and enhance the OSC.130
Transition and rare earth metal cations such
as Mn, Fe, Zr, Pr, La, and Sm were doped into the CeO2 lattice. Very recently, transition-
metals, like Cu, Co, Ni, Mn and Fe, were doped into CeO2 microspheres by Zhou et al. which
exhibited high catalytic activity and good recycling stability, as well as easy recovery.131
It has been observed that the ionic conductivity of pure CeO2 is very low, incorporation of
trivalent lanthanide into the CeO2 lattice lead to the formation of oxygen vacancies through
direct substitution of Ce4+
by Ln3+
as follows132-136
which considerably improves its ionic
conductivity.
Ln2O3 + 2CeCeX + OO
X → 2LnCe′ + 2CeO2 + VO
(1.7)
In the past decade due to the high ionic conductivity, ceria-based mixed oxides with
trivalent rare-earth such as La, Pr, Sm, Gd, Tb, and Er have been extensively studied as
electrolytes in the field of catalysis and solid oxide fuel cells.33,137-139
The catalytic activity
and ionic conductivity of CeO2 can be improved by doping with Gd2O3, Sm2O3, or La2O3,23,
140-144 the increased ionic conductivity of Gd- and Sm-doped CeO2 may be attributable due to
the stabilization of the cubic fluorite structure with oxygen vacancies.140

Chapter 1 General Introduction
9
Among the CeO2 electrolytes Sm3+
doped CeO2 (SDC) at fixed doping levels show
highest ionic conductivity23,145,146
as well as the highest stability against reduction.23,147
because Ce4+
and Sm3+
have similar ionic radii and electronegativity values, which also
facilitated the formation of Ce–Sm–O solid solutions.148
Therefore, it is proposed in some
literatures that when the dopant ion has a radius closest to the critical radius, the doped CeO2
will have the highest electrical conductivity.23,32,149
Hence it is important to consider the ionic
radius of dopant when selecting dopants to improve the OSC of any material. Sm3+
is the best
dopant for CeO2 in this regard. Moreover, the ionic radius of the trivalent europium (0.1066
nm)150
is also close to that of the Ce4+
(0.097 nm), which make it a convenient dopant for
ceria and allows it for an extensive solubility with the ceria lattice.151,152
Additionally, the
Eu3+
/Eu2+
redox pair has a potential of about 0.36 V, which is expected to promote the
formation and stabilization of oxygen vacancies for low Eu3+/
Ce atomic ratios.152
This
property resulted with high oxygen ion conductivity.153
Apart from this, photoluminescence is one of the most interesting features of the
lanthanide ions. Since the 4f electrons of lanthanide ions are well shielded by the filled 5s25p
6
sub-shells, the emission transitions yield line-like emission, which provide a high color purity
of the emitted light.154
The color of the emitted light depends on the lanthanide ion. For
instance, Sm3+
emit orange light, Eu3+
red light, Tm3+
blue light and Tb3+
green light.155
This
feature makes rare earth doped oxide nanoparticles the best phosphor material in comparison
with other inorganic metal oxide nanomaterials.155-157
It was found that the undoped CeO2
nanocrystals exhibits weak luminescence since Ce4+
ions have no 4f electron, which could be
remarkably enhanced by doping with rare earth ions required for imaging. CeO2 can be
advantageous of choosing as a one of the best luminescence host material for other rare earth
ions due to its strong light absorption through O2-
→Ce4+
charge transfer band and subsequent
energy transfer from host to the dopant. After the energy transfer is achieved from the CT
state of CeO2 to the doped rare-earth ions, the characteristic emissions of rare-earth ions are
expected.158,159
CeO2 serve as one of the best host materials for Sm and Eu due to their
comparable ionic radius as mentioned earlier. Sm3+
doped CeO2 nanoparticles are very
important in developing new luminescence devices in orange and red regions.160
The great
interest of Eu3+
luminescence is because of its major red emission. From which a wide
spectrum of colors can be generated by appropriate mixing since it is one of the three primary

Chapter 1 General Introduction
10
colors (namely, red, blue, and green). This strategy is in fact used for white light generation as
well.161
For this reason, Eu3+
has been thoroughly investigated as a luminescent activator in
many host lattices.162,163
Under such a hypothesis, many CeO2:RE (RE= Sm, Eu) materials
have already been investigated to exhibit excellent luminescent properties.151, 153, 159-161, 164-186
Hence the incorporation of lanthanide ion in to the ceria lattice leads to extend its traditional
applications to novel fields such as phosphors, bioimaging, and therapy, medical diagnosis,
electroluminescence, optical markers and even laser materials, phosphors, fluorescent tubes, etc.
1.4. Introduction of nanomaterials
Nanomaterials are such class of functional materials which having at least one
dimension less than 100 nanometers.187
Although nanotechnology is a new area of research,
nanomaterials are known to be used for centuries. For example the Lycurgus cup a glass cup
of 4th
century AD,188
represents one of the most outstanding example of the uses of
nanomaterials in earlier days to dye the glass articles, which appears green in reflected light
and red in transmitted light (Fig. 1.2). This effect is due to the presence of Au and Ag
nanocrystals in the walls of the cup. This renewed interest in nanomaterials research started
after the well-known lecture by the Nobel laureate Richard. P. Feynman in 1959.189
He stated,
“there is a plenty of room at the bottom” and indicated the vast potential of materials having
small dimensions.
Fig. 1.2. The Lycurgus cup appears (a) green in reflected light, and (b) red in transmitted light
and this cup is preserved in the British museum in London.

Chapter 1 General Introduction
11
Nanomaterials can be classified into four different classes according to Siegel,190
zero
dimensional, one dimensional, two dimensional and three dimensional nanostructures.
Zero dimensional (0-D): These nanomaterials have nano-dimensions in all the three
directions. Quantum dots are the perfect example of this kind of nanoparticles.
One dimensional (1-D): One dimension of the nanostructure will be outside the nanometer
range. These include nanowires, nanorods, and nanotubes.
Two dimensional (2-D): In this type of nanomaterials, two dimensions are outside the
nanometer range. Nano sheet, nano disk, nano flakes, ribbons and plates are few examples of
this kind of materials.
Three Dimensional (3-D): All dimensions of these are outside the nano meter range.
Materials in nanodimension exhibits exceptional properties which are caused by quantum
mechanics, small grain sizes, large grain boundary environments, large surface area,
interfacial volume fraction, high surface to volume ratio and other phenomena. Physical,
chemical, optical, mechanical, electrical and magnetic properties of the nanomaterials are
significantly different with respect to their bulk counterpart. As for example Fe2O3,
maghemite; in it bulk form due to magnetic properties used in disc drives as a recording
medium. However, in nanoparticulate form, these properties become “superparamagnetic”,
and as a result has led to new applications in MRI. Optical properties may change also
as mention above. An example of this is titanium dioxide in opaque in macroparticle form but
transparent in nanoparticle form. Properties of the nanoparticles can be controlled by
engineering the size, morphology and composition of the particles. Various effects which
control the properties of nanostructured materials are discussed below:191
1. Size effects: Size effects result if the crystallite size of the microstructure becomes
comparable with the critical length scales of physical phenomena (e.g. the mean free
paths of electrons or phonons, a coherency length, a screening length, etc.) which
modify the mechanical and optical properties.
2. Change of the dimensionality of the system: If two or one dimension of the building
blocks of a nanostructured material which possess thin needle-shaped or flat two
dimensional crystallites are comparable with the length scale of a physical

Chapter 1 General Introduction
12
phenomenon. Then it becomes a two- or one-dimensional system with respect to this
phenomenon.
3. Changes of the atomic structure: Atomic structures changes if a high density of
incoherent interfaces or other lattice defects such as dislocations, vacancies, etc. are
incorporated. As a consequence a defect associate solid differs structurally from a
defect-free solid with the same chemical composition.
4. Alloying of components: Large surface energy in small particles facilitates alloying
or mixing even in immiscible solids.
5. Temperature effects: The microstructures of nanostructured materials are seem to be
affected by one or both of the following two types of processes.
i. Grain growth: Grain growth in nanostructured materials is primarily driven by
the excess energy stored in the grain or interphase boundaries. Grain growth
studies of various nanostructured materials have been performed by using DSC, X-
ray diffraction, TEM, and Raman spectroscopy. For reducing the grain growth
several approaches have been proposed such as to slow down the growth kinetics
by reducing the driving force (the grain boundary free energy) or the grain
boundary mobility.
ii. Temperature-induced variations of the atomic structure: Materials with
nanometer–sized microstructures may be classified according to their free energy
into equilibrium nanostructured materials and nanostructured materials far away
from thermodynamic equilibrium. Properties altered by grain size include lowered
thermal conductivity, increased hardness, and even low temperature ductility in
some ceramics.
Nanocrystalline materials are characterized by their small crystallite size in the range of 2-20
nm, which are separated by their high angle grain or interface boundaries and, consequently,
by their large volume fraction of disordered region of grain boundaries. In so small particles,
usually defined as nanoparticles, 60-20 % of the total atoms from the surface of the particles.
The fraction of the surface atoms (φ) is a strong function of size and morphology of the
particle. Siegel performed a systematic analysis of φ as a function of average particle diameter
<D> with different thickness for grain boundary. According to the special surface and σ the

Chapter 1 General Introduction
13
surface energy density, the surface atoms in an isolated particle of size of a nanometer scale in
general assume
1. A lower atomic density,
2. A lower coordination number,
3. A lower symmetry, and
4. An enhanced interatomic distance than those for the core atoms.
Important characteristics and applications of nanomaterials
Nanomaterials are of particular interest in recent year because at this scale unique
optical, magnetic, electrical, and other properties emerge. As for example192
(i) Nanostructured materials are more ductile at elevated temperatures as compared to
the coarse-grained materials.
(ii) The shape and and size of nanomaterials are important parameters to control the
properties of nanostructured materials. In recent year a great research interest have
been devoted to develop nanowire, nanotube, nanodisc etc. to meet the desired
characteristics and hence applications.
(iii) Nanosized metallic powders have been used for the production of dense parts and
porous coatings. Cold welding properties combined with the ductility make them
suitable for metal-metal bonding especially in the electronic industry.
(iv) Nanostructured semiconductors are known to show various non-linear optical
properties which may lead to special properties.
(v) Very small particles have special atomic structures with discrete electronic states,
which give rise to special properties in addition to the superparamagnetism behavior.
(vi) Nanostructured metal oxide can be served as heterogeneous catalysts which offer
substantial advantages concerning activity, selectivity and lifetime in chemical
transformations and electrocatalysis (fuel cells).
Nanomaterials offers an extremely broad range of potential applications such as catalysts,
sensors, semiconductor devices with a wide band gap-energy, insulators of enhanced band
gap, tunable lasers of enhanced power, permanent magnets, information storage systems,
magnetic toner in xerography, ferrofluids, contrast agents in magnetic resonance imaging,
magneto optic or magneto resistance devices so on.
Chapter 1 General Introduction
14
1.5. Synthetic approaches to ceria based materials
An essential aspect of the preparation of ceria and ceria based oxides is the high purity
of the phase, high surface area, narrow particle size, and the good chemical homogeneity. A
wide variety of processes have been developed to synthesize these materials by both
conventional and non-conventional way. In general, ceria-based oxides are fabricated by the
decomposition of cerium (III and/or IV) inorganic salts, such as hydroxide, nitrate, halides,
sulfates, carbonates, formates, oxalates, acetates, and citrates.193,194
A number of synthesis
methods can be used to prepare CeO2 nanomaterials, such as precipitation method,195-204
sol–
gel method,205-207
hydrothermal or solvothermal method,208-211
surfactant-assisted method,212-
214 electrochemical deposition,
215-219 and so on. Each method has its own merit and demerit to
fabricate the nanopowder with respect to phase purity, uniform morphology desirable
composition and tunable surfaces. However, from the view point of industrial production of
process needs to be economically feasible and should not be more complex. In this contest,
the chemical precipitation is a simple and easily-operable method, which involves low cost,
high yield, good reproducibility and simple apparatus hence highly suitable for industrial
application. In chemical precipitation method the formation of ceria nanopowder is carried out
by applying alkali solution (NH4OH, NaOH and (NH2)2-H2O) or oxalic acid193, 220-222
into the
aqueous solution of inorganic cerium salt (Ce(NO3)3, CeCl3, CeSO4, and (NH4)2Ce(NO3)6)
followed by the calcination of precipitates hydroxide or oxalate gel. This method can produce
high quality nano-size powders and influence the morphology of the product by an
appropriate monitoring of some parameters, like the concentration of the aqueous solution, the
pH value of the medium, the nature of the precipitating agent, the reaction temperature and
the aging time.195-204,223
The use of surfactant-assisted routes has also gained lot of attention
recently for the synthesis of ceria and ceria based oxides with high specific surface area and
defined porosity.
In this study, a surfactant mediated chemical precipitation technique has been adopted
for the preparation of ultrafine, monocrystalline, high surface area ceria and ceria based mixed
oxide by using ceric ammonium nitrate as inorganic precursors followed by conventional
refluxing method. A comparison with the microwave reflux method is also reported. The
potential advantages of microwave reflux over conventional reflux method are rapid heating,
Chapter 1 General Introduction
15
penetrating radiation which leads to high-efficiency and very rapid formation of nanoparticles
with narrow size distribution, more uniform microstructure, and slight agglomeration.
In particular nanoporous materials have attracted intense attention because many of
the major applications in various fields such as adsorption, catalysis, separation, sensors and
energy storage are closely related to the pore structure. This class of materials offer uniform
pore size distributions, ordered pore networks, high surface areas, excellent permeability, and
better material stability. Many methods have been reported for the preparation of nanoporous
materials with precisely controllable pore structure. The most common methods are template-
based ones, including soft and hard template methods by using organic surfactants or solid
templates, respectively. However, it is still remain a challenge to develop nanoporous
materials with well-defined pore sizes, large surface areas for industrial, scientific, and
domestic applications.
1.6. Porous materials and their classification
Porous compounds or porous materials possess both the solid network matrix and
continuous ordered pores or voids as their name implies. The pores of the material can be
filled with liquid or gases. Porous structure could be described by means of various
parameters among which pore shape and pore size are most important. When the orders of the
pore or voids are of ≈1–100 nm, it’s called nanoporous materials. Generally, porous materials
can be classified into two types, when the pores connect to the outside of the materials it is
called open pore, whereas closed pores are isolated from the outside. According to IUPAC
convention, with respect to the pore size they can be further classified into three classes; (i)
microporous, having pore size less than 2 nm, (iii) macroporous, having pore size greater than
50 nm, and (iii) mesoporous having pore size in between micropore and macropore i.e.
typically between 2 and 50 nm.224,225
In comparison with microporous and macroporous
materials, mesoporous materials are of specific interest owing to their many unique
characteristics such as high stability, surface areas, tunable porosity, alternative pore shape,
approximate pore diameters and large pore volumes,226-234
which make them a prominent
candidates for wide variety of applications in the field of adsorbents, catalysts, ion-
exchangers, etc.235-244

Chapter 1 General Introduction
16
1.7. Synthesis of mesoporous materials
Since the scientists of Mobil oil corporation (USA) first reported a novel family of
ordered mesoporous silica materials MCM41 in 1992,245
significant attentions has been
devoted to the synthesis of mesoporous materials. They employed cetyltrimethylammonium
bromide, as a structure-directing agent for the synthesis of MCM 41 through supramolecular
templating pathways. This materials exhibits very large surface area (>1000 m2/g) and ordered
mesopores which endow them with potential applications in the field of catalysis and
adsorption. Their discovery not only developed a novel family of mesoporous materials but
also provide a detailed synthesis strategy for the formation of mesopore. A major problem of
these mesoporous siliceous materials are their chemical inertness, low mechanical strength,
does not possess redox properties which make them inactive in electrochemistry and
catalysis.246
On the other hand in contrast to silica-based mesoporous materials nonsiliceous
transition mesoporous materials exhibit many interesting properties due to their d-shell
electrons, ordered pore networks, variable oxidation states and internal surfaces with redox
properties.246
These characters, therefore, pave the way for valuable application in catalysis,
adsorption, energy conversion and storage, sensing, etc.247-253
Thus the fabrication of ordered
mesoporous nonsiliceous materials received tremendous interest in last decade. Among the
mesoporous non-siliceous materials, mesoporous metal oxides have attracted substantial
interest because of their broad functional properties and their potential industrial applications.
Table 1.1 Non-siliceous mesoporous oxides prepared by soft-templating methods (adopted
from ref. 264).
Product Template Structure Pore size
(nm)
Surface area
(m2 g
-1)
Ref.
Al2O3 SDS 0.8-6.0 112-810 254
TiO2 Dodecyl
sulphate
p6mm 2.7 128 255
CeO2 P123 Disorder 3.5 86–150 257, 258
Eu2O3 KLE Im3m 10–13 259
Gd2O3 SDS p6mm 2.5–3.0 287 260
Sm2O3 Hexadecyl
amine
Ia3d 2.4 122 261
Tb2O3 SDS p6mm 2.5–3.0 348 260

Chapter 1 General Introduction
17
Numerous methodologies have been developed to construct mesoporous
materials. The concept of templating provided a simple, reliable and the most obvious
approach for the direct and spontaneous formation of ordered mesoporous structures.
The templating methodology has been consider the principal synthetic route for this
class of materials and successfully applied to a diverse range of inorganic compositions.
The use of templates molecule to synthesize ordered mesoporous materials have
attracted great interest in the last few decades. A Template is briefly defined as a
material that can help to generate or design porosity in the matrix and act as structure
directing agent (SDA).262,263
The template induced route can be classified into two types.
The first one is termed as soft template route or the cooperative self-assembly of
inorganic precursors and amphiphilic surfactants. Surfactants and the block co-polymer
are commonly use as ‘‘soft’’ templates. A large variety of metal oxides including
lanthanides have been synthesized through Soft-templating methods are summarizes in
Table 1.1.264
The second route for mesoporous oxide synthesis is hard templating or
nanocasting method. Silica microsphere, polystyrene beads are commonly used as hard
templates to create porosity within the matrix.263
In this nanocasting approach pore
system of the template is replicate as a “negative image”. This synthesis strategy is
suitable for a wide variety of materials which cannot be obtained by soft-templating
processes. It was widely used to prepare many interesting metal oxides, summarizes in
Table 1.2.264
Both the templating method are discussed here elaborately.
Table 1.2. Non-siliceous mesoporous oxides prepared by hard-templating methods (Adopted
from ref. 264).
Product Template Structure Pore size
(nm)
Pore volume
(cm3
g-1
)
Surface area
(m2 g
-1)
Ref.
Al2O3 CMK-8 Ia3d 6.9 0.81 303 265
TiO2 SBA-15 p6mm 2.7 0.30 258 266
ZrO2 SBA-15 p6mm 2.9, 27 0.57 220 267
CeO2 SBA-15 p6mm 3.3–3.8 0.23–0.37 101–164 268
Chapter 1 General Introduction
18
1.7.1. Soft-matter templating
Soft templates such as supramolecular self-assemblies offer innovative strategies for
the preparation of mesoporous materials. Typically, in soft-templating route the
supramolecular templates molecule initially formed a self-assembly in the synthesis media,
the inorganic precursors then arrange themselves in regular fashion around the self-assembly
to generate well-ordered inorganic-organic composite solid this method usually include three
steps,263
first, the formation surfactant self-assembly, second is the organization of inorganic
precursor around this surfactant self-assembly, and third is the subsequent removal of the
organic template to create the mesostructured materials. The formation process basically
involve two different mechanism,238,239,244,269,270
either by cooperative self-assembly (CSA)
mechanism, which involved a simultaneous aggregation of self-assembled template molecule
along with pre added inorganic species or by true liquid crystal template (TLCT) mechanism,
in which the concentration of the surfactant is so high that under the prevailing conditions
(temperature, pH) a lyotropic liquid-crystalline phase is formed in the absences of the
inorganic precursor materials. However, to generate well developed mesopores it is essential
to remove the template from this inorganic–organic nanocomposite. Sintering in aerobic
atmosphere is the most widely used method applied to remove the organic template
completely. But this methods leads to loss of porosity for air sensitive materials. This problem
was overcome by using solvent extraction method, which very effectively eliminate the
surfactant without disturbing the structure. Generally, solvents like tetra hydro furan, ethanol,
dilute hydrochloride acid, ammonium acetate or ethylene diammine are used for this
purpose.271,272
Over the past decade a rich variety of templates have been employed for the synthesis
of mesostructured materials, which helps to create porosity in the matrix and acts as structure
directing agent (SDA). Surfactants, dendrimer, and block copolymers are commonly
employed as organic templates to obtain mesoporous materials via soft templating method.
Surfactants are amphiphilic molecule composed of chemically bonded non polar hydrophobic
‘tail’ and a polar hydrophilic ‘head’ group. Surfactant, also called surface-active agent as
because these molecules disrupts the cohesive energy at the surface and thus reduce the
surface tension. When the concentration of the amphiphilic molecule reaching the critical
micelle concentration (CMC) form aggregates called micelles.273
Normal micelle in aqueous
Chapter 1 General Introduction
19
solution arranges themselves such a way that the hydrophilic “head” of the surfactant remains
in contact with surrounding solvent whereas the hydrophilic “tail” stays away from the
solvent. In non-polar solvent amphiphilic molecules behave distinctly and form inverse
micelles. In such cases hydrocarbon tails are oriented outwards the solvent, while the polar
heads groups pointing toward the interior of the aggregate. The structure or geometry of the
micelle are generally spherical, but the size and shape of the surfactant micelle may varies of
different patterns such as cylindrical, lamellar, bilayer and so on274
(as Shown in Fig. 1.3)
depending upon the various factors like nature of template molecule, surfactant concentration,
temperature, pH and ionic strength of the reaction media temperature. Hence, this amphiphiles
molecule controls both the size and shape of the mesoporous materials.
Since the "tail" of most surfactants molecules are fairly similar, most commonly, they
are classified according to their polar head groups. Depending upon their polar head group
surfactant molecule can be classified into four types.
(a) Cationic: If the head group of the surfactant molecule bears a positive charge it is called
cationic surfactant. A large portion of cationic surfactant is belong to the amine salts and
alkyl quaternary ammonium salts. The common examples are cetyltrimethylammonium
bromide, dodecyl amine, N-dodecyl pyridinium chloride cetylpyridinium chloride etc.
They are dissociated in water into an amphiphilic cation and an anion most often like
halide.
(b) Anionic: Anionic surfactants contain negatively charged head group and dissociates in
water into an amphiphilic anion, and a cation. The anionic functional groups at their head
are belong to sulfate, sulfonate, carboxylates, and phosphate. Few common examples are
sodium dodecyl sulphate (SDS), sodium dodecyl benzene sulphonate etc.
(c) Nonionic: The head group of nonionic surfactant possesses no charge hence they does
not ionize in water. Many long chain alcohols exhibit this type of properties such as fatty
alcohols, cetyl alcohol, stearyl alcohol, and cetostearyl alcohol. Common examples of
non-ionic surfactants are pluronic P123, F127 etc.
(d) Zwitterion: When the single surfactant molecule head group contains both anionic and
cationic charge it is called zwitterion. Usually they behalves as cationic at low pH and
anionic at high pH. However, there are also some zwitterion surfactants which are
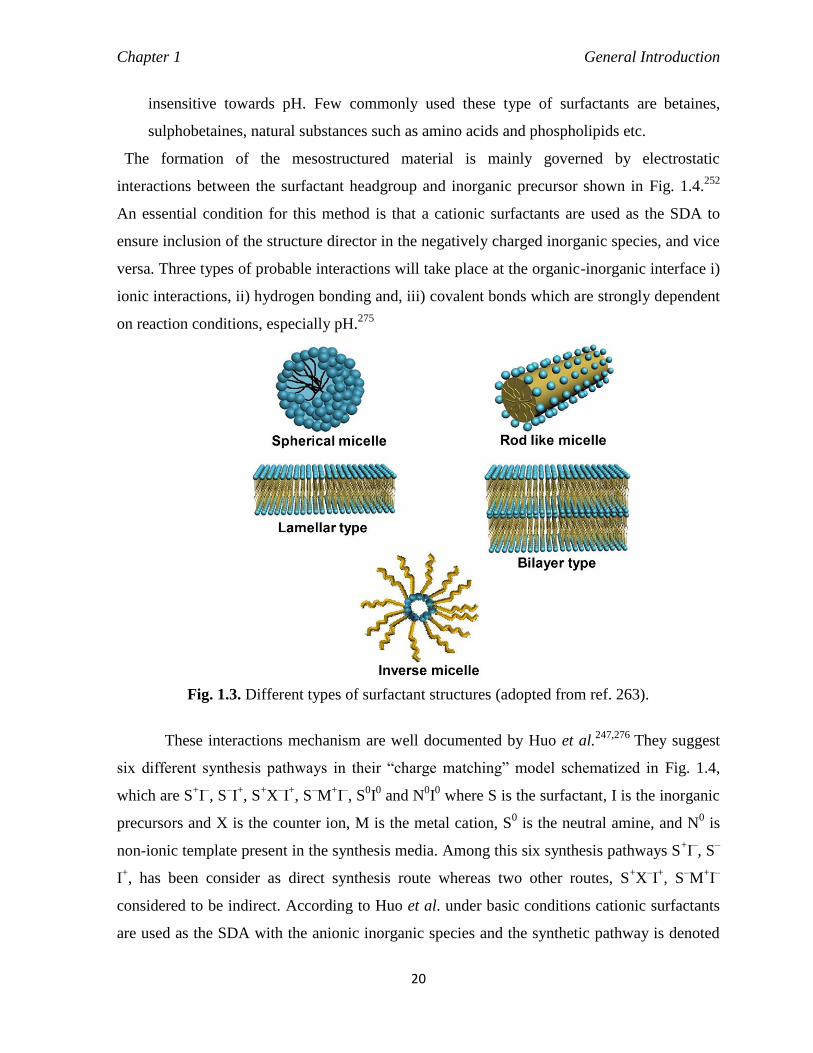
Chapter 1 General Introduction
20
insensitive towards pH. Few commonly used these type of surfactants are betaines,
sulphobetaines, natural substances such as amino acids and phospholipids etc.
The formation of the mesostructured material is mainly governed by electrostatic
interactions between the surfactant headgroup and inorganic precursor shown in Fig. 1.4.252
An essential condition for this method is that a cationic surfactants are used as the SDA to
ensure inclusion of the structure director in the negatively charged inorganic species, and vice
versa. Three types of probable interactions will take place at the organic-inorganic interface i)
ionic interactions, ii) hydrogen bonding and, iii) covalent bonds which are strongly dependent
on reaction conditions, especially pH.275
Fig. 1.3. Different types of surfactant structures (adopted from ref. 263).
These interactions mechanism are well documented by Huo et al.247,276
They suggest
six different synthesis pathways in their “charge matching” model schematized in Fig. 1.4,
which are S+I–, S
–I+, S
+X
–I+, S
–M
+I–, S
0I0 and N
0I0 where S is the surfactant, I is the inorganic
precursors and X is the counter ion, M is the metal cation, S0 is the neutral amine, and N
0 is
non-ionic template present in the synthesis media. Among this six synthesis pathways S+I–, S
–
I+, has been consider as direct synthesis route whereas two other routes, S
+X
–I+, S
–M
+I–
considered to be indirect. According to Huo et al. under basic conditions cationic surfactants
are used as the SDA with the anionic inorganic species and the synthetic pathway is denoted

Chapter 1 General Introduction
21
by S+I–. Conversely under acidic conditions the preparation can also take place with the
interaction of anionic surfactant (S−) and positive charge bearing inorganic species via S
−I+
approach. When the inorganic precursors and surfactant molecule possess the similar charge a
mediator ion X−
or M+ must be added opposite charge to that of the surfactant head group as
charge compensating species to ensure the interaction between the organic and inorganic
species. Meanwhile the non-ionic surfactant can also be used as templates for the attractive
interactions with metal precursor through hydrogen bonding or covalent bonding and giving
birth to the neutral path. Table 1.3 gives various examples of mesostructured inorganic
materials obtained following the above mentioned paths.
Fig. 1.4. Schematic representation of the different types of silica-surfactant interfaces
(adapted from ref. 252).
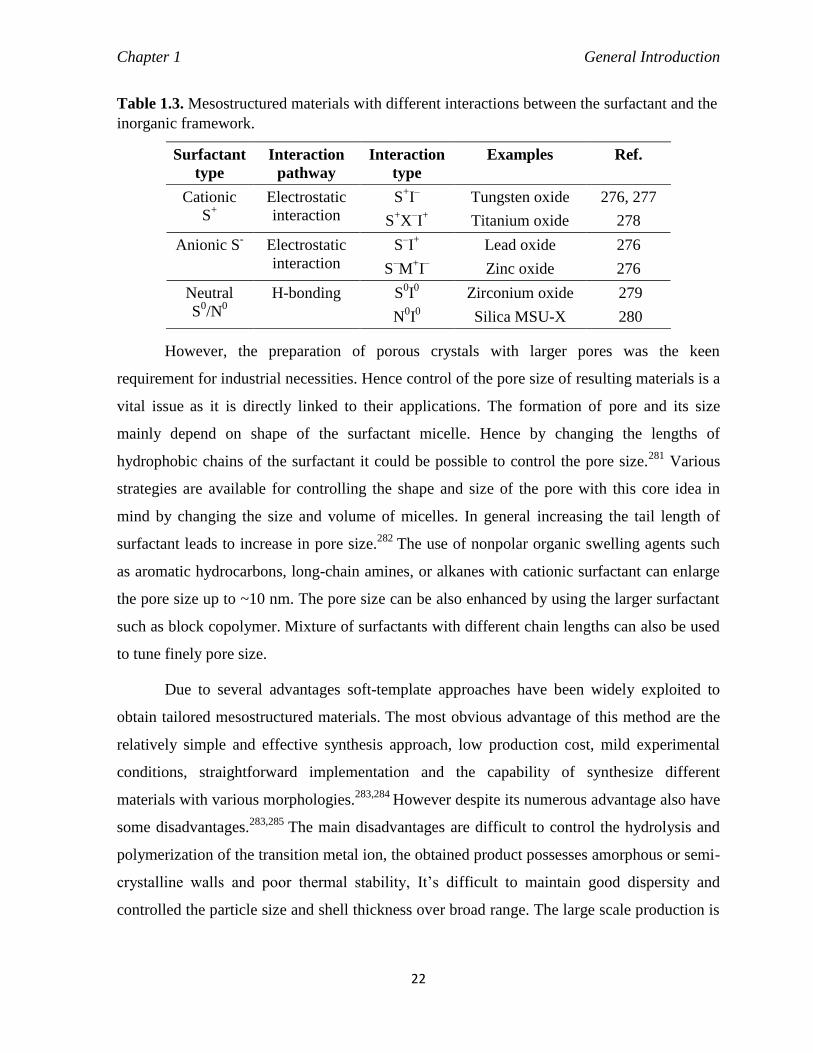
Chapter 1 General Introduction
22
Table 1.3. Mesostructured materials with different interactions between the surfactant and the
inorganic framework.
Surfactant
type
Interaction
pathway
Interaction
type
Examples Ref.
Cationic
S+
Electrostatic
interaction
S+I– Tungsten oxide 276, 277
S+X
–I+ Titanium oxide 278
Anionic S- Electrostatic
interaction
S–I+ Lead oxide 276
S–M
+I– Zinc oxide 276
Neutral
S0/N
0 H-bonding S
0I0 Zirconium oxide 279
N0I0 Silica MSU-X 280
However, the preparation of porous crystals with larger pores was the keen
requirement for industrial necessities. Hence control of the pore size of resulting materials is a
vital issue as it is directly linked to their applications. The formation of pore and its size
mainly depend on shape of the surfactant micelle. Hence by changing the lengths of
hydrophobic chains of the surfactant it could be possible to control the pore size.281
Various
strategies are available for controlling the shape and size of the pore with this core idea in
mind by changing the size and volume of micelles. In general increasing the tail length of
surfactant leads to increase in pore size.282
The use of nonpolar organic swelling agents such
as aromatic hydrocarbons, long-chain amines, or alkanes with cationic surfactant can enlarge
the pore size up to ~10 nm. The pore size can be also enhanced by using the larger surfactant
such as block copolymer. Mixture of surfactants with different chain lengths can also be used
to tune finely pore size.
Due to several advantages soft-template approaches have been widely exploited to
obtain tailored mesostructured materials. The most obvious advantage of this method are the
relatively simple and effective synthesis approach, low production cost, mild experimental
conditions, straightforward implementation and the capability of synthesize different
materials with various morphologies.283,284
However despite its numerous advantage also have
some disadvantages.283,285
The main disadvantages are difficult to control the hydrolysis and
polymerization of the transition metal ion, the obtained product possesses amorphous or semi-
crystalline walls and poor thermal stability, It’s difficult to maintain good dispersity and
controlled the particle size and shell thickness over broad range. The large scale production is

Chapter 1 General Introduction
23
also difficult by this route as it need a large amount of surfactant. Furthermore it’s also quite
difficult to remove the complete template molecule.
1.7.2. Hard templating methods
In hard templating methods a porous solid like silica, zeolites, polystyrene beads,
Porous alumina membranes and polymer latex colloids are used as the template instead of
surfactant. Hard templating method, are also known as exotemplating or nanocasting involve
filling of the inorganic precursor inside the pores system of template molecule as a negative
image and in the and finally removal of the template by leaching with HF or NaOH solution
or by high temperature to create resultant materials. Hard template method have several
advantages283, 286
such as easy tunability of pore sizes and pore wall, the replication process is
easy to scale up, synthesis using mesoporous silica templates result good thermal stability
mesoporous metal oxides compound even at relatively high temperatures.283
The desired
mesostructures can be produced by choosing appropriate templates which make this route
suitable for synthesis of a wide variety of materials.264
On the other hand this synthesis
strategy is associated with few drawbacks also.283
In a hard templating process complete
filling of the silica template is very difficult as there occurred some interactions between the
silica template and metal ion precursor, through hydrogen bonding, Coulombic interactions,
coordinating interaction, or van der Waals.283, 287,288
This synthetic method is highly
expensive, complicated and unfit able for large scale industrial production as it involve
multiple preparation procedures. Moreover, the template removal processes is tedious and
often destroys or disorder the formed nanostructures as it involves the use of strong acids,
bases, or high-temperature calcination.
1.8. Mesoporous CeO2 and CeO2 based materials
Among these mesoporous materials mesoporous ceria (CeO2), is of particular interest
because of their unique structural and thermal properties, such as high surface area, uniform
pore size distribution, special interfaces, and well-defined pore topology along with high
oxygen storage capacity and facile Ce3+
↔Ce4+
redox cycle. The high surface area is helpful
for the high metal dispersion, and the pore channels help in the adsorption and desorption of
reactants and increase the effectiveness of the contact between adsorbent and adsorbate. Thus,
CeO2 mesoporous spheres with narrow pore distributions, high surface areas, well-defined
Chapter 1 General Introduction
24
morphologies, and rigid frameworks should have great advantages in confined-space and
environmental catalysis. Hence much effort have been directed for the construction of CeO2
mesoporous materials, the most common approach is the use of hard or soft sacrificial
templates. In addition the formation of CeO2 mesostructured without using any surfactant or
template has been also reported.
Terribile et al.289
first time reported the synthesis of high surface area mesoporous
ceria by a surfactant assisted route employing cetyltrimethylammonium bromide (C16),
myristyltrimethylammonium bromide (C14), or octadecyltrimethylammonium bromide (C18)
as cationic surfactant and CeCl37H2O as inorganic precursors. They noticed that surfactant
assisted route not only enhance the surface area but also allow the upper temperature limit to
be raised to 900°C. Xu et al.290
prepared a new mesoporous ceria catalyst with high surface
area of (109-182 m2g
-1) and tunable pore sizes of 5.1–5.4 nm through a soft-templating
method using cerium nitrate as a precursor and cetyltrimethylammonium bromide as a
template. Pavasupree et al.291
elucidate the formation of mesoporous CeO2 nanopowder by a
modified sol–gel method using laurylamine hydrochloride (LAHC) as surfactant and
Ce(O(CH2)3CH3)4 as inorganic precursors. The BET surface area and the pore volume of the
obtained nanopowder were found to be 73 m2 g
-1 and 0.113 cm
3 g
-1, respectively. Mesoporous
CeO2 with high surface area was prepared by Yuejnan et al.292
using CTAB as surfactant, Ce
(NO3)3 as the precursors and NaOH as the precipitating agent. It was found that the obtained
nano CeO2 after calcination at 400 °c resulted in high-surface 200 m2 g
-1 and showed good
thermal stability. Flowerlike CeO2 microspheres obtained via the glucose/acrylic acid system
exhibits high surface area, large pore volume and narrow pore size distribution of 211 m2g
-1,
0.32 cm3g
-1 and 3 nm, respectively. Liang et al.
293 have developed an effective method for the
fabrication of monodisperse CeO2 mesoporous spheres using simple inorganic salt
Ce(NO3)36H2O and organic acids C2H5COOH as structure-directing agents without any other
complex surfactants. These mesoporous CeO2 spheres have high specific surface area of 216
m2g
-1, which exhibits no significant change under different annealing temperatures revealing
the good thermal stability. Mesoporous CeO2 was prepared by Perkas et al.294
via
sonochemical method using sodium dodecyl sulfate (SDS) as a surfactant, Ce(NO3)39H2O as
the cerium source, and urea as a precipitating agent. Spherical mesoporous CeO2 nanoparticles
of different shape have been synthesized by Ho et al.295
via a simple solution route using
Chapter 1 General Introduction
25
ethylene glycol and poly vinylpyrrolidone as surfactant. Liang et al.296
synthesized both pure
and homogeneous La/Ce mixed oxides over a wide range of La:Ce-ratios by a reverse
microemulsion method using poly(ethylene glycol)-block-poly(propylene glycol)-block-
poly(ethylene glycol) as surfactant. Resulting materials exhibits well-defined nanostructure
and high surface areas of 110 m2g
-1 calcined at 450°C. Yuan et al.
297 successfully developed a
surfactant-assisted hydrothermal route for the preparation of mesoporous cerium oxides
nanorods CeCl37H2O as cerium oxide precursor and cetyltrimethylammonium bromide
(CTMABr) as surfactant. It was found that the surfactant concentration significantly influence
the final cerium oxide structures and surface area. Mesoporous nanoscale ceria have been
prepared by Zagaynov et al.298
via sol–gel method using cerium (III) nitrate or acetylacetonate
as cerium source dimethyloctylamine as surfactant or hydrolyzing agent and acetylacetone as
a chelating ligand. Ni et al.299
synthesized mesoporous CeO2 particles using cerium acetate
hydrate as inorganic precursors and Pluronic P123 or F127 tri-block copolymer as soft template.
Mesoporous ceria with high surface area of 224.7 m2g
-1 and ordered structure was
synthesized by Deeprasertkul et al.300
using MCM-48 as hard template via nanocasting
method. Roggenbuck et al.301
synthesized mesoporous CeO2 by nanocasting method using
CMK-3 carbon as a structure matrix. The obtained products exhibit high specific surface area
of 148 m2 g
-1 and uniform pores with a diameter of ca. 5 nm. Laha et al.
302 reported the
synthesis of highly ordered and thermally stable mesoporous cerium oxides by using
mesoporous silica templates. The thermal stability of the mesoporous CeO2 samples was also
investigated and it was found that the mesostructure does not collapse even at 700°C.
La or Pr-doped flower-like mesoporous CeO2 were prepared by Li et al.303
by
hydrothermally with the aid of glucose and acrylic acid. They have also showed that La or Pr-
doped mesoporous CeO2 showed higher catalytic activities for methane combustion than the
pure CeO2. Changlin et al.304 synthesized mesoporous ceria-zirconia solid solution by using
different surfactants such as pluronic triblock copolymer P123, Brij 56 and
cetyltrimethylammonium bromide (CTAB) as templates and the as-synthesized sample was
calcined at 500°C for 4 h. The ceria- zirconia solid solution obtained in Brij56 assisted route
showed highest surface area of 99 m2
g-1 and pore volume 0.17 cm
3 g
-1. After calcinations at
1000°C for 4 h, the BET surface area and the pore volume decrease to 14 m2g
-1 and 0.06
cm3g
-1, respectively. Hao et al.
305 successfully synthesized Fe
3+ doped mesoporous CeO2 with
Chapter 1 General Introduction
26
several compositions using Ce(NO3)3·6H2O and Fe(NO3)3·9H2O as raw materials and triblock
copolymer P123 as the template. They have also find out the photocatalytic activities of the
prepared samples by the decomposition of rhodamine B. The mesoporous 15% Ce−Fe−O
catalyst exhibit highest surface area of 146.6 m2 g
-1 and showed higher photocatalytic activity.
Zhang et al.306
synthesized a series of transition-metal-doped (Cu, Co, Ni, and Mn)
hierarchically mesoporous CeO2 nanoparticles through a colloidal crystal template strategy.
Kamimura et al.307
demonstrate the simple template-free synthesis of mesoporous ceria
with a high surface area up to 200 m2g
-1 based on the sol-gel method. Lu et al.
308 synthesized
mesoporous CeO2 without a template by the direct hydrothermal method using NaOH and
NH4OH solution. Li et al. 309
provided a novel strategy to prepare mesoporous nanorod like
ceria with high surface area of 121 m2g
-1 by microwave-assisted hydrolysis of
Ce(NO3)36H2O in presence of urea. Mesoporous CeO2 with hierarchical nanoarchitectures
was synthesized by Zhang et al.310
via a precursor method with different amino acids as
crystallization modifiers. Hierarchically mesoporous CeO2 nanoparticles were prepared by
Zhang et al.311 through a facile solvothermal strategy which involve the preparation of the
Ce(HCOO)3 nanoparticles, and then transformation from Ce(HCOO)3 to CeO2. The obtained
product exhibited very high surface area of 147.6 m2g
−1 and outstanding catalytic activities for
CO oxidation. Chen et al.312
successfully synthesized hollow mesoporous CeO2 via a solid–
liquid interfacial reaction between the Ce2(SO4)3 precursor and NaOH in ethanol at room
temperature. Neither additional surfactant molecules nor calcination was employed during the
whole preparation process. However until now, limited reports are available on the direct
template-assisted synthesis of CeO2 mesostructures, especially with narrow pore distributions,
rigid frameworks, and well-defined morphologies. Therefore, it is highly desirable to produce
mesoporous powder of CeO2 materials, which exhibits high surface area, and crystalline
framework, using an efficient, simple and economic method to meet the growing demand of
various applications.
1.9. Applications of ceria based materials
Since the beginning of the 1940’s cerium oxide (CeO2) was used significantly as an
efficient polishing agent by the glass industry.313,314
A huge amounts of the yearly production
of CeO2 is consumed for this purpose. The utilization of CeO2, as a vital component in three-

Chapter 1 General Introduction
27
way catalysts (TWC) constitutes it’s economically and technologically most important
application due to its high oxygen storage and release capacity.315-317
A significant amount of
cerium oxide is consumed annually for the preparation of three way catalyst to remove
pollutants from vehicle (auto-exhaust) emissions. CeO2-based oxides can be also used as a
promoter for the low temperature water-gas shift reaction.52
Another potential application of
CeO2-based materials is as electrolytes in solid oxide fuel cells (SOFC). Because of its redox
property, it can store and release oxygen under lean (oxygen rich) and rich fuel conditions,
respectively. Popular electrolyte use in solid oxide fuel cell are yttria stabilized zirconia
(YSZ) and scandia stabilized zirconia, but they have some limitation as they can work only at
high temperature and also exhibits insufficient electro catalytic activity for oxygen reduction
and poor ionic conductivity at intermediate temperature. The main features of CeO2
containing SOFC are low operating temperature, higher ionic conductivity, chemical
inertness, high crystalline-phase and chemical purity.318
Its potential redox chemistry, rapid
redox cycle between Ce3+
↔ Ce4+ and the existence of both Lewis acid and base sites on
surface make this oxide suitable as a catalyst for many chemical reactions. Further, due to
weak Lewis acid and stronger Lewis base property CeO2 can be used in various organic
synthesis. Pure ceria is widely used in several organic reactions, such as the dehydration of
alcohols, the alkylation of aromatic compounds, ketone formation, and aldolization, and in
redox reactions.319
In addition to these major applications, CeO2-based systems are also considered as one
of the most promising materials for environmental remediation application such as sorbents
for removal of hazardous anions and photocatalyst for the degradation of the organic dyes.
Cerium oxide is assumed to be one of the most outstanding adsorbents for removing
hazardous anions as because of its very low solubility in acid media and it did not elute during
the removal of hazardous ion.320
Recently, ceria nanoparticles exhibited excellent adsorption
capacity for the removal of arsenic321,322
and chromium(VI) in aqueous solutions.323, 324
Ceria
supported on carbon nanotubes was reported to have good arsenate325
and chromium326
adsorption capacity from aqueous solution due to their high surface area, excellent electron
transfer ability, small size, and easy surface-modification. Zhong et al. observed that 3D
flower-like ceria micro/nanocomposites exhibits outstanding As(V) and Cr(VI) removal

Chapter 1 General Introduction
28
capacity from water.84
There are significant examples where cerium oxide had shown a high
adsorption capacity for various anions, such as fluoride,327
arsenic,326, 84
and bichromate.323,324
Further CeO2 nanomaterials have also potential applications in the field of
photocatalysis. For example, Tang et al.328
demonstrated that CeO2 nanotubes exhibited a
markedly enhanced photocatalytic activity toward the degradation of aromatic benzene. The
photocatalytic degradation of dyes has been explored extensively by several research groups
[ref]. Both CeO2 and Fe3+
doped CeO2 exhibit an excellent photocatalytic performance for
degradation of acid orange 7 (AO7) in the presence of H2O2.87,329
Co-doped ceria nanorods330
and Cu2O/CeO2 composite331
showed stronger photocatalytical activity towards AO7
degradation under UV and visible light illumination, respectively. Several reports suggested
that ceria nanospheres are promising absorbents for the effective removal of heavy metal ions
such as Cr(VI) and organic dye such as RhB from wastewater.85
Chaudhary et al. reported that
ceria nanocrystals exhibit excellent autocatalytic behavior and photo-decomposition ability
for methylene blue under sunlight.332
Autocatalytic behavior of the CeO2 nanoparticles were
further studied by various authors.333,334
Because of their autocatalytical property and
excellent biocompatibility CeO2 nanoparticles can be used as antioxidant in many biomedical
applications such as retinal degeneration, oxidative stress, inflammation and prevention from
radiation damage.333, 335-340
Apart from this, one of the most interesting features of the lanthanide ions is their
photoluminescence because of their line-like emission which leads to high color purity of the
emitted light.154 Since Ce
4+ ions have no 4f electron it can be a promising luminescence host
material for other rare earth ions such as Eu, Sm, and Er, because of strong light absorption
through charge transfer (CT) transition O2-
→Ce4+
.164
Samarium doped CeO2 nanoparticles are
very important in developing new luminescence devices in orange and red regions.160 Hence
the lanthanide dopant imparts luminescence property to the CeO2 host, extending the
traditional applications of these materials to novel fields such as phosphors, bio imaging, and
therapy.341
CeO2 is also considered an ideal component for sunscreen materials as it exhibits
excellent ultraviolet radiation absorption properties.34
Therefore, it is highly desirable to
synthesize CeO2 nanoparticles with the mixed valence state (Ce3+
and Ce4+
) for
multifunctional applications.

Chapter 1 General Introduction
29
1.10. Objectives of the thesis
Literature survey reveals that ceria and ceria-based oxides have been extensively
investigated due to their varieties of applications including catalysis, solid oxide fuel cells,
and environmental remediation etc. Rare earth doped CeO2, which impart luminescence
property in the CeO2 host extending its application for nanophosphors, bio imaging etc. The
key for most of the above mentioned applications of CeO2 based materials is its extraordinary
ability to release or uptake oxygen by shifting some Ce4+
to Ce3+
ions.1,7,8
Better catalytic
performances of CeO2 have been reported in the presence of Ce3+
and oxygen vacancy
defects, which are potentially potent surface sites for catalysis.6-9
Therefore, it is highly
desirable to synthesize multifunctional CeO2 nanoparticles with the mixed valence state (Ce3+
and Ce4+
). Physicochemical properties and catalytic activities of CeO2 can be improved by
introducing lanthanide ions, which modifies the surface defects.7,16,17
The concentration of
single electron defects of Ce3+
ions and oxygen vacancies can be remarkably enhanced after
doping with Sm or Eu for charge compensation due to the Sm3+
/Eu3+
→ Ce4+
substitutions.18
Motivated by the unique properties and varieties of applications of ceria-based materials, the
present research work on synthesis of mesoporous CeO2 as well as Sm3+
or Eu3+
doped CeO2
has been taken-up with an especial emphasis of their structural characterization,
photoluminescence properties and their novel applications. This involves series of
experiments and measurements followed by a systematic analysis as follows:
To explore simple chemical route using cheaper metal inorganic precursor to derive a
high surface area mesoporous CeO2 by using inorganic metal precursor and a
surfactant.
Effect of introduction of surfactants to the synthesis systems on the thermal, structural,
optical properties, mesoporosity, and surface area of mesoporous pure CeO2.
Development of thermally stable high surface area CeO2 in mesoporous structure with
Sm2O3 and Eu2O3 as additives in selected compositions via the surfactant-assisted
route.
Thermal analysis of pure and doped as-prepared precursors.
Analysis of surface area, pore size, pore volume and morphology in inorganic-
template hybrids, and with microstructure, BET, FESEM and HRTEM studies.
Photoluminescence study of the doped CeO2 at selected temperatures.
Effects of the various amounts of Sm2O3 and Eu2O3 additives in the CeO2 host lattice.
Chapter 1 General Introduction
30
Complete characterization of structure, microstructure, and spectroscopic analysis of
selected specimens, with an emphasis on their applications.
Investigation of applications of selected samples in heavy metal Cr(VI) adsorption and
autocatalytic activity.
Photocatalytic degradation of organic dyes (AO7, methylene blue, and rhodamine B)
in aqueous system under natural solar light irradiation.
References
1. Z. Hu, S. Haneklaus, G. Sparovek and E. Schnug, Commun. Soil Sci. Plant. Anal., 2006, 37, 1381.
2. C. Bouzigues, T. Gacoin and A. Alexandrou, Acs Nano., 2011, 5, 8488.
3. C. Xu and X. Qu, NPG Asia Materials, 2014, 6,e90; doi:10.1038/am.2013.88.
4. A. S. Weber, A. M. Grady and R. T. Koodali, Catal. Sci. Technol., 2012, 2, 683.
5. W. H. Wells and V. L. Wells, Patty’s Toxicology, John Wiley & Sons,Inc., 2001.
6. K. A. Gschneidner and B. Evans, Van Nostrand’s Encyclopedia of Chemistry, John Wiley & Sons, Inc., 2005.
7. T. J. Ahrens, Global Earth Physics: a Handbook of Physical Constants, American Geophysical Union,
Washington, DC, 1995.
8. D. Lide, CRC Handbook of Chemistry and Physics, CRC Publishing Co., Boca Raton, FL, 88th edn, 2007.
9. J. Emsley, The Elements, Oxford University Press, Oxford, 1989.
10. G. Houtzager, Geıllustreerde Griekse Mythologie Encyclopedie, Rebo productions b.v., Lisse, 2003.
11. S. A. Cotton, Lanthanide and Actinide Chemistry John Wiley & Sons Ltd, 2006.
12. J. C. Summers and S. A. Ausen, J. Catal., 1979, 58, 131.
13. G. Kim, Ind. Eng. Chem. Prod. Res. Dev., 1982, 21, 267.
14. H. S. Gandhi, A. G. Piken, M. Shelef, and R. G. Delosh, SAE Paper, 1976, 760201, 55.
15. P. Fornasiero and A. Trovarelli, Catal. Today, 2015, 253, 1.
16. A. Trovarelli, C. de Leitenburg, M. Boaro and G. Dolcetti, Catal. Today, 1999, 50, 353.
17. J. Kaspar and P. Fornasiero, J. Solid State Chem., 2003,171, 19.
18. J. Kaspar, P. Fornasiero and M. Graziani, Catal. Today, 1999, 50,285.
19. M. Boaro, M. Vicario, C. de Leitenburg, G. Dolcetti and A. Trovarelli, Catal. Today, 2003, 77, 407
20. E. Aneggi, M. Boaro, C. de Leitenburg, G. Dolcetti and A.Trovarelli, J. Alloys Compd., 2006, 408–412, 1096.
21. E. Aneggi, C. de Leitenburg, G. Dolcetti and A. Trovarelli, Catal. Today, 2006, 114, 40.
22. M. Godickemeier and L. J. Gauckler, J. Electrochem. Soc., 1998, 145, 414.
23. K. Eguchi, T. Setoguchi, T. Inoue, and H. Arai, Solid State Ionics, 1992, 52, 165.
24. V. Esposito and E. Traversa, J. Am. Ceram. Soc., 2008, 91, 1037.
25. B. C. H. Steele, J. Power Sources, 1994, 49, 1.
26. B. C. H. Steele, Solid State Ionics, 2000, 129, 95.
27. S. D. Park, J. M. Vohs and R. J. Gorte. Nature, 2000, 404, 265.
28. Y. P. Fu and C.H. Lin, J. Alloy Compd., 2005, 389, 165.
29. D. Y. Chung and E. H. Lee, J. Alloy Compd., 2004, 374, 69.
Chapter 1 General Introduction
31
30. R. A. Rocha and E. N. S. Muccillo, Br. Ceram. Trans., 2003, 102, 216.
31. X. Feng, D. C. Sayle, Z. L. Wang, M. S. Paras, B. Santora, A. C. Sutorik, T. X. T. Sayle, Y. Yang, Y.
Ding, X. Wang and Y. S. Her, Science, 2006, 312, 1504.
32. H. Inaba and H. Tagawa, Solid State Ion, 1996, 83, 1.
33. A. Trovarelli, Catal. Rev. Eng., 1996, 38, 439.
34. S. Yabe and T. Sato, J. Solid State Chem., 2003,171, 7.
35. S. Tsunekawa, T. Fukuda, and A. Kasuya,. J. Appl. Phys., 2000, 87, 1318.
36. A. Ahniyaz, Y. Sakamoto and L. Bergstrom, Cryst. Growth Des., 2008, 8, 1799.
37. M. K. Devaraju, S.Yin, and T. Sato, ACS Appl. Mater. Interfaces, 2009, 1, 2694.
38. C. W. Sun, H. Li, H. R. Zhang, Z. X. Wang and L. Q. Chen, Nanotechnology, 2005, 16, 1454.
39. T. Morimoto, H. Tomonaga and A. Mitani, Thin Solid Films, 1999,351, 61.
40. R. X. Li, S. Yabe, M. Yamashita, S. Momose, S. Yoshida, S Yin and T. Sato, Solid State Ionics, 2002, 151, 235.
41. N. M. Bahadur, F. Kurayama, T. Furusawa, M. Sato, I. A. Siddiquey, M. M. Hossain and N. Suzuki, J.
Nanopart. Res., 2013, 15, 1390
42. S. Tsunekawa, R. Sahara, Y. Kawazoe and A. Kasuya, Mater. Trans. JIM, 2000, 41, 1104.
43. T. Masui, K. Fujiwara, K. I. Machida and G. Y. Adachi, Chem. Mater., 1997, 9, 2197.
44. E. K. Goharshadi, S. Samiee, and P. Nancarrow, J. Colloid Interface Sci., 2011, 356, 473.
45. D. Barreca, G. Bruno, A. Gasparotto, M. Losurdo, and E. Tondello, Mater. Sci. Eng. C, 2003, 23, 1013.
46. F. Zhang, S. W. Chan, J. E. Spanier, E. Apak, Q. Jin, R. D. Robinson and I.P. Herman, Appl. Phys.
Lett., 2002, 80, 127.
47. R. Suresh, V. Ponnuswamy and R. Mariappan, Appl. Surf. Sci., 2013, 273, 457.
48. Krishnan, T. S. Sreeremya and S. Ghosh, Cryst. Eng Comm., 2015, 17, 7094.
49. R. N. Blumenth, F. S. Brugner and J. E. Garnier, J. Electrochem. Soc., 1973, 120, 1230.
50. M. F. G. Sanchez, A. Ortiz, G. Santana, M. Bizarro, J. Pena, F. C. Gandarilla, M. A. A. Frutis and J. C.
Alonso, J. Am. Ceram. Soc., 2010, 93, 155.
51. G. Wang, Q. Mu, T. Chen and Y. Wang, J. Alloy Compd., 2010, 493, 202.
52. Q. Fu, A. Weber and M. Flytzani-Stephanopoulo, Catal. Letters, 2001, 77, 87.
53. Q. Fu, H. Saltsburg and M. Flytzani-Stephanopoulo, Science, 2003, 301, 935.
54. S. Carrettin, P. Concepcion, A. Corma, J.M.L. Nieto and V.F. Puntes, Angew. Chem. Int. Ed., 2004, 43, 2538.
55. R. K. Pati, I. C. Lee, S. C.Hou, O. Akhuemonkhan, K. J. Gaskell, Q. Wang, A. I. Frenkel,; D. Chu, L. G. S.
Riba and S. H. Ehrman, ACS Appl. Mater. Interfaces, 2009, 1, 2624.
56. H. He, H. Dai and C. T. Au, Catal. Today, 2004, 90, 245.
57. G. Jacobs, S. Khalid, P. M. Patterson, D. E. Sparks and B. H. Davis, Appl. Catal. A Gen., 2004, 268, 255.
58. P. Panagiotopoulou, J. Papavasiliou, G. Avgouropoulos, T. Ioannides and D.I. Kondarides, Chem. Eng. J.,
2007, 134,16.
59. Q. Yu, W. Chen, Y. Li, M. Jin and Z. Suo. Catal. Today, 2010, 158, 324.
60. H. J. Beie and A. Gnorich, Sens. Sensors Actuators B Chem., 1991, 4, 393.
61. P. Jasinski, T. Suzuki and H. U. Anderson, Sensors Actuators B Chem., 2003, 95, 73.

Chapter 1 General Introduction
32
62. N. Izu, T. Itoh, M. Nishibori, I. Matsubara and W. Shin, Sensors Actuators B Chem., 2012, 171, 350.
63. M. Stoukides, Catal. Rev. Eng., 2000, 42, 1.
64. X. Yin, L. Hong and Z. L. Liu, J. Memb. Sci., 2006, 268, 2.
65. F. Larachi, J. Pierre, A. Adnot and A. Bernis, Appl. Surf. Sci., 2002, 195, 236.
66. A. Corma, P. Atienzar, H. Garcıa and J. Y. C. Ching, Nat. Mater., 2004, 3, 394.
67. K. Eguchi, J. Alloys Compd., 1997, 250, 486.
68. S. Armini, J. D. Messemaeker, C. M. Whelan, M. Moinpour and K. Maex, J. Electrochem. Soc., 2008, 155, 653.
69. D. G. Shchukin and R. A. Carus, Chem. Mater., 2004, 16, 2287.
70. W. Wenwei, L. Shushu, L. Sen, X. Feng, and W. Xuehan, Rare Metals, 2010, 29, 149.
71. T. Masut, M. Yamamoyo, T. Sakata, H. Mori and G. Adachi, J. Mater. Chem., 2000, 10, 353.
72. S. Yabe, M. Yamashita, S. Momose, K. Tahira and T. Sato, Int. J. Inorg. Mater., 2001, 3, 1003.
73. N. Imanaka, T. Masui, H. Hirai and G. Adachi, Chem. Mater., 2003, 15, 2289.
74. Y. W. Zhang, R. Si, C. S. Liao and C. H. Yan, J. Phys. Chem. B, 2003, 107, 10159.
75. W. D. W. Duan, A. J. Xie, Y. H. Shen, X. F. Wang, F. Wang, Y. Zhang and J. L. Li, Ind. Eng. Chem. Res.,
2011, 50, 4441.
76. K. Sohlberg, S. T. Pantelides and S. F. Pennycook, J. Am. Chem. Soc., 2001, 123, 6609.
77. I. Celardo, J. Z. Pedersen, E. Traversa and L. Ghibelli, Nanoscale, 2011, 3, 1411.
78. S. Babu, A. Velez, K. Wozniak, J. Szydlowska and S. Seal, Chem. Phys. Lett., 2007, 442, 405.
79. A. Karakoti, S. Singh, J. Dowding, S. Seal and W. Self, Chem. Soc. Rev., 2010, 39, 4422.
80. A. Asati, S. Santra, C. Kaittanis and J. M. Perez, ACS Nano, 2010, 9, 5321.
81. J. Guzman, S. Carrettin and A. Corma, J. Am. Chem. Soc., 2005, 127, 3286.
82. P. Bera, A. Gayen, M. S. Hegde, N. P. Lalla, L. Spadaro, F. Frusteri and F. Arena, J. Phys. Chem. B., 2003,
107, 6122.
83. H. Xiao, Z. Ai and L. Zhang, J. Phys. Chem. C, 2009, 113, 16625.
84. L. S. Zhong, J. S. Hu, A. M. Cao, Q. Liu, W. G. Song, and L. J. Wan, Chem. Mater., 2007, 19, 1648.
85. J. Li, A. Kalam, A. S. A. Shihri, Q. Su, G. Zhong and G. Du, Mater. Chem. Phys., 2011, 130, 1066.
86. A. Y. Cao, Z. M. Cui, C. Q. Chen, W. G. Song and W. Cai, J. Phys. Chem. C, 2010, 114, 9865.
87. F. Chen, X. Shen, Y. Wang and J. Zhang, Appl. Catal. B Environ., 2012, 121–122, 223.
88. P. Ji, B. Tian, F. Chen and J. Zhang, Environ. Technol., 2012, 33, 467.
89. P. Ji, J. Zhang, F. Chen and M. Anpo, J. Phys. Chem. C, 2008, 112, 17809.
90. P. Ji, J. Zhang, F. Chen and M. Anpo, Appl. Catal. B Environ., 2009, 85, 148.
91. B. Sun, H. Liab and L. Chen, Energy Environ. Sci., 2012, 5, 8475.
92. B. Zhang, X. Du, L. Shia and R. Gao, Dalton Trans., 2012, 41, 14455.
93. A. Trovarelli, Catalytic Science Series, 2002, 2, 15.
94. J. W. Morris, M. Jin and A. M. Minor, Mater. Sci. Eng. A, 2007, 462, 412.
95. F.A. Kröger, Chemistry of Imperfect Crystals, North-Holland, Amsterdam, 1964, 194.
96. C. Zhang, A. Michaelides, D. A. King and S. J. Jenkins, Phys. Rev. B - Condens. Matter Mater. Phys.,
2009, 79, 1.
Chapter 1 General Introduction
33
97. C. T. Campbell and C. H. F. Peden, Science, 2005, 309, 713.
98. P. R. L. Keating, D. O. Scanlon, B. J. Morgan, N. M. Galea and G. W. Watson J. Phys. Chem. C., 2012,
116, 2443.
99. M.A. Henderson, C.L. Perkins, M. H. Engelhard, S. Thevuthasan, and C.H.F. Peden, Surf. Sci., 2003, 526, 1.
100. D. A. Andersson, S. I. Simak, N. V. Skorodumova, I. A. Abrikosov and B. A. Johansson, Appl. Phys. Lett.,
2007, 90, 031909.
101. B. B. Lavik, I. Kosacki, H. L. Tuller, Y. M. Chiang and J. Y. Ying, J. Electroceram., 1997, 1, 7.
102. M. Nolan, J. E. Fearon and G. W. Watson, Solid State Ionics, 2006, 177, 3069.
103. N. J. Lawrence, J. R. Brewer, L. Wang, T. Wu, J. Wells-Kingsbury, M. M. Ihrig, G. Wang, Y. Soo, W. Mei
and C. L. Cheung, Nano Lett., 2011, 11, 2666.
104. P. L. Land, J. Phys. Chem. Solids, 1973, 34, 1839.
105. B. Esch, S. Fabris, L. Zhou, T. Montini, C. Africh, P. Fornasiero, G. Comelli and R. Rosei, Science, 2005,
309, 752.
106. T.G. Kuznetsova and V.A. Sadykov, ISSN 0023-1584, Kinetics and Catalysis, 2008, 49, 840.
107. X. Liu, K. Zhou, L. Wang, B. Wang and Y. Li, J. Am. Chem. Soc., 2009, 131, 3140.
108. A. Trovarelli , M. Boaro, E.Rocchini, C. de Leitenburg and G. Dolcetti, J. Alloy Compd., 2001, 323–324, 584.
109. R. K. Grasselli and J. D. Burrington, Adv. Catal., 30, 133 1981.
110. J. Kullgren, 2012, Uppsala. ISBN 978-91-554-8271-8.
111. P. Fornasiero, R. Di Monte, G. Ranga Rao, J. Kaspar, S. Meriani, A. Trovarelli and M. Graziani, J. Catal.,
1995, 151, 168.
112. B. K. Cho, J. Catal., 1991, 131, 74.
113. T. Bunluesin, R. J. Gorte and G. W. Graham, Appl. Catal. B Environ., 1997,14, 105.
114. E. Mamontov, T. Egami, R. Brezny, M. Koranne and S. Tyagi, J. Phys. Chem. B, 2000, 104, 11110.
115. J. Mikulova, S. Rossignol, J. J. Barbier, D. Duprez and C. Kappenstein, Catal. Today, 2007, 124, 185.
116. M. Pijolat, M. Prin, M. Soustelle, O. Touret, and P. Nortier, J. Chem. Soc. Faraday Trans., 1995, 91, 3941.
117. M. Ozawa, M. Kimura, H. Sobukawa, and K. Yokota, Toyota Tech. Rev., 1992, 27, 43.
118. Q. Yu, X. Wu, C. Tang, L. Qi, B. Liu, F. Gao, K. Sun, L. Dong and Y. Chen, J. Colloid Interface Sci.,
2011, 354, 341.
119. D. Tiana, C. Zeng, Y. Fu, H. Wang, H. Luo, C. Xiang, Y. Wei, K. Li and X. Zhu, Solid State Commun.,
2016, 231-232, 68.
120. Y. Zuo, L. Li, X. Huang and G. Li, Catal. Sci. Technol., 2014, 4, 3368.
121. P. Singh and M. S. Hegde, J. Solid State Chem., 2008, 181, 3248.
122. K. Li, Q. Fu and M. Flytzani-Slephanopoulos, Appl. Catal. B Environ., 2000, 27, 179.
123. B. Murugan, A. V. Ramaswamy, D. Srinivas,C. S. Gopinath and V. Ramaswamy, Chem. Mater., 2005, 17,
3983.
124. X. Liu, Y. Zuo, L. Li, X. Huang and G. Li, RSC Adv., 2014, 4, 6397.
125. Y. Zuo, X. Huang, L. Li and G. Li, J. Mater. Chem. A, 2013, 1, 374.
126. Y. Zuo, L. Li, X. Huang and G. Li, Catal. Sci. Technol., 2014, 4, 402.
Chapter 1 General Introduction
34
127. S. V. Manorama, N. Izu, W. Shin, I. Matsubara and N. Murayama, Sensors Actuators B Chem., 2003, 89, 299.
128. A. S. Reddy, C. Y. Chen, C. C. Chen, S. H. Chien, C. J. Lin, K. H. Lin, C. L. Chen and S. C. Chang, J.
Mol. Catal. A Chem., 2010, 318, 60.
129. W. T. Chen, K. B. Chen, M. F. Wang, S. F. Weng, C. S. Lee and M. C. Lin, Chem. Commun., 2010, 46, 3286.
130. A. B. Kehoe, D. O. Scanlon and G. W. Watson, Chem. Mater., 2011, 23, 4464.
131. L. Zhou, X. Li, Z. Yao, Z. Chen, M. Hong, R. Zhu, Y. Liang and J. Zhao, DOI: 10.1038/srep23900.
132. D. Horlait, L. Claparede, N. Clavier, S. Szenknect, N. Dacheux, J. Ravaux, and R. Podor, Inorg. Chem.,
2011, 50, 7150.
133. L. Minervini, M. O. Zacate and R. W. Grimes, Solid State Ionics, 1999, 116, 339.
134. X. Guo and R. Waser, Prog. Mater. Sci., 2006, 51, 151.
135. Y. Ikuma, E. Shimada and N. Okamura, J. Am. Ceram. Soc., 2005, 88, 419.
136. S. J. Hong and A. V. Virkar, J. Am. Ceram. Soc., 1995, 78, 433.
137. B. C. H. Steele and A. Heinzel, Nature, 2001, 414, 345.
138. Z. X. Song, W. Liu, H. Nishiguchi, A. Takami, K. Nagaoka and Y. Takita, Appl. Catal. A Gen., 2007, 329, 86.
139. K. Krishna, A. B. Lopez, M. Makkee and J. Moulijn, Appl. Catal. B Environ., 2007, 75, 201.
140. B. Hayashi, R. Sagawa, H. Inaba and K. Kawamura, Solid State Ionics, 2000, 131, 281.
141. M. O’Connell and M.A. Morris, Catal. Today, 2000, 59, 387.
142. E. R. Cabrera, A. Atkinson and D. Chadwick, Appl. Catal. B Environ,, 2002, 36, 193.
143. E. S. Putna, J. M. Vohs, R. J. Gorte and G. W. Graham, Catal. Lett., 1998, 54, 17.
144. C. K. Narula, K. L. Taylor, L. P. Haack, L. F. Allard, A. Datye, M. Y. Slnev, M. Shelef, R. W. McCabe,
W. Chun and G. W. Graham, Mater. Res. Soc. Symp. Proc., 1998, 497, 15.
145. G. B. Balazs and R. S. Glass, Solid State Ionics, 1995, 76, 155.
146. K. Yamashita, K. V. Ramanujachary, and M. Greenblatt, Solid State Ionics, 1995, 81, 53.
147. B. Yahiro, Y. Egushi, K. Egushi and H. Arai, J. Appl. Electrothem., 1988, 18, 527.
148. B. Kuntaiah, P. Sudarsanam, B. M. Redd and A. Vinu, RSC Adv., 2013, 3, 7953.
149. H. Yahiro, K. Eguchi, and H. Arai, Solid State Ionics, 1989, 36, 71.
150. R. D. Shannon, Acta Crystallogr., Sect. A: Cryst. Phys., Diffr.,Theor. Gen. Cryst., 1976, 32, 751.
151. C. Tiseanu, V. I. Parvulescu, M. Boutonnet, B. Cojocaru, P. A. Primus, C. M.Teodorescu, C. Solans and
M. S. Dominguez, Phys. Chem. Chem. Phys., 2011, 13, 17135.
152. A. V. Thorat, T. Ghoshal, P. Carolan, J. D. Holmes and M. A. Morris, J. Phys. Chem. C, 2014, 118, 10700.
153. H. Yokokawa, T. Horita, N. Sakai, K. Yamaji, M. E. Brito, Y. P. Xiong and H. Kishimoto, Solid State
Ionics, 2006, 177, 1705.
154. A. Binnemans, Chem. Rev., 2009, 109, 4283.
155. Z. Wang, Z. Quan and J. Lin., Inorg. Chem., 2007, 46, 5237.
156. G. K. Das and T. T. Y. Tan. J. Phys. Chem. C, 2008, 112, 11211.
157. B. Wang, J. L. Liu, Y. X. Zhang, W. Hou, X. L. Wu and S. K. Xu, Mater. Lett., 2009, 63, 325.
158. J. Wu, S. Shi, X. Wang, J. Li, R. Zong and W. Chen, J. Mater. Chem. C, 2014, 2, 2786.
159. S. Fujihara and M. Oikawa, J. Appl. Phys., 2004, 95, 8002.

Chapter 1 General Introduction
35
160. E. C. C Souza, H. F. Brito and E. N. S. Muccillo, J. Alloys. Compd., 2010, 491, 460.
161. R. H. Krishna, B. M. Nagabhushana, H. Nagabhushana, N. S. Murthy, S. C. Sharma, C. Shivakumara and
R. P. S. Chakradhar, J. Phys. Chem. C, 2013, 117, 1915.
162. B. Gu, Q. Liu, S. P. Mao, D. L.Mao and C. K.Chang, Cryst. Growth Des., 2008, 8, 1422.
163. E. M. Goldys, K. D. Tomsia, D. Dosev, I. M. Kennedy, S. Yatsunenko and M. Godlewski, J. Am. Chem.
Soc., 2006, 128, 14498.
164. R. Srinivasan and A. Chandra Bose, Mater. Lett., 2010, 64, 1954.
165. E. Kaneko, M. Hagiwara and S. Fujihara, ECS J. Solid State Sci. Technol., 2014, 3, 109.
166. V. V. Ursaki, V. Lair, L. Zivkovic, M. Cassir, A. Ringuedé and O. Lupan., Optical Mater., 2012, 34, 1897.
167. M. Balestrieri, S. Colis, M. Gallart, G. Schmerber, M. Ziegler, P. Gilliot and A. Dinia. J. Mater. Chem. C,
2015, 3, 7014.
168. M. K. Rath, S. K. Acharya, B.H. Kim, K. T. Lee and B. G. Ahn, Mater. Lett., 2011, 65, 955.
169. Y. Yoshida and S. Fujihara, Eur. J. Inorg. Chem., 2011, 1577.
170. M. Oikawa and S. Fujihara, J. Eur. Ceram. Soc., 2005, 25, 2921.
171. W. Gao, J. Li, X. Zhou, Z. Zhang, Y. Ma and Y. Qu. J. Mater. Chem. C, 2014, 2, 8729.
172. Y. Sohn, J. Am. Ceram. Soc., 2013, 96, 3747.
173. Z. L. Wang, Z. W. Quan and J. Lin, Inorg. Chem., 2007, 46, 5237.
174. A. Kumar, S. Babu, A. S. Karakoti, A. Schulte and S. Seal., Langmuir, 2009, 25, 10998.
175. H. Guo and Y. Qiao, Appl. Surf. Sci., 2008, 254, 1961.
176. S. Babu, A. Schulte and S. Seal, Appl. Phys. Lett., 2008, 92, 123112.
177. J. Roh, S. H. Hwang and J. Jang, Acs. Appl. Mater. Interfaces, 2014, 6, 19825.
178. A. Sharma, M. Varshney, J. Park, T. K. Ha, K. H. Chae and H. J. Shin, Phys. Chem. Chem. Phys., 2015,17,
30065.
179. S. Shi, M. Hossu, R. Hall and W. Chen, J. Mater. Chem., 2012, 22, 23461.
180. K. W. Chae, T. R. Park, C. I. Cheon, N. I. Cho and J. S. Kim, J. Lumin., 2013, 136, 109.
181. D. Fang, M. Zhang, Z. Luo, T. Cao, Q.Wang, Z. Zhou, M. Jiang and C. Xiong, Opt. Mater., 2014, 38, 1.
182. L. Li, H. K. Yang, B. K. Moon, Z. Fu, C. Guo, J. H. Jeong, S. S. Yi, K. Jang and H. S. Lee, J. Phys. Chem.
C, 2009, 113, 610.
183. R. Srinivasan and A. C. Bose, Functional Mater. Lett., 2011, 4, 13.
184. J. Kaur, D. Chandrakar, V. Dubey, Y. Parganiha, and N. S. Suryanarayana, Opt. Spectros., 2015, 118, 742.
185. G. Vimal, K. P. Mani, P. R. Biju, C. Joseph, N. V. Unnikrishnan and M. A. Ittyachen, Appl. Nanosci.,
2015, 5, 837.
186. C. Tiseanu, V. I. Parvulescu, M. S.Dominguez and M. Boutonnet, J. Appl. Phys., 2012, 112, 013521-013529.
187. C. Buzea, I. I. P. Blandino, and K. Robbie, "Nanomaterials and Nanoparticles: Sources and Toxicity",
Biointerphases, 2007, 2, MR17 - MR172.
188. I. Freestone, N. Meeks, M. Sax and C. Higgitt, Gold Bulletin, 2007, 40, 270.
189. R. Feynman, Caltech Eng. Sci., 1960, 23:5, 22.

Chapter 1 General Introduction
36
190. R. W. Siegel, Nanostructured Materials, Materials Science Division, Argonne National Laboratory
Argonne, Illinois 60439 U.S.A.
191. H. Gleiter, Acta mater., 2000, 48, 1.
192. H. Hofmann, Nanomater., 2009, 1, 8.
193. L. Eyring, The Binary Lanthanide Oxides: Synthesis and Identification, in synthesis of Lanthanide and
Actinide compounds, eds. L. R. Morss and G. Meyer (Kluwer, Dordrecht, 1991), 187.
194. G. Adachi and N. Imanaka, Chem. Rev., 1998, 98, 1479.
195. M. C. Cabus-Llaurado, Y. Cesteros, F. Medina, P. Salagre and J. E. Sueiras, Micropor. Mesopor. Mater.,
2007, 100, 167.
196. H. Y. Chang and H. I. Chen, J. Cryst. Growth, 2005, 283, 457.
197. H. I. Chen and H. Y. Chang, Solid State Commun., 2005, 133, 593.
198. H. I. Chen and H. Y. Chang, Ceram. Int., 2005, 31, 795.
199. B. L. Chen and I. W. Chen, J. Am. Ceram. Soc., 1993, 76, 1577.
200. N. Du, H. Zhang, B. G. Chen, X. Y. Ma and D. R. Yang, J. Phys. Chem. C, 2007, 111, 12677.
201. J. G. Li, T. Ikegami, Y. Wang and T. Mori, J. Am. Ceram. Soc., 2002, 85, 2376.
202. C. W. Sun, H. Li, Z. X. Wang, L. Q. Chen and X. J. Huang, Chem. Lett., 2004, 33, 662.
203. M. Yamashita, K. Kameyama, S. Yabe, S. Yoshida, Y. Fujishiro,T. Kawai and T. Sato, J. Mater. Sci.,
2002, 37, 683.
204. X. D. Zhou, W. Huebner and H. U. Anderson, Appl. Phys. Lett., 2002,80, 3814.
205. T. Yu, B. Lim and Y. Xia, Angew. Chem., 2010, 122, 4586.
206. R. Si, Y. W. Zhang, L -P. You and C. H. Yan, Angew. Chem., Int. Ed., 2005, 44, 3256.
207. C. Laberty-Robert, J. W. Long, E. M. Lucas, K. A. Pettigrew, R. M. Stroud, M. S. Doescher and D. R.
Rolison, Chem. Mater., 2006, 18, 50.
208. G. Li, K. Chao, H. Peng, K. Chen and Z. Zhang,J. Phys. Chem. C, 2008, 112, 16452.
209. B. Liu, M. G. Yao, B. B. Liu, Z. P. Li, R. Liu, Q. J. Li, D. M. Li,B. Zou, T. A. Cui, G. T. Zou, J. Liu and Z.
Chen,J. Phys. Chem. C, 2011, 115, 4546.
210. C. Paun, O. V. Safonova, J. Szlachetko, P. M. Abdala, M. Nachtegaal, J. Sa, E. Kleymenov, A. Cervellino,
F. Krumeich and J. A. van Bokhoven, J. Phys. Chem. C, 2012, 116, 7312.
211. C. N. R. Rao, H. S. S. Ramakrishna Matte, R. Voggu and A. Govindaraj, Dalton Trans., 2012, 41, 5089.
212. H. Imagawa and S. Sun, J. Phys. Chem. C, 2012, 116, 2761.
213. N. Qiu, J. Zhang, Z. Wu, T. Hu and P. Liu, Cryst. Growth Des., 2012, 12, 629.
214. S. Shen and X. Wang, Chem. Commun., 2010, 46, 6891.
215. K. S. Choi, Dalton Trans., 2008, 5432.
216. X. Lu, T. Zhai, H. Cui, J. Shi, S. Xie, Y. Huang, C. Liang and Y. Tong, J. Mater. Chem., 2011, 21, 5569.
217. X. H. Lu, X. Huang, S. L. Xie, D. Z. Zheng, Z. Q. Liu, C. L. Liang and Y. X. Tong, Langmuir, 2010, 26, 7569.
218. Y. N. Ou, G. R. Li, J. H. Liang, Z. P. Feng and Y. X. Tong, J. Phys.Chem. C, 2010, 114, 13509.
219. D. E. Zhang, X. J. Zhang, X. M. Ni, J. M. Song and H. G. Zheng, Chem. Phys. Chem., 2006, 7, 2468.
220. C. D. Leitenburg, A. Trovarelli and J. Kaspar, J. Catal., 1997, 166, 98.

Chapter 1 General Introduction
37
221. N. Audebrand, J. P. Auffredic and D. Louer, Chem. Mater., 2000, 12, 1791.
222. S. Nakane, T. Tachi, M. Yoshinaka, K. Hirota and O. Yamaguchi, J. Am. Ceram. Soc., 1997, 80, 3221.
223. S. Yin, Y. Minamidate, S. Tonouchi, T. Goto, Q. Dong, H. Yamane and T. Sato, RSC Adv., 2012, 2, 5976.
224. J. Rouquerol, D. Avnir, C. W. Fairbridge, D. H. Everett, J. M. Haynes, N. Pernicone, J. D. F. Ramsay, K.
S. W. Sing and K. K. Unger, Pure Appl. Chem., 1994, 66, 1739.
225. C. H. Tung, L. Z. Wu, Z. Y. Yuan and N. Su, J. Am. Chem. Soc., 1998, 120, 11594.
226. K. S. W. Sing, D. H. Everett, R. H. W. Haul, L. Moscou, R. A. Pierotti, J. Rouquerol and T.
Siemieniewska, Pure Appl. Chem., 1985, 57, 603.
227. M. B. Park, Y. Lee, A. M. Zhang, F. S. Xiao, C. P. Nicholas, G. J. Lewis and S. B. Hong, J. Am. Chem.
Soc., 2013, 135, 2248.
228. T. E. Gier, X. Bu, P. Feng and G. D. Stucky, Nature, 1998, 395, 154.
229. X. Bu, P. Feng and G. D. Stucky, Chem. Mater., 1999, 11, 3423.
230. T. D. Tang, L. Zhang, W. Q. Fu, Y. L. Ma, J. Xu, J. Jiang,G. Y. Fang and F. S. Xiao, J. Am. Chem. Soc.,
2013, 135, 11437.
231. N. Pal and A. Bhaumik, RSC Adv., 2015, 5, 24363.
232. D. Zhao, Q. Huo, J. Feng, B. F. Chmelka and G. D. Stucky, J. Am. Chem. Soc., 1998, 120, 6024.
233. S. Che, Z. Liu, T. Ohsuna, K. Sakamoto, O. Terasaki and T. Tatsumi, Nature, 2004, 429, 281.
234. Y. P. Zhu, T. Z. Ren and Z. Y. Yuan, New J. Chem., 2014, 38, 1905.
235. M. E. Davis and R. F. Lobo, Chem Mater., 1992, 4, 756.
236. G. A. Ozin, Adv. Mater,. 1992, 4, 612.
237. N. K. Mal, A, Bhaumik, R, Kumar and A. V. Ramaswamy, Catal. Lett., 1995, 33, 387.
238. A. Corma, Chem. Rev., 1997, 97, 2373.
239. J. Y. Ying, C. P. Mehnert and M. S. Wong, Angew. Chem., Int. Ed., 1999, 38, 56.
240. F. Schuth, Chem. Mater., 2001, 13, 3184.
241. M. E. Davis, Nature, 2002, 417, 813.
242. M. Hartmann, Chem. Mater., 2005, 17, 4577.
243. B. G. Bruce, B. Scrosati and J. M. Tarascon, Angew. Chem. Int. Ed., 2008, 47, 2930.
244. W. Li and D. Y. Zhao, Chem. Commun., 2013, 49, 943.
245. C. T. Kresge, M. E. Leonowicz, W. J. Roth, J. C. Vartuli and J. S. Beck, Nature., 1992, 359, 710.
246. Y. Ren, Z. Ma and P. G. Bruce, J. Mater. Chem., 2012, 22, 15121.
247. B. S. Huo, D. I. Margolese, U. Ciesla, P. Y. Feng, T. E. Gier, P. Sieger, R. Leon, P. M. Petroff, F. Schuth
and G. D. Stucky, Nature, 1994, 368, 317.
248. D. M. Antonelli and J. Y. Ying, Curr. Opin. Colloid Interf. Sci., 1996, 1, 523.
249. D. M. Antonelli, A. Nakahira and J. Y. Ying, Inorg. Chem., 1996, 35, 3126.
250. A. Sayari and P. Liu, Micropor. Mater., 1997, 12, 149.
251. U. Ciesla and F. Schuth, Micropor. Mesopor. Mater., 1999, 27,131.
252. G. J. D. Soler-illia, C. Sanchez, B. Lebeau and J. Patarin, Chem. Rev., 2002, 102, 4093.
253. D. E. De Vos, M. Dams, B. F. Sels and P. A. Jacobs, Chem. Rev., 2002, 102, 3615.

Chapter 1 General Introduction
38
254. B. Valange, J. L. Guth, F. Kolenda, S. Lacombe and Z. Gabelica, Micropor. Mesopor. Mater., 2000, 35–36, 597.
255. V. Luca, J. N. Watson, M. Ruschena and R. B. Knott, Chem. Mater., 2006, 18, 1156.
256. X. Yang, F. C. Jentoft, R. E. Jentoft, F. Girgsdies and T. Ressler, Catal. Lett., 2002, 81, 25.
257. M. Lundberg, B. Skarman, F. Cesar and L. R. Wallenberg, Micropor. Mesopor. Mater., 2002, 54, 97.
258. M. Lundberg, B. Skarman and L. R. Wallenberg, Microporous Mesoporous Mater., 2004, 69, 187.
259. Y. Castro, B. Julian, C. Boissie`re, B. Viana, H. Amenitsch,D. Grosso and C. Sanchez, Nanotech., 2007,
18, 055705.
260. M. Yada, H. Kitamura, A. Ichinose, M. Machida and T. Kijima, Angew. Chem., Int. Ed., 1999, 38, 3506.
261. D. M. Lyons, L. P. Harman and M. A. Morris, J. Mater. Chem., 2004, 14, 1976.
262. C. F. Cheng, Z. Luan and J. Klinowski, Langmuir, 1995, 11, 2815.
263. N. Pal and A. Bhaumik, Adv. Colloid Interface Sci., 2013, 189–190, 21.
264. D. Gu and F. Schuth, Chem. Soc. Rev., 2014, 43, 313.
265. B. Haffer, C. Weinberger and M. Tiemann, Eur. J. Inorg. Chem., 2012, 3283.
266. C. S. Kim, H. I. Lee, J. K. Shon, J. Y. Hur, M. S. Kang, S. S. Park, S. S. Kong, J. A. Yu, M. Seo, D. Li, S.
S. Thakur and J. M. Kim ,Chem. Lett., 2008, 140.
267. B. Liu and R. T. Baker, J. Mater. Chem., 2008, 18, 5200.
268. Y. G. Wang, Y. Q. Wang, J. W. Ren, Y. Mi, F. Y. Zhang, C. L. Li, X. H. Liu, Y. Guo, Y. L. Guo and G. Z.
Lu, J. Solid State Chem., 2010, 183, 277
269. Y. F. Shi, Y. Wan and D. Y. Zhao, Chem. Soc. Rev., 2011, 40, 3854.
270. K. Zimny, C. Carteret, M. J. Stebe and J. L. Blin, J Phys Chem. C, 2011, 115, 8684.
271. G. S. Prado and C. Airoldi, J. Mater. Chem., 2002, 12, 3823.
272. A. Knoefel, M. Lutecki, C. Martin, M. Mertens, V. Hornebecq and P. L. Llewellyn, Microporous
Mesoporous Mater., 2010, 128, 26.
273. M. J. Rosen, Surfactants and interfacial phenomena, A John Wiley & Sons, Inc., Publication, 3rd edition, 2004.
274. R. M. M. Britoand and W. L. C. Vaz, Anal. Biochem., 1986, 152, 250.
275. D. Bradshaw, S. E. Hankari and L. L. Spagnolo, Chem. Soc. Rev., 2014, 43, 5431.
276. Q. Huo, D. I. Margolese, U. Ciesla, D. G. Demuth, P. Feng, T. E. Gier, P. Sieger, A. Firouzi, B. F.
Chmelka, F. Schuth, and G. D. Stucky, Chem. Mater., 1994, 6, 1176.
277. A. Sayari, Stud. Surf. Sci. Catal., 1996, 102,1.
278. G. J. A. A. Soler-Illia, A. Louis and C. Sanchez, Chem. Mater., 2002, 14, 750.
279. Y. Chena, S. K. Lunsford, Y. Song, H. Ju, P. Falaras, V. likodimos, A. G. Kontos, and D. D. Dionysiou,
Chem. Eng. J., 2011, 170, 518.
280. S. A. Bagshaw, E. Prouzet, and T. J. Pinnavaia, Science, 1995, 269, 1242.
281. Y. P. Zhu, Z. Y. Yuan, Mesoporous Organic-Inorganic Non-Siliceous Hybrid Materials, Springer
Heidelberg New York Dordrecht London, 2015.
282. A. Sayari, Y. Yang, M. Kruk, and M. Jaroniec, J. Phys. Chem. B, 1999, 103, 3651.
283. Y. Ren, Z. Ma and P. G. Bruce, Chem. Soc. Rev., 2012, 41, 4909.
284. Y. Liu, J. Goebla and Y. Yin, Chem. Soc. Rev., 2013, 42, 2610
Chapter 1 General Introduction
39
285. Z. Yang, Y. Zhang and Z. Schnepp, J. Mater. Chem. A, 2015, 3, 1408.
286. S. A. Ghom, C. Zamani, T. Andreu, M. Epifani and J. R. Morante, Appl. Catal. B Environ., 2011, 108–109, 32.
287. E. Rossinyol, J. Arbiol, F. Peiro, A. Cornet, J. R. Morante, B. Tian, T. Bo and D. Zhao, Sensors and
Actuators B Chem., 2005, 109, 57.
288. H. F. Yang and D. Y. Zhao, J. Mater. Chem., 2005, 15, 1217.
289. D. Terribile, A. Trovarelli, C. D. Leitenburg and G. Dolcetti, Chem. Mater., 1997, 9, 2676.
290. J. Xu, K. Z. Long, F. Wu, B. Xue, Y. X. Li and Y. Cao, Appl. Catal. A Gen., 2014 484,
291. S. Pavasupreea, Y. Suzukia, S. P. Art and S. Yoshikawa, Ceramics International, 2005, 31, 959.
292. W. Yuejnan, M. Jingnieng, L. Mengfei and H. Mai, Journal of Rare Earths, 2007, 25, 58.
293. X. Liang, J. Xiao, B. Chen and Y. Li, Inorg. Chem., 2010, 49, 8188.
294. N. Perkas, H. Rotter, L. Vradman, M. V. Landau, and A. Gedanken, Langmuir, 2006, 22, 7072.
295. C. Ho, J. C. Yu, T. Kwong, A. C. Mak and S. Lai, Chem. Mater., 2005, 17, 4514.
296. S. Liang, E. Broitman, Y. Wang, A. Cao and G. Veser, J. Mater. Sci., 2011, 46, 2928.
297. Z. Y. Yuan, V. Idakiev, A. Vantomme, T. Tabakova, T. Z. Ren and B. L. Su, Catal. Today, 2008, 131, 203.
298. I. V. Zagaynov and A. K. Buryak, J. Sol-Gel Sci. Technol., 2015, 74, 103.
299. C. Ni, X. Li, Z. Chen, H. Y. H. Li, X. Jia, I. Shah, J. Q. Xiao, Microporous Mesoporous Mater., 2008, 115, 247.
300. C. Deeprasertkul, R. Longloilert, T. Chaisuwan and S. Wongkasemjit, Mater. Lett., 2014, 130, 218.
301. J. Roggenbuck, H. Schafer, T. Tsoncheva, C. Minchev, J. Hanss and M. Tiemann, Microporous
Mesoporous Mater., 2007, 101, 335.
302. S. C. Laha and R. Ryoo, Chem. Commun., 2003, 2138.
303. H. Li, G. Lu, Y. Wang, Y. Guo and Y. Guo, Catal. Commun., 2010, 11, 946.
304. L. Changlin, G. Xin, W. Yanqin, W. Yaojun, W. Yangang, L. Xiaohui and L. Guanzhong, Journal of Rare
Earths, 2009, 27, 211.
305. S. Hao, J. Hou, P. Aprea and T. Lv, Ind. Eng. Chem. Res., 2014, 53, 14617.
306. J. Zhang, J. Guo, W. Liu, S. Wang, A. Xie, X. Liu, J. Wang and Y. Yang, Eur. J. Inorg. Chem., 2015, 969.
307. Y. Kamimura, M. Shimomura and A. Endo, J. Colloid Interface Sci., 2014, 436, 52.
308. B. Lu, Z. Li and K. Kawamoto, Mater. Res. Bullet., 2013, 48, 2504.
309. Y. Li, Q. Sun, M. Kong, W. Shi, J. Huang, J. Tang and X. Zhao, J. Phys. Chem. C, 2011, 115, 14050.
310. G. Zhang, Z. Shen, M. Liu, C. Guo, P. Sun, Z. Yuan, B. Li, D. Ding and T. Chen, J. Phys. Chem. B, 2006,
110, 25782.
311. J. Zhang, H. Yang, S. Wang, W. Liu, X. Liu, J. Guo and Y. Yang, Cryst. Eng. Comm, 2014, 16, 8777.
312. G. Chen, Q. Xu, Y. Wang, G. Songa and W. Fan, J. Mater. Chem. A, 2015, 3, 7022.
313. B. D. Kosynkin, A. A. Arzgatkina, E. N. Ivanov, M. G. Chtoutsa, A. I. Grabko, A.V. Kardapolov and N. A.
Sysina, J. Alloys Compd., 2000, 303-304, 421.
314. T. C. Schutt, Ceram. Bull., 1972, 51, 155.
315. S. Bernal, G. Blanco, J. J. Calvino, J. A. P. Omil and J. M. Pintado, J. Alloys Compd., 2006, 408–412, 496.
316. J. Kaspar, P. Fornasiero and N. Hickey, Catal. Today, 2003, 77, 419.
317. R. Di Monte and J. Kaspar, Top. Catal., 2004, 28, 47.
Chapter 1 General Introduction
40
318. B. Sun and W. Liu, J. Power Sources, 2012, 217, 114.
319. L. Vivier and D. Duprez, Chem. Sus. Chem., 2010, 3, 654.
320. M.F. Ahmed (Ed.), Technologies for arsenic removal from drinking water, Bangladesh University of
Engineering and Technology, Dhaka, Bangladesh, 2001, 251.
321. R. H. Li, Q. Li, S. Gao and J. K. Shang, Chem. Eng. J., 2012, 185, 127.
322. Q. Z. Feng, Z. Y. Zhang, Y. H. Ma, X. He, Y. L. Zhao and Z. F. Chai, Nanoscale Res. Lett., 2012, 7, 1.
323. S. Recillas, J. Colon, E. Casals, E. Gonzalez, V. Puntes, A. Sanchez and X. Font, J. Haz. Mater., 2010, 184, 425.
324. J. Suna, C. Wanga, L. Zenga, P. Xua, X. Yanga, J. Chena, X. Xinga, Q. Jinb and R.Yua, Mater. Res.
Bullet., 2016, 75, 110.
325. B. Peng, Z. Luan, J. Ding, Z. Di, Y. Li and B. Tian, Mater. Lett.., 2005, 59, 399.
326. Z. C. Di, J. Ding, X. J. Peng, Y. H. Li, Z. K. Luan and J. Liang, Chemosphere, 2006, 62, 861
327. A. M. Raichur and M. J. Basu, Sep. Purif. Technol., 2001, 24, 121.
328. Z. Tang, Y. Zhang and Y. Xu, RSC Adv., 2011, 1, 1772.
329. B. Cai, F. Chen, X. Shen, L. Chen and J. Zhang, Appl. Catal. B Environ., 101, 160.
330. N. S. Arul, D. Mangalaraj, P. C. Chen, N. Ponpandian, P. Meena and Y. Masuda, J. Sol-Gel. Sci. Technol.,
2012, 64, 515.
331. S. Hu, F. Zhou, L. Wang and J. Zhang, Catal. Comm., 2011, 12, 794.
332. B. S. Chaudhary, S. Panigrahi, S. Nayak, B. Satpati, S. Bhattacharjee and N. Kulkarni, J. Mater. Chem.,
2010, 20, 2381.
333. M. Das, S. Patil, N. Bhargava, J. F. Kang, L. M. Riedel, S. Seal and J. J. Hickman, Biomaterials., 2007, 28,
1918.
334. S. Kar, C. Patel and S. Santra, J. Phys. Chem. C, 2009, 113, 4862.
335. A. Asati, S. Santra, C. Kaittanis, S. Nath and J. M. Perez, Angew. Chem., Int. Ed., 2009, 48, 2308.
336. R. W. Tarnuzzer, J. Colon, S. Patil and S. Seal, Nano Lett., 2005, 5, 2573.
337. J. M. Perez, A. Asati, S. Nath and C. Kaittanis, Small, 2008, 4, 552.
338. D. Schubert, R. Dargusch, J. Raitano and S. W. Chan, Biochem. Biophys. Res. Commun., 2006, 342, 86.
339. S. S. Lee, H. G. Zhu, E. Q. Contreras, A. Prakash, H. L. Puppala and V. L. Colvin, Chem. Mater., 2012, 24, 424.
340. J. P. Chen, S. Patil, S. Seal and J. F. McGinnis, Nat. Nanotechnol., 2006, 1, 142.
341. S. Babu, J. H. Cho, J. M. Dowding, E. Heckert, C. Komanski, S. Das, J. Colon, C. H. Baker, M. Bass, W.
T. Self and S. Seal, Chem. Commun., 2010, 46, 6915.
Chapter 2 Experimental
41
Chapter 2
Materials Synthesis and
Characterization
Outline: This chapter deals with a discussion of the synthetic methodology developed
and adopted for the synthesis of pure as well as samarium (Sm3+
) and europium (Eu3+
) doped
ceria (CeO2), and their characterization by various sophisticated instrumental techniques
employed in the present study. Thermogravimetric analysis/differential scanning calorimetry
(TGA/DSC), X-ray diffraction (XRD), BET N2 gas sorption, Fourier transform-infra red
spectroscopy (FTIR), UV-visible diffuse reflectance spectroscopy (UV-vis DRS),
photoluminescence (PL), Raman spectroscopy, X-ray photoelectron spectroscopy (XPS),
electron paramagnetic resonance (EPR), field emission scanning electron microscopy
(FESEM), high resolution transmission electron microscopy (HRTEM), temperature
programmed reduction (TPR) and temperature programmed desorption (TPD) were used to
understand the structural, optical and other typical properties of the synthesized pure and
doped CeO2 powders. Finally, the adsorption and removal of Cr(VI), and photodegradation
of dyes under direct sunlight by the high surface area mesostructured pure and Sm3+
modified
mesoporous CeO2 samples have been investigated.

Chapter 2 Experimental
42
2.1. Synthetic Methodology
In order to obtain high quality nano-sized CeO2 particles in terms of their particle size,
uniformity, purity, homogeneity, morphology, specific surface area and crystallinity etc.,
many methods have been developed and explored such as homogeneous precipitation
techniques with different precipitating agents and additives, co-precipitation, combustion
method, microemulsion, hydrothermal, spray pyrolysis, solid-state reactions, sol-gel,
electrochemical methods, micelle route, surfactant assisted synthesis, microwave-assisted
synthesis etc1-12
. Each method has its own merits and demerits. Compared to the above
mentioned methods, precipitation is one of the most utilized and economically feasible
method for the large-scale production of nano-sized CeO2 particles due to the cheaper salt
precursors, simple operation and mild adjustable reaction conditions, which satisfy a variety
of purposes.
In this present work, a facile aqueous solution-based surfactant assisted route has been
adopted for the synthesis of pure as well as Sm3+
(0.5, 1, 2, 5, 10 and 20 mol%) and Eu3+
(0.5,
1, 2 and 5 mol%) doped CeO2. The synthetic procedure adopted here is versatile, simple and
cost-effective. The metal inorganic precursors were used for the synthesis of materials are
cheaper and readily available. Surfactant acts as the template or pore directing agents.
Chemical formulas of the surfactants used during synthesis in the present work are given in
Fig. 2.1. The materials were synthesized using metal inorganic precursors by a homogeneous
precipitation route and subjected to further hydrolysis via both conventional and microwave
reflux method. The chemicals used for the synthesis purpose are given in Table 2.1. All
chemicals are commercially available with 99.9 % purity and were used as received without
further purification.
Fig. 2.1. Surfactants used in the synthesis of mesoporous CeO2 or doped CeO2.
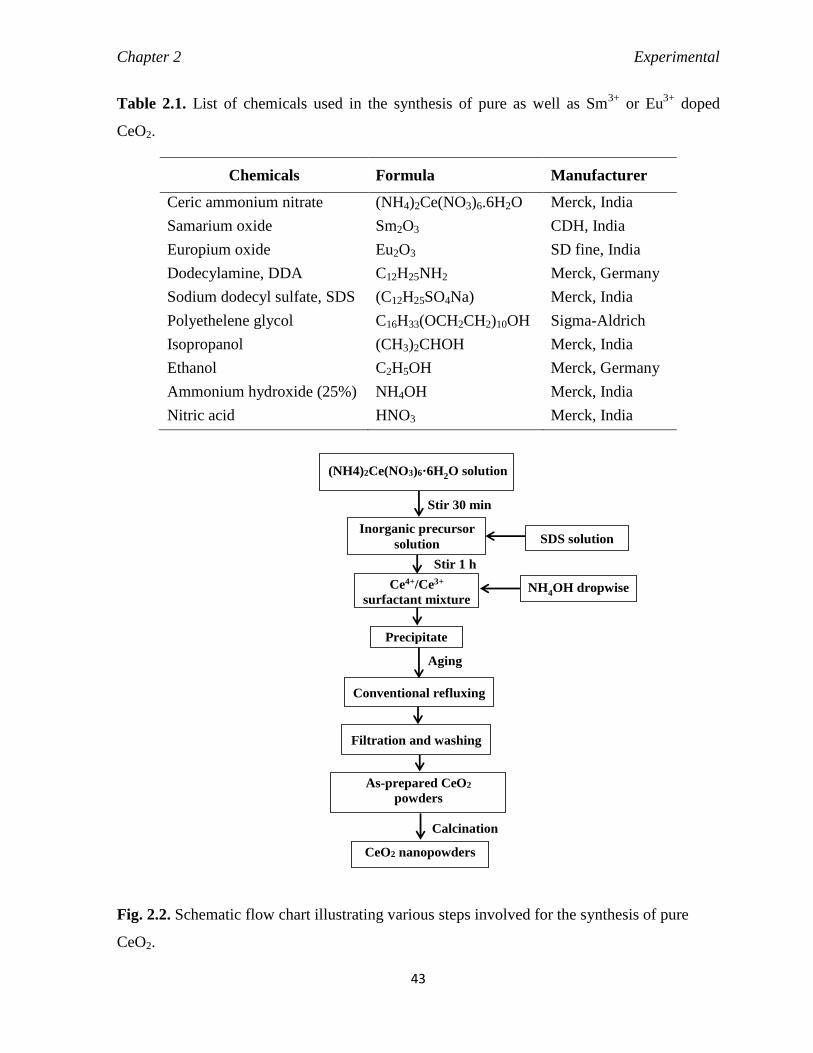
Chapter 2 Experimental
43
Table 2.1. List of chemicals used in the synthesis of pure as well as Sm3+
or Eu3+
doped
CeO2.
Chemicals Formula Manufacturer
Ceric ammonium nitrate (NH4)2Ce(NO3)6.6H2O Merck, India
Samarium oxide
Europium oxide
Sm2O3
Eu2O3
CDH, India
SD fine, India
Dodecylamine, DDA C12H25NH2 Merck, Germany
Sodium dodecyl sulfate, SDS (C12H25SO4Na) Merck, India
Polyethelene glycol C16H33(OCH2CH2)10OH Sigma-Aldrich
Isopropanol (CH3)2CHOH Merck, India
Ethanol C2H5OH Merck, Germany
Ammonium hydroxide (25%)
Nitric acid
NH4OH
HNO3
Merck, India
Merck, India
Fig. 2.2. Schematic flow chart illustrating various steps involved for the synthesis of pure
CeO2.
SDS solution
Stir 1 h
Calcination
CeO2 nanopowders
Ce4+/Ce3+
surfactant mixture
solution
NH4OH dropwise
Inorganic precursor
solution
Stir 30 min
As-prepared CeO2
powders
Aging
(NH4)2Ce(NO3)6·6H2O solution
Precipitate
Filtration and washing
Conventional refluxing
Chapter 2 Experimental
44
2.1.1. Synthesis of pure CeO2
Pure CeO2 was prepared by adopting a surfactant mediated co-precipitation method
using (NH4)2Ce(NO3)6.6H2O as an inorganic precursor and sodium dodecyl sulfate (SDS) as a
surfactant. Initially, 0.5 M (NH4)2Ce(NO3)6.6H2O solution was prepared by dissolving
requisite amount of it in deionized water then a clear solution of 18 wt.% sodium dodecyl
sulphate (SDS) was prepared in water-isopropanol (molar ratio 3 : 1). After that these two
solutions were mixed with vigorous stirring for 2 h. Upon complete mixing, 30% NH4OH was
added drop wise to get the precipitate (till the pH becomes 9). The resulting precipitate was
kept for 2 days at room temperature for aging. It was then filtered by using Whatman filter
paper and washed with distilled water several times and with absolute ethanol 2-3 times to
remove excess surfactant and other impurities. Then it was dispersed in a certain volume of
water and conventionally refluxed for 24 h. The final precipitate was washed with distilled
water and ethanol and then dried in a water bath to obtain the as-prepared powder (denoted at
100CeSDSasp). The as-prepared powder was calcined in air atmosphere at selected
temperatures, ranging from 500C to 1000C for 2 h.
For comparison purpose, pure CeO2 without any surfactant was also prepared. The
schematic flow chart of various steps involved for the synthesis of pure CeO2 is given in Fig.
2.2 and the notation used for both the samples prepared by surfactants free and surfactant
assisted route are tabulated in Table 2.2. Under basic conditions at room temperature the
reaction of ceric ammonium nitrate with ammonia produce a gelatinous precipitation of
hydrous cerium oxide. Ce4+
ions produce from ceric ammonium nitrate precursors undergo
strong hydration due to their lower basicity and higher charge which combines with water
molecules or OH- form complexes in the form of [Ce(OH)x(H2O)y]
(4-x)+, where (x + y) is the
coordination number of Ce4+
. In an aqueous solution further polymerization and precipitation
of these hydroxides leading to the formation of hydrous oxide and then to the oxide as H2O,
being a polar molecule, tends to take protons away from coordinated hydroxide. Probable
reaction steps can be described as represented below13-16
Ce4+
+ xOH- + yH2O [Ce(OH)x(H2O)y]
(4-x)+
[Ce(OH)x(H2O)y](4-x)+
+ xH2O CeO2.nH2O + H3O+
.

Chapter 2 Experimental
45
2.1.2. Synthesis of Sm3+
doped CeO2
2.1.2.1. Synthesis of Sm3+
doped CeO2 by using different surfactants via conventional
refluxing route
For the synthesis of Sm3+
doped CeO2, the similar preparative method as described
above for pure CeO2 was used. To understand the effect of surfactants on the properties of
CeO2, a representative composition of 1 mol% Sm3+
doped CeO2 was prepared using
(NH4)2Ce(NO3)6.6H2O and Sm2O3 as inorganic precursors, dilute aqueous ammonia solution
as the precipitating agent and dodecyl amine (DDA), sodium dodecyl sulphate (SDS), or poly
ethylene glycol (PEG) as a surfactant. Initially, a clear surfactant solution (18 wt.%) of SDS,
DDA, or PEG was prepared separately by dissolving it in water-isopropanol (1:3) at room
temperature with stirring for 1 h. Samarium nitrate was prepared by dissolving the requisite
amount of Sm2O3 in the minimum volume of concentrated nitric acid. Samarium nitrate was
then dissolved separately in distilled water. After that this solution was mixed with 0.5 M
(NH4)2Ce(NO3)66H2O solution and stirred for 30 min. The surfactant solution was added
dropwise to the mixture solution containing the inorganic salts under vigorous stirring
conditions. Under magnetic stirring, an NH4OH solution (30 vol.%) was added dropwise to
the above solution to obtain a precipitate at a pH of 9. After ageing, the precipitate was
filtered, washed with water and ethanol for several times. Subsequently, it was dispersed in a
certain volume of water and was subjected to conventional refluxing for 24 h. Finally, the
precipitate was filtered, washed with distilled H2O and ethanol several times and dried. The
as-prepared powder was grinded in an agate mortar to avoid agglomeration of particles and
then calcined at various temperatures in air for 2 h.
2.1.2.2. Synthesis of Sm3+
doped CeO2 by using SDS via microwave refluxing
Sm3+
doped CeO2 (CeO2:Sm3+
) by varying Sm3+
concentrations (0.5, 1, 2, 5, 10 and 20
mol%) were synthesized using SDS as surfactant by the same procedure as described above
except the precipitates were treated with microwave refluxing instead of conventional
refluxing. Under magnetic stirring, an NH4OH solution (30 vol%) was added dropwise to the
mixture solution of surfactant and salts to obtain a precipitate at a pH of 9. The mixture was
aged at room temperature and then washed with water. Then it was dispersed in a certain
volume of water and divided in to three parts of equal volume, one part directly filtered and

Chapter 2 Experimental
46
washed, and rest two parts were subjected to conventional and microwave refluxing (National,
2450 MHz, 300 W) for 24 h, and for 30 min at 90°C, respectively. Finally, the precipitate was
filtered, washed with distilled water and ethanol several times and dried at 80C. The as-
prepared sample was then calcined at higher temperatures in air for 2 h.
Fig. 2.3. Schematic flow chart of various steps involved for the synthesis of Sm3+
or Eu3+
doped CeO2.
2.1.3. Synthesis of Eu3+
doped CeO2 by using SDS through conventional and microwave
refluxing
Similar procedures were followed as described above for the synthesis of Sm3+
doped
CeO2 at varying Eu3+
concentrations (0.5, 1, 2 and 5 mol%) using SDS as surfactant, except
that Eu2O3 was dissolved in the minimum volume of concentrated nitric acid and added to the
Sm2O3 or
Eu2O3 solution
(NH4)2Ce(NO3)66H2O
solution
Calcination
Stir 30 min
Inorganic precursor
solution Surfactant
solution
NH4OH drop wise Ce4+/Ce3+: Sm3+ or Eu3+ -
surfactant mixture
solution
Stir 1 h
Precipitate
Aging
As-prepared mesostructured
precursor powders
Mesoporous Sm3+ or Eu3+ modified
CeO2 powders
Reflux via conventional or
microwave method
Filtration and washing

Chapter 2 Experimental
47
clear solution of (NH4)2Ce(NO3)6·6H2O. The flow chart of various steps involved for the
synthesis of Eu3+
doped CeO2 is given in Fig. 2.3. Notations assigned for the as-prepared and
calcined samples at various temperatures are listed in Table 2.2.
Table 2.2. Notations used in this thesis for pure, Sm3+
or Eu3+
doped CeO2 samples.
Samples Designation Designation for as-
prepared samples
Designation for
calcined samples
(say at x°C)
Pure CeO2 prepared without SDS
followed by conventional refluxing.
100Ce 100Ceasp 100Cex
Pure CeO2 prepared with SDS followed
by conventional refluxing.
100CeSDS 100CeSDSasp 100CeSDSx
n mol% Sm3+
doped CeO2 prepared with
SDS followed by conventional refluxing.
nSmCeSDS nSmCeSDSasp nSmCeSDSx
n mol% Sm3+
doped CeO2 prepared with
DDA followed by conventional
refluxing.
nSmCeDDA nSmCeDDAasp nSmCeDDAx
n mol% Sm3+
doped CeO2 prepared with
PEG followed by conventional refluxing.
nSmCePEG nSmCePEGasp nSmCePEGx
n mol% Sm3+
doped CeO2 prepared with
SDS followed by microwave refluxing
nSmCeSDSMW nSmCeSDSMWasp nSmCeSDSMWx
n mol% Sm3+
doped CeO2 prepared with
SDS followed by microwave refluxing
nSmCeSDSNR nSmCeSDSNRasp nSmCeSDSNRx
n mol% Eu3+
doped CeO2 prepared with
SDS followed by conventional refluxing
nEuCeSDS nEuCeSDSasp nEuCeSDSx
n mol% Eu3+
doped CeO2 prepared with
SDS followed by microwave refluxing
nEuCeSDSMW nEuCeSDSMWasp nEuCeSDSMWx
2.2. Characterization and measurements
A brief description of various characterization techniques employed in the present
study to understand the complete structural, optical and spectroscopic properties of the
synthesized materials, such as thermogravimetric analysis/differential scanning calorimetry
(TGA/DSC), X-ray diffraction (XRD), BET-BJH-surface area and pore size analysis, Fourier
transform-infra red spectroscopy (FTIR), UV-visible diffuse reflectance spectroscopy (UV-
vis DRS), X-ray photoelectron spectroscopy (XPS), field emission scanning electron
microscopy (FESEM), high resolution transmission electron microscopy (HRTEM),
temperature programmed reduction (TPR) and temperature programmed desorption (TPD)
are discussed in this section.
Chapter 2 Experimental
48
2.2.1. Simultaneous thermal analysis (TGA/DSC)
Simultaneous thermal analysis (STA) allows the simultaneous measurement of both
thermogravimetric (TGA) and differential scanning calorimetry (DSC) of a sample in a single
instrument.17
The crucible containing the sample and an empty reference crucible are heated
at constant heat flow as a function of time or temperature and maintained at nearly the same
temperature throughout the experiment.18
The reference sample should possess a well-defined
heat capacity over the scanned temperatures.18
As the difference in the amount of heat
required to increase the temperature of a sample and reference are measured as a function of
temperature,19
it provides information in details about the change of material property with
the change of temperature.
The basic principle of this technique is that during the phase transitions of the sample
more or less heat will flow to the sample holder than to the reference to maintain both at the
same temperature.15
Therefore, heat must flow in or out to the sample depends on whether the
process is endothermic or exothermic. Both the shape and size of the peaks provide
information about the nature of the sample. Generally, the sharp endothermic peak arises due
to the change in crystallinity or fusion process where as the broad endotherm revealed
dehydration or decomposition reaction. In general endothermic peaks arise due to the physical
changes and exothermic peaks arise due to the chemical reaction.20
Thermogravimetric
analysis (TGA) is a technique in which the weight loss of a specimen in an environment (air
or in an inert atmosphere, such as He/Ar) arises due to physical transition or chemical
reaction, recorded as a function of time or temperature during heating or cooling at a
controlled rate. A remarkable % of mass loss indicates the presence of volatile fraction in the
substance. Thermal behavior of the synthesized nanopowders were studied using Netzsch,
Germany (DSC/TGA), which was performed by continuous heating from 30°C to 1000°C at
the heating rates of 10°C/min under air atmosphere using α-Al2O3 as a reference material.
2.2.2. X-ray diffraction (XRD)
X-ray diffraction (XRD) is an extremely important technique to determine the
information about the crystal structure of all crystalline materials. Subsequently the technique
of X-ray diffraction also provides information about the crystallite size, lattice parameter,
chemical composition, state of ordering etc. X–rays are electromagnetic radiation of exactly
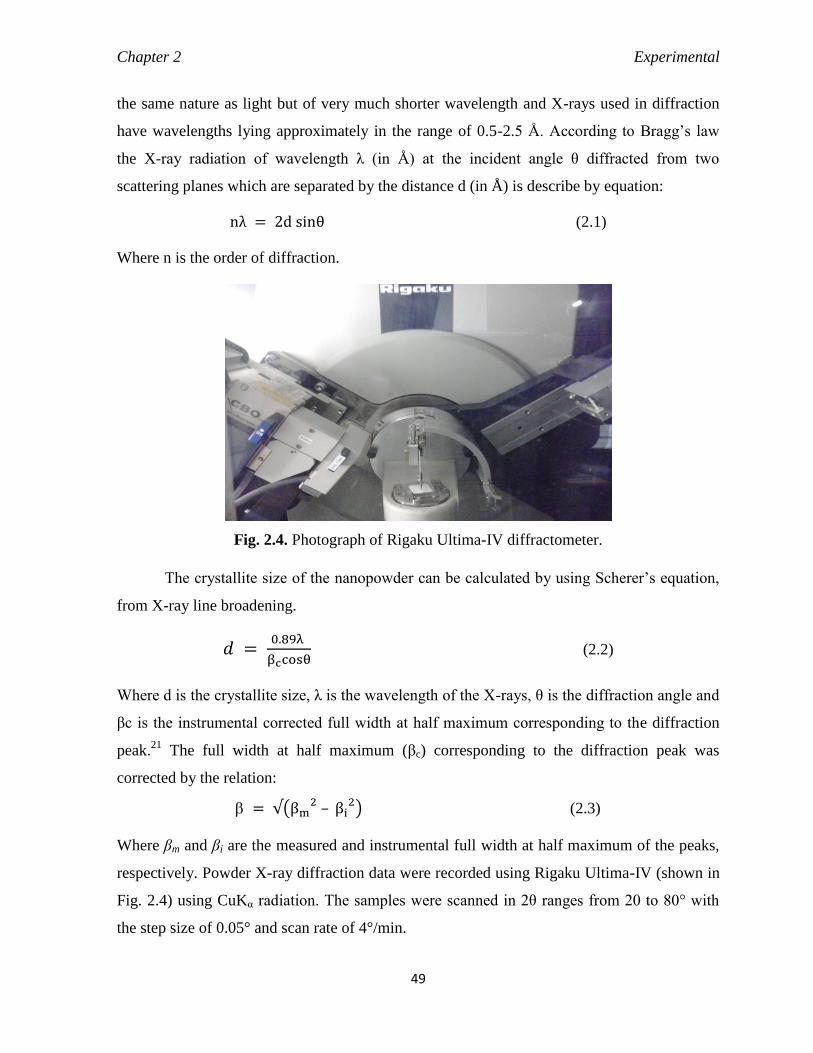
Chapter 2 Experimental
49
the same nature as light but of very much shorter wavelength and X-rays used in diffraction
have wavelengths lying approximately in the range of 0.5-2.5 Å. According to Bragg’s law
the X-ray radiation of wavelength λ (in Å) at the incident angle θ diffracted from two
scattering planes which are separated by the distance d (in Å) is describe by equation:
nλ = 2d sinθ (2.1)
Where n is the order of diffraction.
Fig. 2.4. Photograph of Rigaku Ultima-IV diffractometer.
The crystallite size of the nanopowder can be calculated by using Scherer’s equation,
from X-ray line broadening.
𝑑 = 0.89λ
βccosθ (2.2)
Where d is the crystallite size, λ is the wavelength of the X-rays, θ is the diffraction angle and
βc is the instrumental corrected full width at half maximum corresponding to the diffraction
peak.21
The full width at half maximum (βc) corresponding to the diffraction peak was
corrected by the relation:
= √(βm2 – βi
2) (2.3)
Where βm and βi are the measured and instrumental full width at half maximum of the peaks,
respectively. Powder X-ray diffraction data were recorded using Rigaku Ultima-IV (shown in
Fig. 2.4) using CuKα radiation. The samples were scanned in 2θ ranges from 20 to 80° with
the step size of 0.05° and scan rate of 4°/min.

Chapter 2 Experimental
50
2.2.3. Brunauer, Emmett and Teller (B.E.T.) measurements
Determination of the surface area of the nanosize particles is of paramount importance
in the field of nanotechnology. The most extensively used technique for this purpose is B.E.T.
isotherm.22
As the various type of experimental adsorption isotherm is not to be explainable
by Langmuir monolayer adsorption theory, Braunauer, Emett and Teller developed a theory
of multilayer adsorption which is known as B.E.T. theory. This theory based on following
assumptions:23
(a) Adsorption involves the formation of multilayer rather than monolayer,
(b) Adsorption at one site does not affect the adsorption of neighboring site,
(c) There is a dynamic equilibrium between the successive layer, and
(d) Langmuir theory is adopted for the formation of single complexes.
On the basis of above postulates they derived the following equation:
1
v[(P0/P)−1] =
c−1
vmc(P
P0) +
1
vmc (2.4),
which is called B.E.T. equation.
where P and P0 are the equilibrium and the saturation pressure of adsorbates at the
temperature of adsorption, v is the adsorbed gas quantity (for example, in volume units), and
vm is the monolayer adsorbed gas quantity. The BET constant c, is expressed by:
c = exp (E1−EL
RT) (2.5)
where E1 is the heat of adsorption for the first layer, and EL is that for the second and higher
layers and is equal to the heat of liquefaction.
Equation (2.4) is an adsorption isotherm and can be plotted as a straight line with
1
v[(P0/P)−1] on the y-axis and
P
P0 on the x-axis. This plot is called a BET plot. The linear
relationship of this equation is maintained only in the range of 0.05 < P
P0 < 0.35. The value of
the slope A and the y-intercept I of the line are used to calculate the monolayer adsorbed gas
quantity vm and the BET constant c. The following equations can be used:
vm = 1
A+I (2.6)
c = 1 + AI (2.7)

Chapter 2 Experimental
51
A total surface area Stotal and a specific surface area S are evaluated by the following
equations:
SBET,total =vmNs
V (2.8)
SBET =SBET,total
a (2.9)
where N is Avogadro's number, s is adsorption cross section, V is molar volume of adsorbent
gas, and a is the molar weight of adsorbed species.
Fig. 2.5. Photograph of Quantachrome Autosorb-1 apparatus.
The textural properties of the sample were investigated by nitrogen sorption analysis.
The nitrogen sorption isotherms and the corresponding pore size distribution were obtained at
77 K on a Quantachrome Autosorb-1 apparatus (shown in Fig. 2.5) after degassing the
samples at 200C for 3 h. The surface area, total pore volume and pore diameter of the
samples were also calculated.
2.2.4. Fourier transform-Infra red spectroscopy (FTIR)
Fourier transform-infra red spectroscopy (FTIR) is a spectroscopic technique to study
the interactions between matter and various frequencies of electromagnetic radiation in the
infrared region of the electromagnetic spectrum.24
In this spectral region molecules are
excited to higher vibrational state by coupling of the electromagnetic waves with the
molecular vibrations. The probability of a particular FTIR frequency being absorbed depends
on the actual interaction between this frequency and the molecule. A vibrational mode in a
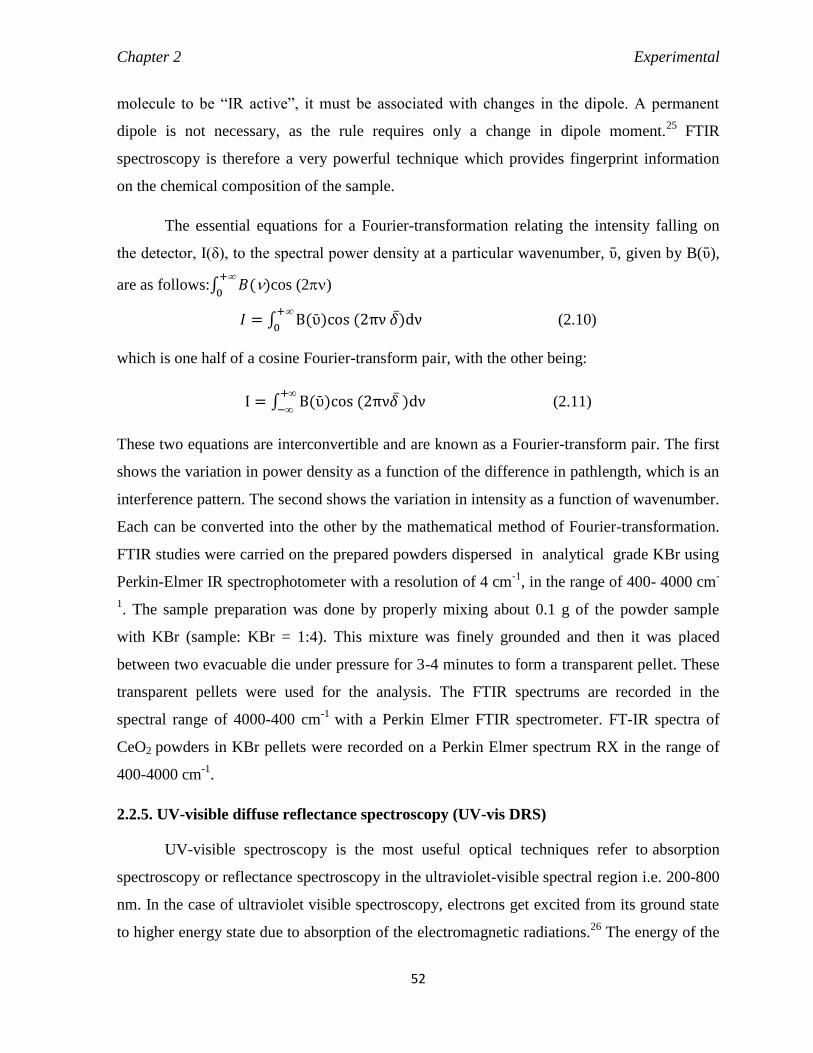
Chapter 2 Experimental
52
molecule to be “IR active”, it must be associated with changes in the dipole. A permanent
dipole is not necessary, as the rule requires only a change in dipole moment.25
FTIR
spectroscopy is therefore a very powerful technique which provides fingerprint information
on the chemical composition of the sample.
The essential equations for a Fourier-transformation relating the intensity falling on
the detector, I(δ), to the spectral power density at a particular wavenumber, ῡ, given by B(ῡ),
are as follows:∫ 𝐵()+
0cos (2)
𝐼 = ∫ B(ῡ)cos (2πν 𝛿)dν+
0 (2.10)
which is one half of a cosine Fourier-transform pair, with the other being:
I = ∫ B(ῡ)cos (2πν𝛿 )dν+
− (2.11)
These two equations are interconvertible and are known as a Fourier-transform pair. The first
shows the variation in power density as a function of the difference in pathlength, which is an
interference pattern. The second shows the variation in intensity as a function of wavenumber.
Each can be converted into the other by the mathematical method of Fourier-transformation.
FTIR studies were carried on the prepared powders dispersed in analytical grade KBr using
Perkin-Elmer IR spectrophotometer with a resolution of 4 cm-1
, in the range of 400- 4000 cm-
1. The sample preparation was done by properly mixing about 0.1 g of the powder sample
with KBr (sample: KBr = 1:4). This mixture was finely grounded and then it was placed
between two evacuable die under pressure for 3-4 minutes to form a transparent pellet. These
transparent pellets were used for the analysis. The FTIR spectrums are recorded in the
spectral range of 4000-400 cm-1
with a Perkin Elmer FTIR spectrometer. FT-IR spectra of
CeO2 powders in KBr pellets were recorded on a Perkin Elmer spectrum RX in the range of
400-4000 cm-1
.
2.2.5. UV-visible diffuse reflectance spectroscopy (UV-vis DRS)
UV-visible spectroscopy is the most useful optical techniques refer to absorption
spectroscopy or reflectance spectroscopy in the ultraviolet-visible spectral region i.e. 200-800
nm. In the case of ultraviolet visible spectroscopy, electrons get excited from its ground state
to higher energy state due to absorption of the electromagnetic radiations.26
The energy of the

Chapter 2 Experimental
53
absorbed electromagnetic radiation is equal to the energy difference between the ground state
and excited states.24
Generally, the most favored transition is from the highest occupied
molecular orbital (HOMO) to lowest unoccupied molecular orbital (LUMO). UV-Vis
spectroscopy are used to measure both in a quantitative way to determine concentrations of an
absorbing species in solution, and band gap of the semiconductor by using the Beer-Lambert
law and Kubelka-Monk plot, respectively.
The expression of Beer-Lambert law is
A = logI0
I= cL (2.12)
where A is the absorbance, in absorbance units (a.u.), I0 is the intensity of the incident light at
a given wavelength, I is the transmitted intensity, L the path length through the sample,
and c the concentration of the absorbing species and ε is the molar absorptivity or extinction
coefficient. For the evaluation of band gap energy of the nanopowder the reflectance data was
converted to the absorption coefficient F(R) values according to the Kubelka–Munk
equation27-29
i.e.
F(R) =(1−R)
2
2R (2.13)
Where F(R) is equivalent to the absorption coefficient. band gap of the nanopowder were
calculated by plotting [F (R∞) hν]1/2
vs. hν. UV-visible (UV-vis) diffuse reflectance spectra of
the nanopowder were measured using a Shimadzu spectrometer (UV-2450) using BaSO4 as a blank.
2.2.6. Photoluminescence spectroscopy (PL)
Although photoluminescence (PL) spectroscopy is very similar to that of UV-visible
absorption spectroscopy but they have two basic differences (i) in PL spectroscopy transition
involved from a higher energy level or state to a lower energy level which is the reverse
process of UV-visible absorption spectroscopy, and (ii) PL spectroscopy is a zero background
experiment whereas UV-visible absorption spectroscopy is non zero background
experiment.30
Therefore, PL measurement is more sensitive than UV-visible absorption
spectroscopy and widely used for the detection of optoelectronic properties of the
nanopowder, which provide valuable information about the quality of surface, impurity
levels, gauge alloy disorder and interface roughness. A typical PL spectrum is just a plot of
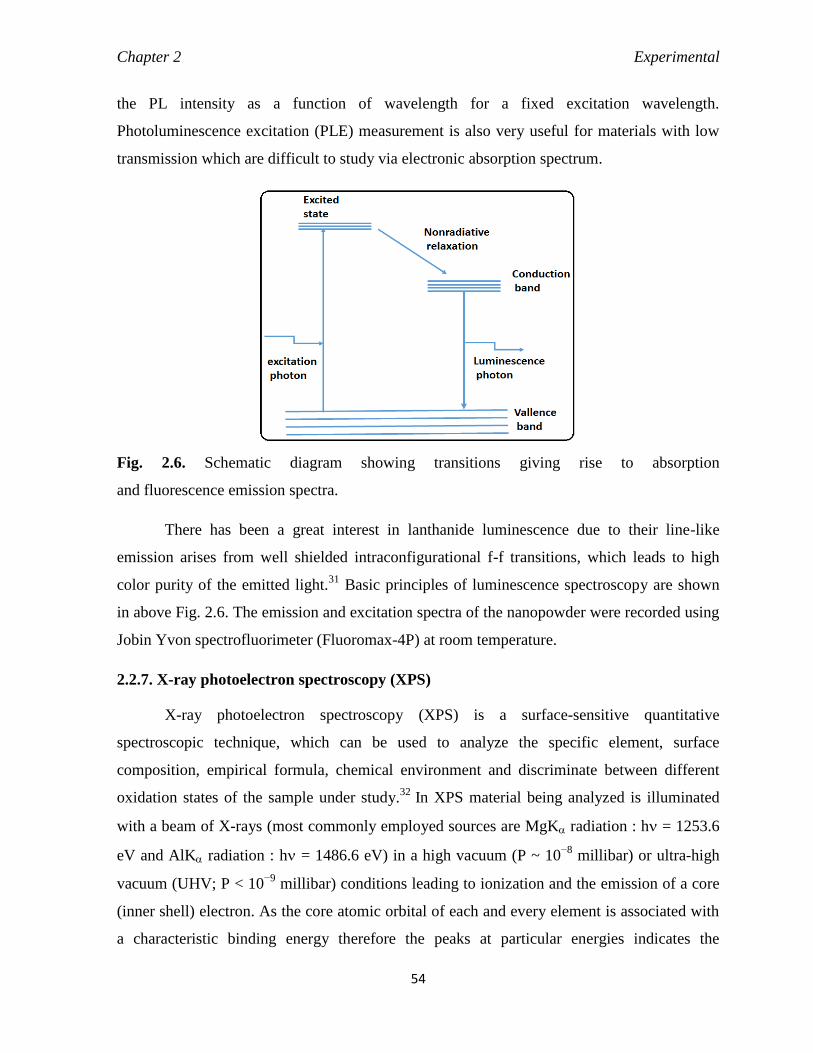
Chapter 2 Experimental
54
the PL intensity as a function of wavelength for a fixed excitation wavelength.
Photoluminescence excitation (PLE) measurement is also very useful for materials with low
transmission which are difficult to study via electronic absorption spectrum.
Fig. 2.6. Schematic diagram showing transitions giving rise to absorption
and fluorescence emission spectra.
There has been a great interest in lanthanide luminescence due to their line-like
emission arises from well shielded intraconfigurational f-f transitions, which leads to high
color purity of the emitted light.31
Basic principles of luminescence spectroscopy are shown
in above Fig. 2.6. The emission and excitation spectra of the nanopowder were recorded using
Jobin Yvon spectrofluorimeter (Fluoromax-4P) at room temperature.
2.2.7. X-ray photoelectron spectroscopy (XPS)
X-ray photoelectron spectroscopy (XPS) is a surface-sensitive quantitative
spectroscopic technique, which can be used to analyze the specific element, surface
composition, empirical formula, chemical environment and discriminate between different
oxidation states of the sample under study.32
In XPS material being analyzed is illuminated
with a beam of X-rays (most commonly employed sources are MgK radiation : h = 1253.6
eV and AlK radiation : h = 1486.6 eV) in a high vacuum (P ~ 10−8
millibar) or ultra-high
vacuum (UHV; P < 10−9
millibar) conditions leading to ionization and the emission of a core
(inner shell) electron. As the core atomic orbital of each and every element is associated with
a characteristic binding energy therefore the peaks at particular energies indicates the
Chapter 2 Experimental
55
presence of a specific element furthermore concentration of the element or it particular
oxidation state can be calculated quantitatively from the relative area of the peak. Binding
energy of the emitted electrons can be determined by using Ernest Rutherford equation:
Ebinding = Ephoton − (Ekinetic + ) (2.14)
where Ebinding is the binding energy (BE) of the electron, Ephoton is the energy of the X-ray
photons being used, Ekinetic is the kinetic energy of the electron as measured by the instrument
and is the work function dependent on both the spectrometer and the material.
X-ray photoelectron spectra were recorded by using a SPECS, Germany spectrometer,
with an Al monochromator (1486.6 eV) and a MgK source (1253.6 eV) operating under a
vacuum of 2x10⁻⁸
Torr. The deconvolution of the XPS spectra for the analysis of chemical
composition of the prepared samples, were carried out using origin software.
2.2.8. Field emission scanning electron microscopy (FESEM)
The field emission scanning electron microscope (FESEM) is a type of electron
microscope which provides topographical and elemental information at magnifications of 10x
to 3,00,000x, by scanning the sample on surface or entire with a high-energy beam of
electrons emitted from field emission gun.33
Fig. 2.7. Photograph of Nova Nano SEM 450.
Field emission SEM (FESEM) produces clearer and less electrostatically distorted
images with better spatial resolution of 0.5 to l nm than scanning electron microscope (SEM)
Chapter 2 Experimental
56
and also minimized sample charging during analysis. In FESEM primary electrons liberated
from a field emission source are subjected to narrow scan beam to interacts with the specimen
as a result secondary electrons are emitted from each spot on the object which combined with
back scattered electron produces an electronic signal that finally transformed to a video scan-
image. In this study FESEM micrograph were carried out with a Nova Nano SEM 450
(shown in Fig. 2.7) equipped with an energy dispersive X-ray spectrometer (EDX). The
samples were coated with gold by sputter coater before analysis.
2.2.9. High resolution transmission electron microscopy (HRTEM)
High resolution transmission electron microscopy (HRTEM) is a technique which
allowing unique advantage for analyzing crystal structures, lattice imperfections, stacking
faults, dislocations, crystallite size and grain boundaries to a variety of materials on an atomic
resolution scale.34,35
Fig. 2.8. Photograph of JEOL-JEM 2100 TEM.
The technique involved a direct interaction of energetic electrons with the sample and
allowed both the transmitted and the scattered beams to create an interference image.
Specimen preparation is consider very important factor in electron microscopy as the image
quality is highly dependent on the thickness of solid phases. Thinner the specimen less than
50-100 nm provide better the resolution and better contrast due to sufficient transmittance.
Specimen for HRTEM analysis prepared by disperse a few milligram of the powder in a few

Chapter 2 Experimental
57
milliliter of ethanol (EtOH) then subjected to ultrasonication for 30 min after that a drop of
the suspension deposit it on a carbon coated copper grid and allowed it to keep in open
atmosphere for few minute to evaporate liquid. The electron microscopic investigations of the
nanopowder were carried on JEOL-JEM 2100 transmission electron microscope (shown in
Fig. 2.8) operating at 200 kV.
2.2.10. Temperature programmed reduction (TPR) and temperature programmed
desorption (TPD)
Temperature programmed reduction (TPR) is a widely used technique to study the
reduction behaviour of catalysts and determines the number of reducible species present on
the catalyst surface.36
In TPR the specimen is exposed to a reductive gaseous stream (H2 or
CO in an inert gas nitrogen or argon) in a well-defined temperature change, which is usually
linear in time. Total amount of H2 or CO consumed by the specimen can be determined
quantitatively by measuring the composition (H2 or CO content) of the reducing gas mixture
at the outlet of the reactor, from which the degree of reduction can be calculated. Many
authors suggest that the utility of temperature programmed reduction can be further enhanced
by combining it with other techniques, such as temperature programmed desorption.37
It is
very useful to define the nature of the catalyst surface which may contain acidic or basic site,
for this purpose the most often required experiments are TPD-measurements by using an acid
(CO2 and SO2) or base gas (dry NH3). The TPR and TPD measurements were performed in an
Auto Chem II (Micromeritics) Chemisorb 2750 TPD/TPR system. For TPR analysis, 140 mg
of the nanopowder were pre-treated at 120°C in high pure helium has (25cc/min) for 1 h, then
cooled to room temp in helium. The TPR measurements were performed first by reducing the
sample with 5% H2/Ar with a flow rate 25 cc/min, from room temperature to 850°C. The
temperature increased with a ramping rate of 10°C. For NH3-TPD experiment, 200 mg of the
sample was pre-treated at 600°C in 30 mL high pure helium flow for 10 min, then cooled
down to 120°C in helium flow which was further subjected to NH3 adsorption/saturation by
10% NH3 in He gas@30mL/min for 30 min. Finally, the sample was exposed to flowing He
(30 mL min−1
) for 1 h at 120°C to remove physically bound ammonia from the surface. The
desorption experiment was carried out from 120 to 800°C at a heating rate of 10°C min−1
.

Chapter 2 Experimental
58
2.3. Cr(VI) adsorption study
Due to the large specific surface area, synthesized nanopowder are supposed to be an
excellent sorbent for the removal of poisonous pollutants or heavy metal ions from aqueous
solution. In the present study, Cr(VI) adsorption capacities of the synthesized nanopowder
were examined in details as a function of contact time, pH of the medium, amount of
adsorbent and concentration of adsorbate. Experimental data were also analyzed to verify
both the adsorption kinetics and isotherms according to pseudo first-order and pseudo-second-
order kinetic models and Langmuir and Freundlich isotherm models.
100 mg L-1
of Cr(VI), stock solution was prepared by dissolving 0.2834 g of K2Cr2O7
in 1000 mL of deionized water. Different Cr(VI) concentrations (20, 40, 60, and 80 mg L-1
)
were prepared by dilution of the stock K2Cr2O7 standard solution with deionized water. The
experiments were carried out in 100 mL borosil beaker by stirring 0.1 g of
nanopowders with 10 mL of the aqueous Cr(VI) solution of desired concentration at room
temperature (25°C), and without the further pH adjustment. Adsorption isotherm study was
carried out with different initial concentrations of Cr(VI) from 20 to 100 mg L-1
. The
initial pH of Cr(VI) solution was 5. The amount of Cr(VI) adsorbed per unit mass of the
adsorbent was evaluated by using the mass balance equation:
qt = (C0 − Ct)V W⁄ (2.15)
Where qt (mg g-1
) is the amount adsorbed per gram of adsorbent at time t (min), C0 is the
initial concentration of Cr(VI) in the solution (mg L-1
), Ct is the concentration of Cr(VI) at
time t of adsorption (mg L-1
), W is the mass of the adsorbent used (g), and V(L) is the initial
volume of the Cr(VI) solution. The Cr(VI) concentration in the supernatant was determined
by monitoring the absorbance at 352.5 nm on a Shimadzu ultraviolet–visible-2450
spectrophotometer.38
The percentage of adsorption can be calculated by using the equation:
Adsorption (%) = (Ci−Cf
Ci) × 100, (2.16)
where Ci and Cf represent the initial and final Cr(VI) ion concentration (mg L-1
) in solution.
2.3.1. Effect of variable parameters
The effect of various parameters on the percentage of Cr adsorption was evaluated as
explained below:

Chapter 2 Experimental
59
2.3.1.1. Effect of contact time
Contact time between the adsorbate and adsorbent is of great importance in adsorption
as it depends on the nature of the system used. The effect of contact time was studied by
adding 0.1 g of nanopowder into10 mL of Cr(VI) solution and stirred for a period ranging
from 5 min to 3 h at room temperature without any further adjustment of pH i.e. at initial pH
of 5.
2.3.1.2. Effect of pH
The pH of the aqueous solution is a significant controlling factor in adsorption
mechanism. Desired pH value for maximum removal efficiency was optimized by adding 0.1
g of nanopowder in 10 mL of Cr(VI) solution (100 mg L−1
) at different pH values from 1 to
13 with constant stirring for fixed contact time of 1 h. The pH of the solution was adjusted by
adding dilute solutions of NH4OH or HNO3.
2.3.1.3. Effect of amount of adsorbent
The amount of adsorbent dosage also play key role on adsorption. In order to study the
effect of adsorbent dose on chromium removal, different amount of adsorbent was added
into10 mL of Cr(VI) solution at pH 5 with constant stirring of fixed contact time of 1h.
2.3.1.4. Effect of adsorbate concentration
Adsorption processes of the metal ion strongly depend upon the initial concentration.
For this investigation Cr(VI) adsorption study was carried out by adding 0.1g of nanopowder
into varying concentrations of Cr(VI) solution (20 mg L-1
to 100 mg L-1
) at pH 5 with
constant stirring of fixed contact time of 1h.
2.3.1.5. Study of adsorption isotherms
Adsorption isotherm described the interactive behaviour between the adsorbate and
adsorbents which are very important for investigating the adsorption mechanisms. Chromium
adsorption behaviour of the nanopowder were described by fitting the isotherms data to the
Freundlich and Langmuir adsorption models. These two isotherms provide information about
the total amount of adsorbent needed to adsorb a required amount of adsorbate from solution.
Chapter 2 Experimental
60
(a) Langmuir adsorption isotherm
Langmuir adsorption isotherm39
is based on the assumption that adsorbed layer will be
monolayer coverage of the adsorbate on the adsorbent surface and all sorption sites are
identical and energetically equivalent. The Langmuir isotherm model is utilized to calculate
the maximum adsorption capacity, in terms of amount of the Cr(VI) ion adsorbed per unit
weight of the nanopowder. The linear forms of the Langmuir isotherm can be mathematically
represented by the equation:
𝐶𝑒
qe=
1
𝑞𝑚𝑏+C𝑒
qm (2.17)
Where qe is the amount adsorbed (mg g-1
) at equilibrium, qm is the maximum
adsorption capacity (mg g-1
), Ce is the equilibrium concentration of the adsorbate (mg L-1
),
and b (L mg-1
) is the Langmuir constant. The maximum adsorption capacity, qm and the
constant b can be obtained from the slope and intercept of the plot of Ce/qe against Ce. The
nature of the Langmuir isotherm can be expressed in terms of a dimensionless constant
separation factor, RL which is defined as:
RL = 1
1+ bCo (2.18)
where b and Co are Langmuir constant and initial Cr(VI) concentration (mg L-1
).40
The RL
values indicate the shape of the isotherms. Adsorption would be irreversible when RL = 0,
favorable when 0 < RL < 1, linear when RL = 1 and unfavorable when RL > 1.41
(b) Freundlich isotherm
The Freundlich isotherm42
is another useful model based on multilayer adsorption with
the assumption that adsorbent consists of a heterogeneous surface sites, which provides an
empirical relationship between the sorption capacity and the equilibrium concentration of the
adsorbent. The linearized form of this isotherm can be expressed as
logqe = log KF + 1
n logCe (2.19)
where Ce is the equilibrium concentration of the metal ion in mg L-1
, qe is the amount of
chromium(VI) adsorbed at equilibrium in mg g-1
, and KF and n are the Freundlich constants,

Chapter 2 Experimental
61
which indicate the adsorption capacity and the adsorption intensity, respectively. The values
of KF and n can be determined from the slope and intercept of the logarithmic plot of qe vs Ce.
2.3.1.6. Study of adsorption kinetics
Several kinetic models have been developed43
to describe the mechanism of heavy
metal ion removal, among which two most commonly used models are pseudo-first-order and
pseudo-second-order models. In order to understand the kinetics of Cr (VI) adsorption by the
synthesized nanopowder, experimental data were modeled using Lagergren's pseudo-first-
order and pseudo-second order kinetic equations.
References
1. L. A. Bruce, M. Hoang, A. E. Hughes and T. W. Turney, Appl. Catal. A Gen., 1996, 134, 351.
2. J. E. Spanier, R. D. Robinson, F. Zhang, S. W. Chan and I. P. Herman, Phys. Rev. B Condens. Matter
Mater. Phys., 2001, 64, 245407.
3. L. Madler, W. J. Stark and S. E. Pratsinis, J. Mater. Res., 2002, 17, 1356.
4. Y. J. He, B. L. Yang and G. X. Cheng, Mater. Lett., 2003, 57, 1880.
5. M. Hirano and E. Kato, J. Am. Ceram. Soc., 1999, 82, 786.
6. J. L. M. Rupp, T. Drobek, A. Rossi and L. J. Gauckler, Chem. Mater., 2007, 19, 1134.
7. X. H. Yu, F. Li, X. R. Ye, X. Q. Xin and Z. L. Xue, J. Am. Ceram. Soc., 2000, 83, 964.
8. C. L. Robert, J. W. Long, E. M. Lucas, K. A. Pettigrew, R. M. Stround, M. S. Doescher and D. R.
Rolison, Chem. Mater., 2006, 18, 50.
9. Y. Zhow, R. J. Philips and J. A. Switzer, J. Am. Ceram. Soc., 1995, 78, 981.
10. T. Masui, K. Fujiwara, K. I. Machida and G. Y. Adachi, Chem. Mater., 1997, 9, 2197.
11. C. Ho, C. J. Yu, T. Kwong, A. C. Mak and S. Lai, Chem. Mater., 2005, 17, 4514.
12. M. M. Natile, G. Boccaletti and A. Glisenti, Chem. Mater., 2005, 17, 6272.
13. H. Wang, J. J. Zhu, J. M. Zhu, X. H. Liao, S. Xu, T. Ding and H. Y. Chen, Phys. Chem. Chem. Phys.,
2002, 4, 3794.
14. M. L. D. Santos, R. C. Lima, C. S. Riccardi, R. L. Tranquilin, P. R. Bueno, J. A. Varela and E. Longo,
Mater. Lett., 2008, 62, 4509.
15. M. Hirano and M. Inagaki, J. Mater. Chem., 2000, 10, 473.
16. H. Yang, C. Huang, A. Tang, X. Zhang and W. Yang, Mater. Res. Bullet., 2005, 40, 1690.
17. M. Guglielmi, G. Kickelbick and A. Martucci, Sol-Gel Nanocomposites, ed., Springer, New York, 3rd
edn., 2014, pp. 102.
18. R. Daniel and J. Musil, Novel Nanocomposite Coatings, Taylor & Francis Group, USA, 2013, pp. 102.
19. V. K. Ahuliwala and A. Mishra, Polymer Science: A Texbook, Ane Books Pvt. Ltd., India, 2009, pp. 118.
Chapter 2 Experimental
62
20. G. R. Chatwal and S. K. Anand, Instrumental Methods of Chemical Analysis, Himalaya Publishing
House, India, 5th ed., 2007, pp. 2.719.
21. B. D. Cullity and S. R. Stock, Elements of X-Ray Diffraction, Addison-Wesley Publishing
Company,Inc., USA, 3rd ed., 1956, pp. 99.
22. S. Brunauer, P.H. Emmet and E. Teller, J. Am. Chem. Soc., 60, 1938, 309.
23. D. N. Bajpai, Advanced Physical Chemistry, S. Chand and Company Ltd., India, 2nd ed., 2001, pp.
727.
24. D.L. Pavia, G.M. Lampman and G.S. Kriz, Introduction to Spectroscopy, Thomson Learning Inc., 3rd
ed. USA, 2001, pp. 13.
25. P. Atkins and J. D. Paula, Elements of physical chemistry, W. H. Freeman, 5th ed., Oxford, 2009, pp.
459.
26. D. A. Skoog, F. J. Holler and R. S. Crouch, Principles of instrumental analysis, Thomson Brooks/Cole,
Belmont, CA:, 6th ed., 2007, pp. 169.
27. G. Kortum, Reflectance Spectroscopy: Principles, Methods, Applications, Springer, New York, 1969.
28. G. Burgeth and H. Kisch, Coord. Chem. Rev., 230, 2002, 41.
29. E.L. Simmons, Appl. Opt., 14, 1975, 1380.
30. J. Z. Zhang, Optical Properties and Spectroscopy of Nanomaterials, World Scientific Publishing Co.
Pte. Ltd., USA, 2009, pp. 18.
31. K. Binnemans, Chem. Rev., 2009, 109, 4283.
32. X-Ray Photoelectron Spectroscopy, ed. J. M. Wagner, Nova Science Publishers, Inc., New York, 2011,
pp. 2.
33. J. M. Huggett and H. F. Shaw, Clay Minerals, 1997, 32, 197.
34. J. C. H. Spence, High-Reolution Electron Microscopy, Oxford U. Press, Oxford, 3rd ed., 2003.
35. High-Resolution Transmission Electron Microscopy: and Associated Techniques, ed. P. Buseck, J.
Cowley and L. Eyring, Oxford U. Press, Oxford, 1988.
36. J. Lynch, Physico-Chemical Analysis of Industrial Catalysts: A Practical Guide to Characterization,
Edittion Technip, Paris, 2001, pp. 26.
37. S. Subramanian, Platinum Metals Rev., 36, 2, 1992, 98.
38. ASTM D 1687-92, Chromium in Water, Test Method A, 1996.
39. I. Langmuir, J. Am. Chem. Soc., 40, 1918, 1361.
40. A. S. K. Kumar, S. Kalidhasan, V. Rajesh and N. Rajesh, Ind. Eng. Chem. Res., 2012, 51, 58.
41. R. Zhang, B. Wang and H. Ma, Desalination. 2010, 255, 61.
42. H. M. F. Freundlich, J. Phys. Chem., 1906, 57, 385.
43. H. Qiu, L. Lv, B, C. Pan, Q. Zhang, W. Zhang, and Q. Zhan, J. Zhejiang Univ. Sci. A., 2009, 10, 716.

Chapter 3 Mesoporous Ceria
63
Chapter 3
High Surface Area Mesoporous Ceria
Synthesized With and Without Surfactant
Outline
Surfactant assisted synthesis of pure CeO2 materials remarkably control the structural
and functional characteristics of the materials. A comparative study has been done to find out
the role of a surfactant sodium dodecyl sulphate (SDS) on the structural, microstructural and
optical properties of CeO2. The CeO2 samples were characterized by TG–DSC, XRD, BET,
XPS, Raman, EPR, UV, PL, HRTEM, TPR and TPD. Thermal analysis showed that the weight
loss of as-prepared CeO2 sample (100Ceasp) was much higher (16.85%) than the sample
synthesized with surfactant (100CeSDSasp) (9.58%). XRD and thermal analyses showed that
the surfactant has played important role in crystallization of cubic CeO2 at a lower
temperature. The 100CeSDSasp sample showed significantly better control over the reduction
in the surface area that occurred during the heat treatments than the 100Ceasp sample. XPS
and EPR analysis confirm the existence of mixed valence states (Ce3+
and Ce4+
) in the
nanocrystals. Surfactant molecules also enhance both the UV absorption and PL intensity of
CeO2 nanoparticles. TPD profile illustrates the more acidity on the surface of the CeO2
sample synthesized via surfactant assisted route, which is attributed to the presence of
residual sulfate as sodium dodecyl sulphate. The smaller crystallite size of the CeO2
nanopowder synthesized via surfactant free route with lower Ce–O symmetry leads to higher
number of reactive surface oxygen sites and/or surface oxygen vacancy clusters in the
sample. This study reveals that surfactant assisted synthesis approach is significantly a better
strategy for the synthesis of crystalline CeO2 nanopowder at lower temperature and showed
better stability of surface property for the possibility of these materials to be used as better
UV blockers, nanophosphor, adsorption for toxic metal, dye degradation and catalysis.

Chapter 3 Mesoporous Ceria
64
3.1. Introduction
Due to various unique properties such as high refractive index, good transmission in
visible and infrared regions, strong adhesion, and high stability against mechanical abrasion,
chemical attack and high temperatures1 CeO2 with an extraordinary capacity to store and
release oxygen with cubic fluorite structure,2 is considered to be one of the most useful
promising metal oxides for wide varieties of technological applications in automotive three
way catalysts,3 ultraviolet absorbers,
4 hydrogen storage materials,
5 oxygen sensors,
6 optical
devices,7
and polishing materials.8 Potential uses of CeO2 includes the removal of soot from
diesel engine exhaust, for the removal of organics from wastewaters, as an additive for
combustion processes, and in fuel cell technology.9,10
Now a days much interest is being focused on the preparation of transition metal
oxides through templating pathways.11-13
Few mesostructured materials showed a regular pore
structure even after calcination14,15
but often the pore structure collapses upon calcination.16
The use of surfactants as liquid crystal templating agents is to create a regular three
dimensional micellar array about which an inorganic precursor could form a framework gives
a reliable method to produce structurally ordered, porous solids. The subsequent removal of
surfactant in a controlled manner yields a material with an open framework with uniform pore
dimensions. In many methods to synthesize nanoparticles, surfactants are employed as a
stabilizer, capping agent and template, which can control the size, anisotropic growth and
agglomeration. CTAB (cetyltrimethylammonium bromide) and SDS (sodium dodecyl
sulphate) surfactants have been widely used as cationic and anionic surfactants, respectively,
for synthesizing a large numbers of inorganic materials with controlled shape and size.17,18
The addition of surfactant in precursor solution reduces the surface tension of the solution,
facilitates nucleation, and controls the growth of the particle and hence resulting in smaller
sized particles. Surfactant molecules are composed of a hydrophilic head and a hydrophobic
tail which results in the formation of reverse micelles in the precursor solution. Surfactant
assisted route is widely used to prepare nanocrystalline CeO2. Terribile et al. suggested that
the cationic surfactant CTAB does not act as a true templating agent but as a surface area
enhancer by incorporation into the hydrous oxide and lowering of the surface tension of water
in the pores during drying.19 Wang et al. synthesized stable and crystalline pure CeO2
nanoparticles by using cationic surfactant CTAB.20 Rhombic micro plates of CeO2 was

Chapter 3 Mesoporous Ceria
65
synthesized using aqueous cerium nitrate solution in presence of urea and CTAB. BET
surface area, and pore volume of the microplates were 57 m2/g, and 0.03 cm
3/g,
respectively.21
Tabrizi et al. studied simultaneously the effects of process variables of pH,
CTAB/metal molar ratio and calcination temperatures on the surface area of CeO2
nanopowders prepared by surfactant assisted precipitation method.22
Brigante evaluated
the effect of pH on the morphology and texture of CeO2 by using the cationic
surfactant cetyltrimethylammonium tosylate (CTAT) as template. The surface area and
pore volume of the synthesized material were 33.52 m2/g and 0.06 cm
3/g, respectively.
23
Zhang et al. obtained 0.5–2l nm sized plates having thickness of 100–400 nm, and surface
area of 29.1 m2/g of rhombic CeO2 microplate using CTAB-urea at aqueous refluxing
temperature.24
However, limited publications are available on the influence of surfactant on
size, morphology, and optical properties of CeO2 nanostructures. In this study, CeO2
nanoparticles have been synthesized with and without surfactant through a facile chemical
route using aqueous solutions of inorganic precursors and surfactant. We have explored the
use of sodium dodecyl sulphate as a surfactant for the synthesis of nanocrystalline CeO2. The
samples are characterized by several instrumental techniques such as TG–DSC, XRD, BET,
XPS, Raman, EPR, UV, PL, HRTEM, TPR and TPD to find out the influence of surfactant
molecules in the formation of CeO2 nanoparticles with controlled size and hence on the properties.
3.2. Experimental and characterization
Pure CeO2 with (100CeSDSasp) and without (100Ceasp) surfactant were synthesized
using cheaper inorganic precursor of ceric ammonium nitrate as metal ion precursor and SDS
as surfactant. The samples were prepared via both conventional and microwave refluxing
methods and then characterized by different instrumental techniques (details are given in
chapter-II).
3.3. Results and Discussion
3.3.1. TG–DSC
3.3.1.1. Effect of surfactant
TG–DSC curves of the as-prepared materials synthesized with and without surfactant
are shown in Fig. 3.1(A) and (B) respectively. An endothermic peak centered at 77 or 98°C
was observed for the sample prepared with or without surfactant. This endothermic peak is
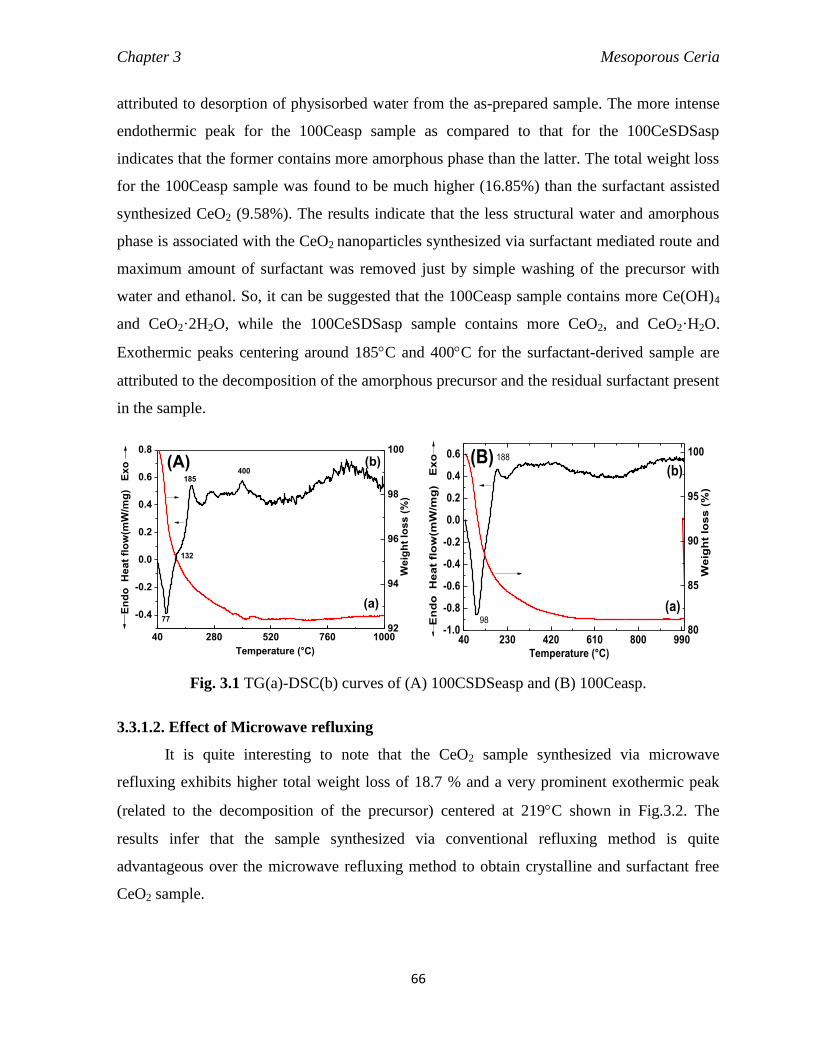
Chapter 3 Mesoporous Ceria
66
attributed to desorption of physisorbed water from the as-prepared sample. The more intense
endothermic peak for the 100Ceasp sample as compared to that for the 100CeSDSasp
indicates that the former contains more amorphous phase than the latter. The total weight loss
for the 100Ceasp sample was found to be much higher (16.85%) than the surfactant assisted
synthesized CeO2 (9.58%). The results indicate that the less structural water and amorphous
phase is associated with the CeO2 nanoparticles synthesized via surfactant mediated route and
maximum amount of surfactant was removed just by simple washing of the precursor with
water and ethanol. So, it can be suggested that the 100Ceasp sample contains more Ce(OH)4
and CeO2·2H2O, while the 100CeSDSasp sample contains more CeO2, and CeO2·H2O.
Exothermic peaks centering around 185C and 400C for the surfactant-derived sample are
attributed to the decomposition of the amorphous precursor and the residual surfactant present
in the sample.
40 280 520 760 100092
94
96
98
100
-0.4
-0.2
0.0
0.2
0.4
0.6
0.8
Temperature (°C)
(b)
En
do
H
ea
t fl
ow
(mW
/mg
)
Ex
o
We
igh
t lo
ss
(%
)
77
132
185400
(A)
(a)
40 230 420 610 800 990-1.0
-0.8
-0.6
-0.4
-0.2
0.0
0.2
0.4
0.6
E
nd
o
He
at
flo
w(m
W/m
g)
E
xo
Temperature (°C)
98
188(B)
80
85
90
95
100
(b)
(a)
W
eig
ht
los
s (
%)
Fig. 3.1 TG(a)-DSC(b) curves of (A) 100CSDSeasp and (B) 100Ceasp.
3.3.1.2. Effect of Microwave refluxing
It is quite interesting to note that the CeO2 sample synthesized via microwave
refluxing exhibits higher total weight loss of 18.7 % and a very prominent exothermic peak
(related to the decomposition of the precursor) centered at 219C shown in Fig.3.2. The
results infer that the sample synthesized via conventional refluxing method is quite
advantageous over the microwave refluxing method to obtain crystalline and surfactant free
CeO2 sample.

Chapter 3 Mesoporous Ceria
67
35 228 421 614 807 1000-0.5
0.0
0.5
1.0
1.5
2.0
2.5
3.0
Temperature (°C)
En
do
H
ea
t fl
ow
(mW
/mg
)
Ex
o
64
142
219
80
85
90
95
100
(a)
(b) We
igh
t lo
ss
(%
)
Fig. 3.2. TG(a)-DSC(b) curves of 100CeSDSMWasp.
3.3.2. XRD
3.3.2.1. Effect of surfactant
Fig. 3.3 shows the X-ray diffraction patterns of the as-prepared nanopowders
synthesized (a) without and (b) with surfactant. The broad and weak intensities of 100Ceasp
powders indicate the formation of poorly crystalline CeO2 with amorphous phase. The XRD
pattern of the 100CeSDSasp nanopowder show the formation of highly crystalline cubic CeO2
phase, which revealed the utility of sodium dodecyl sulphate as structure directing agent to
impart better crystallinity even at lower temperature. The average crystallite sizes d of the as-
prepared CeO2 samples were calculated from X-ray line by using Scherrer’s equation (i.e., d =
0.89λ
βcosθ) of the most intense peak (111), where d is the average crystallite size, λ is the
wavelength of the X-rays, θ is the diffraction angle, and β is the full width at half maxima of
the peak. The lattice parameters of both the as-prepared samples were also determined and all
are summarized in Table. 3.1.
Table. 3.1. Crystallize size and lattice parameters of the as-prepared CeO2 powders, (a)
without, and (b) with surfactant.
Sample Crystallite size
(nm)
Lattice parameter
(nm)
100CeSDSasp 8.43 0.5410
100Ceasp 3.39 0.5413

Chapter 3 Mesoporous Ceria
68
20 30 40 50 60 70 80
(111)
(b)
(a)
(42
0)
(33
1)
(400)(222)
(311)
(220)
(200)In
ten
sit
y (
a.u
.)
Diffraction angle (2)
Fig. 3.3 XRD patterns of the (a) 100Ceasp (b) 100CeSDSasp.
3.3.2.2. Effect of calcination temperature
XRD patterns of the (a) 100CeSDSasp sample and calcined at various temperatures
of (b) 500°C, (c) 650°C, (d) 800°C, and (e) 1000°C for 2 h are shown in Fig. 3.4. All are
indexed to cubic fluorite structure and was in good agreement with literature data (JCPDS
No.34-0394). Diffraction peaks characteristic of crystalline Ce2O3 phase were not observed in
the XRD pattern. Both crystallite size and lattice parameters of all the samples were
calculated and summarized in Table 3.2. A consistent increase in crystallite size of CeO2 was
observed with increasing the calcinations temperatures. Further, no diffraction peaks of any
sample that could be attributed to cerium hydroxide were observed. Li et al. noted that the
crystallite size of CeO2 shows an exponential dependence on the calcination temperature
because the crystallite growth of CeO2 is controlled by diffusion.25 These results reveal that
the crystallite growth is very slow till 650°C temperatures. However, when the as-synthesied
CeO2 powders were calcined at higher temperature of 800°C and 1000°C, the crystallite sizes
of CeO2 rapidly increased. Continuous grain boundary networks are formed at higher
calcination temperatures. These networks lead to the bridging of fine crystallites, thereby
increasing the crystallite size. The results suggest that the pores existing in the interior of the
CeO2 precursor powders are rapidly eliminated under these conditions.
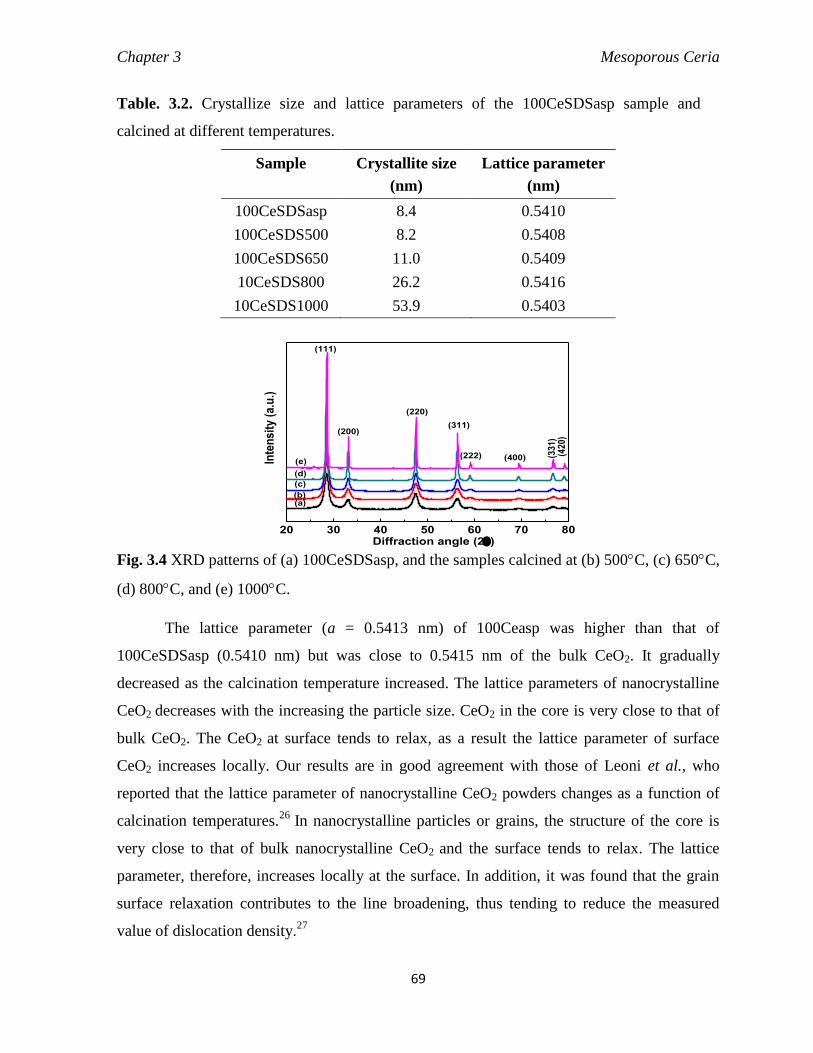
Chapter 3 Mesoporous Ceria
69
Table. 3.2. Crystallize size and lattice parameters of the 100CeSDSasp sample and
calcined at different temperatures.
Sample Crystallite size
(nm)
Lattice parameter
(nm)
100CeSDSasp 8.4 0.5410
100CeSDS500 8.2 0.5408
100CeSDS650 11.0 0.5409
10CeSDS800 26.2 0.5416
10CeSDS1000 53.9 0.5403
20 30 40 50 60 70 80
(d)
(e)
(b)
(c)
(42
0)
(33
1)
(400)(222)
(311)
(220)
(200)
(111)
Inte
nsit
y (
a.u
.)
Diffraction angle (2)
(a)
Fig. 3.4 XRD patterns of (a) 100CeSDSasp, and the samples calcined at (b) 500C, (c) 650C,
(d) 800C, and (e) 1000C.
The lattice parameter (a = 0.5413 nm) of 100Ceasp was higher than that of
100CeSDSasp (0.5410 nm) but was close to 0.5415 nm of the bulk CeO2. It gradually
decreased as the calcination temperature increased. The lattice parameters of nanocrystalline
CeO2 decreases with the increasing the particle size. CeO2 in the core is very close to that of
bulk CeO2. The CeO2 at surface tends to relax, as a result the lattice parameter of surface
CeO2 increases locally. Our results are in good agreement with those of Leoni et al., who
reported that the lattice parameter of nanocrystalline CeO2 powders changes as a function of
calcination temperatures.26
In nanocrystalline particles or grains, the structure of the core is
very close to that of bulk nanocrystalline CeO2 and the surface tends to relax. The lattice
parameter, therefore, increases locally at the surface. In addition, it was found that the grain
surface relaxation contributes to the line broadening, thus tending to reduce the measured
value of dislocation density.27
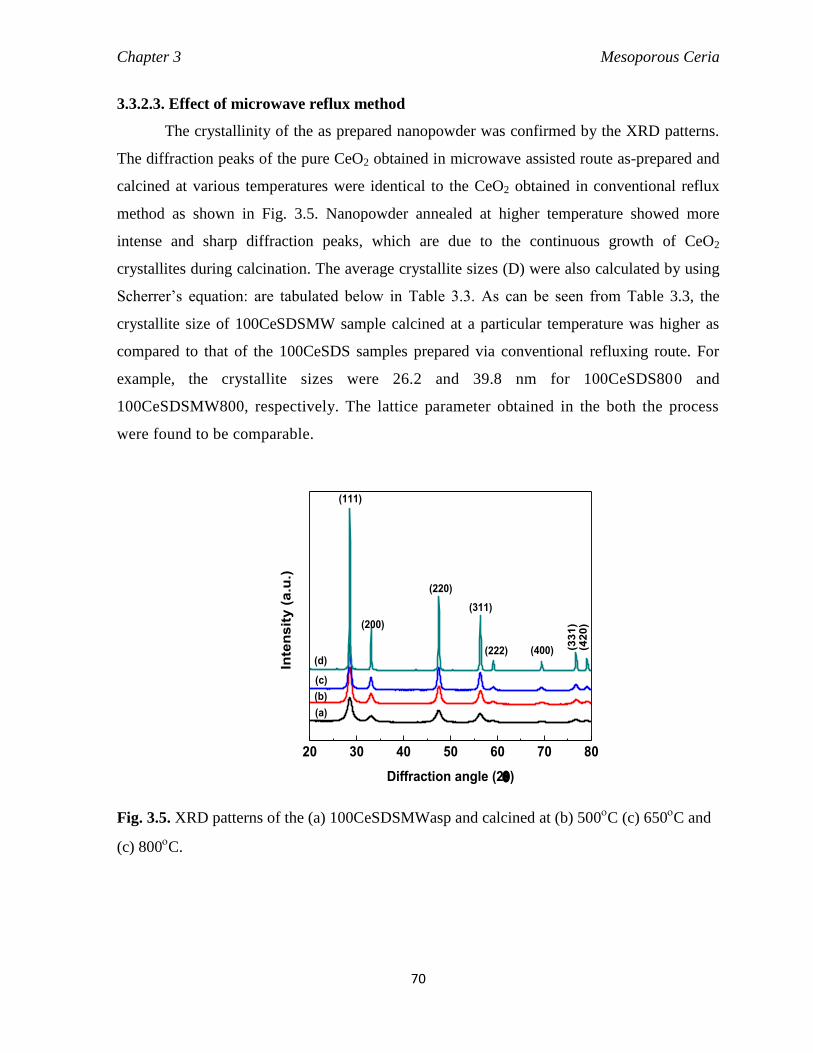
Chapter 3 Mesoporous Ceria
70
3.3.2.3. Effect of microwave reflux method
The crystallinity of the as prepared nanopowder was confirmed by the XRD patterns.
The diffraction peaks of the pure CeO2 obtained in microwave assisted route as-prepared and
calcined at various temperatures were identical to the CeO2 obtained in conventional reflux
method as shown in Fig. 3.5. Nanopowder annealed at higher temperature showed more
intense and sharp diffraction peaks, which are due to the continuous growth of CeO2
crystallites during calcination. The average crystallite sizes (D) were also calculated by using
Scherrer’s equation: are tabulated below in Table 3.3. As can be seen from Table 3.3, the
crystallite size of 100CeSDSMW sample calcined at a particular temperature was higher as
compared to that of the 100CeSDS samples prepared via conventional refluxing route. For
example, the crystallite sizes were 26.2 and 39.8 nm for 100CeSDS800 and
100CeSDSMW800, respectively. The lattice parameter obtained in the both the process
were found to be comparable.
20 30 40 50 60 70 80
(d)
(c)
(b)
(111)
(42
0)
(33
1)
(400)(222)
(311)
(220)
(200)
Inte
nsit
y (
a.u
.)
Diffraction angle (2)
100CeSDSMWASP
100CeSDSMW500
100CeSDSMW650
100CeSDSMW800
(a)
Fig. 3.5. XRD patterns of the (a) 100CeSDSMWasp and calcined at (b) 500C (c) 650
C and
(c) 800C.

Chapter 3 Mesoporous Ceria
71
Table. 3.3. Crystallize size and lattice parameters of as-prepared 100CeSDSMW samples
and calcined at (b) 500C (c) 650C, and (c) 800C.
Sample Crystallite size
(nm)
Lattice parameter
(nm)
100CeSDSMWasp 6.4 0.5413
100CeSDSMW500 8.9 0.5408
100CeSDSMW650 13 0.5416
10CeSDSMW800 39.8 0.5409
3.3.3. BET surface area
3.3.3.1. Effect of calcination temperature
The nitrogen adsorption desorption isotherms of 100Ce and 100CeSDS samples
calcined at different temperatures showed Type-IV isotherms, and are shown in Fig. 3.6 and
Fig. 3.7, respectively. The BET surface area was estimated using adsorption data in a relative
pressure range from 0.02 to 1.0. The specific surface areas of 100CeSDSasp (151 m²/g) is
lower as compared to that of 100Ceasp (292 m2/g). This is due to the presence of higher
content of amorphous cerium hydroxide in the as-prepared sample prepared without
surfactant, as is also evident from the TG-DSC results. As the calcination temperature
increases, the isotherms shift downward while the hysteresis loops at high relative pressure
become smaller; these changes indicate a decrease in BET surface area. The surface areas of
100Ce500, 100Ce650 and 100Ce800 are 108, 39 and 24 m²/g, respectively. While the surface
areas of 100CeSDS500, 100CeSDS650 and 100CeSDS800 are 115, 75, and 39 m²/g,
respectively. The more rigorous decrease in the specific surface area with calcination
temperatures for the samples synthesized without surfactant indicates that the surfactant plays
a very important role in controlling particle size, particle growth, and surface area of CeO2.
BET surface area and the pore volumes decreases while the average pore diameter increases
with an increase of calcination temperature. This is due to the tendency of the nanoparticles to
agglomerate intensively and collapsing of the pores at higher temperatures.21
The pore size
distributions of 100Ce and 100CeSDS samples calcined at different temperatures are shown
in the Fig. 3.6(B) and 3.7(B), respectively. Table. 3.4 and 3.5 present the detailed results
about the specific surface area, pore size, and pore volume of 100Ce and 100Cesds samples
calcined at different temperatures.
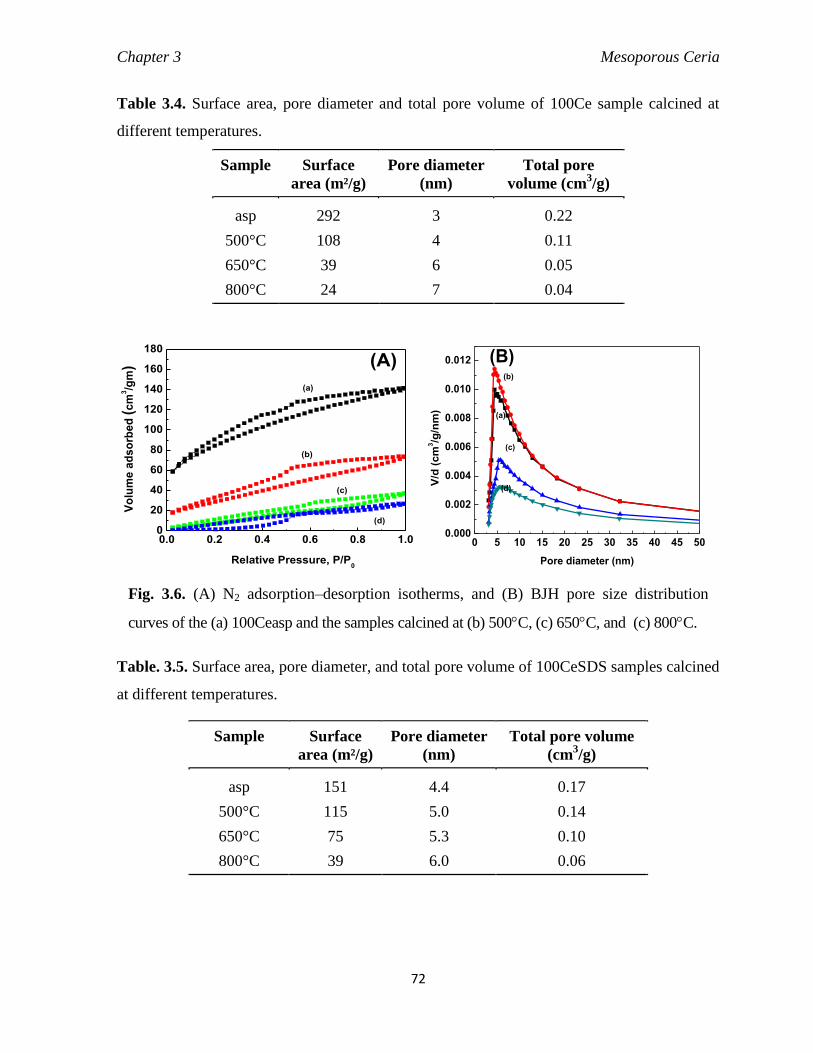
Chapter 3 Mesoporous Ceria
72
Table 3.4. Surface area, pore diameter and total pore volume of 100Ce sample calcined at
different temperatures.
0.0 0.2 0.4 0.6 0.8 1.00
20
40
60
80
100
120
140
160
180
(d)
(c)
(b)
Vo
lum
e a
ds
orb
ed
(c
m3/g
m)
Relative Pressure, P/P0
(A)
(a)
0 5 10 15 20 25 30 35 40 45 500.000
0.002
0.004
0.006
0.008
0.010
0.012
(d)
(c)
(b)
V/d
(cm
3/g
/nm
)
Pore diameter (nm)
(a)
(B)
Fig. 3.6. (A) N2 adsorption–desorption isotherms, and (B) BJH pore size distribution
curves of the (a) 100Ceasp and the samples calcined at (b) 500C, (c) 650C, and (c) 800C.
Table. 3.5. Surface area, pore diameter, and total pore volume of 100CeSDS samples calcined
at different temperatures.
Sample Surface
area (m²/g)
Pore diameter
(nm)
Total pore volume
(cm3/g)
asp 151 4.4 0.17
500°C 115 5.0 0.14
650°C 75 5.3 0.10
800°C 39 6.0 0.06
Sample Surface
area (m²/g)
Pore diameter
(nm)
Total pore
volume (cm3/g)
asp 292 3 0.22
500°C 108 4 0.11
650°C 39 6 0.05
800°C 24 7 0.04

Chapter 3 Mesoporous Ceria
73
0.0 0.2 0.4 0.6 0.8 1.00
20
40
60
80
100
120
(b)
(d)
(c)
Vo
lum
e a
ds
orb
ed
(c
m3/g
m)
Relative Pressure, P/P0
(A)
(a)
0 10 20 30 40 500.000
0.002
0.004
0.006
0.008
0.010
(d)
(c)
(b)
V/d
(c
m3/g
/nm
)
Pore diameter (nm)
(a)
(B)
Fig. 3.7. (A) N2 adsorption–desorption isotherms and (B) BJH pore size distribution of
100CeSDS samples (a) as prepared, calcined at (b) 500C, (c) 650C, and (c) 800C.
3.3.3.2. Effect of microwave reflux methods
The nitrogen sorption isotherms of 100CeSDSMW samples calcined at different
temperatures showing the Type-IV isotherms are shown in Fig. 3.8. The surface area and total
pore volume of the 100CeSDSMW samples (as given in Table 3.6) calcined at a particular
temperature are much lower as compared to those of the samples synthesized via microwave
refluxing. This envisages that the conventional refluxing method is more advantageous in
obtaining CeO2 nanopowders with higher surface area and pore volume.
0.0 0.2 0.4 0.6 0.8 1.00
10
20
30
40
50
60
70
80
90
100
(c)
(b)
Vo
lum
e a
ds
orb
ed
(c
m3/g
)
Relative pressure, P/P0
(a)
(A)
0 5 10 15 20 25 30
0.000
0.002
0.004
0.006
0.008
(c)
(b)
V/d
(cm
3/g
/nm
)
Pore diameter (nm)
(B)
(a)
Fig. 3.8. (A) N2 adsorption–desorption isotherms and (B) BJH pore size distribution of
100CeSDSMW (a) as prepared samples, calcined at (b) 500C and (c) 650C.

Chapter 3 Mesoporous Ceria
74
Table. 3.6. Surface area, pore diameter, and total pore volume of 100CeSDSMWasp and the
samples calcined at (b) 500C and (c) 650C.
Sample Surface area
(m²/g)
Pore diameter
(nm)
Pore volume
(cm3/g)
asp 109.7 4.0 0.11
500°C 82.4 7.2 0.15
650°C 24.1 5.5 0.03
3.3.4. FTIR spectra
Fig. 3.9 shows the FTIR spectra of the pure CeO2 obtained in surfactant free route
route asprepared and calcined at 500°C. Both the as-prepared and calcined samples show a
broad absorption band in the range of 3330–3400 cm−1
are attributed to the stretching
vibration of O-H bond in the surfaced hydroxyl group.28
The absorption band around 1615
cm−1 could be assigned to the bending vibration of absorbed molecular water.
29 The bands
centered at 1058 and 1332 cm−1
are due to Ce–O–Ce vibration.30
The bands observed at 946
cm-1
may be due to the δ(Ce–O–Ce) mode.31
4000 3500 3000 2500 2000 1500 1000 500
(b)
Tra
nsm
itta
ne (
a.u
.)
Wavenumber (cm-1)
3368
1615
15251332
1058
946
877
728(a)
505
Fig. 3.9. FTIR spectra of the (a) 100Ceasp and (b) 100ce500C.
Surface interaction between the inorganic precursors and the surfactant were studied
by means of FTIR spectroscopy. Fig. 3.10, shows the FTIR spectra of the pure SDS and pure
CeO2 obtained in SDS assisted route as-prepared and calcined at various temperature. The
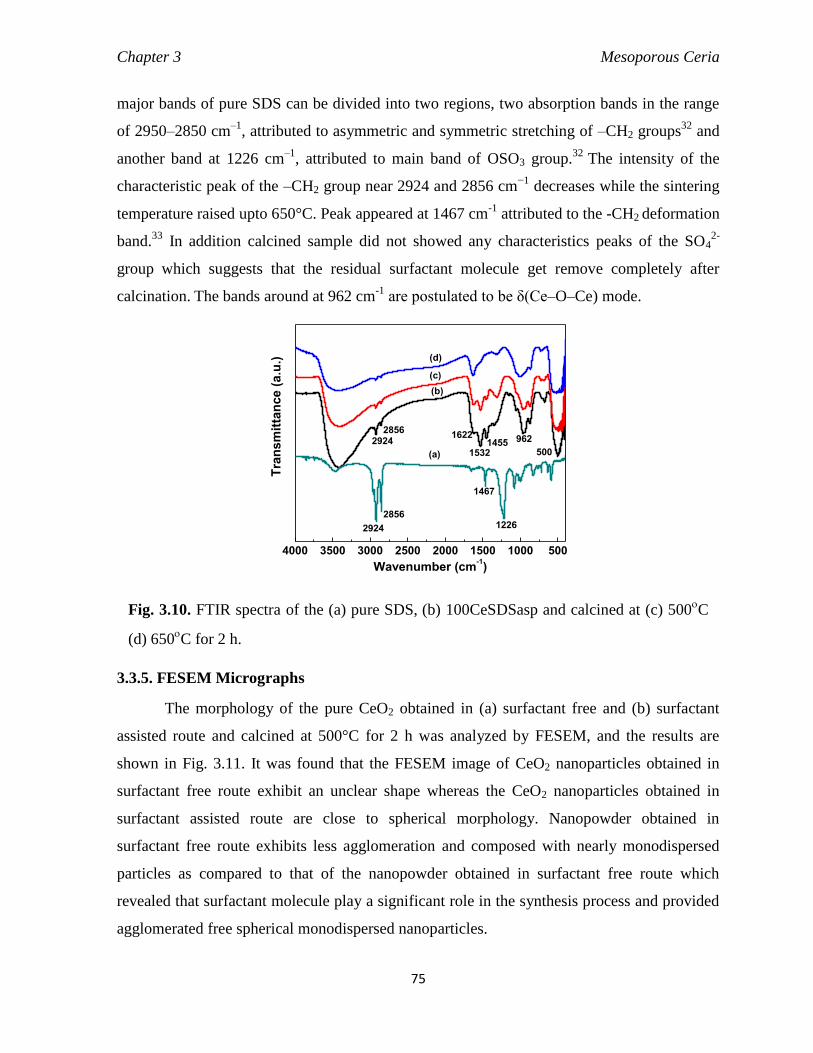
Chapter 3 Mesoporous Ceria
75
major bands of pure SDS can be divided into two regions, two absorption bands in the range
of 2950–2850 cm–1
, attributed to asymmetric and symmetric stretching of –CH2 groups32
and
another band at 1226 cm–1
, attributed to main band of OSO3 group.32 The intensity of the
characteristic peak of the –CH2 group near 2924 and 2856 cm−1
decreases while the sintering
temperature raised upto 650°C. Peak appeared at 1467 cm-1
attributed to the -CH2 deformation
band.33
In addition calcined sample did not showed any characteristics peaks of the SO42-
group which suggests that the residual surfactant molecule get remove completely after
calcination. The bands around at 962 cm-1
are postulated to be δ(Ce–O–Ce) mode.
4000 3500 3000 2500 2000 1500 1000 500
(d)
(c)
(b)
1226
1467
2856
2924
96214551532
16222856
Tra
nsm
itta
nce (
a.u
.)
Wavenumber (cm-1)
2924
(a) 500
Fig. 3.10. FTIR spectra of the (a) pure SDS, (b) 100CeSDSasp and calcined at (c) 500C
(d) 650C for 2 h.
3.3.5. FESEM Micrographs
The morphology of the pure CeO2 obtained in (a) surfactant free and (b) surfactant
assisted route and calcined at 500°C for 2 h was analyzed by FESEM, and the results are
shown in Fig. 3.11. It was found that the FESEM image of CeO2 nanoparticles obtained in
surfactant free route exhibit an unclear shape whereas the CeO2 nanoparticles obtained in
surfactant assisted route are close to spherical morphology. Nanopowder obtained in
surfactant free route exhibits less agglomeration and composed with nearly monodispersed
particles as compared to that of the nanopowder obtained in surfactant free route which
revealed that surfactant molecule play a significant role in the synthesis process and provided
agglomerated free spherical monodispersed nanoparticles.
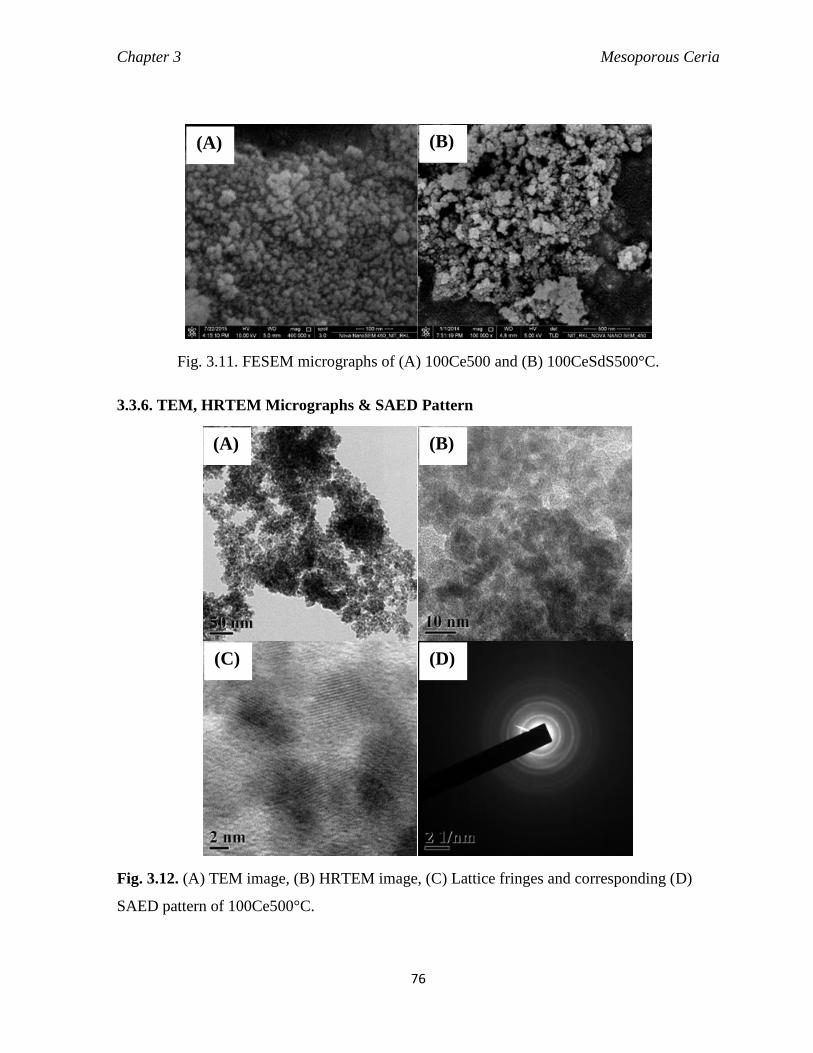
Chapter 3 Mesoporous Ceria
76
Fig. 3.11. FESEM micrographs of (A) 100Ce500 and (B) 100CeSdS500°C.
3.3.6. TEM, HRTEM Micrographs & SAED Pattern
Fig. 3.12. (A) TEM image, (B) HRTEM image, (C) Lattice fringes and corresponding (D)
SAED pattern of 100Ce500°C.
(A) (B)
(A) (B)
(C) (D)
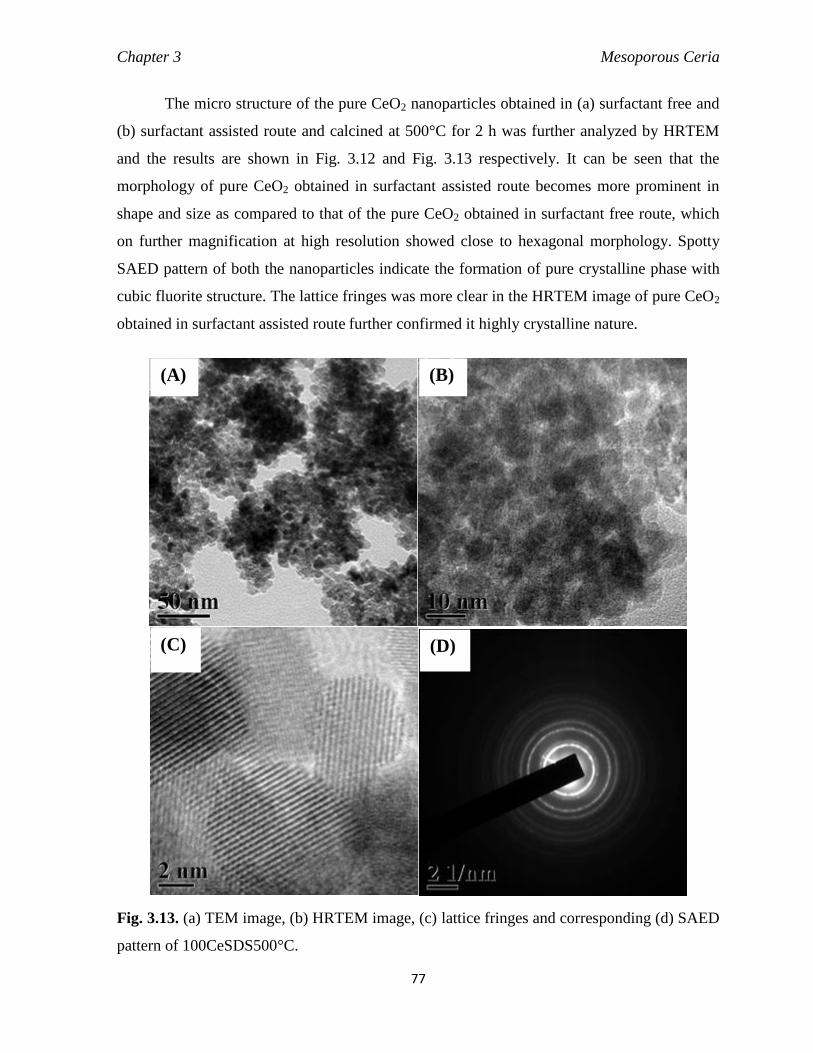
Chapter 3 Mesoporous Ceria
77
The micro structure of the pure CeO2 nanoparticles obtained in (a) surfactant free and
(b) surfactant assisted route and calcined at 500°C for 2 h was further analyzed by HRTEM
and the results are shown in Fig. 3.12 and Fig. 3.13 respectively. It can be seen that the
morphology of pure CeO2 obtained in surfactant assisted route becomes more prominent in
shape and size as compared to that of the pure CeO2 obtained in surfactant free route, which
on further magnification at high resolution showed close to hexagonal morphology. Spotty
SAED pattern of both the nanoparticles indicate the formation of pure crystalline phase with
cubic fluorite structure. The lattice fringes was more clear in the HRTEM image of pure CeO2
obtained in surfactant assisted route further confirmed it highly crystalline nature.
Fig. 3.13. (a) TEM image, (b) HRTEM image, (c) lattice fringes and corresponding (d) SAED
pattern of 100CeSDS500°C.
(A) (B)
(C) (D)
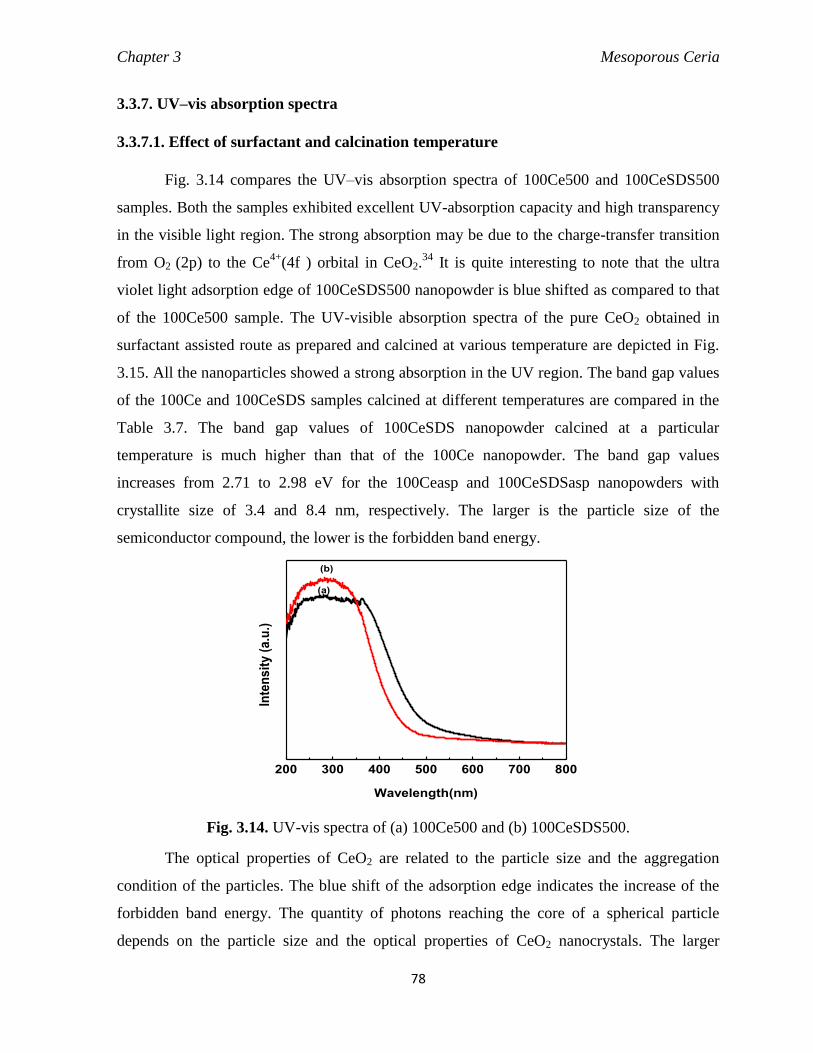
Chapter 3 Mesoporous Ceria
78
3.3.7. UV–vis absorption spectra
3.3.7.1. Effect of surfactant and calcination temperature
Fig. 3.14 compares the UV–vis absorption spectra of 100Ce500 and 100CeSDS500
samples. Both the samples exhibited excellent UV-absorption capacity and high transparency
in the visible light region. The strong absorption may be due to the charge-transfer transition
from O2 (2p) to the Ce4+
(4f ) orbital in CeO2.34
It is quite interesting to note that the ultra
violet light adsorption edge of 100CeSDS500 nanopowder is blue shifted as compared to that
of the 100Ce500 sample. The UV-visible absorption spectra of the pure CeO2 obtained in
surfactant assisted route as prepared and calcined at various temperature are depicted in Fig.
3.15. All the nanoparticles showed a strong absorption in the UV region. The band gap values
of the 100Ce and 100CeSDS samples calcined at different temperatures are compared in the
Table 3.7. The band gap values of 100CeSDS nanopowder calcined at a particular
temperature is much higher than that of the 100Ce nanopowder. The band gap values
increases from 2.71 to 2.98 eV for the 100Ceasp and 100CeSDSasp nanopowders with
crystallite size of 3.4 and 8.4 nm, respectively. The larger is the particle size of the
semiconductor compound, the lower is the forbidden band energy.
200 300 400 500 600 700 800
(a)
Inte
ns
ity
(a
.u.)
Wavelength(nm)
(b)
Fig. 3.14. UV-vis spectra of (a) 100Ce500 and (b) 100CeSDS500.
The optical properties of CeO2 are related to the particle size and the aggregation
condition of the particles. The blue shift of the adsorption edge indicates the increase of the
forbidden band energy. The quantity of photons reaching the core of a spherical particle
depends on the particle size and the optical properties of CeO2 nanocrystals. The larger
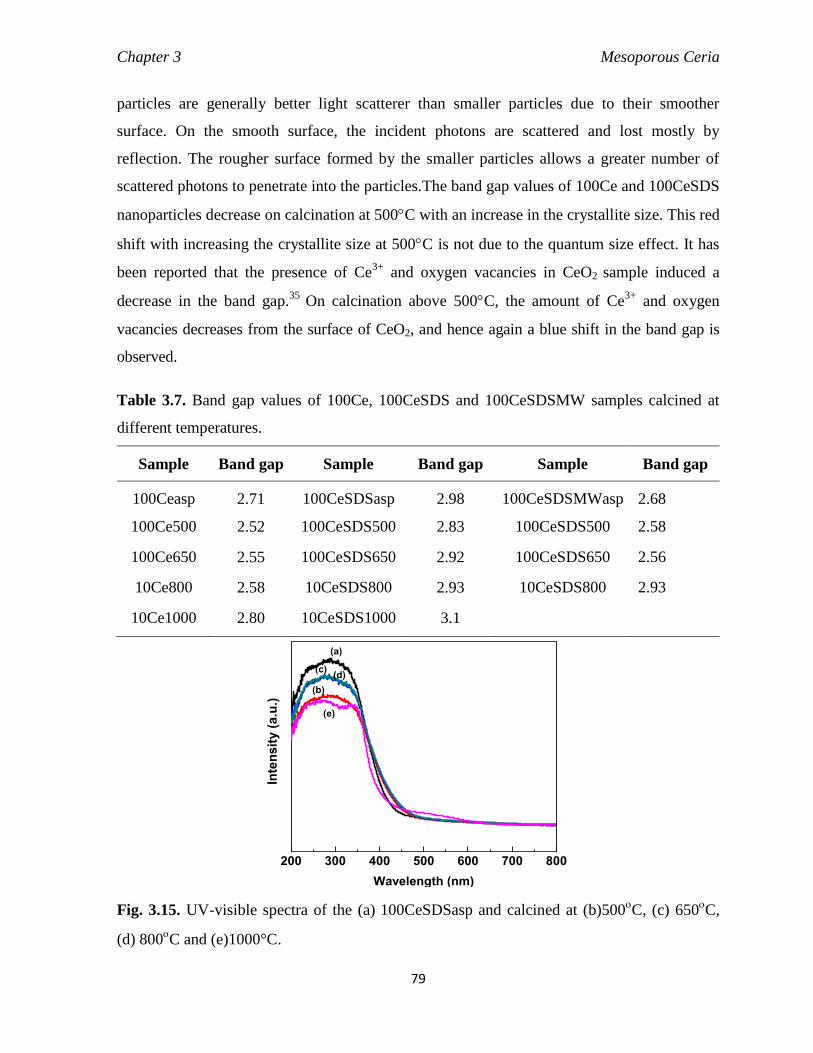
Chapter 3 Mesoporous Ceria
79
particles are generally better light scatterer than smaller particles due to their smoother
surface. On the smooth surface, the incident photons are scattered and lost mostly by
reflection. The rougher surface formed by the smaller particles allows a greater number of
scattered photons to penetrate into the particles.The band gap values of 100Ce and 100CeSDS
nanoparticles decrease on calcination at 500C with an increase in the crystallite size. This red
shift with increasing the crystallite size at 500C is not due to the quantum size effect. It has
been reported that the presence of Ce3+
and oxygen vacancies in CeO2 sample induced a
decrease in the band gap.35
On calcination above 500C, the amount of Ce3+
and oxygen
vacancies decreases from the surface of CeO2, and hence again a blue shift in the band gap is
observed.
Table 3.7. Band gap values of 100Ce, 100CeSDS and 100CeSDSMW samples calcined at
different temperatures.
Sample Band gap Sample Band gap Sample Band gap
100Ceasp 2.71 100CeSDSasp 2.98 100CeSDSMWasp 2.68
100Ce500 2.52 100CeSDS500 2.83 100CeSDS500 2.58
100Ce650 2.55 100CeSDS650 2.92 100CeSDS650 2.56
10Ce800 2.58 10CeSDS800 2.93 10CeSDS800 2.93
10Ce1000 2.80 10CeSDS1000 3.1
200 300 400 500 600 700 800
(e)
(d)(c)
(b)
Inte
nsit
y (
a.u
.)
Wavelength (nm)
(a)
Fig. 3.15. UV-visible spectra of the (a) 100CeSDSasp and calcined at (b)500C, (c) 650
C,
(d) 800C and (e)1000°C.
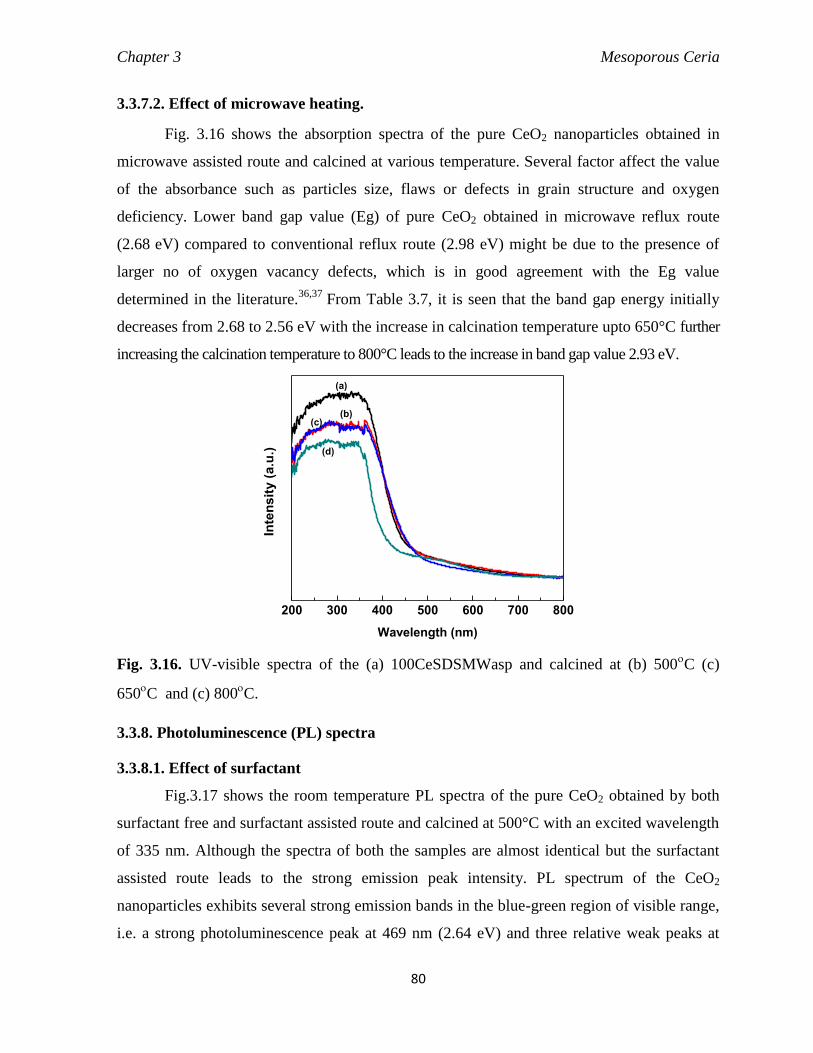
Chapter 3 Mesoporous Ceria
80
3.3.7.2. Effect of microwave heating.
Fig. 3.16 shows the absorption spectra of the pure CeO2 nanoparticles obtained in
microwave assisted route and calcined at various temperature. Several factor affect the value
of the absorbance such as particles size, flaws or defects in grain structure and oxygen
deficiency. Lower band gap value (Eg) of pure CeO2 obtained in microwave reflux route
(2.68 eV) compared to conventional reflux route (2.98 eV) might be due to the presence of
larger no of oxygen vacancy defects, which is in good agreement with the Eg value
determined in the literature.36,37
From Table 3.7, it is seen that the band gap energy initially
decreases from 2.68 to 2.56 eV with the increase in calcination temperature upto 650°C further
increasing the calcination temperature to 800°C leads to the increase in band gap value 2.93 eV.
200 300 400 500 600 700 800
(d)
(c)(b)
Inte
nsit
y (
a.u
.)
Wavelength (nm)
(a)
Fig. 3.16. UV-visible spectra of the (a) 100CeSDSMWasp and calcined at (b) 500C (c)
650C and (c) 800
C.
3.3.8. Photoluminescence (PL) spectra
3.3.8.1. Effect of surfactant
Fig.3.17 shows the room temperature PL spectra of the pure CeO2 obtained by both
surfactant free and surfactant assisted route and calcined at 500°C with an excited wavelength
of 335 nm. Although the spectra of both the samples are almost identical but the surfactant
assisted route leads to the strong emission peak intensity. PL spectrum of the CeO2
nanoparticles exhibits several strong emission bands in the blue-green region of visible range,
i.e. a strong photoluminescence peak at 469 nm (2.64 eV) and three relative weak peaks at

Chapter 3 Mesoporous Ceria
81
452, 483, and 493 nm, respectively. The three emission peaks located at 370, 414, and 468
nm can be found from the rod-like CeO2,38
while two peaks at 415 and 435 nm has been
reported for the flowerlike CeO2.39
A wide PL peak could be observed at 476 nm with a
FWHM of 110 nm from CeO2 thin film.40
The blue-green emissions are attributed to surface
defects in the CeO2 nanoparticles.41
The investigation showed that the emission bands ranging
from 400 to 500 nm for CeO2 sample are attributed to the hopping from different defect levels
of the range from Ce 4f to O 2p band.38
It is suggested that the strong emission of the CeO2
nanoparticles at 469 nm is related to the abundant defects such as dislocations, which is
helpful for fast oxygen transportation. Ce 4f level with a width of 1 eV is localized at the
forbidden gap, which lies at 3 eV over the valence band (O2p). The defects energy levels
between Ce4f and O2p are dependent on the temperature and density of defects in the crystal.
At room temperature, electron transition mainly occurred from defects level to O2p level.42
310 377 444 511 5780
1x10⁵
2x10⁵
3x10⁵
4x10⁵
5x10⁵
6x10⁵
7x10⁵
8x10⁵
9x10⁵
(b)
PL
In
ten
sit
y (
a.u
.)
Wavelength (nm)
(a)
469.5
451.5
493
482.5
Fig. 3.17. PL spectra of (a) 100Ce500 and (b) 100CeSDS500 samples excited at 335 nm.
3.3.8.2. Effect of calcination temperature
The photoluminescence (PL) emission spectra of the pure CeO2 obtained in surfactant
assisted route as prepared and calcined at various temperatures are shown in Fig. 3.18. It was
found that the all the samples exhibits a good strong blue band emission. In addition shapes of
all the spectra are almost identical and mainly consist of multiple emission bands. The PL
emission spectra mainly caused by the transition from 4f band of Ce3+
to the 2p band of O.
The broad emission band could be also the result of defects, including oxygen vacancies in
the crystal with electronic energy levels below the 4f band.43 It can be seen that the sample
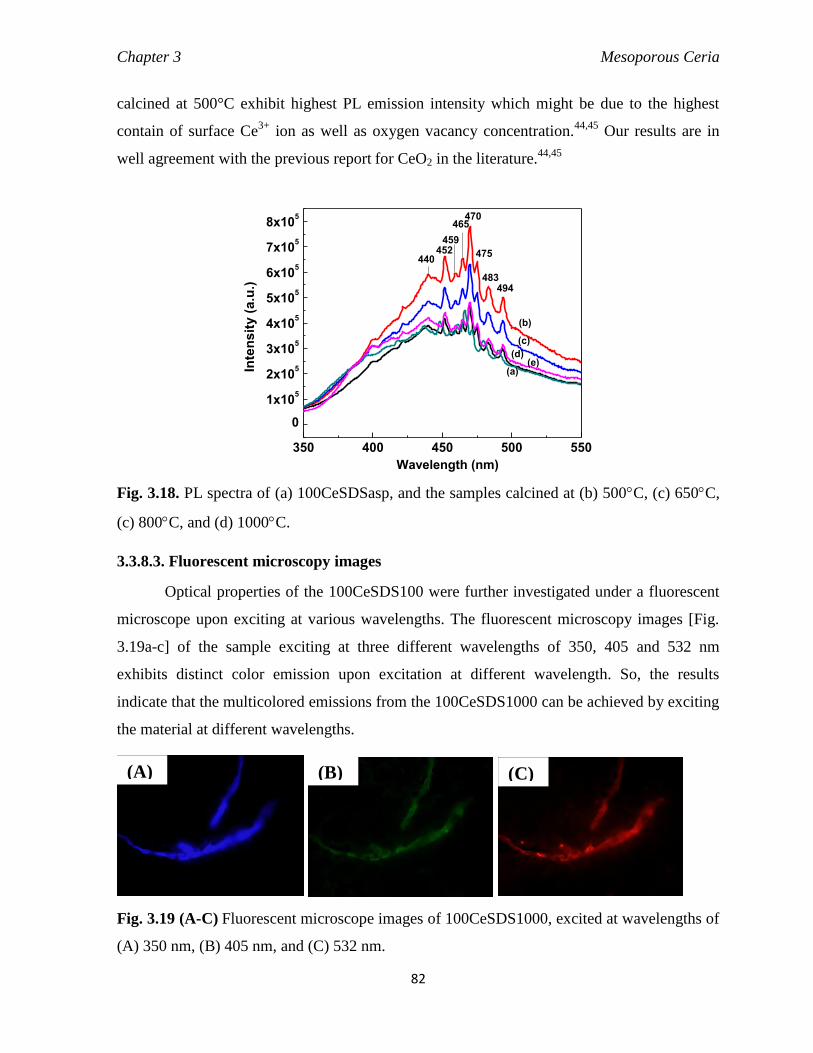
Chapter 3 Mesoporous Ceria
82
calcined at 500°C exhibit highest PL emission intensity which might be due to the highest
contain of surface Ce3+
ion as well as oxygen vacancy concentration.44,45
Our results are in
well agreement with the previous report for CeO2 in the literature.44,45
350 400 450 500 550
0
1x10⁵
2x10⁵
3x10⁵
4x10⁵
5x10⁵
6x10⁵
7x10⁵
8x10⁵
(d)
(c)
(b)
(e)
494483
475
470465
459452
440In
ten
sit
y (
a.u
.)
Wavelength (nm)
(a)
Fig. 3.18. PL spectra of (a) 100CeSDSasp, and the samples calcined at (b) 500C, (c) 650C,
(c) 800C, and (d) 1000C.
3.3.8.3. Fluorescent microscopy images
Optical properties of the 100CeSDS100 were further investigated under a fluorescent
microscope upon exciting at various wavelengths. The fluorescent microscopy images [Fig.
3.19a-c] of the sample exciting at three different wavelengths of 350, 405 and 532 nm
exhibits distinct color emission upon excitation at different wavelength. So, the results
indicate that the multicolored emissions from the 100CeSDS1000 can be achieved by exciting
the material at different wavelengths.
Fig. 3.19 (A-C) Fluorescent microscope images of 100CeSDS1000, excited at wavelengths of
(A) 350 nm, (B) 405 nm, and (C) 532 nm.
(A) (B) (C)

Chapter 3 Mesoporous Ceria
83
3.3.9. XPS spectra
The Ce 3d core level spectra of the pure CeO2 obtained in both the surfactant assisted
route and the surfactant free route are shown in Fig. 3.20(a) and Fig. 3.20(b) The
concentration of Ce3+
in CeO2 sample synthesized by both surfactant free and surfactant
assisted method were determined by XPS curve fitting. In general, it is well accepted that 10
peaks appear for CeO2 in the Ce3d XPS spectrum.46,47
These spectra are fully consistent with
those reported previously.48-50
Among the deconvoluted Ce3d fine XPS spectrum shown in
Fig. 3.20(a) and Fig. 3.20(b) u, u′′, u′′′, v, v′′ and v′′′ peaks were characterized by Ce4+
ions,
and the four peaks of u0, u′, v0, and v′ were characterized by Ce3+
ions.51,52
The percentage of
Ce3+
was calculated with these 10 peaks and using the equation given below,47
which was
found to be about 18.5% and 21.3% for surfactant free synthesized CeO2 and surfactant
mediated synthesized CeO2 sample samples respectively.
Ce3+
= V0+ V′ +U0 +U′ (3.1)
Ce4+
= V + V′′ + V′′′+ U +U′′+U′′′ (3.2)
% Ce3+
= 𝑢0+𝑢
′+𝑣0+𝑣′
𝑢0+𝑢′+𝑢+𝑢′′+𝑢′′′+𝑣0+𝑣
′+𝑣+𝑣′′+𝑣′′′ (3.3)
880 890 900 910 920
u'''
u''
u'
v'''
v''
v'
u
u0
v
Inte
ns
ity
(a
.u.)
Binding energy (eV)
v0
(A)
880 890 900 910 920 930
u'''
u''
u'
u
v'''
u0
v''
v'
v
v0
Inte
nsit
y (
a.u
.)
Binding energy (eV)
(B)
Fig. 3.20. Ce 3d XPS spectra of (a) 100CeSDS500 and (b) 100Ce500.

Chapter 3 Mesoporous Ceria
84
526 528 530 532 534 536
Inte
nsit
y (
a.u
.)
529.5
531.7
(a)
(b)
Binding energy (eV)
529.3
531.4
Fig. 3.21. O 1s core level photoemission spectra from (a) 100CeSDS500C and
(b)100Ce500C.
Fig. 3.21 shows the O 1s spectra of both pure CeO2 obtained with and without
surfactant and calcined at 500°C for 2 h. The low-BE component in the range of 529.3 ± 0.2
eV could be assigned to oxidic species, whereas high-BE components (531.4 ±0.3 eV) is
ascribable to hydroxidic species and/or ambient moisture. This indicates that Ce4+
ions is
mainly located on the surface of cerium oxide nanoparticles which might have some
additional contribution to the blue shift of cerium oxide nanoparticles, this might be due to the
change of charge state from 3+ to 4+ which in turn increases the charge-transfer gap between
O2p and Ce 4f bands according to PL results.
3.3.10. NH3-TPD profiles
NH3-TPD profiles of 100Ce500 and 100CeSDS500 are compared in Fig. 3.22(A),
which provides clear information about the surface acidity properties. The strength of the sites
retaining NH3 below 300°C is characterized as weak acid sites and the retention of NH3 above
300°C has been considered as strong acidic sites. The intense broad peak in the lower
temperature range from 127°C to 327°C were found in both the nanopowders, which revealed
the existence of higher number of moderate acidic sites as compared to strongest acid sites.
The positions of the peaks are compared in Table 3.8. The strongest acid sites releasing NH3
at temperatures as high as 658°C are Lewis-acidic in nature, while moderate acid sites

Chapter 3 Mesoporous Ceria
85
desorbing NH3 at lower temperatures are attributed as Brønsted acidic sites. The
100CeSDS500 shows both higher Lewis acidic and Brønsted acidic sites than the 100Ce500.
The higher acidity on the surface of the 100CeSDS500 is attributed to the presence of residual
sulfate originating from the sodium dodecyl sulphate used during the synthesis procedure,
which remains even after calcination at 500C.
100 200 300 400 500 600 700
(b)
NH
3 c
on
cen
trati
on
(p
pm
)
Temperature (°C)
178
227
(a)
300
270
667
658
(A)
0 100 200 300 400 500 600 700
H2 c
on
su
mp
tio
n (
a.u
.)
Temperature (°C)
488
492
(a)
(b)
(B)
Fig. 3.22. (A) TPD and (B) TPR profiles of (a) 100Ce500, (b) 100CeSDS500.
Table 3.8. TPD data of 100Ce500 and 100CeSDS500.
Sample
No. of
peaks
Temperature
maximum (°C)
Volume
(mL/g STP)
Peak
height
100Ce500
1 178 0.1830 0.0051
2 658 0.2257 0.0040
100CeSDS500 1 227 0.8286 0.0058
2 667 0.2426 0.0020
3.3.11. TPR profiles
Fig. 3.22(B) shows the TPR profiles of 100Ce500 and 100CeSDS500. The reduction
of CeO2 taking place in the temperature range 277-577°C are characteristics of surface
reduction processes. This may be due to the higher number of effective oxygen sites and/or
oxygen vacancy clusters on the surface of CeO2.53-55
The hydrogen consumption is slightly
higher in the lower temperature regions in case of 100Ce500 sample as compared to that of
100CeSDS500 are given in below Table 3.9. The smaller crystallite size of the CeO2
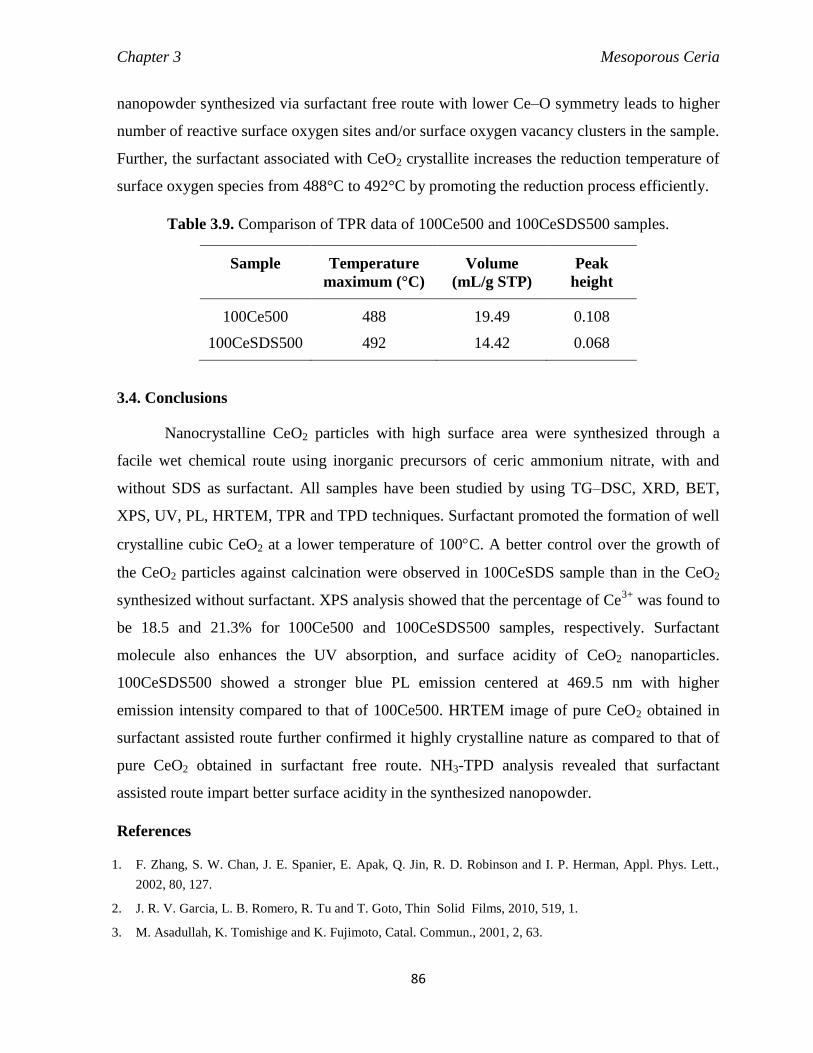
Chapter 3 Mesoporous Ceria
86
nanopowder synthesized via surfactant free route with lower Ce–O symmetry leads to higher
number of reactive surface oxygen sites and/or surface oxygen vacancy clusters in the sample.
Further, the surfactant associated with CeO2 crystallite increases the reduction temperature of
surface oxygen species from 488°C to 492°C by promoting the reduction process efficiently.
Table 3.9. Comparison of TPR data of 100Ce500 and 100CeSDS500 samples.
Sample Temperature
maximum (°C)
Volume
(mL/g STP)
Peak
height
100Ce500 488 19.49 0.108
100CeSDS500 492 14.42 0.068
3.4. Conclusions
Nanocrystalline CeO2 particles with high surface area were synthesized through a
facile wet chemical route using inorganic precursors of ceric ammonium nitrate, with and
without SDS as surfactant. All samples have been studied by using TG–DSC, XRD, BET,
XPS, UV, PL, HRTEM, TPR and TPD techniques. Surfactant promoted the formation of well
crystalline cubic CeO2 at a lower temperature of 100C. A better control over the growth of
the CeO2 particles against calcination were observed in 100CeSDS sample than in the CeO2
synthesized without surfactant. XPS analysis showed that the percentage of Ce3+
was found to
be 18.5 and 21.3% for 100Ce500 and 100CeSDS500 samples, respectively. Surfactant
molecule also enhances the UV absorption, and surface acidity of CeO2 nanoparticles.
100CeSDS500 showed a stronger blue PL emission centered at 469.5 nm with higher
emission intensity compared to that of 100Ce500. HRTEM image of pure CeO2 obtained in
surfactant assisted route further confirmed it highly crystalline nature as compared to that of
pure CeO2 obtained in surfactant free route. NH3-TPD analysis revealed that surfactant
assisted route impart better surface acidity in the synthesized nanopowder.
References
1. F. Zhang, S. W. Chan, J. E. Spanier, E. Apak, Q. Jin, R. D. Robinson and I. P. Herman, Appl. Phys. Lett.,
2002, 80, 127.
2. J. R. V. Garcia, L. B. Romero, R. Tu and T. Goto, Thin Solid Films, 2010, 519, 1.
3. M. Asadullah, K. Tomishige and K. Fujimoto, Catal. Commun., 2001, 2, 63.
Chapter 3 Mesoporous Ceria
87
4. L. Qian, J. Zhu, W. Du and X. Qian, Mater. Chem. Phys., 2009, 115, 835.
5. K. Sohlberg, S. T Pantelides and S. F Pennycook, J. Am. Chem. Soc., 2001, 123, 6609.
6. P. Jasinski, T. Suzuki and H. U. Anderson, Sens. Act. B., 2003, 95, 73.
7. F. Goubin, X. Rocquefelte, M. H. Whangbo, Y. Montardi, R. Brec and S. Jobic, Chem. Mater., 2004, 16,
662.
8. D. G. Shchukin and R. A. Caruso, Chem. Mater., 2004, 16, 2287.
9. A. Trovarelli, C. Leitenburg, M. Boaro and G. Dolcetti, Catal. Today, 1999, 50, 353.
10. Y. Li, Q. Fu and M. F. Stephanopoulos, Appl. Catal. B: Environ., 2000, 27, 179.
11. C. T. Kresge, M. E. Leonowicz, W. J. Roth, J. C. Vartuli and J. S. Beck, Nature, 1992, 359, 710.
12. Q. Huo, D. I. Margolese, U. Ciesla, P. Feng, T. E. Gier, P. Sieger, R. Leon, P. M. Petroff, B. Schueth and G.
D. Stucky, Nature, 1994, 368, 317.
13. P.T. Tanev and T.J. Pinnavaia, Science, 1995, 267, 865.
14. U. Ciesla, S. Schacht, G. D. Stucky, K. K. Unger and F. Schueth, Angew. Chem. Int. Ed. Engl., 1996, 35,
541.
15. D. M. Antonelli and J. Y. Ying, Angew. Chem. Int. Ed. Engl., 1996, 35, 426.
16. Q. Huo, D. I. Margolese, U. Ciesla, D. G. Demuth, P. Feng, T. E. Gier, P. Sieger, A. Firouzi, B. F. Chmelka,
B. Schueth and G. D. Stucky, Chem. Mater., 1994, 6, 1176.
17. S. Lv, C. Wang, T. Zhou, S. Jing, Y. Wu and C. Zhao, J. Alloys. Compds., 2009, 477, 364.
18. R. Elansezhian, B. Ramamoorthy and P. K. Nair, J. Mater. Process. Technol., 2009, 209, 233.
19. D. Terribile, A. Trovarelli, J. Llorca, C. de Leitenburg and G. Dolcetti, J. Catal., 1998, 178, 299.
20. G. Wang, Q. Mu, T. Chen and Y. Wang, J. Alloys Compd., 2010, 493, 202.
21. N. K. Renukaa, A. K. Praveen and C. U. Aniz, Microporous Mesoporous Mater., 2013, 169, 35.
22. S. A. H. Tabrizi, Appl. Surf. Sci., 2011, 257, 10595.
23. M. Brigante and P. C. Schulz, Chem. Eng. J., 2012, 191, 563.
24. D. Zhang, L. Huang, J. Zhang and L. Shi, J. Mater. Sci., 2008, 43, 5647.
25. J. G. Li, T. Ikegami, J. H. Lee and T. Mori, Acta Mater., 2001, 49, 419.
26. M. Leoni, R. D Maggio, S. Polizzi and P Scardi, J. Am. Ceram. Soc., 2004, 87, 1133.
27. P Scardi., International Union of Crystallography Series; Bunge, H.-J., Fiala, J, Snyder, R. L., Eds.; Oxford
University Press: Oxford, U.K., 1999, 570.
28. J. Seo, J. W. Lee, J. Moon, W. Sigmund and U. Paik, ACS Appl. Mater. Interfaces, 2014, 6, 7388.
29. S. Soren, M. Bessoi and P. Parhi, Ceramics International, 2015, 41, 8114.
30. T. S. Sreeremya, K. M. Thulasi, A. Krishnan and S. Ghosh, Ind. Eng. Chem. Res., 2012, 51, 318.
31. C. Binet, A. Badri and J. C. Lavalley, J. Phys. Chem., 1994, 98, 6392.
32. T. Taniguchi, Y. Sonoda, M. Echikawa, Y. Watanabe, K.o Hatakeyama, S. Ida, M. Koinuma, and Y.
Matsumoto, ACS Appl. Mater. Interfaces, 2012, 4, 1010.
33. P. W. Dunne, A. M. Carnerup, A. Węgrzyn, S. Witkowski, and R. I. Walton, J. Phys. Chem. C, 2012, 116,
13435.

Chapter 3 Mesoporous Ceria
88
34. Y. W. Zhang, R. Si, C. S. Liao, C. H. Yan, C. X. Xiao and Y. Kou, J. Phys. Chem. B, 2003, 107, 10159.
35. P. Patsalas, S. Logothetidis, L. Sygellou and S. Kennou, Phys. Rev. B, 2003, 68, 035104.
36. C. Aydin, M. S. Abd El-Sadek, K. Zheng, I. S. Yahia and F. Yakuphanoglu, Opt. Laser Technol., 2013, 48,
447.
37. A. E. Morales, E. S. Mora and U. Pal, Rev. Mex. Fis., 2007, 53, 18.
38. C. W. Sun, H. Li, H. R. Zhang, Z. X. Wang and L. Q. Chen, Nanotechnology, 2005, 16, 1454.
39. C. W. Sun, H. Li and L. Q. Chen, J. Phys. Chem. Solids., 2007, 68, 1785.
40. C. L. Chai, S. Y. Yang, Z. K. Liu, M. Y. Liao and N. F. Chen, Chin. Sci. Bull., 2003, 48, 1198.
41. S. Phoka, P. Laokul, E. Swatsitang, V. Promarak, S. Seraphin and S. Maensiri, Mater. Chem. Phys., 2009,
115, 423.
42. C. G. Kim, Appl. Phys. Lett., 2001, 79, 3047.
43. A. H. Morshed, M. E. Moussa, S. M. Bedair, R. Leonard, S. X. Liu and N. E. Masry, Appl. Phys. Lett., 1997,
70, 1647.
44. S. Phokha, S. Pinitsoontorn1, P. Chirawatkul, Y. Pooarporn and S. Maensiri, Nanoscale Research Lett., 2012,
7, 425.
45. K. K. Babitha, A. Sreedevi, K. P. Priyanka, B. Sabu and T. Varghese, Indian J. of Pure & Appl. Phys., 2015,
53, 596.
46. E. J. Preisler, O. J. Marsh, R. A. Beach, T. C. McGill and J. Vac. Sci. Tech. B, 2001, 19, 1611.
47. J. Zhang, X. Ju, Z. Y. Wu, T. Liu, T. D. Hu, Y. N. Xie and Z. L. Zhang, Chem. Mater., 2001, 13, 4192.
48. S. Tsunekawa, T. Fukuda and A. Kasuya, Surf. Sci., 2000, 457, 437.
49. D. R. Mullins, S. H. Overbury and D. R. Huntley, Surf. Sci., 1998, 409, 307.
50. R. Vercaemst, D. Poelman, R. L. Van Meirhaeghe, L. Fiermans, W. H. Laflke and F Cardon, J. Lumin.,
1995, 63, 19.
51. S. Watanabe, X. L. Ma and C. S. Song, J. Phys. Chem. C, 2009, 113, 14249.
52. A. Kumar, S. Babu, A.S. Karakoti, A. Schulte and S. Seal, Langmuir, 2009, 25, 10998.
53. H. C. Yao and Y. F. Y. Yao, J. Catal., 1984, 86, 254.
54. M. F. L. Johnson and J. Mooi, J. Catal., 1987, 103.
55. L. A. Bruce, M. Hoang, A. E. Hughes and T. W. Turney, Appl. Catal. A: Gen., 1996, 134, 351.

Chapter 4 Samarium Doped Mesoporous Ceria
89
Chapter 4
High Surface Area Sm3+
Doped Mesoporous
CeO2 Nanocrystals
Outline
This chapter deals with the intensive characterization of nanosized Sm3+
(0.5, 1, 2, 5, 10 and
20 mol%)-doped CeO2 (Ce-Sm) synthesized through a surfactant assisted wet chemical route using
inorganic precursors of samarium oxide and ceric ammonium nitrate, and sodium dodecyl sulphate as
surfactant. The synthesized nanopowders were investigated by various structural, optical and
spectroscopic techniques such as TG-DSC, XRD, BET surface area, FESEM, HRTEM, UV-vis diffuse
reflectance, PL, H2-TPR, TPD and XPS techniques. For the purpose of comparison, the representative
sample 1 mol% Sm3+
doped CeO2 were also synthesized by using cationic and non-ionic surfactants of
DDA and PEG, respectively. In addition, the influence of microwave refluxing during synthesis on the
structural and optical properties of the representative sample 1 mol% Sm3+
doped CeO2 nanopowders
were also evaluated. The XRD results indicate that the calcined Ce-Sm and even as-prepared material
have cubic fluorite structure of CeO2 with no crystalline impurity phase. XRD studies along with
HRTEM results confirmed the formation of mesoporous nanocrystalline CeO2 at a lower temperature
as low as 100C and the crystallite size increases with increasing the calcination temperature. A
detailed analysis revealed that Sm3+
doping in to CeO2 has increased the lattice volume, surface area,
mesopore volume and engineered the surface defects. Further Sm3+
doping was found to cause
unusual emissions with a dominant 4G5/2 →
6H5/2 transition cantered at 573 nm. Additionally, the
luminescence intensities enhanced with increasing Sm3+
concentration from 0.5 mol% to 1 mol% with
further increasing Sm3+
concentration leads to the decrease in luminescence intensities.
Chapter 4 Samarium Doped Mesoporous Ceria
90
4.1. Introduction
Ceria (CeO2) nanoparticles especially doped with rare earths have attracted growing
interest and opened many new possibilities for technological applications, such as adsorption,
transportation/storage of fluids and gases, solar cell, solid oxide fuel cell, auto-motive exhaust
promoter, catalysis, chemical sensor and phosphors.1-7
Samaria (Sm2O3) doped CeO2
nanoparticles is known for their unique properties such as high thermal and chemical stability,
high ionic-electrical conductivity, high refractive index, large oxygen storage capacity, UV-
shielding, and the quick and expedient mutation of the oxidation state of cerium between
Ce(III) and Ce(IV).3,5,8-10
Additionally, CeO2 is one of the best host materials for Sm3+
ions,
and can serve as the high performance phosphor material to develop a wide range of
nanotechnological optical devices, in comparison with other inorganic metal oxide
nanomaterials.10-12
Many of the studies have been focused on the preparation of
nanostructured Sm3+
doped CeO2.5,8,13-15
But there are only a very limited numbers of
publications available regarding the synthesis of mesoporous CeO2 based materials especially
Sm2O3 doped CeO2.16,17
Hao et al. synthesized Fe3+
doped mesoporous CeO2 using triblock
copolymer P123 as the template and Ce(NO3)3·6H2O and Fe(NO3)3·9H2O as raw materials by
means of a hydrothermal procedure.18
To the best of our knowledge, there is no publication
available regarding the synthesis of mesoporous Sm2O3 doped CeO2 materials via surfactant
templating route. Mesoporous Ce0.8Sm0.2O1.9 oxide with surface area in the range of 29 to 85
m2/g was prepared by a glycine-nitrate combustion process
16 or EDTA-citrate combined
complexing sol–gel process17
based on an in situ created nickel oxide as template after
calcining at a higher temperature of 700°C. In common, hard-template methods suffer from
the drawbacks such as tedious and complicated preparation and removal of the template after
the synthesis and impurities further restrict the applications of the product. It is still a
challenge to synthesize thermally stable mesoporous doped CeO2 with a high surface area as
doping typically facilitates the sintering of CeO2 due to increased mobility of oxygen ion in
the lattice.19
Therefore, it is highly desirable to produce mesoporous powder of Sm3+
doped
CeO2 materials, which exhibits high surface area, and crystalline framework, using an
efficient, simple and economic method to meet the growing demand of various applications.
Recently, few studies have been reported concerning the photoluminescence (PL)
properties of CeO2 doped with Sm3+
ion, mostly above as large as 5 mol%.12-15
Luminescent

Chapter 4 Samarium Doped Mesoporous Ceria
91
properties of nanocube and nanorod morphologies of Sm3+
doped CeO2 synthesized by
hydrothermal treatments was reported.10
A decrease in PL intensity was observed with
increase in Sm3+
concentration (5 to 20 mol%) in Sm3+
doped CeO2, synthesized by modified
sol-gel route and then calcined at 1000°C for 4 h.15
The present study report a simple
surfactant route using cheaper aqueous solutions of inorganic precursors and surfactant for the
synthesis of mesoporous and high surface area Sm3+
doped CeO2 powders, with crystalline
cubic phase even at lower temperature of 100°C. This approach has a high yield and can
produce ultrafine CeO2 powder in multigram-scale from the same batch. Only very few
reports are available on PL properties of Sm3+
doped cubic CeO2 in mesoporous morphology
and its as-prepared hybrid material with sodium dodecyl sulphate (SDS). In the present study,
we report a simple surfactant assisted route using cheaper aqueous solutions of inorganic
precursors and a surfactant for the synthesis of mesoporous and high surface area Sm3+
(0.5 to
20 mol%) doped CeO2 powders, with crystalline cubic phase even at lower temperatures of
100°C, and their enhanced PL properties.
4.2. Synthesis and characterization of Sm3+
doped CeO2 nanocrystals
The methodology for the synthesis of mesostructured as-synthesized precursor and
Sm3+
doped CeO2 using surfactant is given in chapter-2. All the mesoporous 0.5 to 20 mol%
Sm3+
doped CeO2 nanocrystals synthesized using different surfactants were yellowish white
and non-agglomerated. The prepared samples were analyzed using different characterization
techniques (details of the techniques are discussed in chapter 2) such as TG-DSC, XRD,
FTIR, N2 sorption analysis, FESEM, HRTEM, UV-vis, PL, XPS, H2-TPR and NH3-TPD.
4.3. Results and discussion
4.3.1. TG-DSC analysis of Sm3+
doped CeO2
4.3.1.1. Effect of dopant concentration
The thermal behavior of the as-synthesized nanopowders was studied by using TG–
DSC technique in air atmosphere from 25 to 1000C with a temperature ramp of 10C min−1
.
The TG-DSC curves of the as-synthesized Sm3+
doped CeO2 samples, prepared using SDS
through conventional reflux method, at different molar ratios of Sm3+
(0.5 to 20 mol%) are
shown in Figs. 4.1 and 4.2. Four steps of weight losses in the regions of AB, BC, CD and DE
were observed in all samples over 25 to 1000°C. The % of mass loss obtained from TG
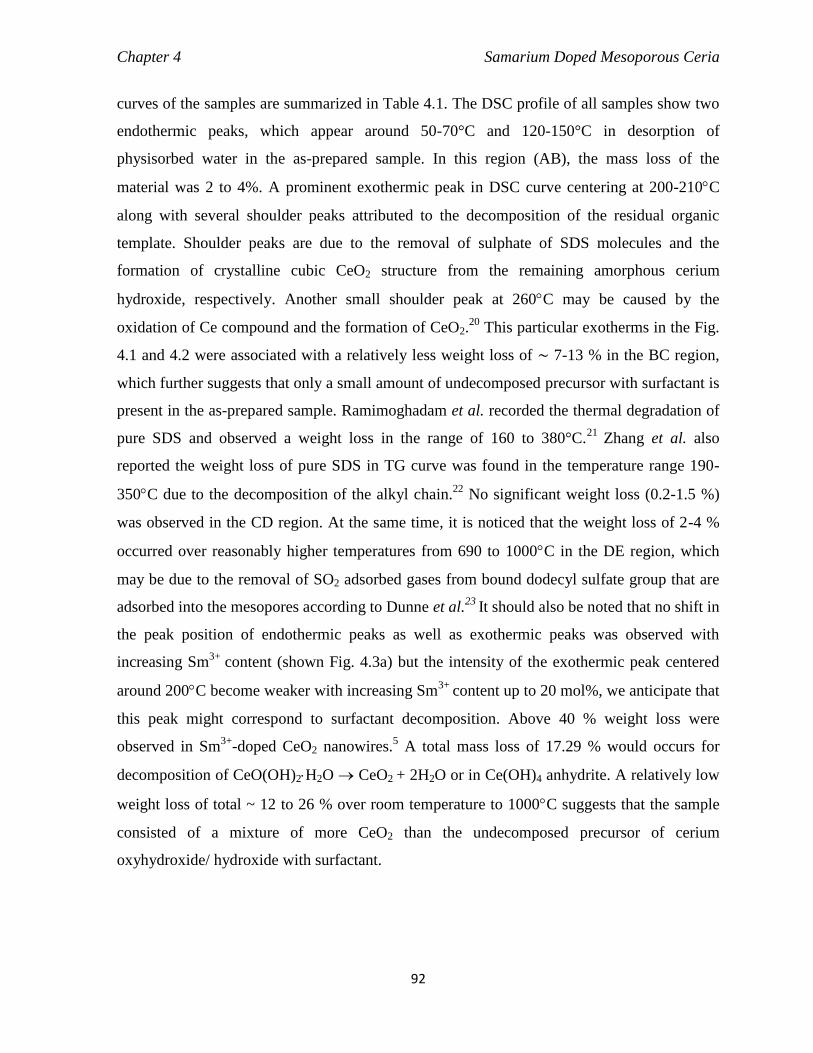
Chapter 4 Samarium Doped Mesoporous Ceria
92
curves of the samples are summarized in Table 4.1. The DSC profile of all samples show two
endothermic peaks, which appear around 50-70°C and 120-150°C in desorption of
physisorbed water in the as-prepared sample. In this region (AB), the mass loss of the
material was 2 to 4%. A prominent exothermic peak in DSC curve centering at 200-210C
along with several shoulder peaks attributed to the decomposition of the residual organic
template. Shoulder peaks are due to the removal of sulphate of SDS molecules and the
formation of crystalline cubic CeO2 structure from the remaining amorphous cerium
hydroxide, respectively. Another small shoulder peak at 260C may be caused by the
oxidation of Ce compound and the formation of CeO2.20
This particular exotherms in the Fig.
4.1 and 4.2 were associated with a relatively less weight loss of ∼ 7-13 % in the BC region,
which further suggests that only a small amount of undecomposed precursor with surfactant is
present in the as-prepared sample. Ramimoghadam et al. recorded the thermal degradation of
pure SDS and observed a weight loss in the range of 160 to 380°C.21
Zhang et al. also
reported the weight loss of pure SDS in TG curve was found in the temperature range 190-
350C due to the decomposition of the alkyl chain.22
No significant weight loss (0.2-1.5 %)
was observed in the CD region. At the same time, it is noticed that the weight loss of 2-4 %
occurred over reasonably higher temperatures from 690 to 1000C in the DE region, which
may be due to the removal of SO2 adsorbed gases from bound dodecyl sulfate group that are
adsorbed into the mesopores according to Dunne et al.23
It should also be noted that no shift in
the peak position of endothermic peaks as well as exothermic peaks was observed with
increasing Sm3+
content (shown Fig. 4.3a) but the intensity of the exothermic peak centered
around 200C become weaker with increasing Sm3+
content up to 20 mol%, we anticipate that
this peak might correspond to surfactant decomposition. Above 40 % weight loss were
observed in Sm3+
-doped CeO2 nanowires.5 A total mass loss of 17.29 % would occurs for
decomposition of CeO(OH)2H2O CeO2 + 2H2O or in Ce(OH)4 anhydrite. A relatively low
weight loss of total ~ 12 to 26 % over room temperature to 1000C suggests that the sample
consisted of a mixture of more CeO2 than the undecomposed precursor of cerium
oxyhydroxide/ hydroxide with surfactant.

Chapter 4 Samarium Doped Mesoporous Ceria
93
25 220 415 610 805 1000
0
1
2
3
4
En
do
Heat
Flo
w (
mW
/mg
) E
xo
Temperature (°C)
Wie
gh
t lo
ss (
%)
75
80
85
90
95
100
(a)
690
425
133
E
DC
B
A
289
247
204
130
50
(A)
(b)
-0.6
-0.1
0.4
0.9
1.4
1.9
2.4
25 220 415 610 805 1000
86
88
90
92
94
96
98
100
720
430
144
E
Wie
gh
t lo
ss
(%
)
En
do
He
at
Flo
w (
mW
/mg
) E
xo
65125
315
170
A
B
C
D
205
(a)
(b)
Temperature (°C)
(B)
30 223 416 609 802 995
0
1
2
(a)
(b)
E
D
C
B
Temperature (C)
En
do
He
at
Flo
w (
mW
/mg
) E
xo
58
128
208
A (C)
75
80
85
90
95
100
We
igh
t lo
ss
(%
)
25 220 415 610 805 1000
0.0
0.5
1.0
1.5
2.0
(a)
(b)
En
do
Heat
Flo
w (
mW
/mg
) E
xo
Temperature (°C)
Weig
ht
loss (
%)
(D)
84
88
92
96
100
700420
E
D
C
B
A
284
211
150
12853
Fig. 4.1. (a) TG and (b) DSCcurves of (A) 0.5, (B) 1, (C) 2, and (D) 5 mol% Sm3+
doped as-
synthesized CeO2 samples.
25 220 415 610 805 1000-0.2
0.0
0.2
0.4
0.6
0.8
1.0
1.2
1.4
(a)
(b)
En
do
Heat
Flo
w (
mW
/mg
) E
xo
Temperature (°C)
(A)
88
90
92
94
96
98
100
420
E
DC
B
A
135
Wie
gh
t lo
ss (
%)
59
208
25 220 415 610 805 1000
0
1
2
3
4
5
(a)
(b)420
E
D
C
B
A
15070
En
do
Heat
Flo
w (
mW
/mg
) E
xo
Temperature (°C)
200
257
(B)
82
84
86
88
90
92
94
96
98
100
Wie
gh
t lo
ss (
%)
800
Fig. 4.2. (a) TG and (b) DSC curves of (A) 10 and (B) 20 mol% Sm3+
doped as-synthesized
CeO2 samples.
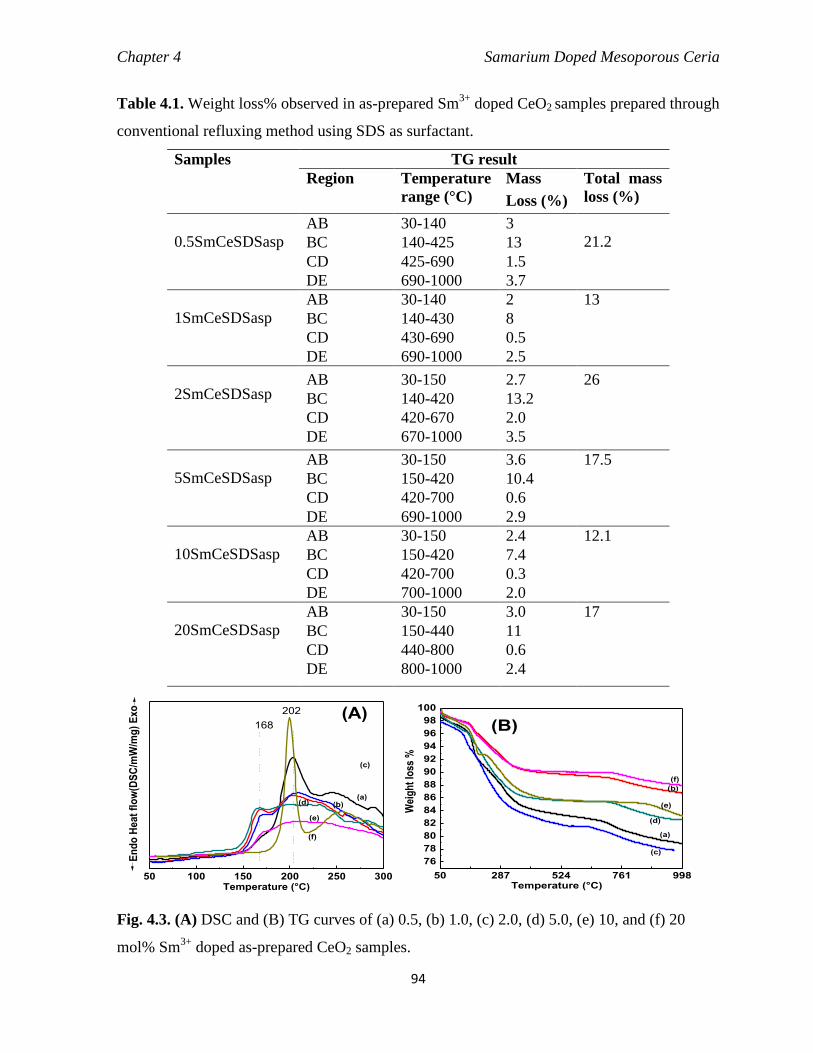
Chapter 4 Samarium Doped Mesoporous Ceria
94
Table 4.1. Weight loss% observed in as-prepared Sm3+
doped CeO2 samples prepared through
conventional refluxing method using SDS as surfactant.
Samples TG result
Region Temperature
range (°C)
Mass
Loss (%)
Total mass
loss (%)
0.5SmCeSDSasp
AB 30-140 3
21.2 BC 140-425 13
CD 425-690 1.5
DE 690-1000 3.7
1SmCeSDSasp
AB 30-140 2 13
BC 140-430 8
CD 430-690 0.5
DE 690-1000 2.5
2SmCeSDSasp AB 30-150 2.7 26
BC 140-420 13.2
CD 420-670 2.0
DE 670-1000 3.5
5SmCeSDSasp
AB 30-150 3.6 17.5
BC 150-420 10.4
CD 420-700 0.6
DE 690-1000 2.9
10SmCeSDSasp
AB 30-150 2.4 12.1
BC 150-420 7.4
CD 420-700 0.3
DE 700-1000 2.0
20SmCeSDSasp
AB 30-150 3.0 17
BC 150-440 11
CD 440-800 0.6
DE 800-1000 2.4
50 100 150 200 250 300
(f)
(e)
(d)
(c)
(b)
En
do
Heat
flo
w(D
SC
/mW
/mg
) E
xo
Temperature (°C)
168
202
(a)
(A)
50 287 524 761 998
76
78
80
82
84
86
88
90
92
94
96
98
100
(f)
(e)
(d)
(c)
(b)
Wei
gh
t lo
ss %
Temperature (°C)
(a)
(B)
Fig. 4.3. (A) DSC and (B) TG curves of (a) 0.5, (b) 1.0, (c) 2.0, (d) 5.0, (e) 10, and (f) 20
mol% Sm3+
doped as-prepared CeO2 samples.

Chapter 4 Samarium Doped Mesoporous Ceria
95
4.3.1.2. Influence of conventional and microwave refluxing
Fig. 4.4 show the DSC and TGA curves of the as-synthesized 1 mol% Sm3+
doped
CeO2 prepared by using SDS as surfactant and followed by (a) without refluxing, (b) normal
refluxing, and (c) with microwave refluxing method. A remarkably higher mass loss (28%)
was observed (see Table 4.2) in the sample synthesized without refluxing as compared to that
of the samples prepared via conventional (13%) and microwave refluxing (11%) method,
suggesting that the as-prepared powder obtained through without refluxing method contain
more amount of oxohydroxide precursors. Refluxing method play a significant role for the
transformation of the amorphous portion Ce(OH)4 to crystalline CeO2. DSC curve shows that
both the prominent exothermic peak and shoulder peaks notably shifted towards lower
temperatures in case of the sample obtained by refluxing method than that of the sample
obtained without refluxing method. The result suggests that the refluxing method enhances
the crystallization process. However, no change in the position of the exothermic peak of
1SmceSDSasp was observed when compared to that of 1SmCeSDSMWasp. But the shoulder
peak become sharper and intensity become stronger in case of the latter sample. TG curve
shows that above 700C, apparent mass loss was ~ 4% in case of sample synthesized via
without refluxing method as compared to the conventional (2.5%) and microwave refluxing
(1.5%) method, may be attributed to it higher contain of SO2, which gradually decomposed at
higher temperature.
Table 4.2. Weight loss % of Sm3+
doped as-prepared CeO2 samples prepared through without
refluxing and microwave refluxing method.
Samples TG result
Region Temperature
range (°C)
Mass
loss (%)
Total mass
loss (%)
1SmCeSDSNRasp AB 30-150 4 28.7
BC 150-400 18.5
CD 400-700 1.6
DE 700-1000 4.6
1SmCeSDSMWasp AB 30-147 5.4 10.8
BC 147-400 5
CD 400-800 0.2
DE 800-1000 0.2

Chapter 4 Samarium Doped Mesoporous Ceria
96
25 75 125 175 225 275 325 375
(c)
(b)
267205
En
do
Heat
flo
w(D
SC
/mV
/mg
) E
xo
Temperature (°C)
166 190(A)
(a)
200 400 600 800 1000
70
75
80
85
90
95
100
(c)
(b)
Weig
ht
loss (
%)
Temperature (°C)
(B)
(a)
Fig. 4.4. (A) DSC and (B) TG curves of 1SmCeSDSasp prepared via (a) without refluxing,
(b) normal refluxing, and (c) microwave refluxing method.
4.3.1.3. Influence of anionic, cationic and nonionic surfactant
The comparative results of the thermal decomposition of as-synthesized precursors
obtained upon varying the type of surfactant provided some informations on the interaction
between the surfactant molecules and inorganic precursors. Fig. 4.5 show the TG and DSC
curves of the as-synthesized 1 mol% Sm3+
doped CeO2 prepared by conventional refluxing
method using DDA and PEG, respectively. In the TG curve, very low weight loss of 4% was
observed for the nanopowder synthesized using nonionic surfactant PEG, while 8.4% and 13
% were observed for the samples synthesized using DDA and SDS, respectively. The result
indicates that the nonionic surfactant molecule has weaker interaction with the inorganic
precursor molecule; hence a substantial amount of it can be removed just by simple washing.
As can also be seen from the DSC curve (Fig. 4.5A), the temperature required for the
degradation of PEG surfactant molecule was also centered at a comparatively lower
temperature of 186C. The anionic surfactant molecule SDS exhibit stronger interaction with
the inorganic precursors and show greater mass loss of 13% as compared to that with the
cationic surfactant molecule DDA, and showing a mass loss of 8.4% (Table 4.3). The peak
corresponding to the surfactant degradation was also shifted to a higher temperature of 205C
for the sample synthesized using SDS. A remarkable weight loss above 700C due to the
removal of SO2 group was observed only in the sample prepared using SDS.
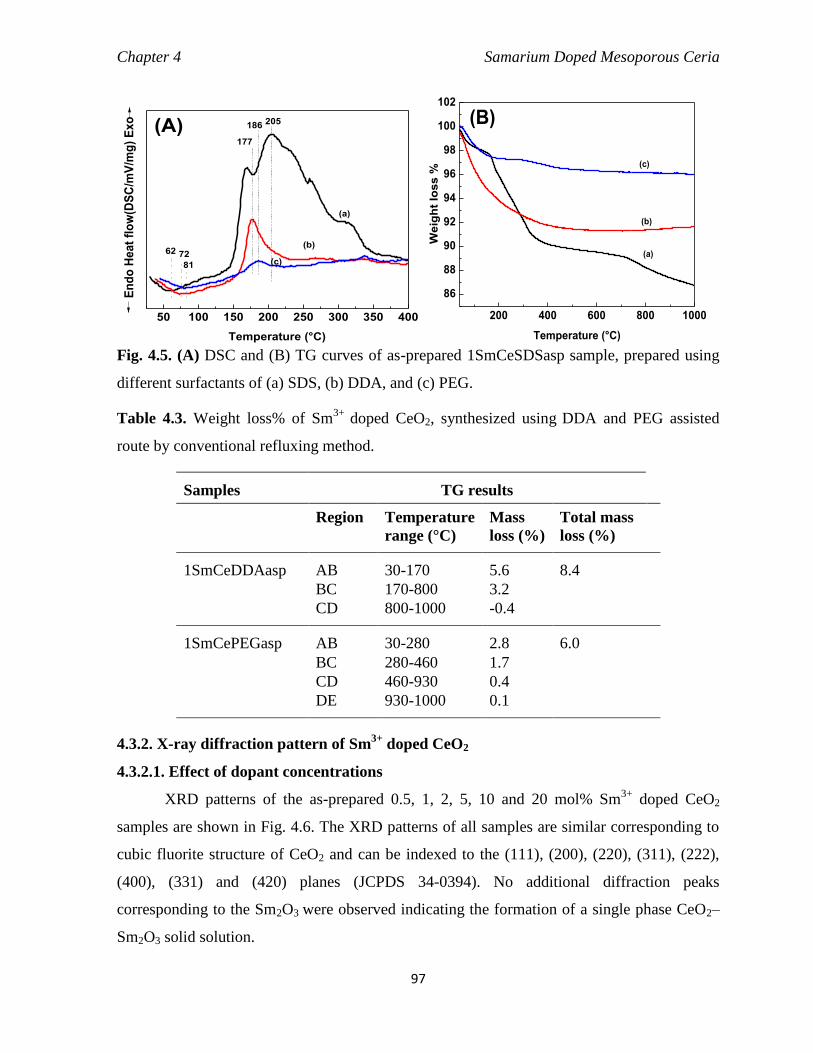
Chapter 4 Samarium Doped Mesoporous Ceria
97
50 100 150 200 250 300 350 400
(c)
(b)
205186
177
72
81
En
do
Heat
flo
w(D
SC
/mV
/mg
) E
xo
Temperature (°C)
62
(a)
(A)
200 400 600 800 1000
86
88
90
92
94
96
98
100
102
(c)
(b)
Weig
ht
loss %
Temperature (°C)
(a)
(B)
Fig. 4.5. (A) DSC and (B) TG curves of as-prepared 1SmCeSDSasp sample, prepared using
different surfactants of (a) SDS, (b) DDA, and (c) PEG.
Table 4.3. Weight loss% of Sm3+
doped CeO2, synthesized using DDA and PEG assisted
route by conventional refluxing method.
Samples TG results
Region Temperature
range (°C)
Mass
loss (%)
Total mass
loss (%)
1SmCeDDAasp AB 30-170 5.6 8.4
BC 170-800 3.2
CD 800-1000 -0.4
1SmCePEGasp AB 30-280 2.8 6.0
BC 280-460 1.7
CD 460-930 0.4
DE 930-1000 0.1
4.3.2. X-ray diffraction pattern of Sm3+
doped CeO2
4.3.2.1. Effect of dopant concentrations
XRD patterns of the as-prepared 0.5, 1, 2, 5, 10 and 20 mol% Sm3+
doped CeO2
samples are shown in Fig. 4.6. The XRD patterns of all samples are similar corresponding to
cubic fluorite structure of CeO2 and can be indexed to the (111), (200), (220), (311), (222),
(400), (331) and (420) planes (JCPDS 34-0394). No additional diffraction peaks
corresponding to the Sm2O3 were observed indicating the formation of a single phase CeO2–
Sm2O3 solid solution.
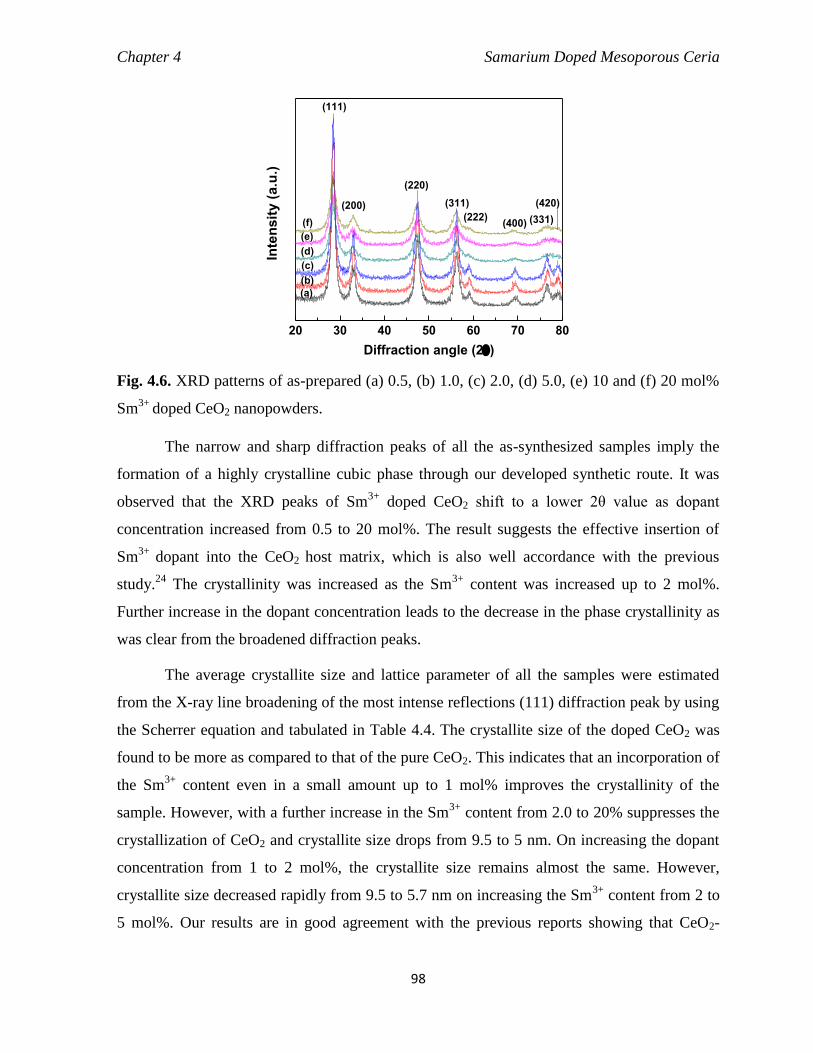
Chapter 4 Samarium Doped Mesoporous Ceria
98
20 30 40 50 60 70 80
(f)
(e)
(d)
(c)
(b)
(a)
(420)
(331)(400)(222)
(311)
(220)
(200)
(111)
Inte
nsit
y (
a.u
.)
Diffraction angle (2)
Fig. 4.6. XRD patterns of as-prepared (a) 0.5, (b) 1.0, (c) 2.0, (d) 5.0, (e) 10 and (f) 20 mol%
Sm3+
doped CeO2 nanopowders.
The narrow and sharp diffraction peaks of all the as-synthesized samples imply the
formation of a highly crystalline cubic phase through our developed synthetic route. It was
observed that the XRD peaks of Sm3+
doped CeO2 shift to a lower 2θ value as dopant
concentration increased from 0.5 to 20 mol%. The result suggests the effective insertion of
Sm3+
dopant into the CeO2 host matrix, which is also well accordance with the previous
study.24
The crystallinity was increased as the Sm3+
content was increased up to 2 mol%.
Further increase in the dopant concentration leads to the decrease in the phase crystallinity as
was clear from the broadened diffraction peaks.
The average crystallite size and lattice parameter of all the samples were estimated
from the X-ray line broadening of the most intense reflections (111) diffraction peak by using
the Scherrer equation and tabulated in Table 4.4. The crystallite size of the doped CeO2 was
found to be more as compared to that of the pure CeO2. This indicates that an incorporation of
the Sm3+
content even in a small amount up to 1 mol% improves the crystallinity of the
sample. However, with a further increase in the Sm3+
content from 2.0 to 20% suppresses the
crystallization of CeO2 and crystallite size drops from 9.5 to 5 nm. On increasing the dopant
concentration from 1 to 2 mol%, the crystallite size remains almost the same. However,
crystallite size decreased rapidly from 9.5 to 5.7 nm on increasing the Sm3+
content from 2 to
5 mol%. Our results are in good agreement with the previous reports showing that CeO2-

Chapter 4 Samarium Doped Mesoporous Ceria
99
based phase crystallinity is highly depending on the Sm3+
doping amount. Zivkovic et al.
reported the similar observation that crystallization of electrodeposited Sm3+
-doped CeO2 thin
film reduced beyond Sm3+
content greater than 1 mol%.25
Table 4.4. Crystallite size and lattice parameters of Sm3+
doped CeO2 nanopowders.
Sample Crystallite size
(nm)
Lattice
parameter (nm)
0.5SmCeSDSasp 8.1 0.5423
1SmCeSDS5asp 9.6 0.5418
2SmCeSDSasp 9.5 0.5426
5SmCeSDSasp 5.8 0.5421
10SmCeSDSasp 4.9 0.5426
20SmCeSDSasp 6.1 0.5428
4.3.2.2. Effect of calcination temperatures
Fig. 4.7 displays the XRD patterns of (a) as-prepared precursor powders of Sm3+
-
doped CeO2 and the powders calcined at (b) 500°C, (c) 650°C, and (d) 800°C for 2 h. The
well crystalline nature of the as-synthesized powders is evident from the X-ray reflections
exhibited by the sample. The sample does not contain any appreciable amount of
undecomposed precursor unlike previous reports nor need any further heat treatment at higher
temperatures (typically above 400C) for the synthesis of CeO2 nanoparticles from as-
synthesized precursor.26-28
Thereby, confirming the ability of the present aqueous based
synthetic approach to prepare mesoporous (as was evident from HRTEM) crystalline CeO2
nanoparticles at a lower temperature of 100C. XRD patterns in Fig. 4.7 reveal that the
formation of single crystalline cubic-fluorite structure of CeO2 with the space group Fm3m
(JCPDS powder diffraction File No. 34-0394). All the peaks of the XRD pattern in 20-80°
range of 2-value are indexed to (111), (200), (220), (311), (222), (400), (331) and (420)
reflections. Mixed phases of fluorite-type CeO2 and NiO were observed in mesoporous
Ce0.8Sm0.2O1.9 oxides with surface area in the range of 29 to 85 m2/g, prepared using nickel
oxide as hard template after calcining at 700°C.17
The corresponding peaks in Sm3+
-doped
CeO2 samples become sharper and their intensity increases with increase in calcination
temperatures due to the progressive growth of crystallites. The average crystallite sizes of as-
prepared Sm3+
-doped CeO2 sample and the samples heated at 500°C, 650°C, and 800°C were

Chapter 4 Samarium Doped Mesoporous Ceria
100
calculated using Scherrer’s equation as 9.5, 9.7, 13.5 and 19.4 nm, respectively. An activated
growth of crystallite size from 8.4 to 26.1 nm was observed on increasing the annealing
temperature from 100 to 800C in pure mesoporous CeO2. This signifies that the Sm3+
doping
in CeO2 stabilizes the solid solution against the crystal growth during calcination. Sm3+
doping also changes the surface energies of CeO2, which always play an important role in
grain growth during thermal treatment. The (111) peak of Sm3+
-doped CeO2 sample calcined
at 500C shift towards lower 2θ values as compared to pure CeO2, which is attributed to the
lattice expansion induced by Sm3+
doping. The absence of any peak related to Sm2O3 and
shifting of peaks to lower 2θ values for the Sm3+
-doped CeO2 sample obviously reveal that
Sm3+
is incorporated into the CeO2.
20 30 40 50 60 70 80
(420)
(331)(400)(222)
(311)(220)
(200)
(111)
(d)
(c)
(b)
(a)
Inte
nsit
y (
a.u
.)
Diffraction angle (2)
Fig. 4.7. XRD patterns of Sm3+
doped CeO2 (a) as-prepared precursor and calcined at (b)
500°C, (c) 650°C and (d) 800°C for 2 h.
In previous section it was found that the lattice parameter (a) values of the mesoporous
Sm3+
doped CeO2 samples were higher when compared with that of mesoporous pure CeO2
samples. This increase in the lattice parameter in Sm3+
doped CeO2 nanocrystallites can be
attributed to the replacement of Ce4+
(0.97°A) with a larger size Sm3+
(1.08°A) without
changing the cubic fluorite CeO2 structure.29
We also observed that the lattice parameter of
pure mesoporous CeO2 (a = 0.5410 nm) is very close to the bulk CeO2 (a = 0.5411 nm). This
increase in the lattice parameter can be attributed to the creation of Ce3+
ions, which possess a
larger ionic radius (1.14°A) than the Ce4+
ions. In order to balance the charge compensation,
Sm3+
additives and Ce3+
create oxygen vacancies in the CeO2 lattice, causing further lattice
expansion.29,30

Chapter 4 Samarium Doped Mesoporous Ceria
101
Table 4.5. Crystallites size and lattice parameter values of Sm3+
doped CeO2 nanopowders
calcined at different temperatures.
Sample Crystallite
size (nm)
Lattice parameter
(nm)
1SmCeSDSasp 9.6 0.5418
1SmCeSDS500 9.7 0.5410
1SmCeSDS650 13.5 0.5422
1SmCeSDS800 19.4 0.5433
Surprisingly, a decrease in lattice volume value to 0.5410 nm was observed when the
sample was calcined at 500°C (see Table 4.5). This lattice contraction observed in the
mesoporous structure may be due to the strains imposed by the pore wall structure.
Interestingly, the lattice parameter value was increased to 0.5421 or 0.5433 nm on further
increase in the calcination temperature to 650°C or 800°C due to the gradual increase in the
crystallite size and collapsing of pores. Huang et al. observed a linear increase in lattice
parameters on increasing the calcination temperatures from room temperature to 1000C in
Ce0.83Sm0.17O1.915 solid solution synthesized by the hydrothermal method.31
So, the lattice
expansion observed here on mesoporous Sm3+
-doped CeO2 materials is resulting from the
complex effects of substitution and mesoporosity.
4.3.2.3. Effect of refluxing method
Fig. 4.8 shows XRD patterns of the as-synthesized 1 mol% Sm3+
doped CeO2 powders
obtained using SDS as surfactant via (a) without refluxing, (b) conventional refluxing, and (c)
microwave refluxing method. The as-synthesized samples obtained via normal refluxing
showed better crystallinity and larger crystallite size of 9.6 nm. The crystallite sizes were 8.3
and 8.1 nm for the samples obtained via without refluxing and microwave refluxing method,
respectively. The calculated values of average crystallite size and lattice parameters from the
XRD are summarized in Table 4.6. The lattice parameters of the 1SmCeSDSasp are larger
than those of 1SmCeSDSNRasp but smaller than those of 1SmCeSDSMWasp.

Chapter 4 Samarium Doped Mesoporous Ceria
102
20 30 40 50 60 70 80
(c)
(b)
(420)
(331)(400)
(222)
(311)
(220)
(200)
(111)
Inte
nsit
y (
a.u
.)
Diffraction angle (2)
(a)
Fig. 4.8. XRD patterns of the as-prepared 1 mol% Sm3+
doped CeO2 powders synthesized via
(a) without refluxing, (b) normal refluxing, and (c) microwave refluxing method.
Table. 4.6. Crystallites size and lattice parameter values of 1 mol% Sm3+
doped CeO2
powders synthesized via different routes.
Sample Crystallite size
(nm)
Lattice parameter
(nm)
1SmCeSDSNRasp 8.25 0.5407
1SmCeSDS5asp 9.62 0.5418
1SmCeSDS5MWasp 8.05 0.5422
4.3.2.4. Effect of surfactants
X-ray diffraction analysis of the representative as-prepared 1 mol% Sm3+
doped CeO2
sample obtained by conventional refluxing method using three different surfactants of (a)
SDS, (b) DDA and (c) PEG were employed to get the informations about the influence of
surfactants on the phase formation and crystalline size of the materials and shown in Fig. 4.9.
We observed a lattice contraction (see Table 4.7) of cubic phase in the sample synthesized
using SDS, than the samples synthesized using the DDA and PEG surfactants. The crystallite
sizes were 9.6, 7.7, and 10.1 nm for the samples synthesized using SDS, DDA, and PEG,
respectively. The lattice contraction observed in the mesoporous structure is a result of strains
imposed by the pore wall structure. The addition of surfactants could significantly regulate the
size of the crystallites of Sm3+
doped CeO2 samples.

Chapter 4 Samarium Doped Mesoporous Ceria
103
20 30 40 50 60 70 80
(c)
(b)
(420)
(331)(400)(222)
(311)
(220)
(200)
(111)
Inte
nsit
y (
a.u
.)
Diffraction angle (2)
(a)
Fig. 4.9. XRD patterns of the as-prepared 1 mol% Sm3+
doped CeO2 synthesized using (a)
SDS, (b) DDA, and (c) PEG by conventional refluxing method.
Table. 4.7. Crystallites size and lattice parameter values of 1 mol% Sm3+
doped CeO2
powders synthesized using different surfactants.
Sample Crystallite
size (nm)
Lattice
parameter (nm)
1SmCeSDSasp 9.6 0.5418
1SmCeDDAasp 7.7 0.5422
1SmCePEGasp 10.1 0.5422
4.3.3. N2 sorption isotherm of Sm3+
doped CeO2
4.3.3.1. Effect of dopant concentration
To understand the textural characteristics of 0.5, 1, 2, 5, 10, and 20 mol % Sm3+
doped
CeO2 nanopowders synthesized using SDS via conventional refluxing method and calcined at
500C are subjected to nitrogen sorption measurements and the obtained isotherms are shown
in Fig. 4.10. All the calcined samples irrespective of dopant concentrations exhibit a type-IV
isotherm with a mixed hysteresis loop in the relative pressure (p/p0) range of 0.0–1.0, which
are relevant to the characteristic of porous materials.32
Hysteresis loop appeared at a relatively
high pressure range of 0.4 to 0.8 could be related to the existence of mesostructures, whereas
the hysteresis loop observed even at higher relative pressures in the range 0.8-1.0 are
originated from the substantial inter-particle pores.33
However, the hysteresis loops are not
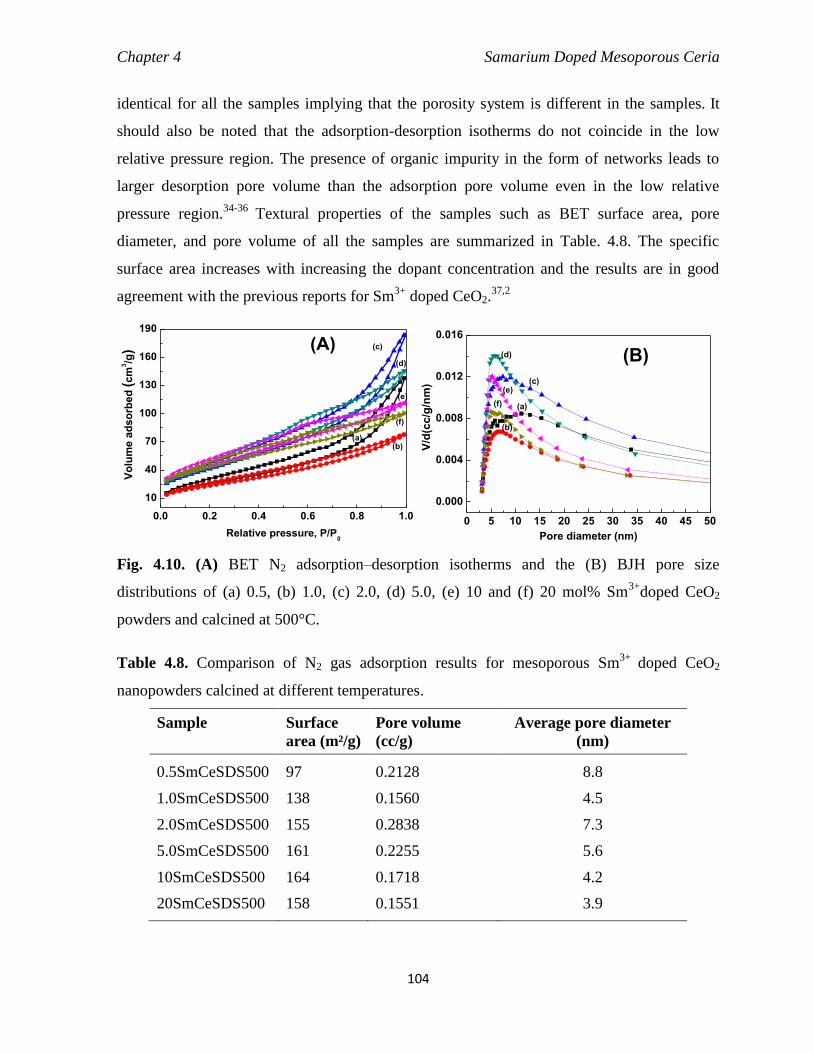
Chapter 4 Samarium Doped Mesoporous Ceria
104
identical for all the samples implying that the porosity system is different in the samples. It
should also be noted that the adsorption-desorption isotherms do not coincide in the low
relative pressure region. The presence of organic impurity in the form of networks leads to
larger desorption pore volume than the adsorption pore volume even in the low relative
pressure region.34-36
Textural properties of the samples such as BET surface area, pore
diameter, and pore volume of all the samples are summarized in Table. 4.8. The specific
surface area increases with increasing the dopant concentration and the results are in good
agreement with the previous reports for Sm3+
doped CeO2.37,2
0.0 0.2 0.4 0.6 0.8 1.0
10
40
70
100
130
160
190
(f)
(e)
(d)
(c)
(b)
Vo
lum
e a
dso
rbed
(cm
3/g
)
Relative pressure, P/P0
(a)
(A)
0 5 10 15 20 25 30 35 40 45 50
0.000
0.004
0.008
0.012
0.016
(f)
(e)
(d)
(c)
(b)V
/d(c
c/g
/nm
)
Pore diameter (nm)
(a)
(B)
Fig. 4.10. (A) BET N2 adsorption–desorption isotherms and the (B) BJH pore size
distributions of (a) 0.5, (b) 1.0, (c) 2.0, (d) 5.0, (e) 10 and (f) 20 mol% Sm3+
doped CeO2
powders and calcined at 500°C.
Table 4.8. Comparison of N2 gas adsorption results for mesoporous Sm3+
doped CeO2
nanopowders calcined at different temperatures.
Sample Surface
area (m²/g)
Pore volume
(cc/g)
Average pore diameter
(nm)
0.5SmCeSDS500 97 0.2128 8.8
1.0SmCeSDS500 138 0.1560 4.5
2.0SmCeSDS500 155 0.2838 7.3
5.0SmCeSDS500 161 0.2255 5.6
10SmCeSDS500 164 0.1718 4.2
20SmCeSDS500 158 0.1551 3.9
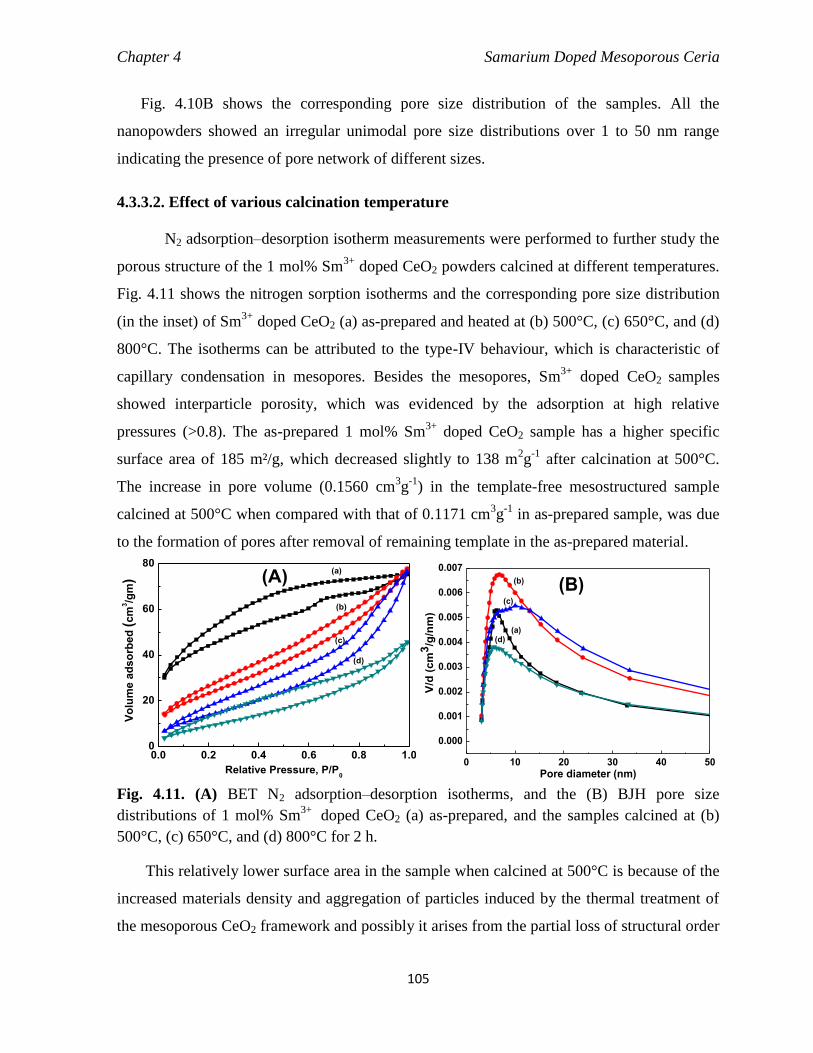
Chapter 4 Samarium Doped Mesoporous Ceria
105
Fig. 4.10B shows the corresponding pore size distribution of the samples. All the
nanopowders showed an irregular unimodal pore size distributions over 1 to 50 nm range
indicating the presence of pore network of different sizes.
4.3.3.2. Effect of various calcination temperature
N2 adsorption–desorption isotherm measurements were performed to further study the
porous structure of the 1 mol% Sm3+
doped CeO2 powders calcined at different temperatures.
Fig. 4.11 shows the nitrogen sorption isotherms and the corresponding pore size distribution
(in the inset) of Sm3+
doped CeO2 (a) as-prepared and heated at (b) 500°C, (c) 650°C, and (d)
800°C. The isotherms can be attributed to the type-IV behaviour, which is characteristic of
capillary condensation in mesopores. Besides the mesopores, Sm3+
doped CeO2 samples
showed interparticle porosity, which was evidenced by the adsorption at high relative
pressures (>0.8). The as-prepared 1 mol% Sm3+
doped CeO2 sample has a higher specific
surface area of 185 m²/g, which decreased slightly to 138 m2g
-1 after calcination at 500°C.
The increase in pore volume (0.1560 cm3g
-1) in the template-free mesostructured sample
calcined at 500°C when compared with that of 0.1171 cm3g
-1 in as-prepared sample, was due
to the formation of pores after removal of remaining template in the as-prepared material.
0.0 0.2 0.4 0.6 0.8 1.00
20
40
60
80
(d)
(c)
(b)
Vo
lum
e a
dso
rbed
(cm
3/g
m)
Relative Pressure, P/P0
(a)(A)
0 10 20 30 40 50
0.000
0.001
0.002
0.003
0.004
0.005
0.006
0.007
(d)
(c)
(b)
V/d
(c
m3
/g/n
m)
Pore diameter (nm)
(a)
(B)
Fig. 4.11. (A) BET N2 adsorption–desorption isotherms, and the (B) BJH pore size
distributions of 1 mol% Sm3+
doped CeO2 (a) as-prepared, and the samples calcined at (b)
500°C, (c) 650°C, and (d) 800°C for 2 h.
This relatively lower surface area in the sample when calcined at 500°C is because of the
increased materials density and aggregation of particles induced by the thermal treatment of
the mesoporous CeO2 framework and possibly it arises from the partial loss of structural order

Chapter 4 Samarium Doped Mesoporous Ceria
106
as also evident from the broader BJH pore size distribution (see Fig. 4.11B) with larger
average pore size of 8.2 nm. Similarly, a reduced surface area was observed in mesostructured
zirconia modified by 2 mol% ceria upon calcination at higher temperatures.38
The sample
calcined at 650C or 800C exhibited BET surface area of 75 m2g
-1 or 45 m
2g
-1, and
total pore
volume of 0.1253 cm3g
-1 or 0.0706 cm
3g
-1. The determined values of BET surface area (SBET),
average pore size (DA), and total pore volume (Vtotal) are summarized in Table 4.9.
Mesoporous CeO2 and Fe3+
doped CeO2 with surface areas 109 to 147 m2/g were synthesized
by means of a hydrothermal procedure operating at 100°C.18
It is well known fact that the
CeO2 suffers from a lack of thermomechanical stability that reduces its active surface area at
higher temperatures by coarsening and sintering processes, which represents a severe
limitation for its implementation in high-temperature devices. A very low weight loss (as
observed from TG analysis) during thermal treatment of the as-prepared mesoporous material
leads to less shrinkage, which in turn plays important role in preventing grain growth and
retaining the mesoporosity up to higher temperature and thus resulting high surface area
material. So, the present synthetic route using SDS as surfactant is beneficial to obtain high
surface area materials up to higher temperature. These mesoporous materials having small
pores and high surface area are expected to show high activity in adsorption and catalysis
even at higher temperatures.
Table 4.9. N2 gas adsorption results for mesoporous 1 mol% Sm3+
doped CeO2 nanopowders
calcined at different temperatures.
Sample Surface
area (m²/g)
Pore volume
(cc/g)
Average pore
diameter (nm)
1.0SmCeSDSasp 184 0.1171 2.5
1.0SmCeSDS500 138 0.1560 4.5
1.0SmCeSDS650 59 0.1253 8.4
1.0SmCeSDS800 38 0.07055 7.4
4.3.3.3. Influence of reflux methods
The N2 sorption isotherms (Fig. 4.12) of the 1 mol% Sm3+
doped CeO2 sample
calcined at 500C prepared using SDS and via without refluxing, conventional refluxing, and
microwave refluxing methods were analyzed in order to understand the influence of refluxing
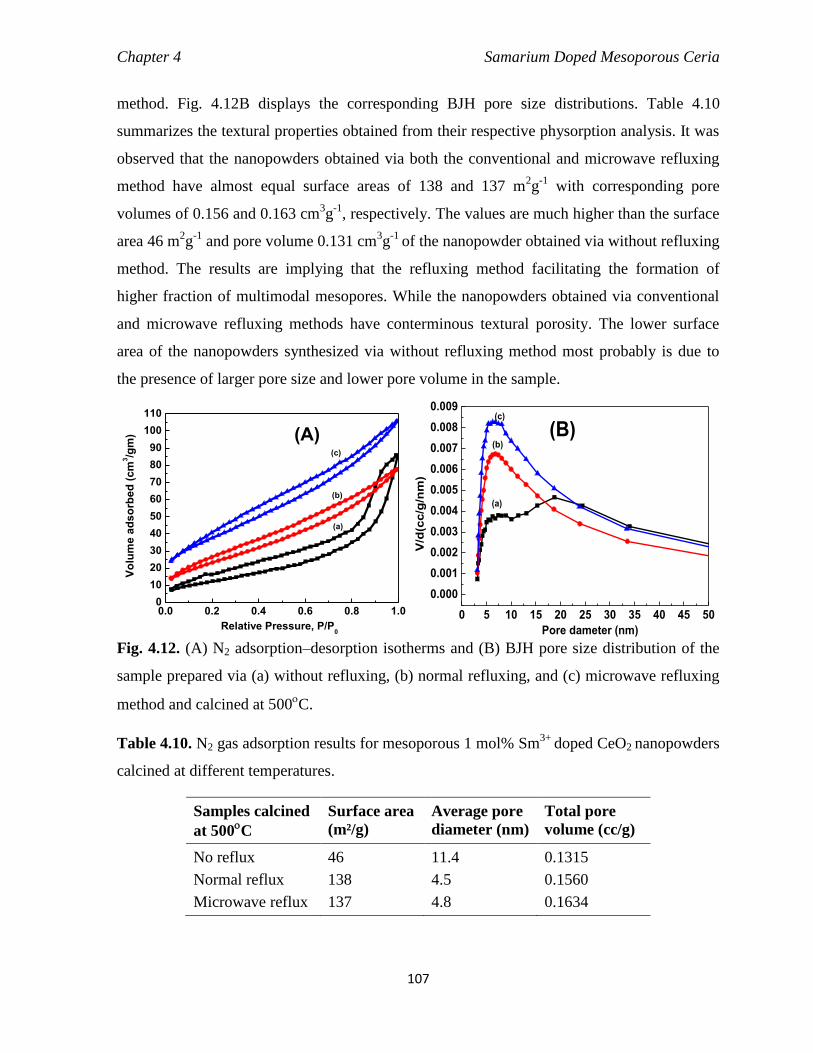
Chapter 4 Samarium Doped Mesoporous Ceria
107
method. Fig. 4.12B displays the corresponding BJH pore size distributions. Table 4.10
summarizes the textural properties obtained from their respective physorption analysis. It was
observed that the nanopowders obtained via both the conventional and microwave refluxing
method have almost equal surface areas of 138 and 137 m2g
-1 with corresponding pore
volumes of 0.156 and 0.163 cm3g
-1, respectively. The values are much higher than the surface
area 46 m2g
-1 and pore volume 0.131 cm
3g
-1 of the nanopowder obtained via without refluxing
method. The results are implying that the refluxing method facilitating the formation of
higher fraction of multimodal mesopores. While the nanopowders obtained via conventional
and microwave refluxing methods have conterminous textural porosity. The lower surface
area of the nanopowders synthesized via without refluxing method most probably is due to
the presence of larger pore size and lower pore volume in the sample.
0.0 0.2 0.4 0.6 0.8 1.00
10
20
30
40
50
60
70
80
90
100
110
(c)
(b)
(a)
Vo
lum
e a
ds
orb
ed
(c
m3/g
m)
Relative Pressure, P/P0
(A)
0 5 10 15 20 25 30 35 40 45 50
0.000
0.001
0.002
0.003
0.004
0.005
0.006
0.007
0.008
0.009(c)
(b)
V/d
(cc/g
/nm
)
Pore dameter (nm)
(a)
(B)
Fig. 4.12. (A) N2 adsorption–desorption isotherms and (B) BJH pore size distribution of the
sample prepared via (a) without refluxing, (b) normal refluxing, and (c) microwave refluxing
method and calcined at 500C.
Table 4.10. N2 gas adsorption results for mesoporous 1 mol% Sm3+
doped CeO2 nanopowders
calcined at different temperatures.
Samples calcined
at 500C
Surface area
(m²/g)
Average pore
diameter (nm)
Total pore
volume (cc/g)
No reflux 46 11.4 0.1315
Normal reflux 138 4.5 0.1560
Microwave reflux 137 4.8 0.1634
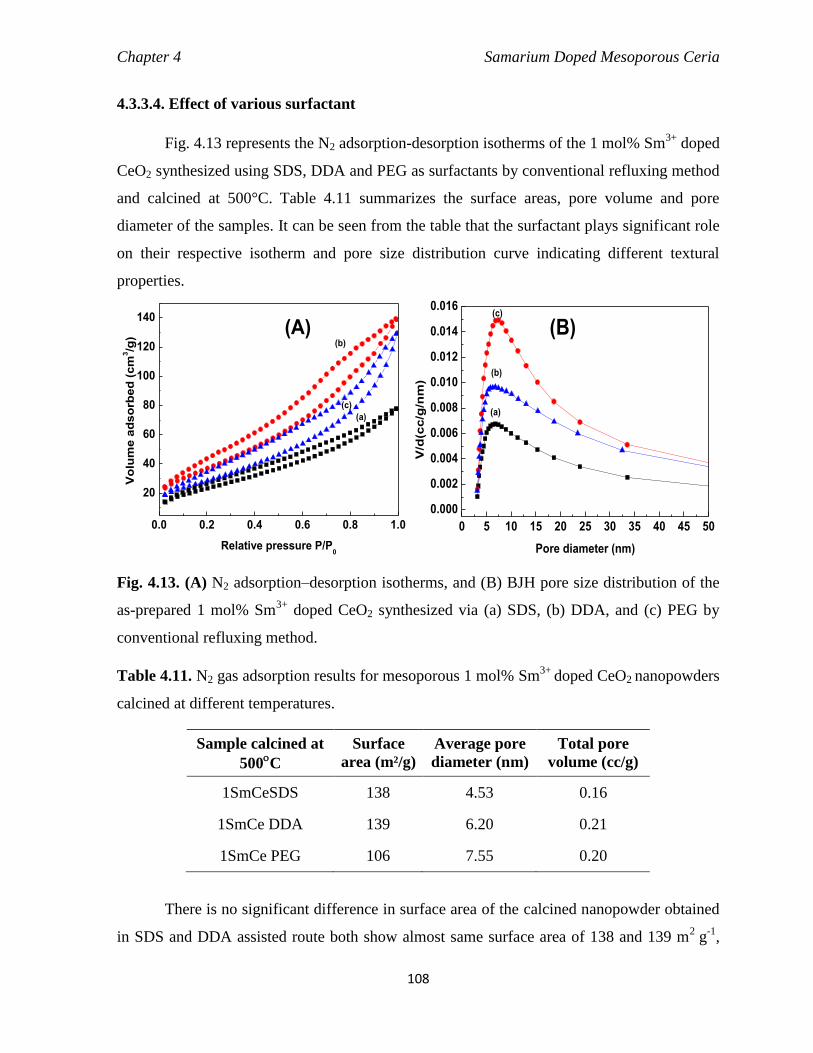
Chapter 4 Samarium Doped Mesoporous Ceria
108
4.3.3.4. Effect of various surfactant
Fig. 4.13 represents the N2 adsorption-desorption isotherms of the 1 mol% Sm3+
doped
CeO2 synthesized using SDS, DDA and PEG as surfactants by conventional refluxing method
and calcined at 500°C. Table 4.11 summarizes the surface areas, pore volume and pore
diameter of the samples. It can be seen from the table that the surfactant plays significant role
on their respective isotherm and pore size distribution curve indicating different textural
properties.
0.0 0.2 0.4 0.6 0.8 1.0
20
40
60
80
100
120
140
(c)
(b)
Vo
lum
e a
dso
rbed
(cm
3/g
)
Relative pressure P/P0
(a)
(A)
0 5 10 15 20 25 30 35 40 45 50
0.000
0.002
0.004
0.006
0.008
0.010
0.012
0.014
0.016(c)
(b)
V/d
(cc/g
/nm
)
Pore diameter (nm)
(B)
(a)
Fig. 4.13. (A) N2 adsorption–desorption isotherms, and (B) BJH pore size distribution of the
as-prepared 1 mol% Sm3+
doped CeO2 synthesized via (a) SDS, (b) DDA, and (c) PEG by
conventional refluxing method.
Table 4.11. N2 gas adsorption results for mesoporous 1 mol% Sm3+
doped CeO2 nanopowders
calcined at different temperatures.
Sample calcined at
500C
Surface
area (m²/g)
Average pore
diameter (nm)
Total pore
volume (cc/g)
1SmCeSDS 138 4.53 0.16
1SmCe DDA 139 6.20 0.21
1SmCe PEG 106 7.55 0.20
There is no significant difference in surface area of the calcined nanopowder obtained
in SDS and DDA assisted route both show almost same surface area of 138 and 139 m2
g-1
,
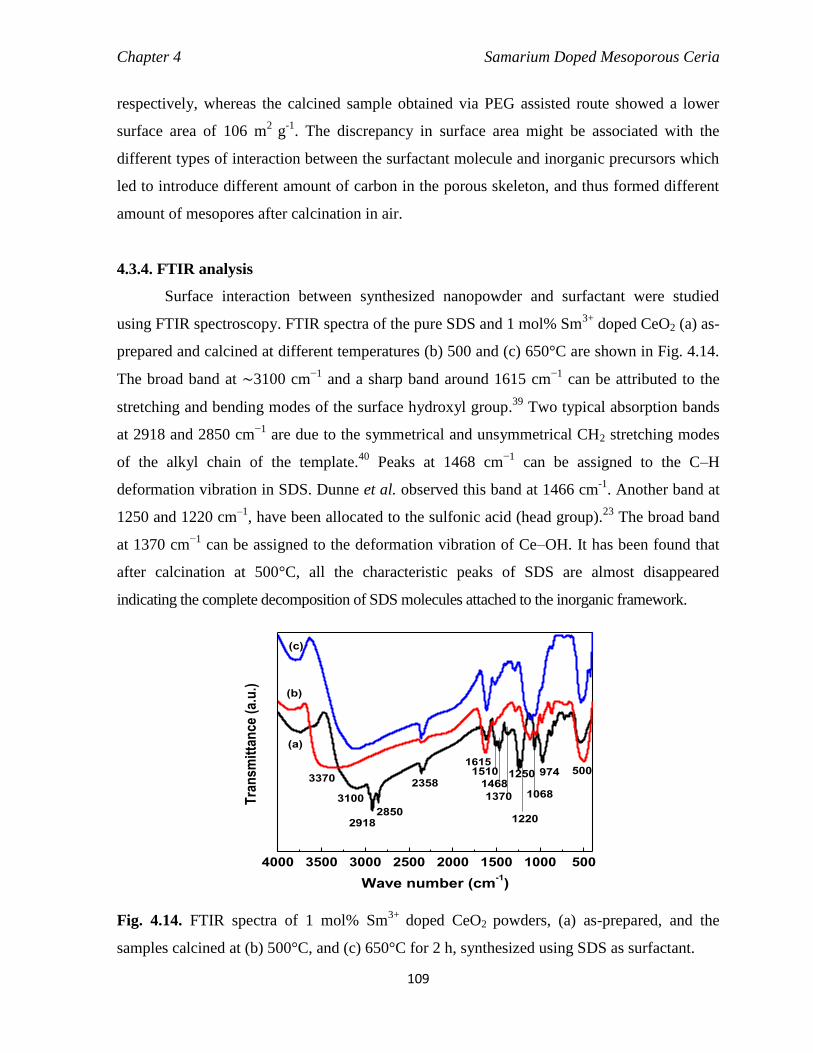
Chapter 4 Samarium Doped Mesoporous Ceria
109
respectively, whereas the calcined sample obtained via PEG assisted route showed a lower
surface area of 106 m2
g-1
. The discrepancy in surface area might be associated with the
different types of interaction between the surfactant molecule and inorganic precursors which
led to introduce different amount of carbon in the porous skeleton, and thus formed different
amount of mesopores after calcination in air.
4.3.4. FTIR analysis
Surface interaction between synthesized nanopowder and surfactant were studied
using FTIR spectroscopy. FTIR spectra of the pure SDS and 1 mol% Sm3+
doped CeO2 (a) as-
prepared and calcined at different temperatures (b) 500 and (c) 650°C are shown in Fig. 4.14.
The broad band at ∼3100 cm−1
and a sharp band around 1615 cm−1
can be attributed to the
stretching and bending modes of the surface hydroxyl group.39
Two typical absorption bands
at 2918 and 2850 cm−1
are due to the symmetrical and unsymmetrical CH2 stretching modes
of the alkyl chain of the template.40
Peaks at 1468 cm−1
can be assigned to the C–H
deformation vibration in SDS. Dunne et al. observed this band at 1466 cm-1
. Another band at
1250 and 1220 cm–1
, have been allocated to the sulfonic acid (head group).23
The broad band
at 1370 cm−1
can be assigned to the deformation vibration of Ce–OH. It has been found that
after calcination at 500°C, all the characteristic peaks of SDS are almost disappeared
indicating the complete decomposition of SDS molecules attached to the inorganic framework.
4000 3500 3000 2500 2000 1500 1000 500
1220
(c)
(b)
500
10681468
2850
Tra
ns
mit
tan
ce
(a
.u.)
Wave number (cm-1)
2918
2358
16151510
1370
1250 974
3100
3370
(a)
Fig. 4.14. FTIR spectra of 1 mol% Sm3+
doped CeO2 powders, (a) as-prepared, and the
samples calcined at (b) 500°C, and (c) 650°C for 2 h, synthesized using SDS as surfactant.
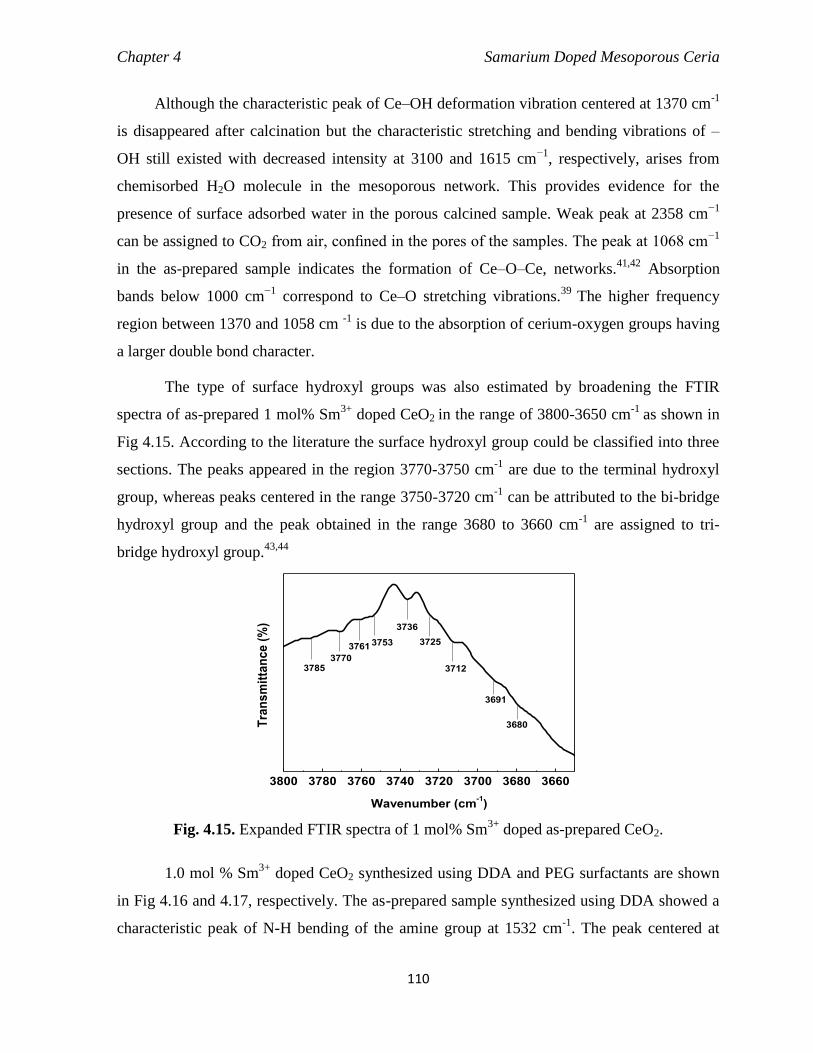
Chapter 4 Samarium Doped Mesoporous Ceria
110
Although the characteristic peak of Ce–OH deformation vibration centered at 1370 cm-1
is disappeared after calcination but the characteristic stretching and bending vibrations of –
OH still existed with decreased intensity at 3100 and 1615 cm−1
, respectively, arises from
chemisorbed H2O molecule in the mesoporous network. This provides evidence for the
presence of surface adsorbed water in the porous calcined sample. Weak peak at 2358 cm−1
can be assigned to CO2 from air, confined in the pores of the samples. The peak at 1068 cm−1
in the as-prepared sample indicates the formation of Ce–O–Ce, networks.41,42
Absorption
bands below 1000 cm−1
correspond to Ce–O stretching vibrations.39
The higher frequency
region between 1370 and 1058 cm -1
is due to the absorption of cerium-oxygen groups having
a larger double bond character.
The type of surface hydroxyl groups was also estimated by broadening the FTIR
spectra of as-prepared 1 mol% Sm3+
doped CeO2 in the range of 3800-3650 cm-1
as shown in
Fig 4.15. According to the literature the surface hydroxyl group could be classified into three
sections. The peaks appeared in the region 3770-3750 cm-1
are due to the terminal hydroxyl
group, whereas peaks centered in the range 3750-3720 cm-1
can be attributed to the bi-bridge
hydroxyl group and the peak obtained in the range 3680 to 3660 cm-1
are assigned to tri-
bridge hydroxyl group.43,44
3800 3780 3760 3740 3720 3700 3680 3660
Tra
ns
mit
tan
ce
(%
)
Wavenumber (cm-1)
37853770
3761 3753
3736
3725
3712
3680
3691
Fig. 4.15. Expanded FTIR spectra of 1 mol% Sm3+
doped as-prepared CeO2.
1.0 mol % Sm3+
doped CeO2 synthesized using DDA and PEG surfactants are shown
in Fig 4.16 and 4.17, respectively. The as-prepared sample synthesized using DDA showed a
characteristic peak of N-H bending of the amine group at 1532 cm-1
. The peak centered at

Chapter 4 Samarium Doped Mesoporous Ceria
111
3410 cm-1
, 1630 cm-1
and 1356 cm-1
corresponds to the –OH stretching, -OH bending and Ce-
OH deformation vibration, respectively. On calcination at 500C, the peaks intensity of -NH2
group at 1532 cm-1
as well as the symmetrical and unsymmetrical CH2 stretching modes
centered at 2925 and 2856 cm-1
were diminished. Similarly, the decrease in peaks intensity
with increasing calcination temperatures related to the surfactant were also observed in the
nanopowder synthesized using PEG assisted route.
4000 3500 3000 2500 2000 1500 1000 500
502
(c)
(b)
2856
Tra
ns
mit
tan
ce
(%
)
Wavenumber (cm-1)
968
1056
1356
15321630
3410
2925
(a)
Fig. 4.16. FTIR spectra of 1 mol% Sm
3+ doped CeO2 nanopowders, (a) as-prepared, and the
samples calcined at (b) 500°C, and (c) 650°C for 2 h, synthesized using DDA as surfactant.
4000 3500 3000 2500 2000 1500 1000 500
(c)
(b)
520
16242853
Tra
ns
mit
tan
ce
(%
)
Wavelength (cm-1)
1538
1325
1061
968
3400
2922
2328
(a)
Fig. 4.17. FTIR spectra of 1 mol% Sm3+
doped CeO2 nanopowders, (a) as-prepared, and the
samples calcined at (b) 500°C, and (c) 650°C for 2 h, synthesized using PEG as surfactant.

Chapter 4 Samarium Doped Mesoporous Ceria
112
4.3.5. Microstructure analysis
4.3.5.1. FESEM images, EDAX analysis and elemental mapping
Fig. 4.18. FESEM micrographs of (A) 0.5, (B) 1.0, (C) 2.0, and (D) 5 mol% Sm3+
doped
CeO2 calcined at 500°C.
The surface morphology of the Sm3+
doped CeO2 nanoparticles calcined at 500°C for
2 h were analyzed by using FESEM and are shown in Fig. 4.18. The average particle sizes
were 10 to 20 nm, which reasonably matches with the crystallite size calculated from the
XRD analysis using the Scherrer formula. The surface morphology of the nanopowders did
not change much with increasing the dopant concentration from 0.5 to 5%. EDS spectra for
the (a) 0.5, (b) 1.0, (c) 2.0, and (d) 5 mol% Sm3+
doped CeO2 calcined at 500°C is given in
Fig. 4.19. From the EDX spectra of Sm3+
doped CeO2 samples, the expected peaks of Ce were
observed at ~ 0.9, 4.9, 5.3 and 6.0 keV and Sm peaks at ~ 1.1 and 5.6 keV. For 1 mol% Sm3+
doped CeO2, the final incorporation of Sm was 1.22 at.% into the CeO2. The homogeneous
distribution of Sm2O3 over the surface of CeO2 was further confirmed by EDS elemental
mapping analysis. The EDS spectrum shows the signatures of constituent elements. The EDS
(A) (B)
(C) (D)

Chapter 4 Samarium Doped Mesoporous Ceria
113
mapping profile for the elements Ce (red color), Sm (green color) and O (blue color) were
scanned in the 1 mol% Sm3+
doped CeO2 nanopowder and are shown in Fig. 4.20. The
mappings of independent elements of Ce, Sm and O are shown in Fig. 4.20 (b–d) and the
mapping display a clear homogeneous distribution of elements in the CeO2 matrix.
Fig. 4.19. EDS graphs of (A) 0.5, (B) 1.0, (C) 2.0, and (D) 5 mol% Sm3+
doped CeO2
calcined at 500°C.
It can be seen from Fig. 4.21, the microstructure of 1 mol% Sm3+
doped CeO2
synthesized using microwave refluxing and calcined at 500°C showed higher degree of
agglomeration than the sample synthesized using conventional refluxing. In addition, the
influences of calcination temperatures on the morphology of Sm3+
doped CeO2 samples were
also investigated by FESEM and shown in Fig. 4.22. The morphology of the as-prepared
sample was irregular, and the particle size was randomly distributed. The calcined samples
show less agglomeration. It is clearly observed that the morphology of the nanopowders do
not undergo any remarkable change up to 800°C.
(A) (B)
(C) (D)

Chapter 4 Samarium Doped Mesoporous Ceria
114
Fig. 4.20. Elemental mapping of 1 mol% Sm3+
doped CeO2, (A) overall elemental mapping,
and of the (B) Ce, (C) Sm, and (D) O.
Fig. 4.21. FESEM micrographs of 1.0 mol% Sm3+
doped CeO2 synthesized through (A)
conventional refluxing, and (B) microwave assisted refluxing, and calcined at 500°C.
(A)
(B) (C) (D)
(A) (B)

Chapter 4 Samarium Doped Mesoporous Ceria
115
Fig. 4.22. FESEM micrographs of 1 mol% Sm3+
doped CeO2, (A) asp, and calcined at (B)
500°C (C) 650°C, and (D) 800°C.
4.3.5.2. TEM & HRTEM images
Fig. 4.23 shows the representative TEM-HRTEM micrographs of mesoporous
structure in as-prepared and calcined samples of Sm3+
doped CeO2 powders. As can be seen
from the Fig. 4.23a, the mesopore size is about 4-7 nm, and the particles have average
diameter of 8 nm. The mesopores are surrounded by the CeO2: Sm3+
crystallites. Part of the
microstructure, especially at the upper corner part (marked by open arrow) of the Fig. 4.23a,
appears disordered or even amorphous. The results indicate the presence of surfactant in the
as-prepared sample as was also confirmed by FTIR study. The high resolution TEM image
also confirms some micropores in between nanocrystals along with the mesopores. The
nanocrystals show lattice fringes corresponding to the cubic CeO2 phase, which confirms that
the pore walls are nanocrystalline.
(A) (B)
(C) (D)

Chapter 4 Samarium Doped Mesoporous Ceria
116
Fig. 4.23. TEM images (right), and HRTEM images (left) of Sm3+
doped CeO2 powders (A)
as-prepared precursor, and calcined at (B) and (C) 500°C, and (D) 650C for 2 h. Selected
part of (C) is enlarged and shown in the inset.
After calcination at 500°C, the mesoporous structure almost remains unchanged (Fig.
4.23b). Average pore and particle diameters in the sample are in the range of 6-9 and 9-10
nm, respectively. The (111), (220), and (200) lattices of nanocrystalline Sm3+
doped CeO2 can
be detected clearly by high resolution TEM image (Fig. 4.23c), giving proof of a high degree
of crystallinity in mesoporous framework. A close check-up of Fig. 4.23c shows hexagonally
arranged surface oxygen atoms. A missing atom (marked by arrow) surrounded by six atoms
may be recognized as the surface oxygen vacancy as was observed by Torbrugge et al. by
(A) (B)
(C) (D)

Chapter 4 Samarium Doped Mesoporous Ceria
117
atomic resolution dynamic force microscopy.45
The free two electrons from the missing
surface oxygen ion are captured by the two of the three Ce4+
ions of the second layer next to
the vacancy, and transformed to Ce3+
ions.45
Dark regions (see inset of Fig. 4.23c) might be
line defects arising from multiple subsurface oxygen vacancies, which formed at the higher
oxygen defect density.46
According to the theoretical calculation, the association of two
surface oxygen vacancies side by side on CeO2 (111) were energetically favored against two
isolated surface oxygen vacancies by 0.52 eV.35
It is noteworthy that the sample calcined at
650°C still exhibit mesoporous structure (see in Fig. 4.23d), confirming that the framework is
stable. The higher crystallinity of the inorganic wall and grain growth during the calcination
process resulted in a more disordered mesostructure. TEM-HRTEM in line with the XRD
results further confirmed that high crystallinity was achieved during the synthesis of the
mesoporous material.
Fig. 4.24. TEM and HRTEM micrographs of 1 mol% Sm3+
doped CeO2, calcined at 800°C
Fig. 4.24 show the representative TEM and HRTEM micrographs of the 1 mol% Sm3+
doped CeO2 calcined at 800°C. It can be noted from the figures that the particle size increased
with an increase of the calcination temperature and exhibit clear hexagonal shaped particles.
In addition the sample calcined at 800°C shows clearly visible lattice fringes [from (111)
plane] due to a higher degree of crystallinity which are in good agreement with the XRD
results. The particle sizes were in the range of 20 to 25 nm. A similar increase in particle size
of the nanocrystalline Ce–Sm–oxide solid solution from ~ 7 to 25 nm was observed on
increasing the calcination temperature from 500 to 800°C by Kuntaiah et al.47

Chapter 4 Samarium Doped Mesoporous Ceria
118
4.3.6. UV-vis DRS studies
200 300 400 500 600 7000.0
0.4
0.8
1.2
1.6
2.0
200 300 400 500 600-0.2
0.0
0.2
0.4
0.6
0.8
1.0
1.2
1.4
1.6
100CeSDS500
1SmCeSDS500235
(e)
(c)
(d)
(b)
Ab
so
rb
an
ce
(a
.u.)
Wavelength (nm)
(a)
345275
Fig. 4.25. UV-vis diffuse reflectance spectra of Sm3+
doped CeO2 powders (a) as-prepared
precursor and calcined at (b) 500°C (compared with that of pure CeO2 in the inset), (c) 650C,
(d) 800C, and (e) 1000C for 2 h.
The well-known ultraviolet blocking material, Sm3+
doped CeO2 nanocrystals
possesses strong absorption properties near the ultraviolet region. Spectra a-e of Fig. 4.25
compares the UV-vis diffuse reflectance spectra of Sm3+
doped CeO2 as-prepared, and heated
at 500°C, 600°C, and 800°C, respectively. A very careful observation revealed that all the
samples exhibit three absorption maxima in the UV region, centered around 235, 275 and 345
nm, which correspond to charge-transfer transitions from O2 (2p) to the Ce
3+ (4f) and O
2 (2p)
to the Ce4+
(4f) orbitals, and inter-band transitions, respectively, in agreement with previous
reports.30
As compared with the pure mesoporous CeO2, doped CeO2 possess higher light
absorption intensity and the adsorption edge also shifted toward the longer wavelength i.e.,
red shift (shown in the inset). The red shift of the absorption peaks of Sm3+
doped CeO2
indicates a narrowing of the bandgap.
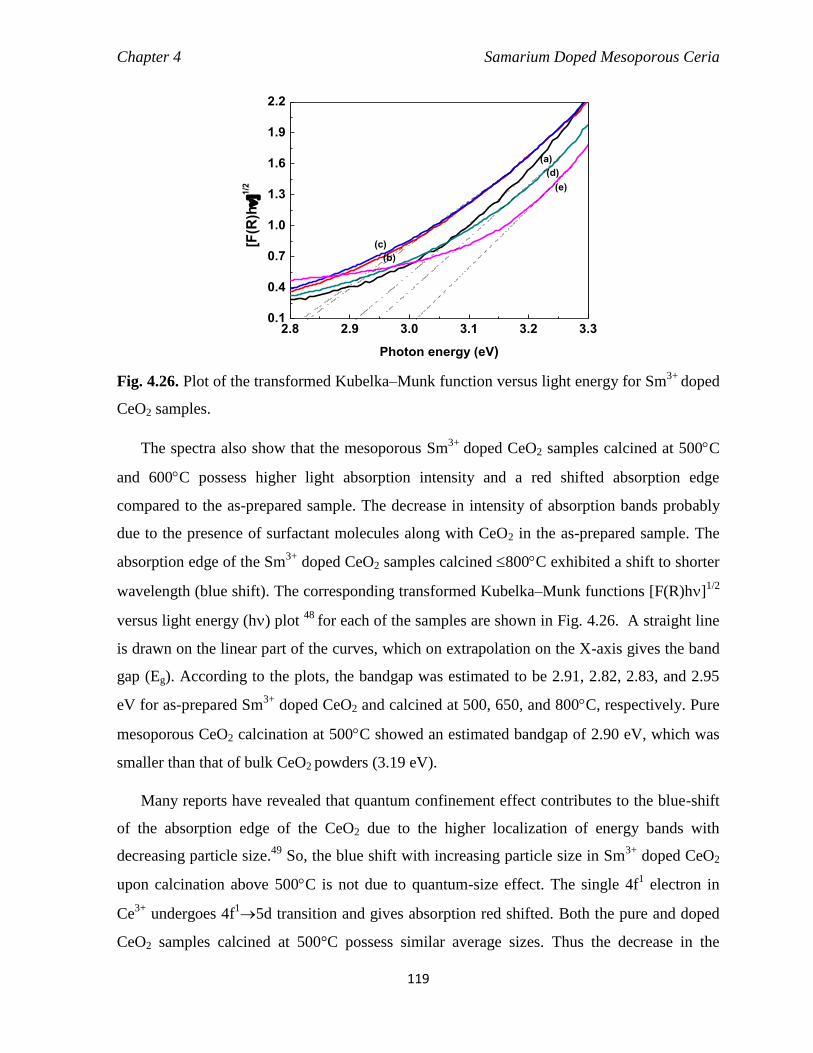
Chapter 4 Samarium Doped Mesoporous Ceria
119
2.8 2.9 3.0 3.1 3.2 3.30.1
0.4
0.7
1.0
1.3
1.6
1.9
2.2
(b)
(d)
(e)
(c)[F(R
)h1
/2
Photon energy (eV)
(a)
Fig. 4.26. Plot of the transformed Kubelka–Munk function versus light energy for Sm3+
doped
CeO2 samples.
The spectra also show that the mesoporous Sm3+
doped CeO2 samples calcined at 500C
and 600C possess higher light absorption intensity and a red shifted absorption edge
compared to the as-prepared sample. The decrease in intensity of absorption bands probably
due to the presence of surfactant molecules along with CeO2 in the as-prepared sample. The
absorption edge of the Sm3+
doped CeO2 samples calcined 800C exhibited a shift to shorter
wavelength (blue shift). The corresponding transformed Kubelka–Munk functions [F(R)h]1/2
versus light energy (h) plot 48
for each of the samples are shown in Fig. 4.26. A straight line
is drawn on the linear part of the curves, which on extrapolation on the X-axis gives the band
gap (Eg). According to the plots, the bandgap was estimated to be 2.91, 2.82, 2.83, and 2.95
eV for as-prepared Sm3+
doped CeO2 and calcined at 500, 650, and 800C, respectively. Pure
mesoporous CeO2 calcination at 500C showed an estimated bandgap of 2.90 eV, which was
smaller than that of bulk CeO2 powders (3.19 eV).
Many reports have revealed that quantum confinement effect contributes to the blue-shift
of the absorption edge of the CeO2 due to the higher localization of energy bands with
decreasing particle size.49
So, the blue shift with increasing particle size in Sm3+
doped CeO2
upon calcination above 500C is not due to quantum-size effect. The single 4f1 electron in
Ce3+
undergoes 4f15d transition and gives absorption red shifted. Both the pure and doped
CeO2 samples calcined at 500°C possess similar average sizes. Thus the decrease in the

Chapter 4 Samarium Doped Mesoporous Ceria
120
fundamental gap Eg in Sm3+
doped CeO2 was mainly induced by the valence and oxygen
vacancies state change.49
Chen et al. observed that the content of Ce3+
and oxygen vacancies
decreased with growth and oxidation of the nanoparticles (with grains of 10–20 nm) during
annealing.50
The results envisage that the Sm3+
doped CeO2 calcined at 500°C possesses
highest Ce3+
content. The higher relative absorption intensity and the extended absorption tail
in Sm3+
doped CeO2 also indicates that the Sm3+
→Ce4+
substitution indeed facilitates the
formation of Ce3+
and oxygen vacancy of the materials.
200 300 400 500 600 700 800
(g)
(a)
(f)(e)
(d)(c)
(b)
Ab
so
rban
ce (
a.u
.)
Wavelength (nm)
Fig. 4.27. UV-visible absorption spectra of (a) 0, (b) 0.5, (c) 1.0, (d) 2.0, (e) 5.0, (f) 10, and (g) 20
mol% Sm3+
doped CeO2 nanopowders calcined at 500°C.
The UV-vis diffuse reflectance spectra of pure CeO2 and 0.5, 1, 2, 5 and 10 mol%
Sm3+
-doped CeO2 nanopowders are shown in Fig. 4.27. All the samples shows a strong
absorption in the UV region (<400 nm) with a well-defined absorbance peak at around 255,
280, and 325 nm. The absorption edge of doped CeO2 is red-shifted as compared to that of the
pure CeO2 and leads to the narrowing of the band-gap due to the introduction of energy levels
in the interband gap. It is also observed that the absorption intensities in the UV light region
were increased with increasing the doping concentration from 0 to 2 mol %. On further
increase in the Sm3+
doping to 10 mol%, the absorption intensity again decreased which
suggest that the Sm3+
doping in CeO2 has induced higher concentration of Ce3+
till 2 mol%
doping. The intensity of ultraviolet absorption is a relative proportion with Ce3+
content,
which will increase the oxygen vacancy concentration of Ce-based materials due to a charge
compensation mechanism.51

Chapter 4 Samarium Doped Mesoporous Ceria
121
4.3.7. PL (photo luminescence) analysis
4.3.7.1. PL emission spectra
550 570 590 610 630 650
0
1x10⁵
2x10⁵
3x10⁵
4x10⁵
5x10⁵
6x10⁵
7x10⁵
8x10⁵
9x10⁵
4G5/2
6H7/2
622
616
575
(d)
(b)(c)
Wavelength (nm)
Inte
nsit
y (
CP
S)
(a)
4G5/2
6H5/2
Fig. 4.28. PL emission spectra of (a) 0.5, (b) 1.0, (c) 2.0, and (d) 5 mol% Sm
3+ doped CeO2
nanopowders calcined at 500°C.
Fig 4.28 shows the PL emission spectra of the 0.5, 1, 2, and 10 mol % Sm3+
doped
CeO2 nanoparticles annealed at 500°C, recorded at excitation wavelength of 335 nm. The
orange-red emission of the Sm3+
doped CeO2 can be attributed to the
4G5/2
→6H5/2, (558.5,
561.5, 565.5, 575 and 582.5 nm) and 4G5/2
→6H7/2 transitions (607.5, 612, 616.5 and 622 nm).
As both of the above magnetic dipole transitions follow the selection rule ΔJ=0 and ΔJ =1,
respectively, (where J is the total angular momentum), hence both are allowed for Sm3+
in a
site with inversion symmetry. According to the Kramer degeneracy, Sm3+
ion with its odd 4f5
electron configuration give the maximum number of Stark sublevels (2J+ 1)/2, i.e. three for
the 6H5/2 manifold, and four for the
6H7/2 manifold.
52 It has been found that although the
number of lines for 4G5/2-
6H7/2 transition (607.5 nm, 612 nm, 616.5 nm and 622 nm) is
consistent with the stark splitting of the 6H7/2 manifold, but five lines are observed for the
4G5/2-
6H5/2 transition, instead of expected three lines which revealed that some samarium ions
are situated in non-equivalent crystallographic sites. The strong emission line centered at 575
nm for the 4G5/2-
6H5/2 transition, and two emission lines centered at 616.5 and 622 nm for the
4G5/2-
6H7/2 transition is indicative of a predominant incorporation of the Sm
3+ ions into the
Ce4+
sites. Further it was also seen that the PL intensity increases with increasing the Sm3+

Chapter 4 Samarium Doped Mesoporous Ceria
122
content from 0.5 to 1.0 mol %, indicative of the successful incorporation of Sm3+
into the
CeO2 lattice. On further increase in the Sm3+
content in CeO2 resulted in a decrease in the PL
intensity due to concentration quenching.
The effect of calcination temperatures on luminescence behavior has been
investigated. Fig. 4.29 shows the photoluminescence spectra of the as-prepared 1.0 mol%
Sm3+
doped CeO2 and calcined at 500°C, 650°C, 800°C, 1000°C and 1300°C temperature for
2 h. The PL spectra were measured for all the samples under the same experimental
conditions at room temperature, using an excitation wavelength of 335 nm. PL results show
that the nanopowders calcined at 500°C did not significantly enhance the emission intensity
than the as-prepared powder. An increase in the calcination temperature leads to the
continuous growth of crystallite size and also decrease the surface-to-volume ratio, as a result,
the fluorescence quench centers (crystal defects) decrease, hence the PL intensity increases
with increasing calcination temperature. There is good correlation between the observed
luminescence behavior and the crystallite size extracted by using Debye shrerrer equation.
Calcination temperature also change the local symmetry of the crystal field around Sm3+
ion,
induced more ordered structure. Again conglomeration of particles will decrease the PL
intensity due to the decreases in cross section for absorption of light.53
However the
occurrence of the Sm3+
emissions indicates that Sm3+
was homogeneously doped in CeO2
without segregation as Sm2O3 or other Sm-related compounds.
550 570 590 610 630 6500
1x10⁶
2x10⁶
3x10⁶
4x10⁶
5x10⁶
6x10⁶
7x10⁶
8x10⁶
9x10⁶
4G5/2
6H7/2
4G5/2
6H5/2
(f)
(e)(d)(c)(b)
Inte
nsit
y (
CP
S)
Wavelength (nm)
(a)
Fig. 4.29. PL emission spectra of Sm
3+ doped CeO2 (a) as-prepared precursor, and the
samples calcined at (b) 500°C, (c) 650°C, (d) 800°C, (e) 1000°C, and (f) 1300°C for 2 h.
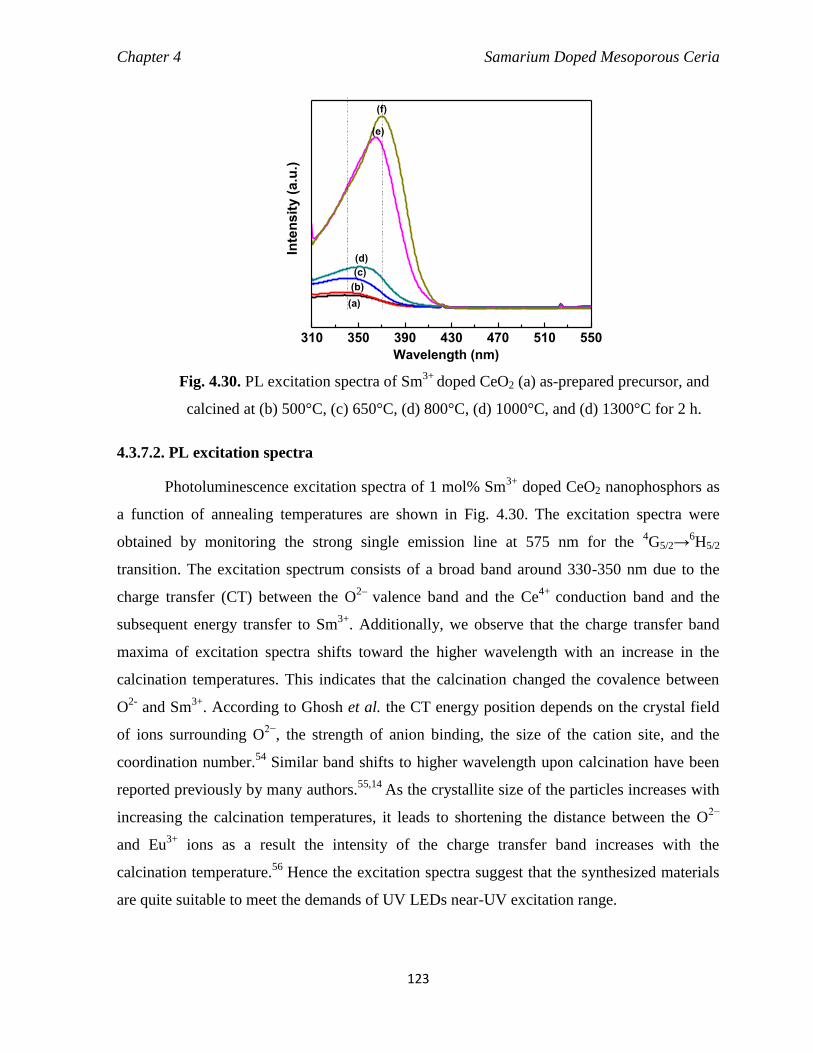
Chapter 4 Samarium Doped Mesoporous Ceria
123
310 350 390 430 470 510 550
(d)
(e)
(f)
(a)
(c)
(b)In
ten
sit
y (
a.u
.)
Wavelength (nm)
Fig. 4.30. PL excitation spectra of Sm3+
doped CeO2 (a) as-prepared precursor, and
calcined at (b) 500°C, (c) 650°C, (d) 800°C, (d) 1000°C, and (d) 1300°C for 2 h.
4.3.7.2. PL excitation spectra
Photoluminescence excitation spectra of 1 mol% Sm3+
doped CeO2 nanophosphors as
a function of annealing temperatures are shown in Fig. 4.30. The excitation spectra were
obtained by monitoring the strong single emission line at 575 nm for the 4G5/2→
6H5/2
transition. The excitation spectrum consists of a broad band around 330-350 nm due to the
charge transfer (CT) between the O2–
valence band and the Ce4+
conduction band and the
subsequent energy transfer to Sm3+
. Additionally, we observe that the charge transfer band
maxima of excitation spectra shifts toward the higher wavelength with an increase in the
calcination temperatures. This indicates that the calcination changed the covalence between
O2-
and Sm3+
. According to Ghosh et al. the CT energy position depends on the crystal field
of ions surrounding O2−
, the strength of anion binding, the size of the cation site, and the
coordination number.54 Similar band shifts to higher wavelength upon calcination have been
reported previously by many authors.55,14
As the crystallite size of the particles increases with
increasing the calcination temperatures, it leads to shortening the distance between the O2−
and Eu3+
ions as a result the intensity of the charge transfer band increases with the
calcination temperature.56 Hence the excitation spectra suggest that the synthesized materials
are quite suitable to meet the demands of UV LEDs near-UV excitation range.

Chapter 4 Samarium Doped Mesoporous Ceria
124
The excitation spectra of 0.5, 1, 2, and 10 mol% Sm3+
doped CeO2 nanopowders calcined
at 500°C with monitoring at 575 nm emissions are illustrated in Fig. 4.31. All the
nanopowders showed a broad and strong absorption band centered at 300 nm including few
sharp lines in the longer wave length region. The broadband corresponds to O2-
→Ce4+
charge
transfer transitions whereas the sharp line at longer wavelength region (350–450 nm)
attributed to the f–f transition.57
The intensity of the excitation bands showed an initial
increase as the Sm3+
doping concentration increases from 0.5 to 1 mol%. On increasing the
dopant concentration, the absorbed energy gets quenched by the energy migration along CeO2
framework via exchange mechanism resulting in weak absorption peak. Hence, it can be
concluded that the energy acquired by the host lattice upon excitation by UV light are able to
transfer it to the Sm3+
and produces the red emission.
310 360 410 460 510
(d)
(c)
(b)
Inte
nsit
y (
a.u
.)
Wavelength (nm)
(a)
Fig. 4.31. PL excitation spectra of (a) 0.5, (b) 1.0, (c) 2.0, and (d) 10 mol% Sm
3+ doped
CeO2 nanopowders calcined at 500°C for 2 h.
A model has been proposed by us to explain the energy transfer in Sm3+
doped CeO2
system which involves relaxation to defect states on CeO2 before the energy is transferred to
the Sm3+
ion. Fig. 4.32 represents the energy transfer mechanism involved in Sm3+
doped
CeO2 system. Excitation by UV light above the bandgap of Sm3+
-doped CeO2 caused the
excitation of the oxygen-vacancy-trapped electrons from the defect states present at the top of
the VB of CeO2 to the defect states present in the lower part of the CB, subsequently the
photo excited electrons migrate to the excited states of Sm3+
. Finally, the excited photo-
electrons at the excited states of Sm3+
could transfer to the long-lived 4G5/2 of Sm
3+ via
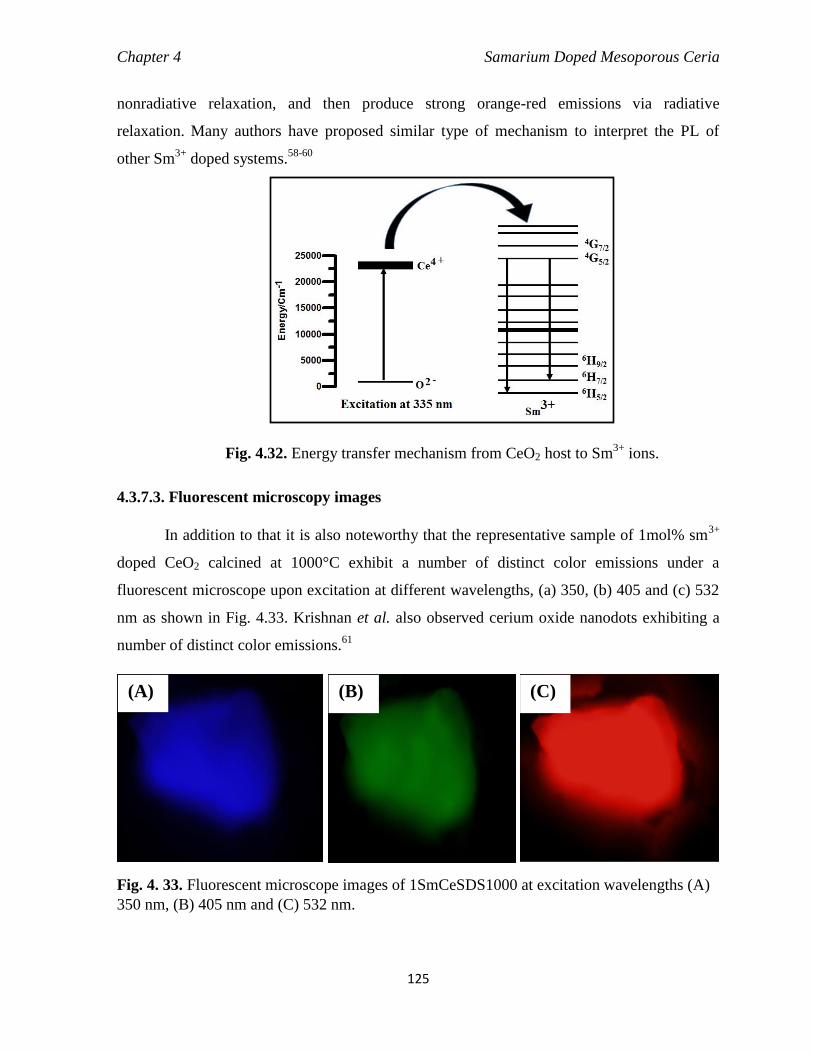
Chapter 4 Samarium Doped Mesoporous Ceria
125
nonradiative relaxation, and then produce strong orange-red emissions via radiative
relaxation. Many authors have proposed similar type of mechanism to interpret the PL of
other Sm3+
doped systems.58-60
Fig. 4.32. Energy transfer mechanism from CeO2 host to Sm3+
ions.
4.3.7.3. Fluorescent microscopy images
In addition to that it is also noteworthy that the representative sample of 1mol% sm3+
doped CeO2 calcined at 1000°C exhibit a number of distinct color emissions under a
fluorescent microscope upon excitation at different wavelengths, (a) 350, (b) 405 and (c) 532
nm as shown in Fig. 4.33. Krishnan et al. also observed cerium oxide nanodots exhibiting a
number of distinct color emissions.61
Fig. 4. 33. Fluorescent microscope images of 1SmCeSDS1000 at excitation wavelengths (A)
350 nm, (B) 405 nm and (C) 532 nm.
(A) (B) (C)
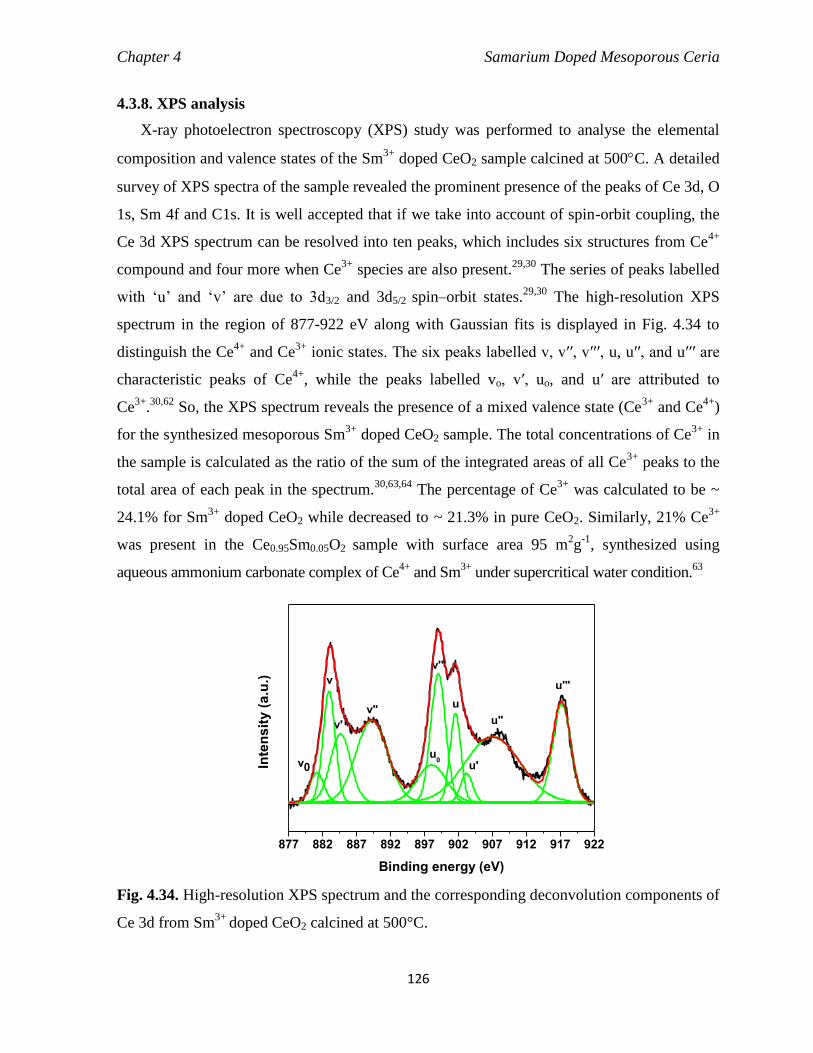
Chapter 4 Samarium Doped Mesoporous Ceria
126
4.3.8. XPS analysis
X-ray photoelectron spectroscopy (XPS) study was performed to analyse the elemental
composition and valence states of the Sm3+
doped CeO2 sample calcined at 500C. A detailed
survey of XPS spectra of the sample revealed the prominent presence of the peaks of Ce 3d, O
1s, Sm 4f and C1s. It is well accepted that if we take into account of spin-orbit coupling, the
Ce 3d XPS spectrum can be resolved into ten peaks, which includes six structures from Ce4+
compound and four more when Ce3+
species are also present.29,30
The series of peaks labelled
with ‘u’ and ‘v’ are due to 3d3/2 and 3d5/2 spin–orbit states.29,30
The high-resolution XPS
spectrum in the region of 877-922 eV along with Gaussian fits is displayed in Fig. 4.34 to
distinguish the Ce4+
and Ce3+
ionic states. The six peaks labelled v, v′′, v′′′, u, u′′, and u′′′ are
characteristic peaks of Ce4+
, while the peaks labelled vo, v′, uo, and u′ are attributed to
Ce3+
.30,62
So, the XPS spectrum reveals the presence of a mixed valence state (Ce3+
and Ce4+
)
for the synthesized mesoporous Sm3+
doped CeO2 sample. The total concentrations of Ce3+
in
the sample is calculated as the ratio of the sum of the integrated areas of all Ce3+
peaks to the
total area of each peak in the spectrum.30,63,64
The percentage of Ce3+
was calculated to be ~
24.1% for Sm3+
doped CeO2 while decreased to ~ 21.3% in pure CeO2. Similarly, 21% Ce3+
was present in the Ce0.95Sm0.05O2 sample with surface area 95 m2g
-1, synthesized using
aqueous ammonium carbonate complex of Ce4+
and Sm3+
under supercritical water condition.63
877 882 887 892 897 902 907 912 917 922
u
u0
v'"
u'
u'"
u"v"
v'
v
Inte
ns
ity
(a
.u.)
Binding energy (eV)
v0
Fig. 4.34. High-resolution XPS spectrum and the corresponding deconvolution components of
Ce 3d from Sm3+
doped CeO2 calcined at 500°C.
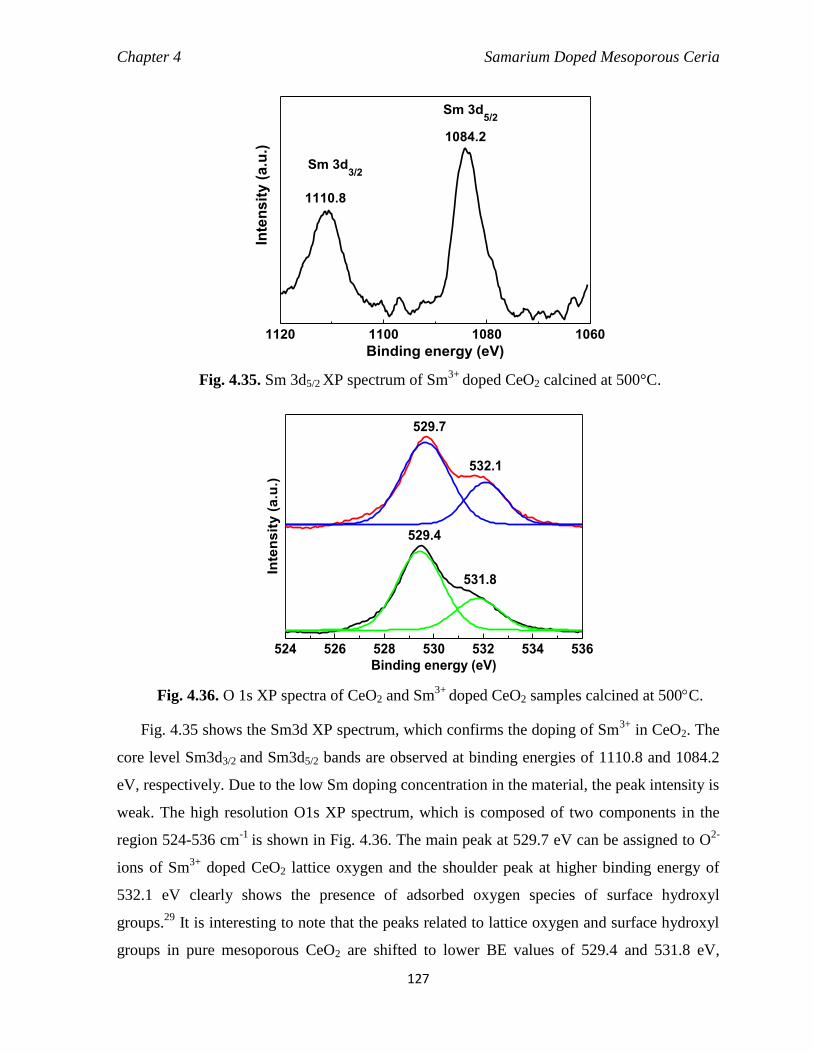
Chapter 4 Samarium Doped Mesoporous Ceria
127
1120 1100 1080 1060
Sm 3d5/2
Sm 3d3/2
Inte
ns
ity
(a
.u.)
Binding energy (eV)
1110.8
1084.2
Fig. 4.35. Sm 3d5/2 XP spectrum of Sm3+
doped CeO2 calcined at 500°C.
524 526 528 530 532 534 536
529.7
532.1
531.8
529.4
Inte
ns
ity
(a
.u.)
Binding energy (eV)
Fig. 4.36. O 1s XP spectra of CeO2 and Sm3+
doped CeO2 samples calcined at 500C.
Fig. 4.35 shows the Sm3d XP spectrum, which confirms the doping of Sm3+
in CeO2. The
core level Sm3d3/2 and Sm3d5/2 bands are observed at binding energies of 1110.8 and 1084.2
eV, respectively. Due to the low Sm doping concentration in the material, the peak intensity is
weak. The high resolution O1s XP spectrum, which is composed of two components in the
region 524-536 cm-1
is shown in Fig. 4.36. The main peak at 529.7 eV can be assigned to O2-
ions of Sm3+
doped CeO2 lattice oxygen and the shoulder peak at higher binding energy of
532.1 eV clearly shows the presence of adsorbed oxygen species of surface hydroxyl
groups.29
It is interesting to note that the peaks related to lattice oxygen and surface hydroxyl
groups in pure mesoporous CeO2 are shifted to lower BE values of 529.4 and 531.8 eV,

Chapter 4 Samarium Doped Mesoporous Ceria
128
respectively. The result reveals that the incorporation of Sm3+
to the CeO2 sample
significantly influenced the chemical environment of oxygen in the Sm3+
doped CeO2 sample.
The intensity of the peak of surface hydroxyl group was significantly high although the
samples were calcined at 500C temperatures. It is important to notice that peak intensity for
the surface hydroxyl group is higher in mesoporous Sm3+
doped CeO2 as compared to that of
pure CeO2, which may be attributed to its higher surface area and pore volume. The presence
of Ce3+
ions in the CeO2 lattice is attributed to the oxygen vacancies in the nanocrystals. The
results indicated that the present synthesis procedure is robust and capable of producing
surface defect state engineered CeO2.
4.3.9. H2-TPR analysis
Temperature programmed reduction by H2 (H2-TPR) has been employed to ascertain
the reduction behavior of pure CeO2 and Sm3+
doped CeO2 calcined at 500C, and the
respective profiles are shown in Fig. 4.37. It is generally accepted that the reduction of surface
lattice oxygen, as it can contact directly with H2 (surface reduction), occurs first at lower
temperature and then the reduction of the bulk oxygen occurs at relatively higher
temperatures.65,66 The TPR profile of pure CeO2 (Fig. 4.37a) displays two distinct peaks,
where the low-temperature peak at 495C is attributed to reduction of oxygen species present
at surface and the high-temperature peak at 770C is observed due to bulk reduction. The
higher relative intensity of surface reduction peak than the bulk reduction peak inferred that
the sample has a significant amount of reducible surface oxygen.
It is very interesting to observe that on incorporation of Sm3+
in CeO2 the reduction peaks
merge into one broad peak (330–630C) centered at 560C as can be seen from Fig. 4.37b.
The broad peak is deconvoluted in to two peaks (see inset of Fig. 4.37b) centered at 495C
and 560C attributed to surface and bulk oxygen reductions, respectively. Though there is no
appreciable change in the peak position of the surface reduction peak but the peak area
increased as compared with those of pure CeO2. Surprisingly, the bulk reduction peak of Sm3+
doped CeO2 is shifted to lower temperature and the peak area is also drastically enhanced in
comparison to the pure sample. This essentially suggests that the bulk reduction occurs with a
lower activation barrier and quantitatively account for the oxygen enhancement. A decrease in
the bulk reduction temperature that approaches the surface reduction peak indicates that the
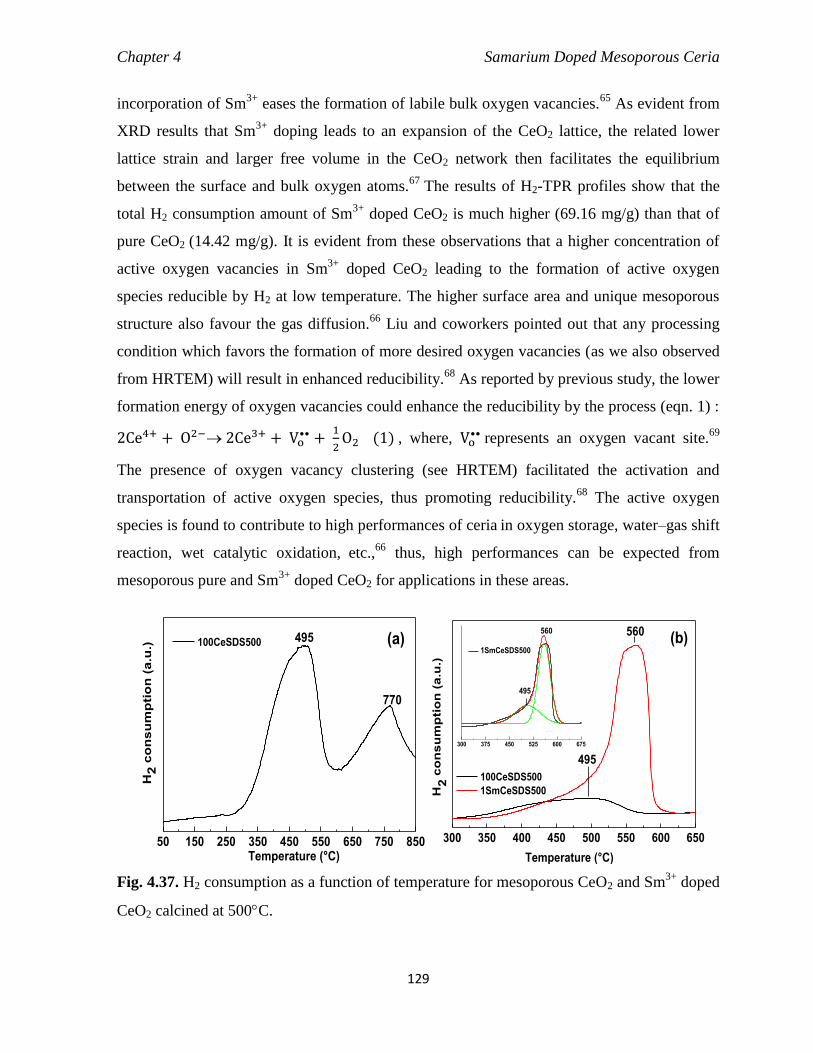
Chapter 4 Samarium Doped Mesoporous Ceria
129
incorporation of Sm3+
eases the formation of labile bulk oxygen vacancies.65
As evident from
XRD results that Sm3+
doping leads to an expansion of the CeO2 lattice, the related lower
lattice strain and larger free volume in the CeO2 network then facilitates the equilibrium
between the surface and bulk oxygen atoms.67
The results of H2-TPR profiles show that the
total H2 consumption amount of Sm3+
doped CeO2 is much higher (69.16 mg/g) than that of
pure CeO2 (14.42 mg/g). It is evident from these observations that a higher concentration of
active oxygen vacancies in Sm3+
doped CeO2 leading to the formation of active oxygen
species reducible by H2 at low temperature. The higher surface area and unique mesoporous
structure also favour the gas diffusion.66
Liu and coworkers pointed out that any processing
condition which favors the formation of more desired oxygen vacancies (as we also observed
from HRTEM) will result in enhanced reducibility.68
As reported by previous study, the lower
formation energy of oxygen vacancies could enhance the reducibility by the process (eqn. 1) :
2Ce4+ + O2− 2Ce3+ + Vo•• +
1
2O2 (1) , where, Vo
•• represents an oxygen vacant site.69
The presence of oxygen vacancy clustering (see HRTEM) facilitated the activation and
transportation of active oxygen species, thus promoting reducibility.68
The active oxygen
species is found to contribute to high performances of ceria in oxygen storage, water–gas shift
reaction, wet catalytic oxidation, etc.,
66 thus, high performances can be expected from
mesoporous pure and Sm3+
doped CeO2 for applications in these areas.
50 150 250 350 450 550 650 750 850
100CeSDS500
H2
co
ns
um
pti
on
(a
.u.)
Temperature (°C)
495
770
(a)
300 350 400 450 500 550 600 650
300 375 450 525 600 675
1SmCeSDS500
495
560
H2
co
ns
um
pti
on
(a
.u.)
Temperature (°C)
100CeSDS500
1SmCeSDS500
495
560 (b)
Fig. 4.37. H2 consumption as a function of temperature for mesoporous CeO2 and Sm3+
doped
CeO2 calcined at 500C.

Chapter 4 Samarium Doped Mesoporous Ceria
130
4.3.10. NH3-TPD analysis
50 150 250 350 450 550 650 750
(b)
TC
D s
ign
al
(a.u
.)
Temperature (°C)
(a)
Fig. 4.38. NH3–TPD profiles of the (a) CeO2 and (b) Sm3+
doped–CeO2 calcined at 500C.
The NH3-TPD profiles of the pure CeO2 and Sm3+
doped CeO2 samples are shown in
Fig. 4.38, which provide evidence of the presence of acid sites of different strengths on each
sample. In this study, a wide desorption peak is observed in the range 100C to 500C, which
is characterized as weak acid sites.70
This broad peak is illustrating that the NH3 adsorbed on
multifold active sites in the outer and inner surface of the mesoporous materials. The
strongest acid sites releasing NH3 at higher temperature of 670C are Lewis-acidic in nature,
while weak acid sites desorbing NH3 at lower temperature are attributed as Brønsted acidic
sites.1 When Sm
3+ dopant replaces one Ce
4+, one of the oxygen atoms on Ce
4+ loses a bonding
site and thereby a hydroxyl group (Brønsted acid site) is formed in CeO2 lattice. The Sm3+
doped CeO2 show two major desorption peaks at 235, and 670C, whereas pure CeO2 show
only one major peak at 235C. The more prominent high temperature peak at 670
C for Sm
3+
doped CeO2 sample suggests that higher number of stronger acidic sites. It is clear from the
figure that the Sm3+
incorporation into CeO2 lattice induces an increase in the weak acidic
sites and created more number of strong acidic sites as compared to pure CeO2. The larger
number of oxygen vacancy, which can accept electron (Lewis acid site) may be the reason for
the higher acidity of Sm3+
doped CeO2 sample.

Chapter 4 Samarium Doped Mesoporous Ceria
131
4.3.10. Conclusion
Mesoporous and nanocrystalline (0.5, 2, 5, 10 and 20 mol%) Sm3+
doped CeO2
powders with cubic fluorite structure were synthesized through a facile aqueous solution-
based chemical route using different surfactants. The prepared materials were characterized
using DSC-TG, XRD, TEM, BET, UV-vis diffuse reflectance and, PL, XPS, TPR and TPR
techniques. The as-synthesized hybrid and the sample calcined at 500°C exhibited high
surface area and pore volume. The co-existence of mixed valence state, Ce3+
and Ce4+
was
confirmed by XPS studies. Concentrations of Ce3+
obtained from the XPS analysis are
significantly larger than reported previously, which indicates the presence of higher original
concentration of the oxygen vacancies in nano-CeO2. Sm3+
doping in CeO2 show improved
structural features such as increased lattice volume, higher surface hydroxyl groups, specific
surface area, pore volume, and Ce3+
and oxygen vacancies concentrations. UV-vis diffuse
reflectance spectra for mesoporous samples showed intense broad bands corresponding to the
charge-transfer transitions from O2 (2p) to the Ce4+
or Ce3+
(4f) orbitals in host cubic CeO2.
The enhanced PL emission spectra of mesoporous Sm3+
doped CeO2 show narrow bands
arising from the 4G5/2→
6H5/2 and
4G5/2→
6H7/2 transitions of Sm
3+ ion, and an intense broad
band, typical for defective CeO2 nanocrystals. The high surface area mesoporous Sm3+
doped
CeO2 material having nanocrystalline framework, strong UV-visible absorption, and PL will have
important applications in catalysis, and separation technology, and the possibility of these
materials to be used as better UV blockers and nanoscale photoluminescent or nano-
optoelectronic materials. These results suggest that high surface area, mesoporous and surface
defects engineered Sm3+
doped CeO2 are very promising materials for multifunctional applications.
References
1. A. Corma, P. Atienzar, H. García and J. Y. C. Ching, Nature Mater., 2004, 3, 394.
2. Y. P. Fu, S. B. Wen and C. H. Lu, J. Am. Ceram. Soc., 2008, 91, 127.
3. Q. Liu, F. Zhao, X. Dong, C. Yang and F. Chen, J. Phys. Chem. C, 2009, 113, 17262.
4. T. Yu, B. Lim and Y. Xia, Angew. Chem., Int. Ed., 2010, 49, 4484.
5. Y. Ma, X Wang, S. Li, M.S Toprak, B. Zhu and M. Muhammed, Adv. Mater., 2010, 22, 1640.
6. A.D. Mayernick, R. Li, K.M. Dooley and M.J. Janik, J. Phys. Chem. C, 2011, 115, 24178.
7. J. Li, A. Kalamb, A.S. Al-Shihrib, Q. Sua, G. Zhonga and G. Du, Mater. Chem. Phys., 2011, 130, 1066.
8. Z. Wang, Z. Quan and J. Lin, Inorg. Chem., 2007, 46, 5237.
Chapter 4 Samarium Doped Mesoporous Ceria
132
9. S. Gupta, S.V.N.T. Kuchibhatla, M.H. Engelhard, V. Shutthanandan, P. Nachimuthu, W. Jiang, L.V. Saraf, S.
Thevuthasan and S. Prasad, Sens Actuators B., 2009, 139, 380.
10. Y. Yoshida and S Fujihara, Eur. J. Inorg. Chem., 2011, 10, 1577.
11. S. Fujihara and M. Oikawa, J. Appl. Phys., 2004, 95, 8002.
12. V.V. Ursaki, V. Lair, L. Zivkovic , M. Cassir, A. Ringuede and O. Lupan, Opt. Mater., 2012, 34, 1897.
13. J. Liu, J. Ye, P. Liu, L. Chen and M. Zhang, Mater. Lett., 2011, 65, 143.
14. E. C. C. Souza, H. F. Brito and E. N. S. Muccillo, J. Alloys Comp., 2010, 491, 460.
15. M. K. Rath, S. K. Acharya, B. H. Kim, K. T. Lee and B. G. Ahn, Mater. Lett., 2011, 65, 955.
16. K. Wang, R. Ran and Z. Shao, J. Power Sources, 2007, 170, 251.
17. R. Ran, Y. Guo, Y. Zheng, K. Wang and Z. Shao, J. Alloys Comp., 2010, 491, 271.
18. S. Hao, J. Hou, P. Aprea and T. Lv, Ind. Eng. Chem. Res., 2014, 53, 14617.
19. Y. Xu and R. Li, RSC Adv., 2015, 5, 44828.
20. B. Ksapabutr, E. Gulari and S. Wongkasemjit, Mater. Chem. Phys., 2006, 99, 318.
21. D. Ramimoghadam, M. Z. B. Hussein and Y. H. T. Yap, Int. J. Mol. Sci., 2012, 13, 13275..
22. F. Zhang, N. Du, S. Song and W. Hou, Mater. Chem. Phys., 2015, 152, 95.
23. P. W. Dunne, A. M. Carnerup, A. Węgrzyn, S. Witkowski and R. I. Walton, J. Phys. Chem. C, 2012, 116,
13435.
24. C. Tiseanu, B. Cojocaru, D. Avram, V. I. Parvulescu, A. V. V. Gonzalez and M. S. Dominguez, J. Phys. D:
Appl. Phys., 2013, 46, 275302.
25. L. Zivkovic, V. Lair, O. Lupan and A. Ringuede, Thin Solid Films., 2011, 519, 3538.
26. J. Wei, Z. Yang, H. Yang, T. Sun and Y. Yang, Cryst. Eng. Comm., 2011, 13, 4950.
27. B. Chen, Z. Zhu, J. Hong, Z. Wen, J. Ma, Y. Qiua and J. Chen, Dalton Trans., 2014, 43, 10767.
28. G. Zhang, Z. Shen, M. Liu, C. Guo, P. Sun, Z. Yuan, B. Li, D. Ding and T. Chen, J. Phys. Chem. B, 2006,
110, 25782.
29. P. Sudarsanam, K. Kuntaiah and B. M. Reddy, New J. Chem., 2014, 38, 5991.
30. M. Guo, J. Lu, Y. Wu, Y. Wang and M. Luo, Langmuir, 2011, 27, 3872.
31. W. Huang, P. Shuk and M. Greenblatt, Chem. Mater., 1997, 9, 2240.
32. E. K. Goharshadi, S. Samiee and P. Nancarrow, J. Colloid Interface Sci., 2011, 356, 473.
33. L. Zhu, Q. Li, X. D. Liu, J. Y. Li, Y. F. Zhang, J. Meng and X. Q. Cao, J. Phys. Chem. C, 2007, 111,
5898.
34. H. Li, G. Lu, Q. Dai, Y. Wang, Y. Guo and Y. Guo, ACS. Appl. Mater. & Inter., 2010, 2, 3, 838.
35. N. B. McKeown, P. M Budd, K. J. Msayib, B. S Ghanem, H. J. Kingston, C. E. Tattershall, S. Makhseed,
K. J.Reynolds and D. Fritsch, Chem. Eur. J., 2005, 11, 2610.
36. Y. Meng, D. Gu, F. Q. Zhang, Y. F. Shi, L. Cheng, D. Feng, Z. X. Wu, Z. X. Chen, Y. Wan, A. Stein and D.
Y. Zhao, Chem. Mater., 2006, 18, 4447.
37. J. G. Li, T. Ikegami and T. Mori, Acta Mater., 2004, 52, 2221.
Chapter 4 Samarium Doped Mesoporous Ceria
133
38. P. Nayak, B. B. Nayak and A. Mondal, Mater. Chem. Phys., 2011, 127, 12.
39. D. Andreescu, E. Matijevic and D. V. Goia, Colloids Surfaces A Physicochem. Eng. Asp., 2006, 291, 93.
40. L. Zhao and L. Gao, J. Mater. Chem., 2004, 14, 1001.
41. T. S. Sreeremya, K. M. Thulasi, A. Krishnan and S. Ghosh, Ind. Eng. Chem. Res., 2012, 51, 318.
42. B. Yan, H. X. Zhu, J. Nanopart. Res., 2008, 10, 1279.
43. Z. Y. Ma, C. Yang, W. Wei, W. H. Li and Y. H. Sun, J. Mol. Catal. A Chem., 2005, 227, 119.
44. S. E. Collins, J. M. Cies, E. del Rio, M. Lopez-Haro, S. Trasobares, J. J. Calvino, J. M. Pintado, and S.
Bernal, J. Phys. Chem. C, 2007, 111, 14371.
45. S. Torbrügge, M. Reichling, A. Ishiyama, S. Morita and Ó. Custance, Phys. Rev. Lett., 2007, 99, 056101.
46. Y. Namai, K. Fukui and Y. Iwasawa, J. Phys. Chem. B, 2003, 107, 11666.
47. K. Kuntaiah, P. Sudarsanam, B. M. Reddy and A. Vinu, RSC Advances, 2013, 3, 7953.
48. B. Choudhury, P. Chetri and A. Choudhury, RSC Adv., 2014, 4, 4663.
49. P. Patsalas, S. Logothetidis, L. Sygellou and S. Kennou, Phys. Rev. B., 2003, 68, 035104.
50. M. Y. Chen, X. T. Zua, X. Xiang and H. L. Zhang , Physica B., 2007, 389, 263.
51. B. M. Reddy, P. Bharali, G. Thrimurthulu, P. Saikia, L. Katta and S. E. Park, Catal. Lett., 2008, 123, 327.
52. S. Sakirzanovas, A. Katelnikovas, H. Bettentrup, A. Kareiva and T. Justel, J. Lumin., 2011, 131, 1525.
53. U. S. Sias, E. C. Moreira and E. Ribeiro, Nucl. Instrum. Methods B., 2004, 218, 405.
54. P. Ghosh, S. Sadhu, A. Patra, Phys. Chem. Chem. Phys., 2006, 8, 3342.
55. R. H. Krishna, B. M. Nagabhushana, H. Nagabhushana, N. S. Murthy, S. C. Sharma, C. Shivakumara and R.
P. S. Chakradhar, J. Phys. Chem. C, 2013, 117, 1915.
56. G. S. R. Raju, E. Pavitra, G. Nagaraju and J. S. Yu. Dalton Trans., 2015, 44, 1790.
57. Z. Qing, M. Qingyu, T. Yue, F. Xiaohui, S. Jiangting and L. Shuchen, J. Rare. Earths, 2011, 29, 815.
58. W. Luo, R. Li, and X. Chen, J. Phys. Chem. C, 2009, 113, 8772.
59. S. K. Gupta, P. S. Ghosh, N. Pathak, A. Arya and V. Natarajan, RSC Adv., 2014, 4, 29202.
60. E. D. Rosa, L. A. D. Torres, P. Salas and R.A. Rodriguez, Opt. Mater., 2005, 27, 1320.
61. S. Deshpande, S. Patil, S. VNT Kuchibhatla and S. Seal, Appl. Phys. Lett., 2005, 87, 133113.
62. A. Krishnan, T. S. Sreeremya, E. Murray, S. Ghosh, J. Colloid Interface Sci., 2013, 389, 16.
63. S. Ahmad, K. Gopalaiah, S. N. Chandrudu and R. Nagarajan, Inorg. Chem., 2014, 53, 2030.
64. S. K. Pahari, P. Pal, A. Sinhamahapatra, A. Saha, C. Santra, S. C. Ghosh, B. Chowdhury and A. B. Panda,
RSC Adv., 2015, 5, 45144.
65. A. G. M. Silva, T. S. Rodrigues, A. Dias, H. V. Fajardo, R. F. Gonçalves, M. Godinho and P. A. Robles-
Dutenhefner, Catal. Sci. Technol., 2014, 4, 814.
66. S. Chow, T. Fan, J. Ding and D. Zhang, J. Am. Ceram. Soc., 2010, 93, 40.
67. W. Y. Hernandez, O. H. Laguna, M. A. Centeno and J. A. Odriozola, J. Solid State Chem., 2011, 184, 3014.
68. X. Liu, K. Zhou, L. Wang, B. Wang and Y. Li, J. Am. Chem. Soc., 2009, 131, 3140.
69. G. Hua, L. Zhang, G. Fei and M. Fang, J. Mater. Chem., 2012, 22, 6851.
70. S. K. Meher and G. R. Rao, J. Colloid Interface Sci., 2012, 373, 46.
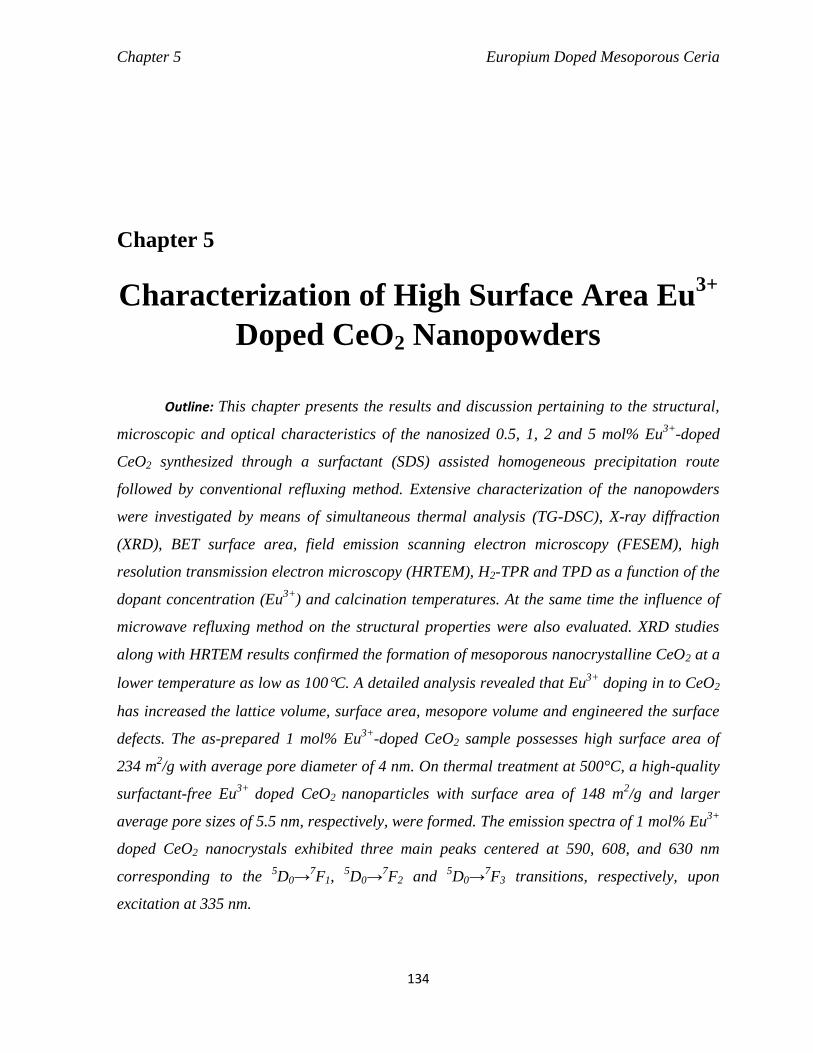
Chapter 5 Europium Doped Mesoporous Ceria
134
Chapter 5
Characterization of High Surface Area Eu3+
Doped CeO2 Nanopowders
Outline: This chapter presents the results and discussion pertaining to the structural,
microscopic and optical characteristics of the nanosized 0.5, 1, 2 and 5 mol% Eu3+
-doped
CeO2 synthesized through a surfactant (SDS) assisted homogeneous precipitation route
followed by conventional refluxing method. Extensive characterization of the nanopowders
were investigated by means of simultaneous thermal analysis (TG-DSC), X-ray diffraction
(XRD), BET surface area, field emission scanning electron microscopy (FESEM), high
resolution transmission electron microscopy (HRTEM), H2-TPR and TPD as a function of the
dopant concentration (Eu3+
) and calcination temperatures. At the same time the influence of
microwave refluxing method on the structural properties were also evaluated. XRD studies
along with HRTEM results confirmed the formation of mesoporous nanocrystalline CeO2 at a
lower temperature as low as 100C. A detailed analysis revealed that Eu3+
doping in to CeO2
has increased the lattice volume, surface area, mesopore volume and engineered the surface
defects. The as-prepared 1 mol% Eu3+
-doped CeO2 sample possesses high surface area of
234 m2/g with average pore diameter of 4 nm. On thermal treatment at 500°C, a high-quality
surfactant-free Eu3+
doped CeO2 nanoparticles with surface area of 148 m
2/g and larger
average pore sizes of 5.5 nm, respectively, were formed. The emission spectra of 1 mol% Eu3+
doped CeO2 nanocrystals exhibited three main peaks centered at 590, 608, and 630 nm
corresponding to the 5D0→
7F1,
5D0→
7F2 and
5D0→
7F3 transitions, respectively, upon
excitation at 335 nm.
Chapter 5 Europium Doped Mesoporous Ceria
135
5.1. Introduction
Rare-earth doped nanoparticles are considered as the best phosphors among other
inorganic metal oxide nanoparticles.1-3
They are widely applied for emissive displays,
fluorescent lamps, and for optoelectronic devices.4 The most attractive feature of the
luminescence spectra of rare-earth oxide is their line like emission which leads to high color
purity. The line like emission is basically due to their well shielded inter configurational f-f
transition.5 CeO2 is a well-known functional material due to its wide range of applications,
such as automotive three way catalysts,7 ultraviolet absorbers,
8 hydrogen storage materials,
9
oxygen sensors,10
optical devices11
and polishing materials.12
It also has been consider to use
in many biomedical applications due to their nontoxic nature and excellent biocompatibility.13
However, CeO2 shows weak emission characteristics as Ce4+
has no 4f electron,14
which
implies their potential use as photo luminescent host material. The luminescence properties of
weakly emitting particles could be improved by various methods. Most commonly it is to
attach a fluorescent dye, like a shell to the surface of the nanoparticle.15
Although this
approach provides reliable and consistent emission from the fluorescent tag, but it has some
demerits as (a) it suffers from the fact that the modification of the surface may lead to
illogical inactivity of the nanoparticle, (b) it also makes the material more bulky and thus
limits the penetration of the cells by the nanoparticles. Another method is doping of the parent
matrix with guest elements, which can emit upon excitation16
in the UV-visible range of the
spectrum would be a better alternative. Europium (Eu) show a strong red emission when
doped in different matrices. Kumar et al.13
reported the purpose of considering Eu as a
suitable dopant for enhancing emission in ceria as (i) it can be excited from ultraviolet to
visible light,17
(ii) the ionic radius18
of Eu3+
(0.1066 nm), being close to that of cerium (Ce)
(Ce3+
: 0.1143 nm; Ce4+
:0.097 nm), favors extensive solubility with the ceria lattice, and (iii)
it increases the trivalent state of Ce, which may further enhance the biological activity of
ceria. Although lots of research on luminescence of Eu doped metal oxides, such as alkaline,
transition, and lanthanide oxides and some sulfides, has been done but only few report are
available on doping with ceria.19,20
Earlier, Wang et al.1 have shown that doping with Eu is
not efficient in improving the photoluminescence (PL) properties of ceria. On the contrary,
few studies have shown prominent emission upon doping Eu in ceria.21
Li et al. using citrate
and polyethylene glycol, synthesized 0.1-10% Eu-doped ceria and attributed the broad band.22

Chapter 5 Europium Doped Mesoporous Ceria
136
In this study, nanocrystalline Eu-doped ceria were successfully synthesized through a
surfactant assisted method using cheaper inorganic precursors. The structural and optical
properties of Eu3+
doped CeO2 nanoparticle annealed at different temperatures were
investigated. The PL properties of Eu3+
-doped CeO2 systems are investigated with respect to
dopant concentration and annealing temperature. The mechanism of efficient energy transfer
has been correlated with the surface and defect structure.
5.2. Synthesis and characterization of Eu3+
doped CeO2 materials
The methodology for the preparation of Eu3+
doped CeO2 samples are discussed in
chapter – II. The prepared materials were characterized by TG-DSC, XRD, FESEM, BET
surface area, FTIR, UV-Vis DRS, PL, H2-TPR and TPD measurements.
5.3. Results and discussion
This section describes the results obtained from the various characterization
techniques used for studying the physical properties of mesoporous Eu3+
doped CeO2 samples
for various compositions.
5.3.1. TG-DSC profiles of as-prepared Eu3+
doped CeO2 powders
5.3.1.1. Effect of dopant concentration
In order to investigate the thermal decomposition behaviors of as-synthesized CeO2
samples doped with (a) 0.5, (b) 1, (c), 2, and (d) 5 mol% Eu2O3 prepared through
conventional refluxing method using SDS as surfactant, were subjected to TG and DSC
analyses from room temperature to 1000C in air atmosphere at a heating rate of 10C min-1
,
and the corresponding profiles are shown in Fig. 5.1 (a-d). The TG results of all the samples
can be analyzed as four steps weight loss processes, which are assigned as AB (30-150C),
BC (150-400C), CD (400-690C), and DE (690-1000C). The weight losses were correspond
to the following processes: (i) elimination of physio-adsorbed water (AB region), (ii)
decomposition of organic template (BC region) along with (iii) elimination of nitrates (CD
region), and (iv) removal of SO2 group (DE region). Total weight losses for the samples are in
the range of 19.6 to 25%, which indicate that the sample consisted of a mixture of more CeO2
than the undecomposed precursor of cerium oxyhydroxide/ hydroxide with surfactant.

Chapter 5 Europium Doped Mesoporous Ceria
137
Table 5.1 summarizes the % of mass losses obtained from TG curves of the samples.
The DSC curves of all the samples show two endothermic peaks and two exothermic peaks.
Endothermic peaks appeared ~50-70°C, and 120-150°C are associated with the
physioadsorbed water molecule. A sharp prominent exothermic peak occurring around 186°C
along with an additional peak centering at 250°C are due to the decomposition of the cerium
hydroxide to crystalline CeO2 and combustion of the template molecule, respectively. The
difference in the amount of weight loss and the decomposition temperature attributed to the
varied amounts of water or hydroxyl group and surfactant molecule in the precursor samples.
The weight loss of 2.5 to 5.5% was observed in the DE region at higher temperatures above
690C, which triggered the removal of SO2 group from precursor’s surface.
25 220 415 610 805 1000
0
1
2
3
4
En
do
Heat
Flo
w (
mW
/mg
) E
xo
E
Temperature°C
A
B
C D
64140
186
226
150
78
80
82
84
86
88
90
92
94
96
98
100
(a)
400
Weig
ht
(%)
650
A
(b)
25 220 415 610 805 1000-1
0
1
2
3
4
5
6
7
8
(b)
(a)
En
do
Heat
Flo
w (
mW
/mg
) E
xo
Temperature (°C)
B
82
84
86
88
90
92
94
96
98
100
700400
150
ED
C
B
Weig
ht
(%)
A
70 140
167
240
25 220 415 610 805 1000
0
2
4
6
8
(a)
(b)
En
do
Heat
Flo
w (
mW
/mg
) E
xo
Temperature (°C)
Weig
ht
(%)
C
74
76
78
80
82
84
86
88
90
92
94
96
98
100
E
D
C
B
A 186
690
400256
14583
150
25 220 415 610 805 1000
0
2
4
6
8
(a)
(b)
En
do
Heat
Flo
w (
mW
/mg
) E
xo
Weig
ht
(%)
Temperature (°C)
D
78
80
82
84
86
88
90
92
94
96
98
100
248
189
14585
150
400690
E
DC
B
A
Fig. 5.1. (a) TG and (b) DSC profiles of as-prepared (A) 0.5, (B) 1.0, (C) 2.0, and (D) 5
mol% Eu3+
doped CeO2 sample obtained via conventional refluxing.

Chapter 5 Europium Doped Mesoporous Ceria
138
Table 5.1. Weight loss % of Eu3+
doped CeO2 samples.
Samples TG results
Region Temperature
range (°C)
Weight
loss (%)
Total weight
loss (%)
0.5EuCeSDSasp
AB 30-150 4.5 20
BC 150-400 10.7
CD 400-650 0.6
DE 650-1000 4.2
1EuCeSDSasp
AB 30-150 6.7 17.5
BC 140-430 7.9
CD 430-690 0.5
DE 690-1000 2.4
2EuCeSDSasp
AB 30-150 4.3 25
BC 150-400 13.2
CD 400-690 2
DE 690-1000 5.5
5EuCeSDSasp
AB 30-150 3.3 20.8
BC 150-400 12.1
CD 400-690 0.5
DE 690-1000 4.9
1EuCeSDSMWasp AB 30-150 5.7 19.6
BC 150-400 10.3
CD 400-690 0.6
DE 690-1000 3
5.3.1.2. Effect of microwave refluxing
TGA/DSC analysis was also performed to understand the influence of microwave
heating during the synthesis on the thermal properties of as-synthesized 1 mol% Eu3+
doped
CeO2 synthesized using SDS followed by microwave refluxing. Fig. 5.2 represents the
TGA/DSC curves of the precursor obtained by microwave refluxing method. The sample
synthesized via microwave refluxing exhibited more weight loss of 19.6% as compared to
that of 17.4% observed in the sample via conventional refluxing and given in Table 5.1.
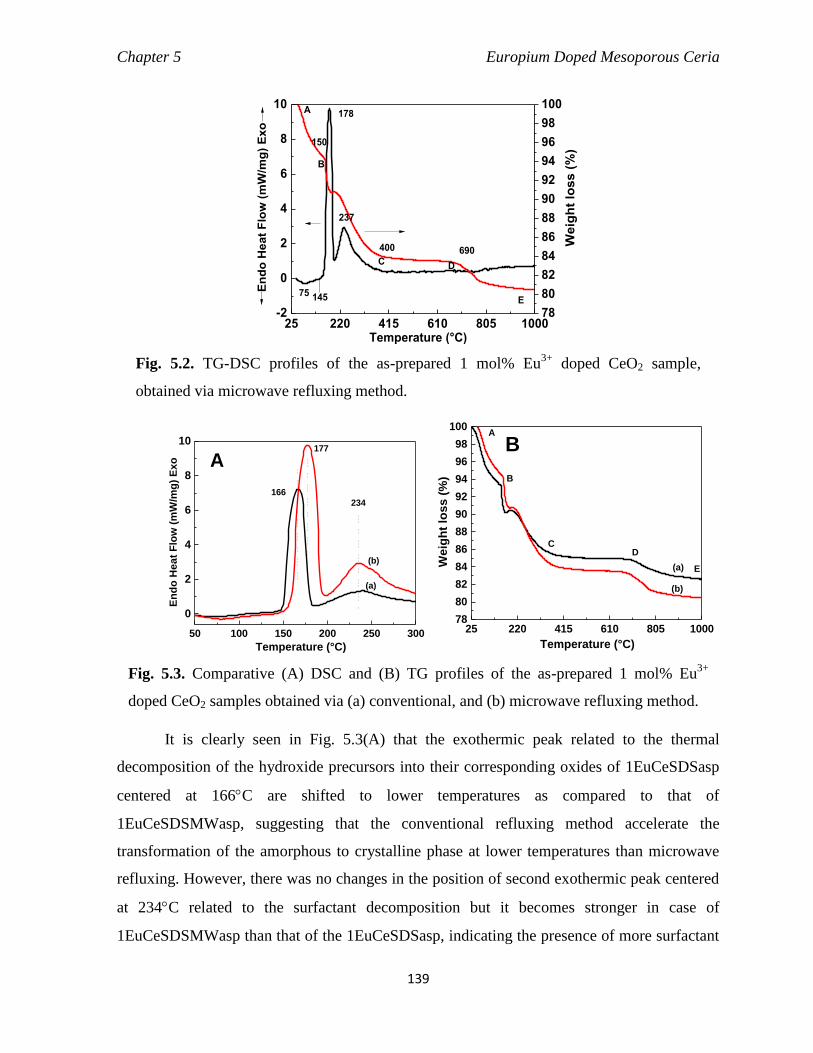
Chapter 5 Europium Doped Mesoporous Ceria
139
25 220 415 610 805 1000-2
0
2
4
6
8
10
En
do
Heat
Flo
w (
mW
/mg
) E
xo
Temperature (°C)
78
80
82
84
86
88
90
92
94
96
98
100
E
DC
B
A 178
145
690400
150
Weig
ht
loss (
%)
75
237
Fig. 5.2. TG-DSC profiles of the as-prepared 1 mol% Eu3+
doped CeO2 sample,
obtained via microwave refluxing method.
50 100 150 200 250 300
0
2
4
6
8
10
(b)
E
nd
o H
ea
t F
low
(m
W/m
g)
Ex
o
234
177
Temperature (°C)
166
(a)
A
25 220 415 610 805 100078
80
82
84
86
88
90
92
94
96
98
100
E
DC
B
(b)
Temperature (°C)
We
igh
t lo
ss
(%
)
(a)
BA
Fig. 5.3. Comparative (A) DSC and (B) TG profiles of the as-prepared 1 mol% Eu3+
doped CeO2 samples obtained via (a) conventional, and (b) microwave refluxing method.
It is clearly seen in Fig. 5.3(A) that the exothermic peak related to the thermal
decomposition of the hydroxide precursors into their corresponding oxides of 1EuCeSDSasp
centered at 166C are shifted to lower temperatures as compared to that of
1EuCeSDSMWasp, suggesting that the conventional refluxing method accelerate the
transformation of the amorphous to crystalline phase at lower temperatures than microwave
refluxing. However, there was no changes in the position of second exothermic peak centered
at 234C related to the surfactant decomposition but it becomes stronger in case of
1EuCeSDSMWasp than that of the 1EuCeSDSasp, indicating the presence of more surfactant
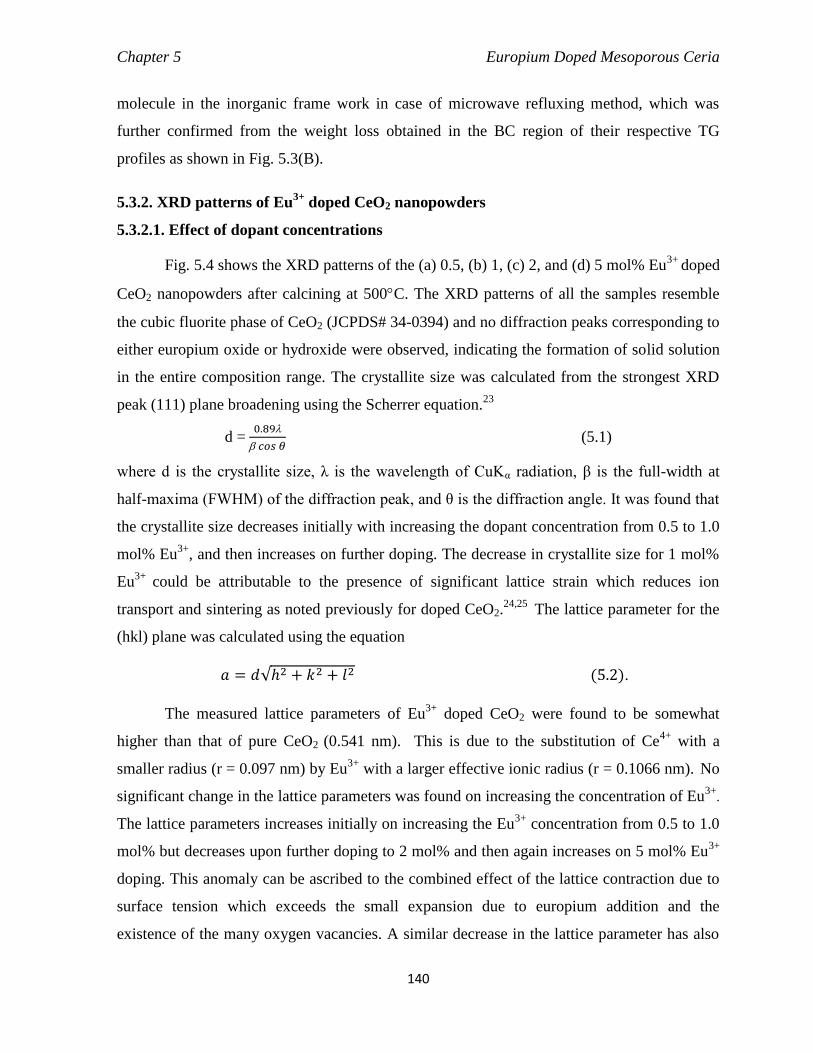
Chapter 5 Europium Doped Mesoporous Ceria
140
molecule in the inorganic frame work in case of microwave refluxing method, which was
further confirmed from the weight loss obtained in the BC region of their respective TG
profiles as shown in Fig. 5.3(B).
5.3.2. XRD patterns of Eu3+
doped CeO2 nanopowders
5.3.2.1. Effect of dopant concentrations
Fig. 5.4 shows the XRD patterns of the (a) 0.5, (b) 1, (c) 2, and (d) 5 mol% Eu3+
doped
CeO2 nanopowders after calcining at 500C. The XRD patterns of all the samples resemble
the cubic fluorite phase of CeO2 (JCPDS# 34-0394) and no diffraction peaks corresponding to
either europium oxide or hydroxide were observed, indicating the formation of solid solution
in the entire composition range. The crystallite size was calculated from the strongest XRD
peak (111) plane broadening using the Scherrer equation.23
d = 0.89
𝑐𝑜𝑠 𝜃 (5.1)
where d is the crystallite size, λ is the wavelength of CuKα radiation, β is the full-width at
half-maxima (FWHM) of the diffraction peak, and θ is the diffraction angle. It was found that
the crystallite size decreases initially with increasing the dopant concentration from 0.5 to 1.0
mol% Eu3+
, and then increases on further doping. The decrease in crystallite size for 1 mol%
Eu3+
could be attributable to the presence of significant lattice strain which reduces ion
transport and sintering as noted previously for doped CeO2.24,25
The lattice parameter for the
(hkl) plane was calculated using the equation
𝑎 = 𝑑√ℎ2 + 𝑘2 + 𝑙2 (5.2).
The measured lattice parameters of Eu3+
doped CeO2 were found to be somewhat
higher than that of pure CeO2 (0.541 nm). This is due to the substitution of Ce4+
with a
smaller radius (r = 0.097 nm) by Eu3+
with a larger effective ionic radius (r = 0.1066 nm). No
significant change in the lattice parameters was found on increasing the concentration of Eu3+
.
The lattice parameters increases initially on increasing the Eu3+
concentration from 0.5 to 1.0
mol% but decreases upon further doping to 2 mol% and then again increases on 5 mol% Eu3+
doping. This anomaly can be ascribed to the combined effect of the lattice contraction due to
surface tension which exceeds the small expansion due to europium addition and the
existence of the many oxygen vacancies. A similar decrease in the lattice parameter has also
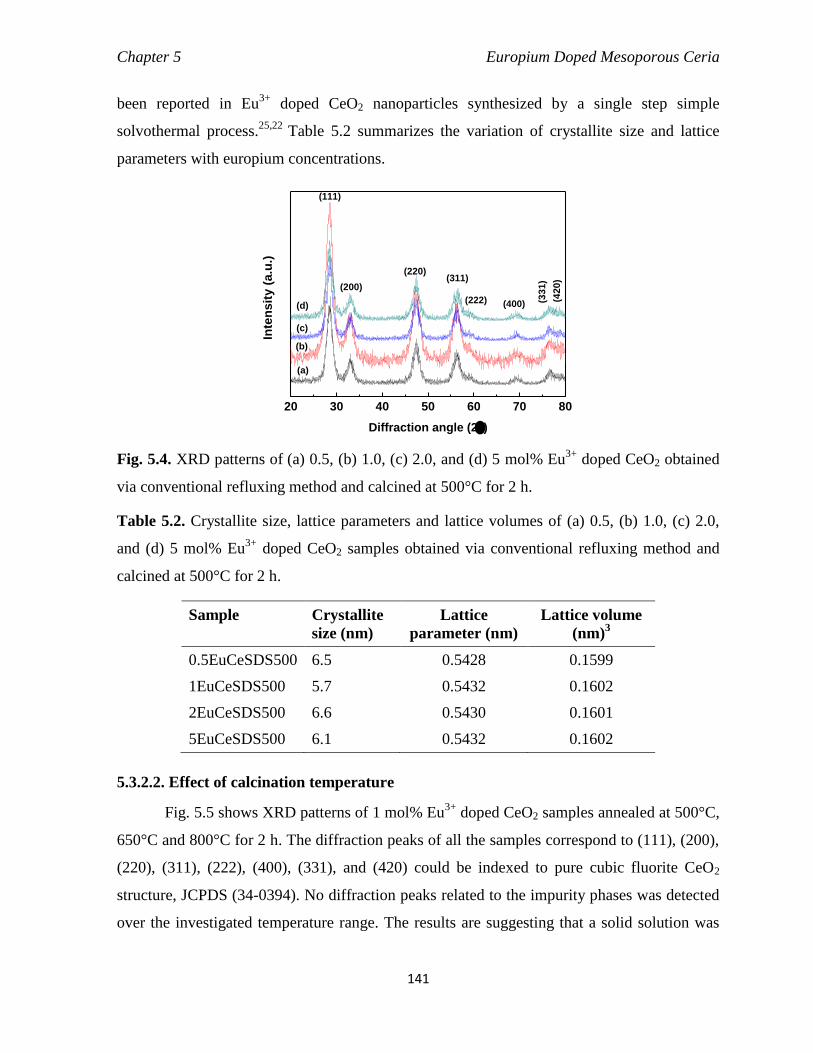
Chapter 5 Europium Doped Mesoporous Ceria
141
been reported in Eu3+
doped CeO2 nanoparticles synthesized by a single step simple
solvothermal process.25,22
Table 5.2 summarizes the variation of crystallite size and lattice
parameters with europium concentrations.
20 30 40 50 60 70 80
(d)
(c)
(b)
(42
0)
(33
1)
(400)(222)
(311)(220)
(200)
(111)
Inte
nsit
y (
a.u
.)
Diffraction angle (2)
(a)
Fig. 5.4. XRD patterns of (a) 0.5, (b) 1.0, (c) 2.0, and (d) 5 mol% Eu3+
doped CeO2 obtained
via conventional refluxing method and calcined at 500°C for 2 h.
Table 5.2. Crystallite size, lattice parameters and lattice volumes of (a) 0.5, (b) 1.0, (c) 2.0,
and (d) 5 mol% Eu3+
doped CeO2 samples obtained via conventional refluxing method and
calcined at 500°C for 2 h.
Sample Crystallite
size (nm)
Lattice
parameter (nm)
Lattice volume
(nm)3
0.5EuCeSDS500 6.5 0.5428 0.1599
1EuCeSDS500 5.7 0.5432 0.1602
2EuCeSDS500 6.6 0.5430 0.1601
5EuCeSDS500 6.1 0.5432 0.1602
5.3.2.2. Effect of calcination temperature
Fig. 5.5 shows XRD patterns of 1 mol% Eu3+
doped CeO2 samples annealed at 500°C,
650°C and 800°C for 2 h. The diffraction peaks of all the samples correspond to (111), (200),
(220), (311), (222), (400), (331), and (420) could be indexed to pure cubic fluorite CeO2
structure, JCPDS (34-0394). No diffraction peaks related to the impurity phases was detected
over the investigated temperature range. The results are suggesting that a solid solution was

Chapter 5 Europium Doped Mesoporous Ceria
142
formed and calcination did not lead to the segregation of the europium oxide phases as it
occupies in the CeO2 lattice. Crystallite size and unit cell parameters of the calcined samples
were calculated and listed in Table 5.3. On increasing the calcination temperatures, peak
intensity increases with narrowing the diffraction peaks due to the crystal growth hence the
crystallite size of 1 mol% Eu3+
doped CeO2 increases. A decrease in the lattice parameters is
observed with increasing the calcination temperatures up to 650°C, which may be ascribable
to the enhanced particle size upon calcination. According to Dhannia et al.26
upon sintering
oxygen vacancies are drastically reduced, which leads to an increase in the corresponding
grain size, as a result the lattice parameter is found to decrease with annealing. In addition
low-temperature CeO2 tends to exhibit higher lattice parameters due to the presence of defects
and impurities.26
Deshpande et al. studied the relationship between the crystallite size and
lattice parameters of the synthesized CeO2 nanoparticles.27
They pointed out that the variation
in the lattice parameter is attributed to the lattice strain induced by the introduction of Ce3+
ions due to the formation of oxygen vacancies. The increase in lattice parameters of
nanocrystalline CeO2 with decrease of particle size can also be explained in terms of grain
surface relaxation.28
Further increase of lattice parameters of Eu3+
doped CeO2 sample
calcined at 800°C may be due to the reduction of Ce4+
ion to Ce3+
. Since the radius of Ce3+
ion (0.114 nm) is larger than that of Ce4+
ion (0.097 nm), the increase of Ce3+
ion in SDC
solid solution would also lead to lattice expansion.29
20 30 40 50 60 70 80
(d)
(c)
(b)
(42
0)
(33
1)
(400)(222)
(311)
(220)
(200)
(111)
Inte
ns
ity
(a
.u.)
Diffraction angle (2)
(a)
Fig. 5.5. XRD patterns 1 mol% Eu3+
doped CeO2 obtained via conventional refluxing method
(a) as-prepared, and calcined at (b) 500°C, (c) 650°C and (d) 800°C for 2 h.
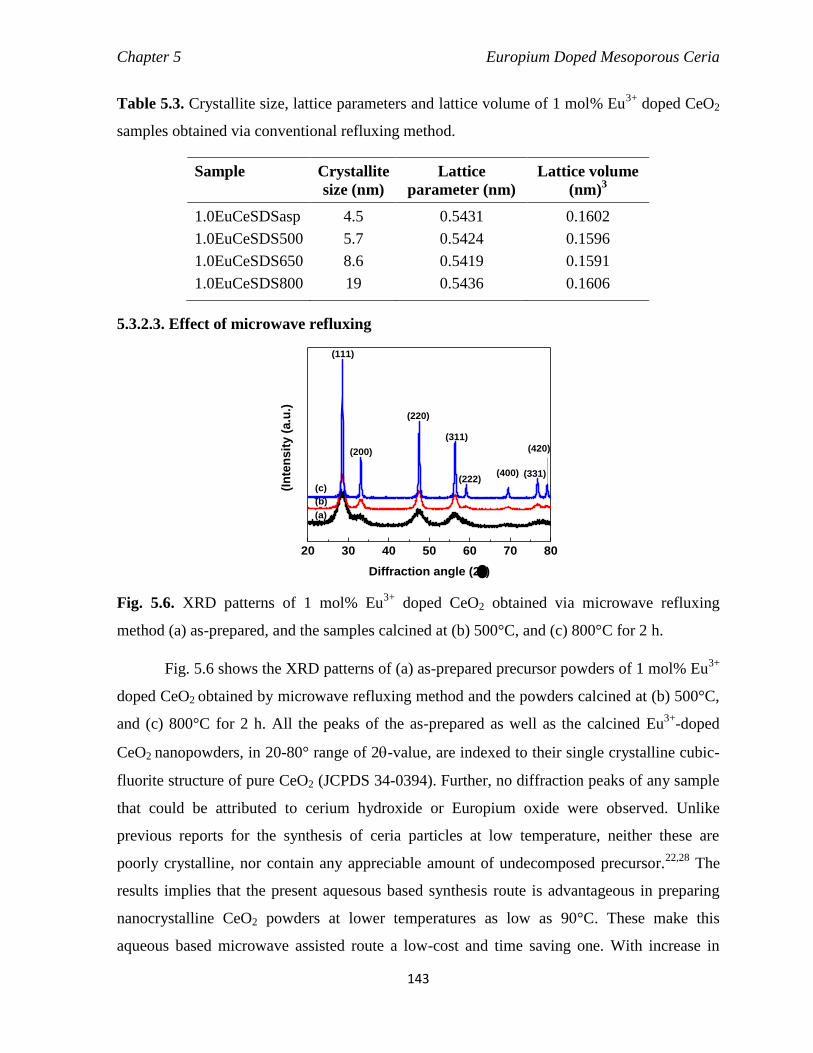
Chapter 5 Europium Doped Mesoporous Ceria
143
Table 5.3. Crystallite size, lattice parameters and lattice volume of 1 mol% Eu3+
doped CeO2
samples obtained via conventional refluxing method.
Sample Crystallite
size (nm)
Lattice
parameter (nm)
Lattice volume
(nm)3
1.0EuCeSDSasp 4.5 0.5431 0.1602
1.0EuCeSDS500 5.7 0.5424 0.1596
1.0EuCeSDS650 8.6 0.5419 0.1591
1.0EuCeSDS800 19 0.5436 0.1606
5.3.2.3. Effect of microwave refluxing
20 30 40 50 60 70 80
(c)
(b)
(420)
(331)(400)
(311)
(222)
(220)
(200)
(In
ten
sit
y (
a.u
.)
Diffraction angle (2)
(111)
(a)
Fig. 5.6. XRD patterns of 1 mol% Eu3+
doped CeO2 obtained via microwave refluxing
method (a) as-prepared, and the samples calcined at (b) 500°C, and (c) 800°C for 2 h.
Fig. 5.6 shows the XRD patterns of (a) as-prepared precursor powders of 1 mol% Eu3+
doped CeO2 obtained by microwave refluxing method and the powders calcined at (b) 500°C,
and (c) 800°C for 2 h. All the peaks of the as-prepared as well as the calcined Eu3+
-doped
CeO2 nanopowders, in 20-80° range of 2-value, are indexed to their single crystalline cubic-
fluorite structure of pure CeO2 (JCPDS 34-0394). Further, no diffraction peaks of any sample
that could be attributed to cerium hydroxide or Europium oxide were observed. Unlike
previous reports for the synthesis of ceria particles at low temperature, neither these are
poorly crystalline, nor contain any appreciable amount of undecomposed precursor.22,28
The
results implies that the present aquesous based synthesis route is advantageous in preparing
nanocrystalline CeO2 powders at lower temperatures as low as 90°C. These make this
aqueous based microwave assisted route a low-cost and time saving one. With increase in
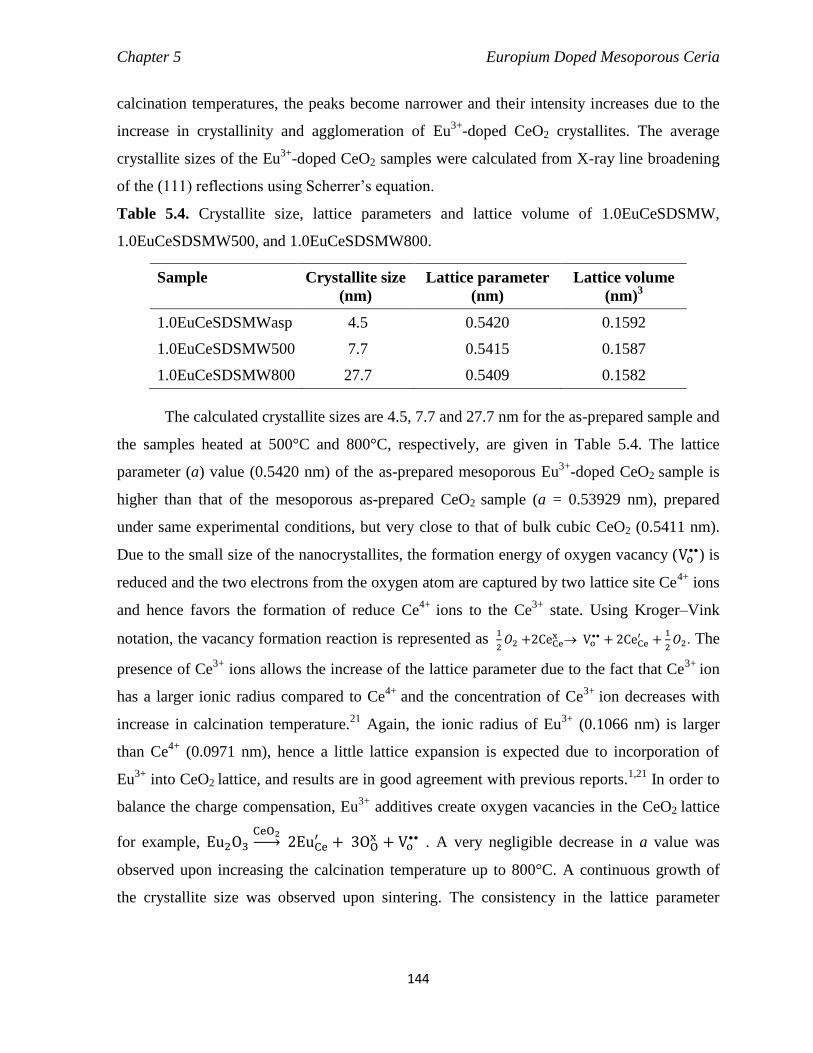
Chapter 5 Europium Doped Mesoporous Ceria
144
calcination temperatures, the peaks become narrower and their intensity increases due to the
increase in crystallinity and agglomeration of Eu3+
-doped CeO2 crystallites. The average
crystallite sizes of the Eu3+
-doped CeO2 samples were calculated from X-ray line broadening
of the (111) reflections using Scherrer’s equation.
Table 5.4. Crystallite size, lattice parameters and lattice volume of 1.0EuCeSDSMW,
1.0EuCeSDSMW500, and 1.0EuCeSDSMW800.
Sample Crystallite size
(nm)
Lattice parameter
(nm)
Lattice volume
(nm)3
1.0EuCeSDSMWasp 4.5 0.5420 0.1592
1.0EuCeSDSMW500 7.7 0.5415 0.1587
1.0EuCeSDSMW800 27.7 0.5409 0.1582
The calculated crystallite sizes are 4.5, 7.7 and 27.7 nm for the as-prepared sample and
the samples heated at 500°C and 800°C, respectively, are given in Table 5.4. The lattice
parameter (a) value (0.5420 nm) of the as-prepared mesoporous Eu3+
-doped CeO2 sample is
higher than that of the mesoporous as-prepared CeO2 sample (a = 0.53929 nm), prepared
under same experimental conditions, but very close to that of bulk cubic CeO2 (0.5411 nm).
Due to the small size of the nanocrystallites, the formation energy of oxygen vacancy (Vo••) is
reduced and the two electrons from the oxygen atom are captured by two lattice site Ce4+
ions
and hence favors the formation of reduce Ce4+
ions to the Ce3+
state. Using Kroger–Vink
notation, the vacancy formation reaction is represented as 1
2𝑂2 +2CeCe
x Vo•• + 2CeCe
′ +1
2𝑂2. The
presence of Ce3+
ions allows the increase of the lattice parameter due to the fact that Ce3+
ion
has a larger ionic radius compared to Ce4+
and the concentration of Ce3+
ion decreases with
increase in calcination temperature.21
Again, the ionic radius of Eu3+
(0.1066 nm) is larger
than Ce4+
(0.0971 nm), hence a little lattice expansion is expected due to incorporation of
Eu3+
into CeO2 lattice, and results are in good agreement with previous reports.1,21
In order to
balance the charge compensation, Eu3+
additives create oxygen vacancies in the CeO2 lattice
for example, Eu2O3CeO2→ 2EuCe
′ + 3OOx + Vo
•• . A very negligible decrease in a value was
observed upon increasing the calcination temperature up to 800°C. A continuous growth of
the crystallite size was observed upon sintering. The consistency in the lattice parameter

Chapter 5 Europium Doped Mesoporous Ceria
145
infers that the introduction of Eu3+
ions into CeO2 can stabilize the host lattice at high
temperatures and no new phase is formed.
5.3.3. N2-sorption analysis
5.3.3.1. Effect of dopant concentration
The N2 adsorption–desorption measurements have been performed to investigate the
textural properties of 0.5, 1, 2, and 5 mol% Eu3+
doped CeO2 obtained by using SDS as
surfactant via conventional refluxing method. Fig. 5.7(A) shows their respective N2
adsorption–desorption isotherms and BJH pore size distribution graphs (Fig. 5.7B). The
isotherm of all the samples, in spite of the amount of dopant content display very similar type
IV isotherm patterns with distinct hysteresis loop which is associated with mesoporous
materials. Hysteresis in the relative pressure (p/po) region of 0.1–0.8 indicates the presence of
mesopores in the samples.30
The extended hysteresis loop arises due to the uptake of N2 at
higher relative pressure (p/po > 0.9) implying the existence of macropores due to interparticle
voids.31
The calculated specific surface areas and other textural properties such as pore
diameter and pore volume are listed in Table 5.5. No obvious trend in variation of surface
area was observed with varying the dopant concentration. However, the 1 mol% Eu3+
doped
CeO2 possesses highest specific surface area of 148 m2g
-1 along with pore volume of 0.20 cm
3
g-1
as compared to the other samples. The BJH pore size distribution plots show wide
monomodal profiles with the maximum at ∼ 4 nm.
0.0 0.2 0.4 0.6 0.8 1.0
20
40
60
80
100
120
140(d)
(c)(b)
(a)
Vo
lum
e a
dso
rbed
(c
m3
/gm
)
Relative Pressure, P/P0
(A)
0 5 10 15 20 25 30 35 40 45 50
(B)(d)
(c)
(b)
V/d
(c
c/g
/nm
)
Pore diameter (nm)
(a)
Fig. 5.7. (A) N2-sorption isotherms, and (B) BJH pore size distribution curves of (a) 0.5, (b)
1.0, (c) 2.0, and (d) 5 mol% Eu3+
doped CeO2 obtained via conventional refluxing method and
calcined at 500°C for 2 h.
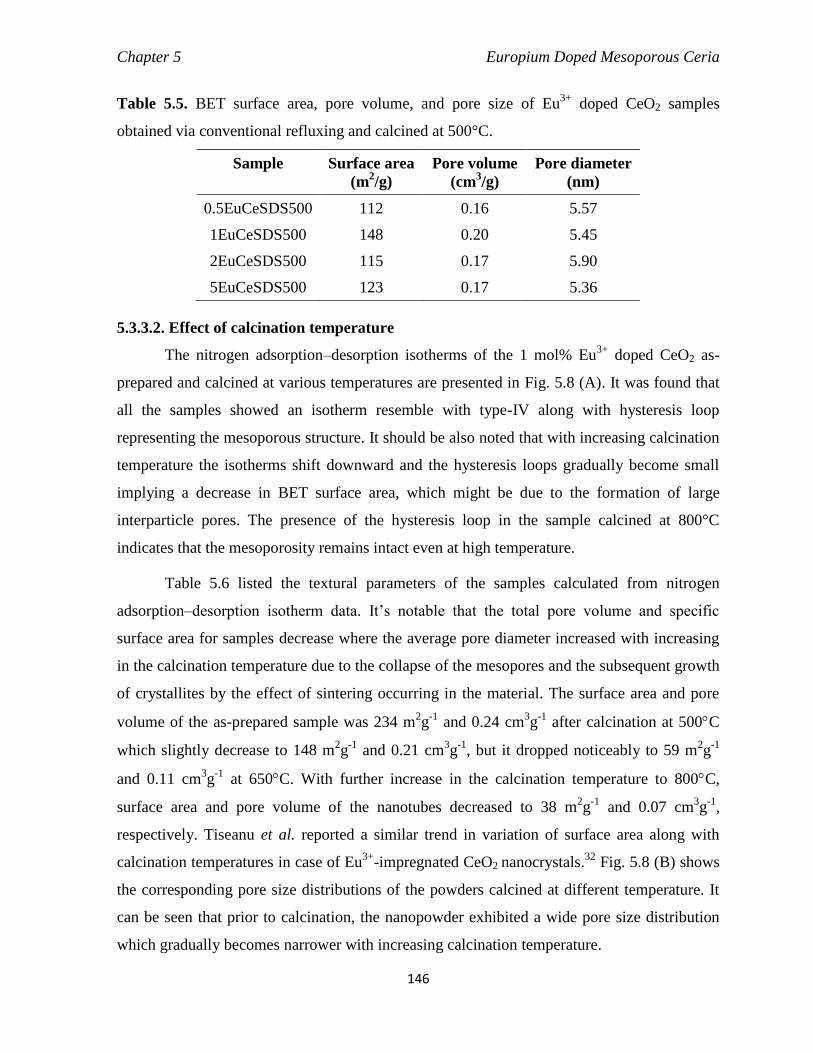
Chapter 5 Europium Doped Mesoporous Ceria
146
Table 5.5. BET surface area, pore volume, and pore size of Eu3+
doped CeO2 samples
obtained via conventional refluxing and calcined at 500°C.
Sample Surface area
(m2/g)
Pore volume
(cm3/g)
Pore diameter
(nm)
0.5EuCeSDS500 112 0.16 5.57
1EuCeSDS500 148 0.20 5.45
2EuCeSDS500 115 0.17 5.90
5EuCeSDS500 123 0.17 5.36
5.3.3.2. Effect of calcination temperature
The nitrogen adsorption–desorption isotherms of the 1 mol% Eu3+
doped CeO2 as-
prepared and calcined at various temperatures are presented in Fig. 5.8 (A). It was found that
all the samples showed an isotherm resemble with type-IV along with hysteresis loop
representing the mesoporous structure. It should be also noted that with increasing calcination
temperature the isotherms shift downward and the hysteresis loops gradually become small
implying a decrease in BET surface area, which might be due to the formation of large
interparticle pores. The presence of the hysteresis loop in the sample calcined at 800°C
indicates that the mesoporosity remains intact even at high temperature.
Table 5.6 listed the textural parameters of the samples calculated from nitrogen
adsorption–desorption isotherm data. It’s notable that the total pore volume and specific
surface area for samples decrease where the average pore diameter increased with increasing
in the calcination temperature due to the collapse of the mesopores and the subsequent growth
of crystallites by the effect of sintering occurring in the material. The surface area and pore
volume of the as-prepared sample was 234 m2g
-1 and 0.24 cm
3g
-1 after calcination at 500C
which slightly decrease to 148 m2g
-1 and 0.21 cm
3g
-1, but it dropped noticeably to 59 m
2g
-1
and 0.11 cm3g
-1 at 650C. With further increase in the calcination temperature to 800C,
surface area and pore volume of the nanotubes decreased to 38 m2g
-1 and 0.07 cm
3g
-1,
respectively. Tiseanu et al. reported a similar trend in variation of surface area along with
calcination temperatures in case of Eu3+
-impregnated CeO2 nanocrystals.32
Fig. 5.8 (B) shows
the corresponding pore size distributions of the powders calcined at different temperature. It
can be seen that prior to calcination, the nanopowder exhibited a wide pore size distribution
which gradually becomes narrower with increasing calcination temperature.

Chapter 5 Europium Doped Mesoporous Ceria
147
0.0 0.2 0.4 0.6 0.8 1.0
0
20
40
60
80
100
120
140
160
(d)
(c)
(b)V
olu
me a
dso
rbed
(c
m3
/gm
)
Relative Pressure, P/P0
(a)(A)
0 5 10 15 20 25 30 35 40 45 50
(d)
(c)
(b)
V/d
(c
c/g
/nm
))
Pore diameter (nm)
(a)
(B)
Fig. 5.8. (A) N2-sorption isotherms and the (B) BJH pore size distribution curves of 1 mol %
Eu3+
doped CeO2 samples, (a) as-prepared and calcined powders at (b) 500°C, (c) 650°C, and
(d) 800°C for 2 h, obtained via conventional refluxing.
Table 5.6. BET surface area, pore volume, and pore diameter of 1 mol% Eu3+
doped CeO2
samples calcined at different temperatures.
Sample Surface area
(m2/g)
Pore volume
(cm3/g)
Pore diameter
(nm)
1EuCeSDSasp 234 0.24 4.13
1EuCeSDS500 148 0.20 5.45
1EuCeSDS650 59 0.11 7.23
1EuCeSDS800 38 0.07 7.37
5.3.3.3. Effect of microwave refluxing
Textural properties of the N2 adsorption–desorption measurements have been
performed on representative samples of 1 mol% Eu3+
doped CeO2 prepared using SDS via
microwave refluxing method and calcined at different temperatures. The corresponding
sorption isotherms and pore size distribution curves are shown in Fig. 5.9 (A) and 5.9 (B). It
is quite noteworthy to mention that 1EuCeSDSasp or 1EuCeSDS500 exhibited higher surface
area value of 234 or 148 m2/g than that of the 1EuCeSDSMWasp (156 m
2/g) or
1EuCeSDSMW500 (70 m2/g). The sample obtained via conventional refluxing method
showed the presence of more fractions of mesopores as compared to that of microwave
refluxing method, which is reflected from the hysteresis in the relative pressure (p/po) region
of 0.1–0.8. The specific surface area, pore volume, and pore diameter of the nanopowders are
given in Table 5.7.
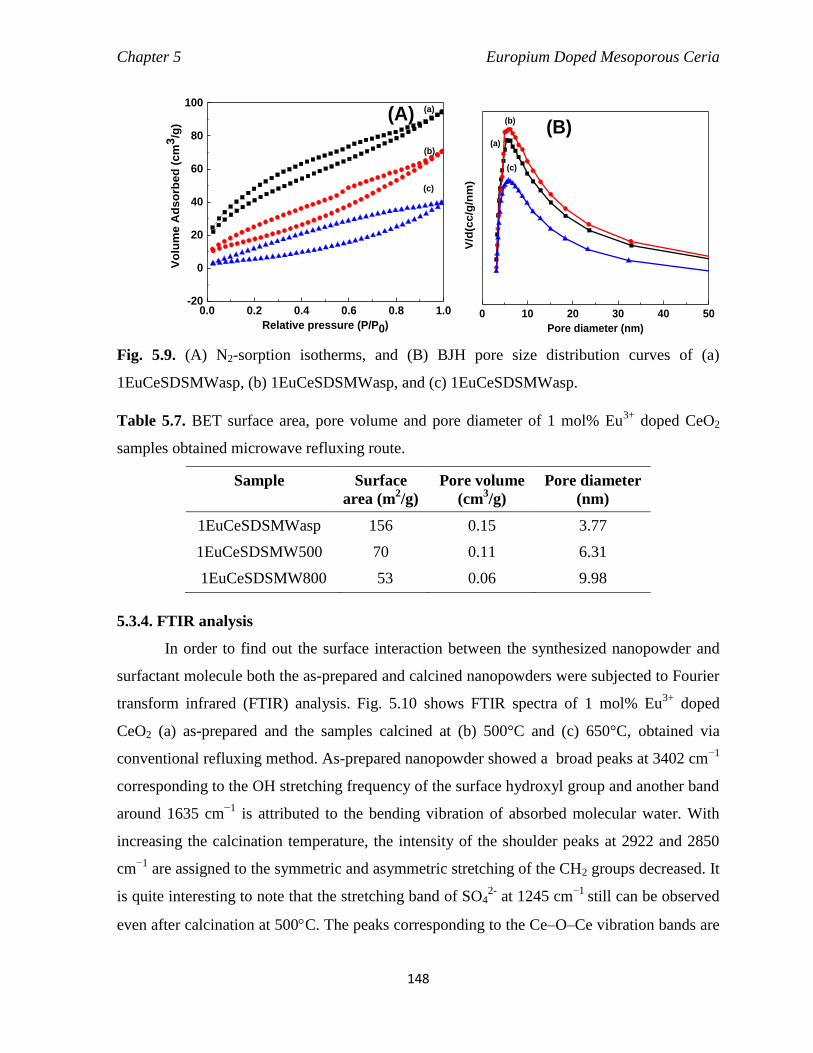
Chapter 5 Europium Doped Mesoporous Ceria
148
0.0 0.2 0.4 0.6 0.8 1.0-20
0
20
40
60
80
100
(c)
(b)
Vo
lum
e A
dso
rbed
(c
m3
/g)
Relative pressure (P/P0)
(a)(A)
0 10 20 30 40 50
(c)
(b)
V/d
(cc
/g/n
m)
Pore diameter (nm)
(a)
(B)
Fig. 5.9. (A) N2-sorption isotherms, and (B) BJH pore size distribution curves of (a)
1EuCeSDSMWasp, (b) 1EuCeSDSMWasp, and (c) 1EuCeSDSMWasp.
Table 5.7. BET surface area, pore volume and pore diameter of 1 mol% Eu3+
doped CeO2
samples obtained microwave refluxing route.
Sample Surface
area (m2/g)
Pore volume
(cm3/g)
Pore diameter
(nm)
1EuCeSDSMWasp 156 0.15 3.77
1EuCeSDSMW500 70 0.11 6.31
1EuCeSDSMW800 53 0.06 9.98
5.3.4. FTIR analysis
In order to find out the surface interaction between the synthesized nanopowder and
surfactant molecule both the as-prepared and calcined nanopowders were subjected to Fourier
transform infrared (FTIR) analysis. Fig. 5.10 shows FTIR spectra of 1 mol% Eu3+
doped
CeO2 (a) as-prepared and the samples calcined at (b) 500°C and (c) 650°C, obtained via
conventional refluxing method. As-prepared nanopowder showed a broad peaks at 3402 cm−1
corresponding to the OH stretching frequency of the surface hydroxyl group and another band
around 1635 cm−1
is attributed to the bending vibration of absorbed molecular water. With
increasing the calcination temperature, the intensity of the shoulder peaks at 2922 and 2850
cm−1
are assigned to the symmetric and asymmetric stretching of the CH2 groups decreased. It
is quite interesting to note that the stretching band of SO42-
at 1245 cm−1
still can be observed
even after calcination at 500C. The peaks corresponding to the Ce–O–Ce vibration bands are

Chapter 5 Europium Doped Mesoporous Ceria
149
observed at 1040 and 1400 cm−1
. The strong absorption band at ∼ 500 cm−1
is assigned to
Ce–O stretching band. The CeO2 prepared in the presence of SDS on the other hand shows
the typical C−H stretching (3000−2850 cm−1
) and deformation (1466 and 1380 cm−1
) bands
of the anionic surfactant. The characteristics peaks below 900 cm-1
are designated to Ce–O
stretching vibrations for both the as-prepared and calcined nanopowders.
4000 3500 3000 2500 2000 1500 1000 500
(c)
(b)
1635
2850
2922
3402
Tra
ns
mit
tan
ce
(a
.u.)
Wavelength (nm)
1400
1123
(a)
1245
500
1040
Fig. 5.10. FTIR spectra of 1 mol% Eu3+
doped CeO2 (a) as-prepared, and the samples calcined
at (b) 500°C, and (c) 650°C.
5.3.5. Microstructure analysis
5.3.5.1. FESEM images, EDAX analysis and elemental mapping
The surface morphology, size, and distribution of elements (EELS) of Eu3+
doped
CeO2 were investigated using a field emission scanning electron microscope (FESEM).
Representative FESEM images of 1 mol% Eu3+
doped CeO2 (a) asp, and the samples calcined
at various temperatures of (b) 500°C, (c) 650°C, and (c) 800°C obtained via conventional
refluxing methods are displayed in Fig. 5.11. The FESEM micrographs showed spherical-
shaped nanoparticles with diameters of about 10-20 nm. The as-prepared nanopowders consist
of agglomerated grains of irregular particles. Upon variation of the dopant concentration, no
substantial change in the particle morphologies were observed. It is important to note that the
particles were less agglomerated even after calcination at a higher temperature of 800°C. So,
the present synthesis method is important in synthesizing the Eu3+
doped CeO2 nanoparticles
with smaller particle sizes via conventional refluxing methods.

Chapter 5 Europium Doped Mesoporous Ceria
150
Fig. 5.11. FESEM micrographs of 1 mol% Eu3+
doped CeO2, (A) as-prepared, and the
samples calcined at (B) 500°C, (C) 650°C, and (D) 800°C.
Fig. 5.12 show the FESEM images of 0.5, 1.0, 2.0 and 5.0 mol% Eu3+
doped CeO2
calcined at 500°C. The particle sizes are in the range of 6 to 10 nm. To further investigate the
morphology and size of the particles, TEM/HRTEM measurements were carried out. The
result suggest that Eu3+
ions are incorporated into the crystal structure. The representative
sample 1EuceSDS500 was further subjected for elemental mapping analysis of selected area
shown in Fig 5.13, which clearly depicts the homogeneous distribution of Eu3+
ions in the
CeO2 matrix. The energy dispersive X-ray spectrum (EDS) shown in Fig. 5.14, confirms the
presence of Ce, Eu, and O in the synthesized nanopowders. The average weight percentage
(at.%) of the constituent elements of O, Ce and Eu in 5 mol% Eu3+
doped CeO2 were 15.94,
75.92 and 8.14%, respectively.
(A) (B)
(C) (D)

Chapter 5 Europium Doped Mesoporous Ceria
151
Fig. 5.12. FESEM micrographs of (A) 0.5, (B) 1.0, (C) 2.0, and (D) 5 mol% Eu3+
doped CeO2
samples obtained via conventional refluxing and calcined at 500°C.
Fig. 5.13. Elemental mapping of 1 mol% Eu3+
doped CeO2 samples, (A) overall elemental
mapping, (B) Ce, (C) Eu, and (D) O.
(A)
(A) (B)
(C) (D)
(B) (C) (D)
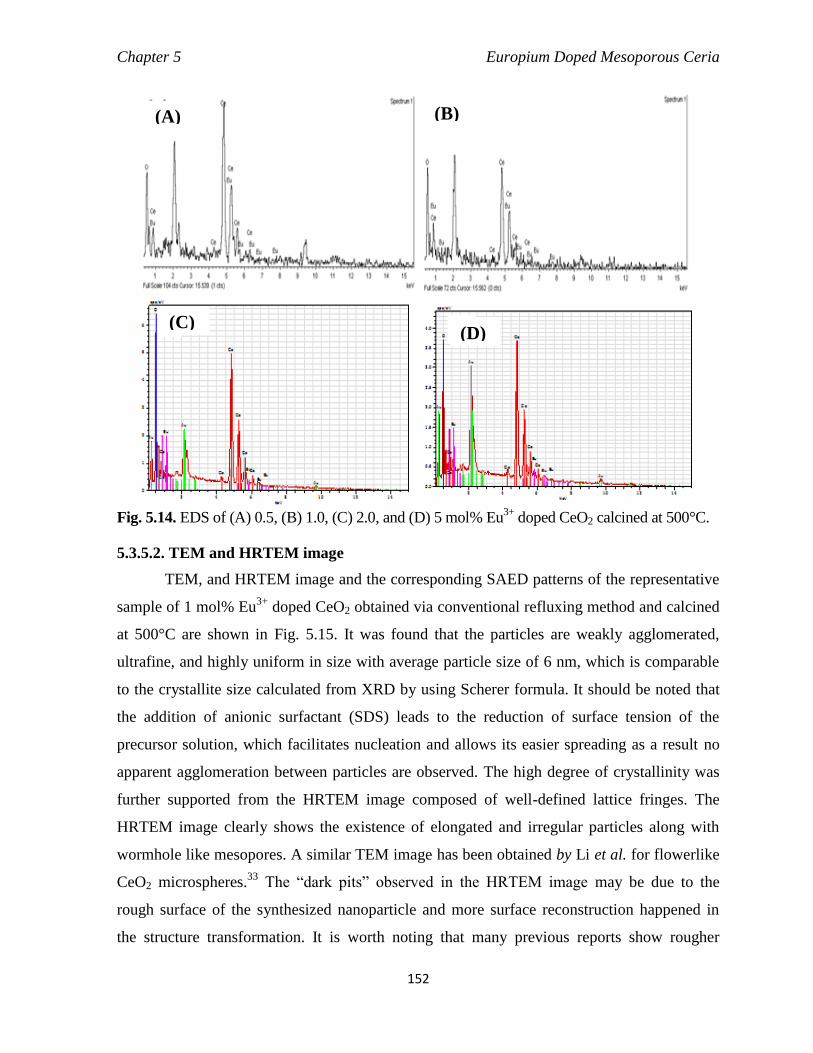
Chapter 5 Europium Doped Mesoporous Ceria
152
Fig. 5.14. EDS of (A) 0.5, (B) 1.0, (C) 2.0, and (D) 5 mol% Eu
3+ doped CeO2 calcined at 500°C.
5.3.5.2. TEM and HRTEM image
TEM, and HRTEM image and the corresponding SAED patterns of the representative
sample of 1 mol% Eu3+
doped CeO2 obtained via conventional refluxing method and calcined
at 500°C are shown in Fig. 5.15. It was found that the particles are weakly agglomerated,
ultrafine, and highly uniform in size with average particle size of 6 nm, which is comparable
to the crystallite size calculated from XRD by using Scherer formula. It should be noted that
the addition of anionic surfactant (SDS) leads to the reduction of surface tension of the
precursor solution, which facilitates nucleation and allows its easier spreading as a result no
apparent agglomeration between particles are observed. The high degree of crystallinity was
further supported from the HRTEM image composed of well-defined lattice fringes. The
HRTEM image clearly shows the existence of elongated and irregular particles along with
wormhole like mesopores. A similar TEM image has been obtained by Li et al. for flowerlike
CeO2 microspheres.33
The “dark pits” observed in the HRTEM image may be due to the
rough surface of the synthesized nanoparticle and more surface reconstruction happened in
the structure transformation. It is worth noting that many previous reports show rougher
(A) (B)
(C) (D)

Chapter 5 Europium Doped Mesoporous Ceria
153
surface of CeO2 nanostructures resulted in higher catalytic activity because of its increased
surface area.34-36
The interplanar spacing’s of the nanoparticle were calculated from the lattice
fringes about 0.30 nm, which is in good agreement with the d-value of (111) lattice plane
obtained from XRD data. This indicates the presence of the (111) exposed faces in the
materials. The shape and size of the particles are almost unchanged after calcination at 500°C.
The corresponding selected area electron diffraction (SAED) image shows a ring pattern
which indicate the highly crystalline nature of both as-synthesized and calcined nanopowder
and also could be indexed to the cubic fluorite structure of CeO2 (JCPDS #34−0394).
Fig. 5.15. (A) TEM, (B) HRTEM image, (C) lattice fringes, and corresponding (D) SAED
pattern of 1EuCeSDS500°C.
(111)
(A) (B)
(C) (D)
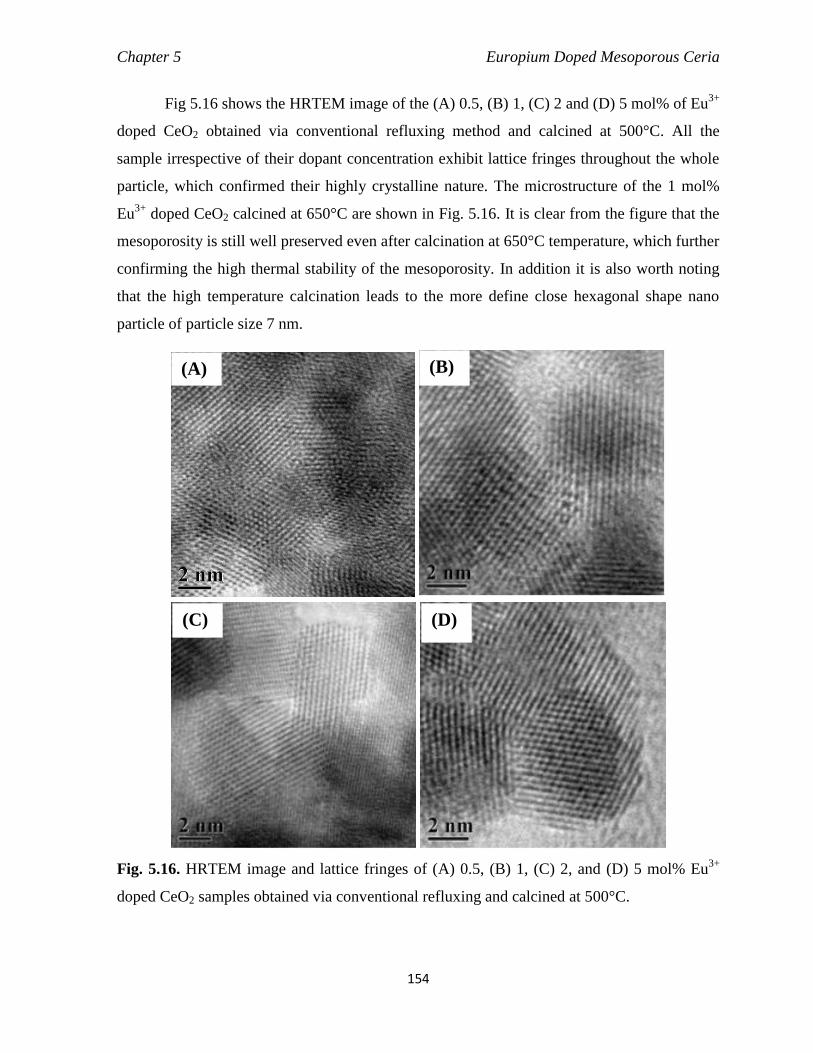
Chapter 5 Europium Doped Mesoporous Ceria
154
Fig 5.16 shows the HRTEM image of the (A) 0.5, (B) 1, (C) 2 and (D) 5 mol% of Eu3+
doped CeO2 obtained via conventional refluxing method and calcined at 500°C. All the
sample irrespective of their dopant concentration exhibit lattice fringes throughout the whole
particle, which confirmed their highly crystalline nature. The microstructure of the 1 mol%
Eu3+
doped CeO2 calcined at 650°C are shown in Fig. 5.16. It is clear from the figure that the
mesoporosity is still well preserved even after calcination at 650°C temperature, which further
confirming the high thermal stability of the mesoporosity. In addition it is also worth noting
that the high temperature calcination leads to the more define close hexagonal shape nano
particle of particle size 7 nm.
Fig. 5.16. HRTEM image and lattice fringes of (A) 0.5, (B) 1, (C) 2, and (D) 5 mol% Eu3+
doped CeO2 samples obtained via conventional refluxing and calcined at 500°C.
(A) (B)
(C) (D)
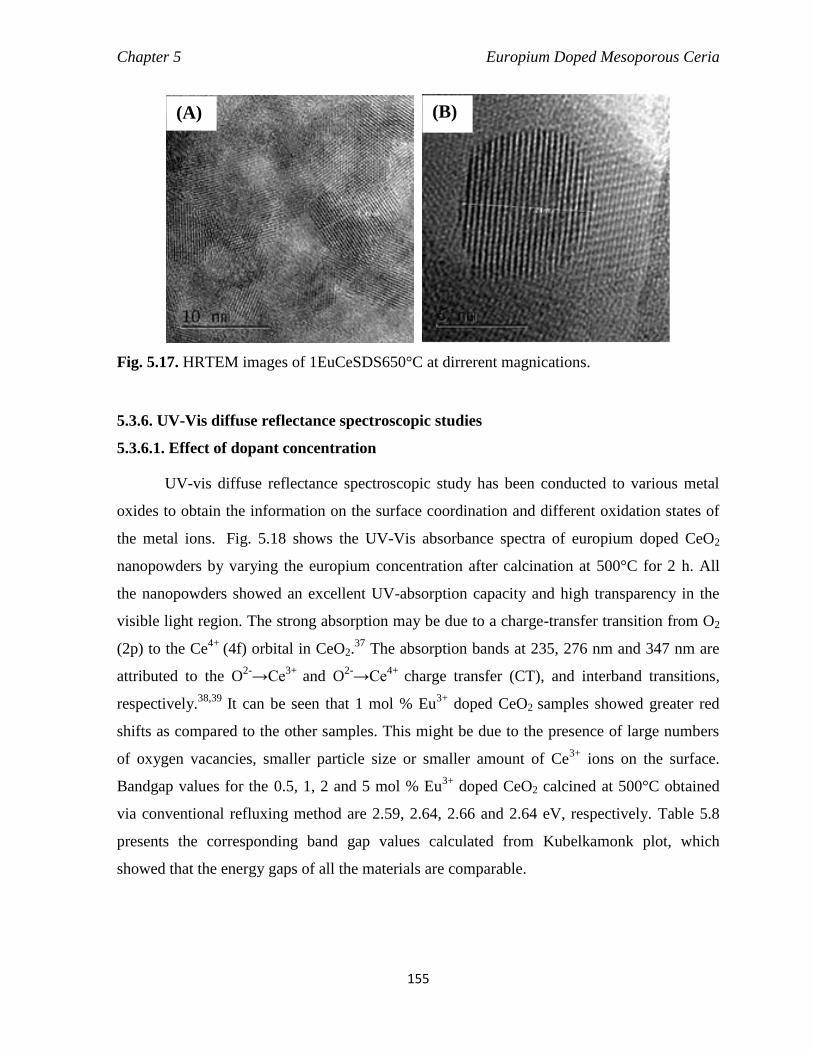
Chapter 5 Europium Doped Mesoporous Ceria
155
Fig. 5.17. HRTEM images of 1EuCeSDS650°C at dirrerent magnications.
5.3.6. UV-Vis diffuse reflectance spectroscopic studies
5.3.6.1. Effect of dopant concentration
UV-vis diffuse reflectance spectroscopic study has been conducted to various metal
oxides to obtain the information on the surface coordination and different oxidation states of
the metal ions. Fig. 5.18 shows the UV-Vis absorbance spectra of europium doped CeO2
nanopowders by varying the europium concentration after calcination at 500°C for 2 h. All
the nanopowders showed an excellent UV-absorption capacity and high transparency in the
visible light region. The strong absorption may be due to a charge-transfer transition from O2
(2p) to the Ce4+
(4f) orbital in CeO2.37
The absorption bands at 235, 276 nm and 347 nm are
attributed to the O2-
→Ce3+
and O2-
→Ce4+
charge transfer (CT), and interband transitions,
respectively.38,39 It can be seen that 1 mol % Eu
3+ doped CeO2 samples showed greater red
shifts as compared to the other samples. This might be due to the presence of large numbers
of oxygen vacancies, smaller particle size or smaller amount of Ce3+
ions on the surface.
Bandgap values for the 0.5, 1, 2 and 5 mol % Eu3+
doped CeO2 calcined at 500°C obtained
via conventional refluxing method are 2.59, 2.64, 2.66 and 2.64 eV, respectively. Table 5.8
presents the corresponding band gap values calculated from Kubelkamonk plot, which
showed that the energy gaps of all the materials are comparable.
(A) (B)

Chapter 5 Europium Doped Mesoporous Ceria
156
200 300 400 500 600 700
0.0
0.2
0.4
0.6
0.8
1.0
(d)
(c)
(b)347276
Inte
nsit
y (
a.u
.)
Wavelength (nm)
235
(a)
Fig. 5.18. UV-vis absorbance spectra of (a) 0.5, (b) 1, (c) 2 and (d) 5 mol % Eu
3+ doped CeO2
calcined at 500°C for 2 h.
5.3.6.2. Effect of calcination temperatures
200 300 400 500 600 700-0.2
0.0
0.2
0.4
0.6
0.8
1.0
1.2
1.4
1.6
1.8
2.0
(d)
(c)
(b)
328286
Inte
nsit
y (
a.u
.)
Wavelength (nm)
252
(a)
Fig. 5.19. UV-vis absorbance spectra of Eu3+
doped CeO2 powders obtained via conventional
refluxing method, (a) as-prepared and calcined at (b) 500°C (c) 650C, and (d) 800C for 2 h.
Table 5.8. Bandgap energy of (a) 0.5, (b) 1, (c) 2 and (d) 5 mol % Eu3+
doped CeO2 obtained
in conventional reflux method and calcined at 500°C for 2 h.
Eu dopant Conc. Band gap energy (eV)
0.5 2.59
1 2.64
2 2.66
5 2.64

Chapter 5 Europium Doped Mesoporous Ceria
157
UV-vis absorption spectra of the Eu3+
-doped CeO2 samples as-prepared and calcined
at different temperatures are shown in Fig. 5.19. All the samples have intense absorption in
the UV region (<400 nm), of the spectrum. The absorption of CeO2 in the UV-Vis region is
due to the charge transfer transition between O 2p and Ce 4f bonds. The UV spectrum of all
the samples exhibited three prominent peaks around 252, 286 nm and 328 nm. The absorption
band at 252 nm corresponds to Ce3+
variety present which is caused by Ce3+
← O2−
in the
system. The peak at 328 nm arises due to inter band transition in ceria, and the band at 280
nm is assigned to Ce4+
←O2−
charge transfer transitions.37
The bandgap energies were calculated to be 2.81, 2.64, 2.83, and 2.94 eV for Eu3+
doped CeO2 as-prepared, and calcined at 500, 650 and 800C, respectively. These values are
smaller than the values for the bulk CeO2 (3.08 eV),40
CeO2 microspheres (2.81 eV), and
CeO2 microflowers (3.08 eV).41
This shows that Eu3+
-doping can shift the absorption edge of
CeO2 to the visible light range and narrow the band-gap as can be seen from Table 5.9. This
may be beneficial for improving the photoabsorption performance of Eu3+
-doped CeO2 and
enhance its photocatalytic performance. The redshift of optical band gap of the cerium oxide
(CeOx) films was correlated with the increase of Ce3+
content at the grain boundary.42
Chen et
al. also observed a blueshift of band gap due to the valence transition of Ce3+
-Ce4+
induced
by thermal annealing.43
The quantum-size effect is expected to enhance the band gap of the
materials with decreasing particle size due to the higher localization of energy bands.42
The
content of Ce3+
and oxygen vacancies decreased with growth of the CeO2 nanoparticles
during annealing in air atmosphere. So, the blueshift of Eg in our Eu3+
:CeO2 samples with
increasing calcination temperatures is due to the decrease in Ce3+
content, not due to the
results of the quantum-size effect. The results also suggest that the Eu3+
doping in CeO2 has
induced higher concentration of Ce3+
.
5.3.6.3. Eu3+
doped CeO2 obtained via microwave refluxing
The 1 mol% Eu3+
doped CeO2 particles obtained via microwave refluxing method also
exhibited strong UV absorption below 400 nm. Fig. 5.20 show the UV-visible absorption
spectra of both (a) asp and calcined nanopowders at various temperatures of (b) 500, (c) 650,
and (d) 800C for 2 h. It can be seen that a similar trend of bandgap variation with calcination
temperatures were observed as in case of Eu3+
doped CeO2 obtained via conventional

Chapter 5 Europium Doped Mesoporous Ceria
158
refluxing method. It is to be noted that the absorbance spectra of 1 mol% Eu3+
doped CeO2
calcined at 500°C obtained via both conventional and normal refluxing methods exhibited red
shifts as compared to the as-prepared and other calcined samples. The bandgap energies were
2.78, 2.66, 2.69, and 2.94 eV for Eu3+
doped CeO2 as-prepared, and calcined at 500, 650 and
800C, respectively (see Table 5.9). Close similarities of the absorption spectra of 1 mol%
Eu3+
doped CeO2 samples prepared via both the conventional and microwave refluxing
methods revealed that there is no significant influence of the preparative methods on the UV-
Vis absorption properties of the samples.
200 300 400 500 600 700
0.0
0.2
0.4
0.6
0.8
1.0
1.2
1.4
1.6
1.8
(c)(d)
(b)
324284
Ab
so
rban
ce (
a.u
.)
Wavelength (nm)
250 (a)
Fig. 5.20. UV-Vis absorbance spectra of 1 mol% Eu3+
doped CeO2 powders obtained via
microwave refluxing method, (a) as-prepared and calcined at (b) 500°C, (c) 650C, and (d)
800C for 2 h.
Table 5.9. Bandgap energy of Eu3+
doped CeO2 powders obtained by conventional and
microwave refluxing methods.
Asp and calcined
samples at Band gap energy (eV) of 1mol% Eu
3+ dope CeO2
Conventional
refluxing method
Microwwave refluxing
method
Asp 2.81 2.78
500°C 2.64 2.66
650°C 2.83 2.69
800°C 2.94 2.94
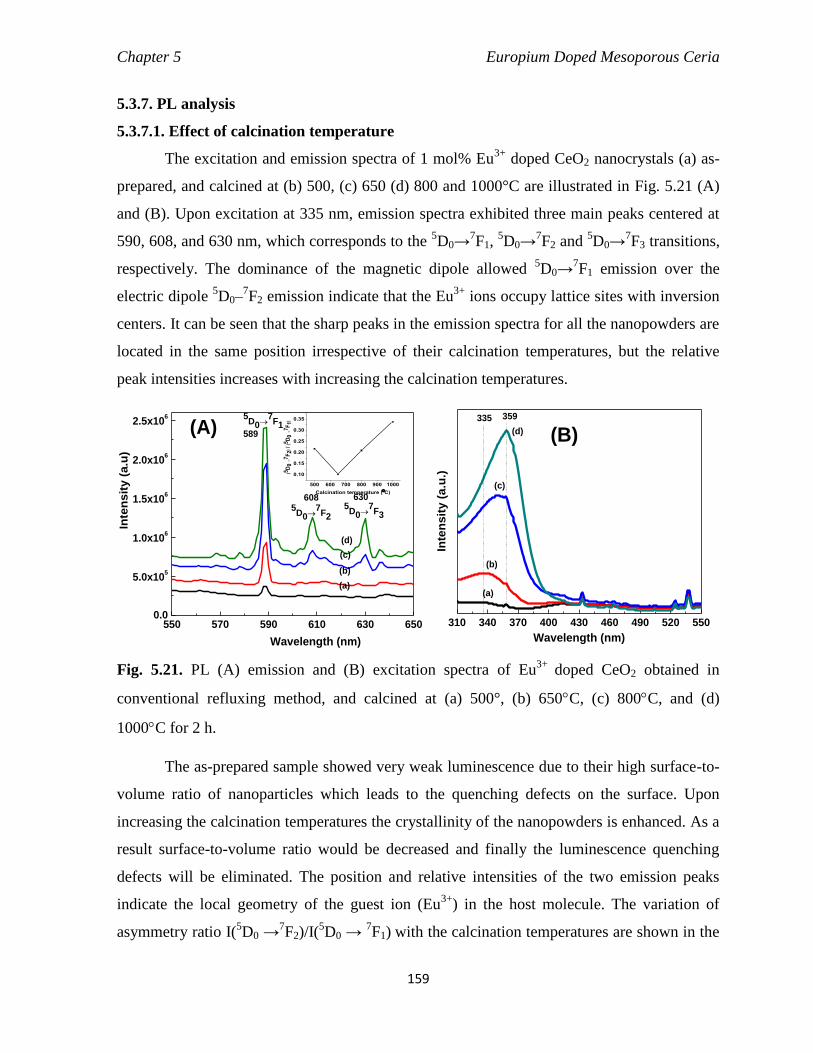
Chapter 5 Europium Doped Mesoporous Ceria
159
5.3.7. PL analysis
5.3.7.1. Effect of calcination temperature
The excitation and emission spectra of 1 mol% Eu3+
doped CeO2 nanocrystals (a) as-
prepared, and calcined at (b) 500, (c) 650 (d) 800 and 1000°C are illustrated in Fig. 5.21 (A)
and (B). Upon excitation at 335 nm, emission spectra exhibited three main peaks centered at
590, 608, and 630 nm, which corresponds to the 5D0→
7F1,
5D0→
7F2 and
5D0→
7F3 transitions,
respectively. The dominance of the magnetic dipole allowed 5D0→
7F1 emission over the
electric dipole 5D0–
7F2 emission indicate that the Eu
3+ ions occupy lattice sites with inversion
centers. It can be seen that the sharp peaks in the emission spectra for all the nanopowders are
located in the same position irrespective of their calcination temperatures, but the relative
peak intensities increases with increasing the calcination temperatures.
550 570 590 610 630 6500.0
5.0x10⁵
1.0x10⁶
1.5x10⁶
2.0x10⁶
2.5x10⁶
(d)
(c)
(b)
500 600 700 800 900 1000
0.10
0.15
0.20
0.25
0.30
0.35
(5D
0
7F
2) /
(5D
0
7F
1)
Calcination temperature (C)
5D0
7F3
5D0
7F2
630608
Inte
nsit
y (
a.u
)
Wavelength (nm)
589
5D0
7F1
(a)
(A)
310 340 370 400 430 460 490 520 550
(d)
(c)
(b)
Inte
nsit
y (
a.u
.)
Wavelength (nm)
335 359
(a)
(B)
Fig. 5.21. PL (A) emission and (B) excitation spectra of Eu3+
doped CeO2 obtained in
conventional refluxing method, and calcined at (a) 500°, (b) 650C, (c) 800C, and (d)
1000C for 2 h.
The as-prepared sample showed very weak luminescence due to their high surface-to-
volume ratio of nanoparticles which leads to the quenching defects on the surface. Upon
increasing the calcination temperatures the crystallinity of the nanopowders is enhanced. As a
result surface-to-volume ratio would be decreased and finally the luminescence quenching
defects will be eliminated. The position and relative intensities of the two emission peaks
indicate the local geometry of the guest ion (Eu3+
) in the host molecule. The variation of
asymmetry ratio I(5D0 →
7F2)/I(
5D0 →
7F1) with the calcination temperatures are shown in the

Chapter 5 Europium Doped Mesoporous Ceria
160
inset of Fig. 5.21(A). It should be noted that asymmetric ratio initially decreased upon
increasing the calcination temperatures from 500 to 650°C and then show a linear increase till
1000°C. This might be attributed to the change in symmetry of the crystal field around Eu3+
during calcination. A similar trend was found by Krishna et al. in case of Y2O3:Eu3+
nanophosphor.44
Fig. 5.21(B) shows the excitation spectra of the 1 mol% Eu3+
doped CeO2 samples
calcined at different temperatures. The excitation spectra was obtained by monitoring the
5D0→
7F1 emission peak at 589 nm. It was found that all the nanopowders showed a broad
excitation bands within 320-360 nm range, which may be arises due to the charge transfer
transition from O2−
to Ce4+
.45-48,
In addition the absorption intensity of the broad band is
increases gradually with increasing the calcining temperatures. At the same time it should be
also noted that the peak position shifts toward the higher wavelength side with calcination
temperature. This might be due to the change of local environment around the O2−
surroundings during the calcination. A similar peak shift was observed upon calcination for
Y2O3:Eu3+
nanophosphor prepared by a low temperature solution combustion method.44
5.3.7.2. Effect of dopant concentration
550 560 570 580 590 600 610 620 630 640 6500.0
5.0x10⁵
1.0x10⁶
1.5x10⁶
2.0x10⁶
2.5x10⁶
3.0x10⁶
(d)
(c)
(b)
0 1 2 3 4 50.05
0.10
0.15
0.20
0.25
0.30
0.35
0.40
0.45
0.50
(5D
0
7F
2) /
(5D
0
7F
1)
Eu3+ Concentration (mol%)
630608
Inte
nsit
y (
a.u
.)
Wavelength (nm)
589
(a)
(A)
310 340 370 400 430 460 490 520 550
(d)
(c)
(b)
Inte
ns
ity
(a
.u.)
Wavelength (nm)
(a)
B
Fig. 5.22. PL (A) emission and (B) excitation spectra of (a) 0.5, (b) 1, (c) 2, and (d) 5 mol %
Eu3+
doped CeO2 obtained via conventional refluxing method and calcined at 800°C for 2 h.
The emission spectra of 0.5%, 1.0%, 2.0% and 5%, and 10% Eu3+
doped CeO2
annealed at 800°C for 2 h were recorded upon excitation at 335 nm and shown in Fig.
5.22(A). It has been observed that the intensity of magnetic dipole transition
5D0 →
7F1
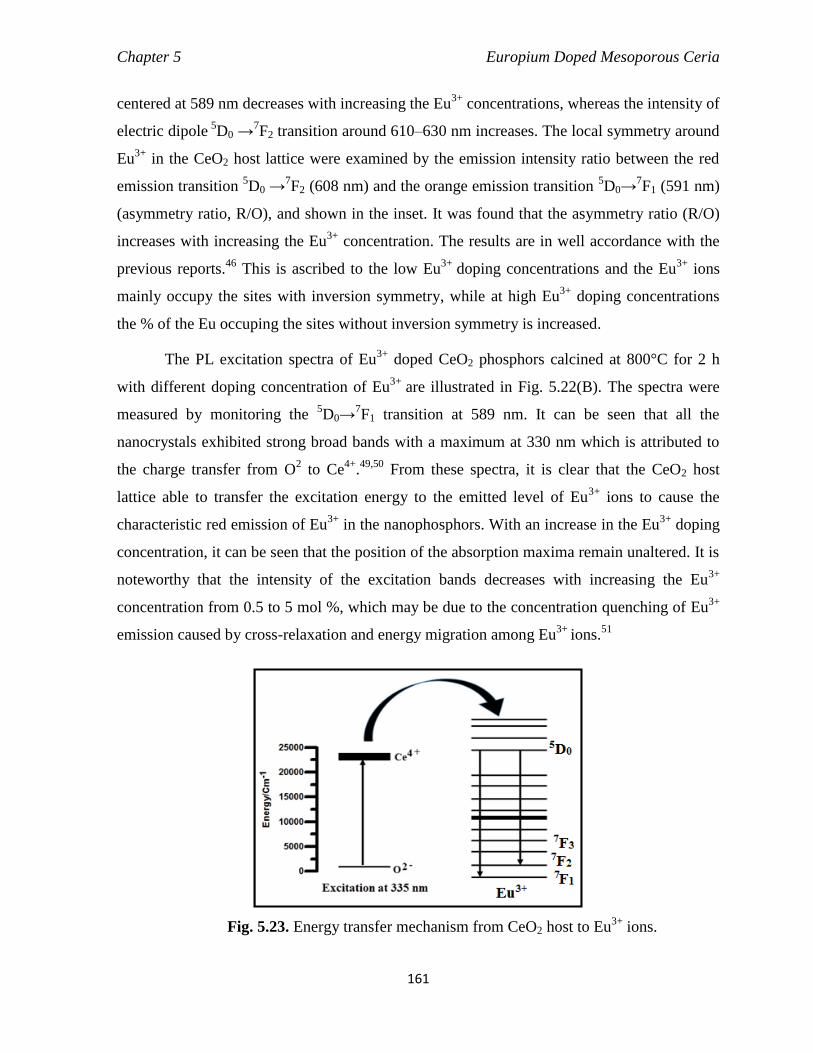
Chapter 5 Europium Doped Mesoporous Ceria
161
centered at 589 nm decreases with increasing the Eu3+
concentrations, whereas the intensity of
electric dipole 5
D0 →7F2 transition around 610–630 nm increases. The local symmetry around
Eu3+
in the CeO2 host lattice were examined by the emission intensity ratio between the red
emission transition 5D0 →
7F2 (608 nm) and the orange emission transition
5D0→
7F1 (591 nm)
(asymmetry ratio, R/O), and shown in the inset. It was found that the asymmetry ratio (R/O)
increases with increasing the Eu3+
concentration. The results are in well accordance with the
previous reports.46
This is ascribed to the low Eu3+
doping concentrations and the Eu3+
ions
mainly occupy the sites with inversion symmetry, while at high Eu3+
doping concentrations
the % of the Eu occuping the sites without inversion symmetry is increased.
The PL excitation spectra of Eu3+
doped CeO2 phosphors calcined at 800°C for 2 h
with different doping concentration of Eu3+
are illustrated in Fig. 5.22(B). The spectra were
measured by monitoring the 5D0→
7F1 transition at 589 nm. It can be seen that all the
nanocrystals exhibited strong broad bands with a maximum at 330 nm which is attributed to
the charge transfer from O2 to Ce
4+.49,50
From these spectra, it is clear that the CeO2 host
lattice able to transfer the excitation energy to the emitted level of Eu3+
ions to cause the
characteristic red emission of Eu3+
in the nanophosphors. With an increase in the Eu3+
doping
concentration, it can be seen that the position of the absorption maxima remain unaltered. It is
noteworthy that the intensity of the excitation bands decreases with increasing the Eu3+
concentration from 0.5 to 5 mol %, which may be due to the concentration quenching of Eu3+
emission caused by cross-relaxation and energy migration among Eu3+
ions.51
Fig. 5.23. Energy transfer mechanism from CeO2 host to Eu3+
ions.

Chapter 5 Europium Doped Mesoporous Ceria
162
The energy level scheme of the emissions of Eu3+
doped CeO2 nanocrystals is depicted
as Fig. 5.23. On excitation by UV light, energy is absorbed by the host molecule of CeO2 via
charge transfer transition from O2-
(2p) valence band to Ce4+
(4f). Then this energy is directly
transferred to the 4f orbitals of the guest molecule of Eu3+
. Finally the characteristic emissions
of Eu3+
are produced as a result of the population of 5D0 level.
5.3.7.3. Fluorescent microscopy images
Fig. 5.24 (A-C) Fluorescent microscope images of 1 mol% Eu3+
doped CeO2 obtained via
conventional refluxing method, and calcined at 800°C, excited at wavelengths of (A) 350 nm,
(B) 405 nm, and (C) 532 nm.
Optical properties of the representative sample of 1 mol% Eu3+
doped CeO2 obtained
via conventional refluxing method and calcined at 800°C was further investigated under a
fluorescent microscope upon exciting at various wavelengths. The fluorescent microscopy
images [Fig. 5.24 A-C] of the sample exciting at three different wavelengths of 350, 405 and
532 nm exhibits distinct color emission upon excitation at different wavelength. So, the
results indicate that the multicolored emissions from the prepared Eu3+
doped CeO2 can be
achieved by exciting the material at different wavelengths.
5.3.8. XPS analysis
The chemical compositions of nano CeO2 were verified by means of XPS analysis which
confirm the co-existence of both the oxidation states following the reactions of 4
CeO2➔2Ce2O3+O2 or Ce4+
+e-➔Ce3+
. Eu3+
doped CeO2 samples calcined at 500°C were
mounted on a carbon tape for XPS analysis and the peak positions were charge-corrected with
respect to C 1s core level as a baseline (284.6 eV). The general XPS survey scan shown in
Fig. 5.25, which revealed that no peaks of other elements except C, Ce, Eu and O were
(A) (B) (C)

Chapter 5 Europium Doped Mesoporous Ceria
163
observed. The high-resolution Ce 3d spectra of the nanopowder after deconvolution were
fitted with ten peaks which arises from three doublets resulting from the Ce4+
state designated
as u, uˈˈ uˈˈˈ, v, vˈˈ, vˈˈˈand two doublets resulting from the Ce3+
state designated as uo, uˈ, vo,
vˈ are shown in Fig. 5.25. The Ce3d photoelectron spectra are complicated because of the
hybridization involving in the final state of the Ce4f orbitals with O2p orbitals and fractional
occupancy of the valence 4f orbitals. The amount of Ce3+
were calculated from the integrated
area under the corresponding peak Ce3+
/(Ce3+
+Ce4+
) ratio. By comparing these results with
pure CeO2 shown in previous chapter, it was found that Eu3+
doping into the CeO2 host lattice
leads to the more percentage of Ce3+
. Thorat et al. reported that the concentration of Ce3+
increases linearly with Eu addition for Eu3+
doped CeO2 nanocrystals synthesized by simple
solvothermal process.52
880 890 900 910 920 930
u'''
u''
u'
u
u0
v'''
v''
v'
v
Inte
ns
ity
(a
.u.)
Binding energy (eV)
v0
Fig. 5.25. High resolution XPS spectrum of the Ce 3d core level regions for the 1 mol% Eu
3+
doped CeO2 obtained via conventional refluxing method and calcined at 500°C for 2 h.
From the XPS analysis of Eu3+
doped CeO2 nanoparticles, Kumar et al. observed that the
concentration of Ce3+
increases from 18.3% for 1 mol% Eu3+
dopant to 23.5% for 30 mol%
Eu3+
dopant and decreased with annealing temperature.13
Babu et al. also pointed out that the
concentration of Ce3+
increases on doping with Eu3+
but decreases on annealing.53
In contrast
many author has also report the decrease of the Ce3+
fraction on the surface of CeO2 upon
doping as for example Wang et al. noticed that when Eu3+
was doped in the CeO2
nanocrystals the amount of Ce3+
ion decrease on the surface which might be due to the

Chapter 5 Europium Doped Mesoporous Ceria
164
replacement of Ce3+
by trivalent Eu3+
ions.1,54
Hence, both the pure and europium doped ceria
nanopowder obtained in our synthetic route, possess a relative large amount of Ce3+
21.3 and
22.9% respectively, which might be facilitated them for chemical and catalytic applications.
525 530 535 540
531.9
Inte
nsi
ty (
a.u
.)
Binding energy (eV)
529.6
(A)
1120 1140 1160 1180
Inte
nsi
ty (
a.u
.)
Binding energy (eV)
1135
1164
(B)
Fig. 5.26. High resolution XPS spectra of the (A) O1S and (B) Eu 3d core level regions for
the 1 mol% Eu3+
doped CeO2 obtained via conventional refluxing and calcined at 500°C for 2 h.
The high resolution O1s core levels spectra derived after deconvolution by XPS
curving fitting are shown in Fig. 5.26(a). The analysis revealed that the spectrum was
decomposed into to two separated peaks. The main peak at higher binding energy centered at
529.6 eV corresponds to the lattice oxygen of the Eu3+
doped CeO2 whereas the shoulder peak
located at 531.9 eV could be attributed to surface hydroxyl species or ambient moisture.55
When Eu3+
was doped into CeO2, the XPS result of O1s spectra shows that the lattice oxygen
peak position and its broadness are considerably different than that of pure ceria as shown in
previous chapter, this can be attributed to the variation in the chemical environment of the
Ce–O bond after the addition of dopant into the host lattice. It was also notably found that the
oxygen peak at the higher binding energy for Eu doped sample was more intense than that of
the pure CeO2, which might be to its higher surface area and pore volume. The presence of
Eu3+
ions in Eu3+
doped CeO2 nanocrystals were also recognized by xps analysis and the
respective high resolution Eu 3d spectra are shown in Fig. 5.26(b). The characteristic peaks of
Eu3d3/2 and Eu3d5/2 peaks are observed correspond to the binding energy at 1107.4 and
1080.45 eV, respectively. Hence, these XPS analysis clearly confirms that europium ions in
the CeO2 lattices existed in the form of trivalent ions and no peak was observed in the region
of 1124±1 eV (Eu2+
3d5/2) and 1153±1 eV (Eu2+
3d3/2), corresponding to the Eu+2
.
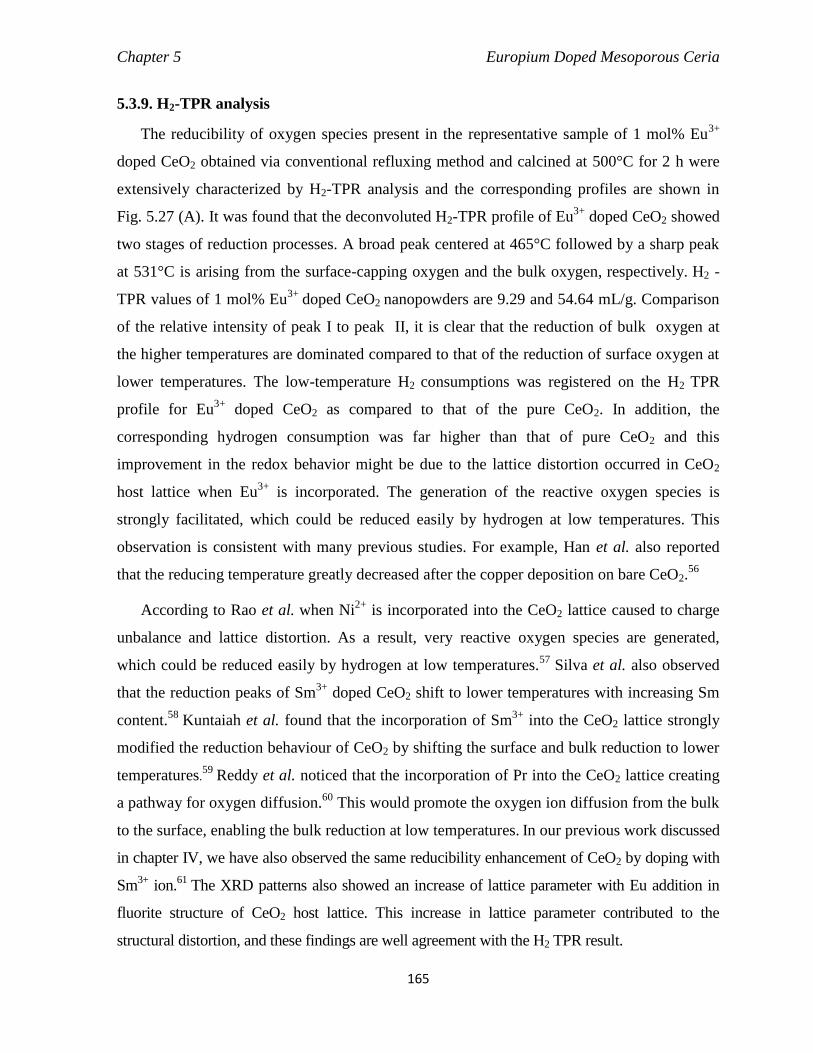
Chapter 5 Europium Doped Mesoporous Ceria
165
5.3.9. H2-TPR analysis
The reducibility of oxygen species present in the representative sample of 1 mol% Eu3+
doped CeO2 obtained via conventional refluxing method and calcined at 500°C for 2 h were
extensively characterized by H2-TPR analysis and the corresponding profiles are shown in
Fig. 5.27 (A). It was found that the deconvoluted H2-TPR profile of Eu3+
doped CeO2 showed
two stages of reduction processes. A broad peak centered at 465°C followed by a sharp peak
at 531°C is arising from the surface-capping oxygen and the bulk oxygen, respectively. H2 -
TPR values of 1 mol% Eu3+
doped CeO2 nanopowders are 9.29 and 54.64 mL/g. Comparison
of the relative intensity of peak I to peak II, it is clear that the reduction of bulk oxygen at
the higher temperatures are dominated compared to that of the reduction of surface oxygen at
lower temperatures. The low-temperature H2 consumptions was registered on the H2 TPR
profile for Eu3+
doped CeO2 as compared to that of the pure CeO2. In addition, the
corresponding hydrogen consumption was far higher than that of pure CeO2 and this
improvement in the redox behavior might be due to the lattice distortion occurred in CeO2
host lattice when Eu3+
is incorporated. The generation of the reactive oxygen species is
strongly facilitated, which could be reduced easily by hydrogen at low temperatures. This
observation is consistent with many previous studies. For example, Han et al. also reported
that the reducing temperature greatly decreased after the copper deposition on bare CeO2.56
According to Rao et al. when Ni2+
is incorporated into the CeO2 lattice caused to charge
unbalance and lattice distortion. As a result, very reactive oxygen species are generated,
which could be reduced easily by hydrogen at low temperatures.57
Silva et al. also observed
that the reduction peaks of Sm3+
doped CeO2 shift to lower temperatures with increasing Sm
content.58
Kuntaiah et al. found that the incorporation of Sm3+
into the CeO2 lattice strongly
modified the reduction behaviour of CeO2 by shifting the surface and bulk reduction to lower
temperatures.59
Reddy et al. noticed that the incorporation of Pr into the CeO2 lattice creating
a pathway for oxygen diffusion.60
This would promote the oxygen ion diffusion from the bulk
to the surface, enabling the bulk reduction at low temperatures. In our previous work discussed
in chapter IV, we have also observed the same reducibility enhancement of CeO2 by doping with
Sm3+
ion.61
The XRD patterns also showed an increase of lattice parameter with Eu addition in
fluorite structure of CeO2 host lattice. This increase in lattice parameter contributed to the
structural distortion, and these findings are well agreement with the H2 TPR result.
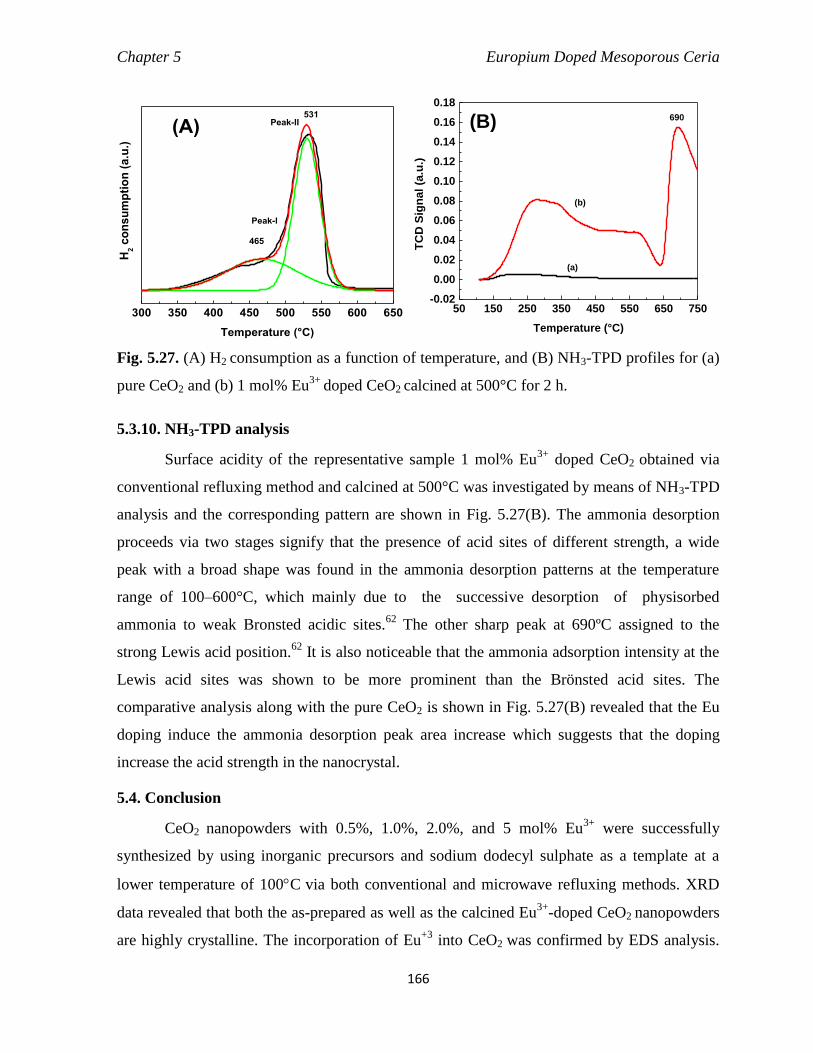
Chapter 5 Europium Doped Mesoporous Ceria
166
300 350 400 450 500 550 600 650
Peak-IIH
2 c
on
su
mp
tio
n (
a.u
.)
Temperature (°C)
465
531
(A)
Peak-I
50 150 250 350 450 550 650 750-0.02
0.00
0.02
0.04
0.06
0.08
0.10
0.12
0.14
0.16
0.18
(b)
TC
D S
ign
al
(a.u
.)
Temperature (°C)
690(B)
(a)
Fig. 5.27. (A) H2 consumption as a function of temperature, and (B) NH3-TPD profiles for (a)
pure CeO2 and (b) 1 mol% Eu3+
doped CeO2 calcined at 500°C for 2 h.
5.3.10. NH3-TPD analysis
Surface acidity of the representative sample 1 mol% Eu3+
doped CeO2 obtained via
conventional refluxing method and calcined at 500°C was investigated by means of NH3-TPD
analysis and the corresponding pattern are shown in Fig. 5.27(B). The ammonia desorption
proceeds via two stages signify that the presence of acid sites of different strength, a wide
peak with a broad shape was found in the ammonia desorption patterns at the temperature
range of 100–600°C, which mainly due to the successive desorption of physisorbed
ammonia to weak Bronsted acidic sites.62 The other sharp peak at 690ºC assigned to the
strong Lewis acid position.62
It is also noticeable that the ammonia adsorption intensity at the
Lewis acid sites was shown to be more prominent than the Brönsted acid sites. The
comparative analysis along with the pure CeO2 is shown in Fig. 5.27(B) revealed that the Eu
doping induce the ammonia desorption peak area increase which suggests that the doping
increase the acid strength in the nanocrystal.
5.4. Conclusion
CeO2 nanopowders with 0.5%, 1.0%, 2.0%, and 5 mol% Eu3+
were successfully
synthesized by using inorganic precursors and sodium dodecyl sulphate as a template at a
lower temperature of 100C via both conventional and microwave refluxing methods. XRD
data revealed that both the as-prepared as well as the calcined Eu3+
-doped CeO2 nanopowders
are highly crystalline. The incorporation of Eu+3
into CeO2 was confirmed by EDS analysis.
Chapter 5 Europium Doped Mesoporous Ceria
167
N2 sorption isotherm indicated mesoporous structure of the nanopowders with a high surface
area and narrow pore size distribution. The FESEM micrograph showed spherical-shaped
nanoparticles with diameters of about 10-20 nm. The results revealed that calcination
temperature plays a significant role to create individual particles with less agglomeration. No
substantial change in the particles morphologies and sizes were observed on varying the
dopant concentration (Eu3+
). The TEM, HRTEM image and the corresponding SAED pattern
of the representative sample were also taken. It was found that the samples are weakly
agglomerated, ultrafine, highly uniform nanocrystals with averaged particle size of 5–7 nm
which is comparable to the crystallite size calculated from XRD by using Schrerrer formula.
The high degree of crystallinity was further supported from the HRTEM images composed of
well-defined lattice fringes.
References
1. Z. Wang, Z. Quan and J. Lin. Inorg. Chem., 2007, 46, 5237.
2. G. K. Das and T. T. Y. Tan. J. Phys. Chem. C, 2008, 112, 11211.
3. M. Wang, J. L. Liu, Y. X. Zhang, W. Hou, X. L. Wu and S. K. Xu. Mater. Lett., 2009, 63, 325.
4. S. S. Chang and M. S. Jo, Ceramics International, 2007, 33, 511.
5. K. Binnemans, Chem. Rev., 2009, 109, 4283.
6. C. Sun, H. Li and L. Chen, Energy Environ. Sci., 2012, 5, 8475.
7. M. Asadullah, K. Tomishige and K. Fujimoto. Catal. Commun., 2001, 2, 63.
8. L. Qian, J Zhu, W. Du and X. Qian. Mater. Chem. Phys., 2009, 115, 835.
9. K. Sohlberg, S. T Pantelides and S. F Pennycook. J. Am. Chem. Soc., 2001, 123, 6609.
10. P. Jasinski, T. Suzuki and H. U. Anderson. Sensors Actuators B Chem., 2003, 95, 73.
11. F. Goubin, X. Rocquefelte, M. H. Whangbo, Y. Montardi, R. Brec and S. Jobic. Chem Mat., 2004, 16, 662.
12. D. G. Shchukin and R. A. Caruso, Chem Mat., 2004, 16, 2287.
13. A. Kumar, S. Babu, A. S. Karakoti, A. Schulte and S. Seal, Langmuir, 2009, 25, 10998.
14. G. Blasse and B.C. Grabmaier, Luminescent Materials, Springer, Berlin, 1994.
15. S. Patil, S. Reshetnikov, M. Haldar and S. Seal, J. Phys. Chem. C, 2007, 111, 8437.
16. L. Li, J. Tao, H. Pan, H.Chen, X. Wu, F. Zhu, X. Xu and R. Tang, J. Mater. Chem., 2008, 18, 5363.
17. J. Wu, G. L. Wang, D. Y. Jin, J. L Yuan, Y. F Guan and J. Piper, Chem. Commun., 2008, 3, 365.
18. R. D. Shannon, Acta Crystallogr. Sect. A: Cryst. Phys., Diffr., Theor. Gen. Crystallogr. 1976, A32, 751.
19. P. F. Smet, J. E. V. Haecke, F. Loncke, H. Vrielinck, F. Callens and D. Poelman, Phys. Rev. B - Condens.
Matter Mater. Phys., 2006, 74, 035207.
20. M. Nogami and Y. J. Abe, Non. Cryst. Solids, 1996, 197, 73.
21. X. H. Liu, S. J. Chen and X. D. Wang, J. Lumin., 2007, 127, 650.
Chapter 5 Europium Doped Mesoporous Ceria
168
22. L. Li, H. K. Yang, B. K. Moon, Z. Fu, C. Guo, J. H.Jeong, S. S.Yi, K. Jang and H. S. Lee, J. Phys. Chem.
C, 2009, 113, 610.
23. B. D. Cullity, Elements of X-ray Diffraction, 2nd edition, Addison-Wesley, London, 1978,
24. K. M. Ryan, J. P. McGrath, R. A. Farrell, W. M. O’Neill, C. J. Barnes and M. A. Morris,
J. Phys. Condens. Matter., 2003, 15, L49.
25. V. Thorat, T. Ghoshal, P. Carolan, J. D. Holmes,and M. A. Morris, J. Phys. Chem. C, 2014, 118, 10700.
26. T. Dhannia, S. Jayalekshmia, M.C. S. Kumar, T. P. Rao and A. C. Bose, J. Phy. Chem. Solids, 2010, 71,
1020.
27. S. Deshpande, S. Patil, S. V. N. T. Kuchibhatla and S. Seal, Appl. Phys. Lett., 2005, 87, 133113.
28. M. Leonim, R. D Maggio, S. Polizzi and P. J. Scardi, J. Am. Ceram. Soc., 2004, 87, 1133.
29. R. Tiana, F. Zhaoa, F. Chen and C. Xia, Solid State Ionics., 2011, 192, 580.
30. F. Rouquerol, J. Rouquerol and K. Sing, Academic Press, London, 1999.
31. M. Rose, W. Böhlmann, M. Sabo and S. Kaskel, Chem. Commun., 2008, 2462.
32. C. Tiseanu, V. I. Parvulescu, M. S. Dominguez and M. Boutonnet, J. Appl. Phys., 2012, 112, 013521.
33. H. Li, G. Lu, Q. Dai, Y. Wang, Y. Guo, and Y. Guo, ACS Appl. Mater. Interfaces, 2010, 2, 838.
34. X. Liang, X. Wang, Y. Zhuang, B. Xu, S. M. Kuang and Y. D. Li, J. Am. Chem. Soc., 2008, 130, 2736.
35. X. Liu, K. Zhou, L. Wang, B. Wang and Y. Li, J. Am. Chem. Soc., 2009, 131, 3140.
36. K. B. Zhou, X. Wang, X. Sun, Q. Peng and Ya. Li, J. Catal., 2005, 229, 206.
37. Y. W. Zhang, R. Si, C. S. Liao, C. H. Yan, C. X. Xiao and Y. Kou, J. Phys. Chem. B, 2003, 107, 10159.
38. A. Bensalem, F. B. Verduraz, M. Delamar and G. Bugli, Appl. Catal, A Gen., 1995, 121, 81.
39. K. N. Rao, P. Bharali, G. Thrimurthulu and B.M. Reddy, Catal. Commun., 2010, 11, 863.
40. C. Ho, J. C. Yu, T. Kwong, A. C. Mak and S. Lai, Chem. Mater., 2005, 17, 4514.
41. H. Wu and L. Wang, Catal. Commun., 2011, 12, 1374.
42. P. Patsalas, S. Logothetidis, L. Sygellou and S. Kennou, Phys. Rev. B: Condens. Matter Mater. Phys., 2003,
68, 35104.
43. M. Y. Chen, X. T. Zua, X. Xianga and H. L. Zhang, Physica B, 2007, 389, 263.
44. R. H. Krishna, B. M. Nagabhushana, H. Nagabhushana, N. S. Murthy, S. C. Sharma, C. Shivakumara, and
R. P. S. Chakradhar, J. Phys. Chem. C, 2013, 117, 1915.
45. Y. Sohn, J. Am. Ceram. Soc., 2013, 96, 3747.
46. S. Shi, M. Hossu, R. Hall and W. Chen, J. Mater. Chem., 2012, 22, 23461.
47. L. Li, S. Zhou and S. Zhang, Chem. Phys. Lett., 2008, 453, 283.
48. S. Fujihara and M. Oikawa, J. Appl. Phys. 2004, 95, 8002.
49. S. Tsunekawa, T. Fukuda and A. Kasuya, J. Appl. Phys., 2000, 87,1318
50. J. Liu, Z. Zhao, Y. S. Chen, C. M. Xu, A. J. Duan and G. Y. Jiang, Catal. Today, 2011, 175, 117.
51. A. J. Kenyon, Quantum Electron., 2002, 26, 225.
52. A. V. Thorat, T. Ghoshal, P. Carolan, J. D. Holmes and M. A. Morris, J. Phys. Chem. C, 2014, 118, 10700.
53. S. Babu, A. Schulte, and S. Seal, Appl. Phys. Lett., 2008, 92, 123112.
54. Z. L. Wang, G. R. Li, Y. N. Ou, Z. P. Feng, D. L. Qu, and Y. X. Tong, J. Phys. Chem. C, 2011, 115, 351.
Chapter 5 Europium Doped Mesoporous Ceria
169
55. E. Abiaad, R. Bechara, J. Grimblot and A. Aboukais, Chem. Mater., 1993, 5, 793.
56. J. Han, H. J. Kim, S.Yoon and H. Lee, J. Mol. Catal. A: Chemical., 2011, 335, 82.
57. P. V. R. Rao, V. P. Kumar, G. S. Rao and K. V. R. Chary, Catal. Sci. Technol., 2012, 2, 1665.
58. A. G. M. Silva, T. S. Rodrigues, A. Dias, H. V. Fajardo, R. F. Gonçalves, M. Godinhob and P. A. R.
Dutenhefner, Catal. Sci. Technol., 2014, 4, 814.
59. K. Kuntaiah, P. Sudarsanam, B. M. Reddy and A. Vinu, RSC Adv., 2013, 3, 7953.
60. B. M. Reddy, G. Thrimurthulu, L. Katta, Y. Yamada and S.E. Park, J. Phys. Chem. C., 2009,113,15882.
61. B. Mandal, A. Mondal, S. S. Ray and A. Kundu, Dalton Trans., 2016, 45, 1679.
62. S. K. Mehera, M. Cargnello, H. Troiani, T. Montini, G. R. Rao and P. Fornasiero, Appl. Catal. B Environ.,
203, 130–131, 121.

Chapter 6 Applications
170
Chapter 6
Applications of Pure and Doped CeO2
Nanopowders for Environmental
Remediation
Outline: This chapter examines an efficient adsorption process of the prepared high surface
area mesoporous samaria doped ceria (CeO2:Sm3+
) nanopowders for the removal of Cr(VI) ions from
aqueous solutions. The effects of contact time, initial sorbate concentration, pH and dose of adsorbent
on Cr(VI) adsorption were studied to optimize the conditions for maximum adsorption. The kinetics of
the adsorption has been studied. Both Langmuir and Freundlich models were fitted well with the
adsoption data. The mesoporous CeO2:Sm3+
are demonstrated to be effective materials for removing
toxic Cr(VI) ions from aqueous solutions. In addition,CeO2:Sm3+
nanopowders were also successfully
used as remarkably efficient new photocatalysts for degradation of a representative azo dye Acid
Orange 7 (AO7) in aqueous medium under natural sunlight without addition of any external reagents
like peroxides, acid or base. The effects of calcination temperature, pH of the medium, catalyst dosage
and irradiation time on the decolorization of AO7 were investigated and discussed in this chapter.
Sm3+
doping in CeO2 narrowed the band gap and significantly enhanced the photocatalytic
degradation of the azo dye. The photocatalytic degradation of AO7 is also investigated by using
certain radical scavengers and the results suggest that under solar-light irradiation predominantly
positive holes and super oxide radicals (O2• −
) act as the active species in the degradation process. We
have also monitored the anti-oxidation performances with H2O2 of mesoporous pure CeO2 and defect
engineered Sm3+
doped CeO2. To evaluate the autocatalytic activity of the prepared mesoporous Sm3+
doped CeO2, we have carried out UV-visible transmission spectroscopic studies both in the absence
and in the presence of H2O2 (an oxidant). Our results suggest these materials developed here are
promising alternative solar light sensitive photocatalyst and also appears to be potential candidates
for biomedical (antioxidant) applications.

Chapter 6 Applications
171
6.1. Effective adsorption of hazardous Cr(VI) ions in aqueous environment
6.1.1. Introduction
Inorganic heavy metal ions and organic dyes removal have attracted great research
attention due to their long term environmental toxicity and health hazard. Among heavy metal
contaminants, chromium has been a major focus in wastewater management. Large quantities
of chromium are discharged into the environment from a variety of industries such as
electroplating, steel fabrication, paints and pigments, mining, leather tanning, textile dyeing,
aluminum conversion coating operations, plants producing industrial inorganic chemicals and
wood treatment units. Among three oxidation states of chromium [Cr(II), Cr(III) and Cr(VI)]
in nature, only the last two species are stable.1,2
Cr(VI) is known to be 500 times more toxic,
mutagenic and carcinogenic than Cr(III) due to its solubility in water almost in the whole pH
range and its larger mobility than that of Cr(III).3,4
Many diseases such as epigastric pain,
nausea, vomiting, severe diarrhea, corrosion of skin, respiratory tract and lungs carcinoma
may causes from Cr(VI).5-8
Its toxicity also include cancer as well as kidney, liver and gastric
damages.9 Due to environmental concern, discharge limits of Cr(VI) have been investigated
by most industrial countries. The guideline for drinking water prescribed by the US
environmental protection agency for Cr(VI) is 100 µg/L.10
Conventional methods applied for
Cr(VI) removal are mainly chemical precipitation, oxidation/ reduction, filtration, ion
exchange, membrane separation and adsorption.11
Chemical precipitation produces great
amounts of mud, whilst ion exchangers and membrane separations are relatively of very high
cost.11,12
Adsorption is the most effective and versatile technique for removing chromium
owing to its advantages, such as availability of varieties of adsorbent materials with high
efficiency at a relatively lower cost.13
Although activated carbon is one of the most popular
adsorbents for removal of metal ions,11,13
but enormous attention has been given towards
achieving higher removal efficiencies with much cheaper and abundant materials. The
development of new and more effective tailor-made adsorbents has become essential to suit
these demanding applications.
Due to their high surface area and porosity nanoporous inorganic oxide based
adsorbents like magnetic MCM-41, ZrO2, CeO2, etc., have been used for adsorption and
removal of toxic heavy metal Cr(VI) from aqueous solutions. CeO2 is one of the most

Chapter 6 Applications
172
abundant and cost effective among rare earth metal oxides. CeO2 possesses the lowest
solubility against acid among the rare earth metal oxides and can be regenerated chemically
with simultaneous quantitative recovery of the adsorbate material. The larger surface area of
hetero structured CeO2 may explain both higher removal capacities and faster adsorption rate.
In particular, porous CeO2 nanostructure enhances the spatial dispersion, which results in not
only higher surface area but also facile mass transportation of molecules to the active sites. In
many environmental remediation applications, CeO2 had demonstrated a high adsorption
capacity for hazardous anions, such as fluoride,14
bichromate,15,16
and arsenate.17,18
Recently, tremendous efforts have been focused on the excellent Cr(VI) ions removal
capacities of CeO2. Xiao et al.16
reported maximum Cr(VI) adsorption capacity of 6.76 mgg-1
by the hierarchical CeO2 nanocrystal microspheres with surface area of 65 m2g
-1, prepared via
a nonaqueous sol-gel method by reacting cerium nitrate hydrate with benzyl alcohol at 120°C.
But the removal efficiency of these microspheres was not affected by the pH value. Recently,
Zhong et al.17
also reported the removal of toxic ions from water with higher removal capacity
than bulk materials by flowerlike CeO2. However, their outstanding adsorption performance
could only be exhibited in case of the low pH value (ca. pH 3). CeO2 hollow nanospheres with
a surface area of 72 m2g
-1 synthesized by a template-free microwave-assisted hydrothermal
method showed an excellent adsorption capacity for Cr(VI) of 15.4 mg.g-1
.18
It can be seen
from the previous reports that CeO2 has been used as a good adsorbent for Cr(VI), however,
there are only limited reports on its Cr(VI) removal effect and most of them possess lower
surface area.16,17
Introduction of dopants in to the CeO2 lattice enhances the adsorption capacity of the
material.19,20
Copper containing ceria adsorbents have also been developed in recent years for
the removal of H2S and SOx from flue gas, natural gas and coal derived gas.19
Li and
Stephanopoulos21
stated that the CuO-CeO2 system, containing equal molar parts of CuO and
CeO2, is efficient sorbent for high temperature gas desulfurization. Mayernick et al.22
reported
that the addition of La3+
and Tb3+
to CeO2 results in the presence of stoichiometric oxygen
vacancies and also lowers the energy to form additional oxygen vacancies (reduction of Ce4+
to Ce3+
) hence enhance the sulfur adsorption process. Oxygen vacancies may serve as active
sites for surface adsorption and dissociation of H2S. Furthermore, Lim et al.23
revealed that
Sm-doped CeO2 (SDC) coated Ni/YSZ may serve as a more effective sulphur adsorbent than
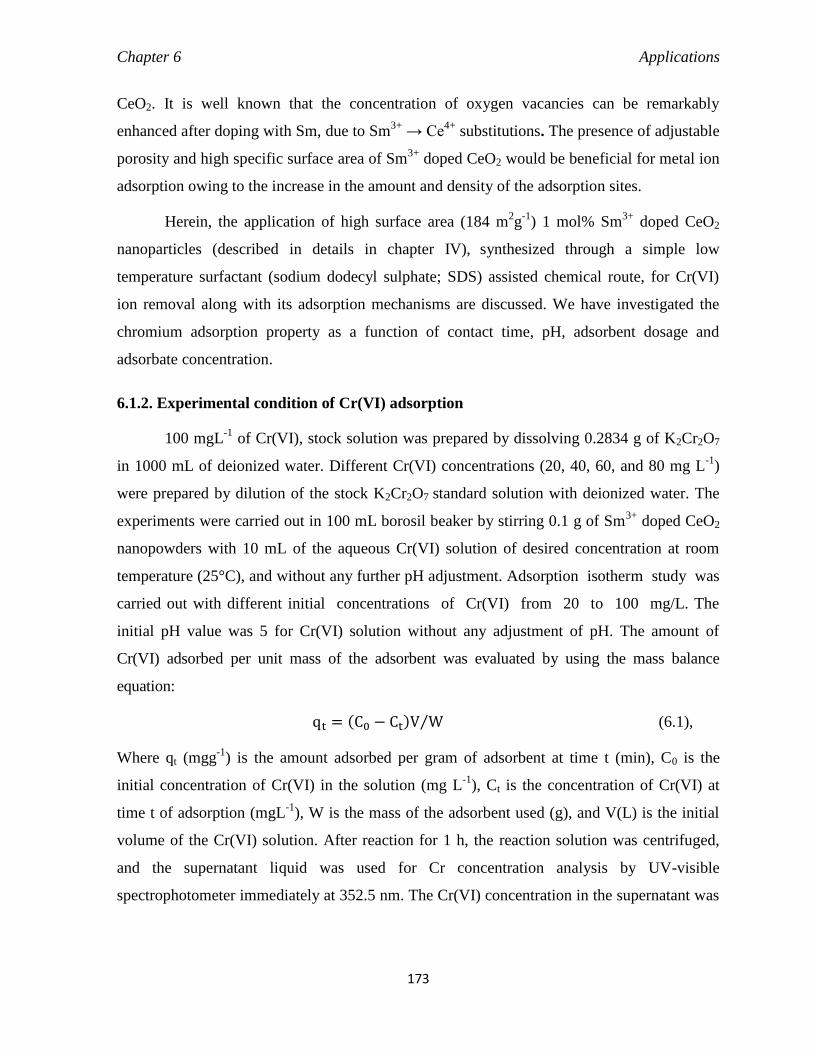
Chapter 6 Applications
173
CeO2. It is well known that the concentration of oxygen vacancies can be remarkably
enhanced after doping with Sm, due to Sm3+
→ Ce4+
substitutions. The presence of adjustable
porosity and high specific surface area of Sm3+
doped CeO2 would be beneficial for metal ion
adsorption owing to the increase in the amount and density of the adsorption sites.
Herein, the application of high surface area (184 m2g
-1) 1 mol% Sm
3+ doped CeO2
nanoparticles (described in details in chapter IV), synthesized through a simple low
temperature surfactant (sodium dodecyl sulphate; SDS) assisted chemical route, for Cr(VI)
ion removal along with its adsorption mechanisms are discussed. We have investigated the
chromium adsorption property as a function of contact time, pH, adsorbent dosage and
adsorbate concentration.
6.1.2. Experimental condition of Cr(VI) adsorption
100 mgL-1
of Cr(VI), stock solution was prepared by dissolving 0.2834 g of K2Cr2O7
in 1000 mL of deionized water. Different Cr(VI) concentrations (20, 40, 60, and 80 mg L-1
)
were prepared by dilution of the stock K2Cr2O7 standard solution with deionized water. The
experiments were carried out in 100 mL borosil beaker by stirring 0.1 g of Sm3+
doped CeO2
nanopowders with 10 mL of the aqueous Cr(VI) solution of desired concentration at room
temperature (25°C), and without any further pH adjustment. Adsorption isotherm study was
carried out with different initial concentrations of Cr(VI) from 20 to 100 mg/L. The
initial pH value was 5 for Cr(VI) solution without any adjustment of pH. The amount of
Cr(VI) adsorbed per unit mass of the adsorbent was evaluated by using the mass balance
equation:
qt = (C0 − Ct)V W⁄ (6.1),
Where qt (mgg-1
) is the amount adsorbed per gram of adsorbent at time t (min), C0 is the
initial concentration of Cr(VI) in the solution (mg L-1
), Ct is the concentration of Cr(VI) at
time t of adsorption (mgL-1
), W is the mass of the adsorbent used (g), and V(L) is the initial
volume of the Cr(VI) solution. After reaction for 1 h, the reaction solution was centrifuged,
and the supernatant liquid was used for Cr concentration analysis by UV-visible
spectrophotometer immediately at 352.5 nm. The Cr(VI) concentration in the supernatant was
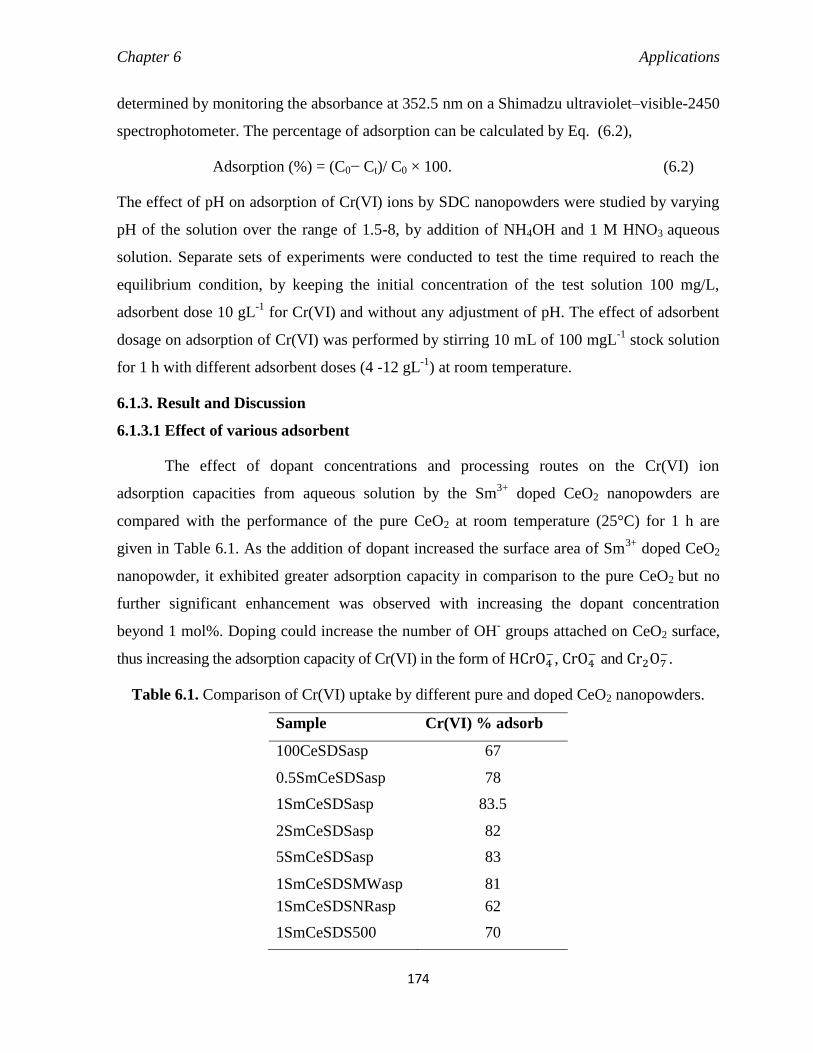
Chapter 6 Applications
174
determined by monitoring the absorbance at 352.5 nm on a Shimadzu ultraviolet–visible-2450
spectrophotometer. The percentage of adsorption can be calculated by Eq. (6.2),
Adsorption (%) = (C0− Ct)/ C0 × 100. (6.2)
The effect of pH on adsorption of Cr(VI) ions by SDC nanopowders were studied by varying
pH of the solution over the range of 1.5-8, by addition of NH4OH and 1 M HNO3 aqueous
solution. Separate sets of experiments were conducted to test the time required to reach the
equilibrium condition, by keeping the initial concentration of the test solution 100 mg/L,
adsorbent dose 10 gL-1
for Cr(VI) and without any adjustment of pH. The effect of adsorbent
dosage on adsorption of Cr(VI) was performed by stirring 10 mL of 100 mgL-1
stock solution
for 1 h with different adsorbent doses (4 -12 gL-1
) at room temperature.
6.1.3. Result and Discussion
6.1.3.1 Effect of various adsorbent
The effect of dopant concentrations and processing routes on the Cr(VI) ion
adsorption capacities from aqueous solution by the Sm3+
doped CeO2 nanopowders are
compared with the performance of the pure CeO2 at room temperature (25°C) for 1 h are
given in Table 6.1. As the addition of dopant increased the surface area of Sm3+
doped CeO2
nanopowder, it exhibited greater adsorption capacity in comparison to the pure CeO2 but no
further significant enhancement was observed with increasing the dopant concentration
beyond 1 mol%. Doping could increase the number of OH- groups attached on CeO2 surface,
thus increasing the adsorption capacity of Cr(VI) in the form of HCrO4−, CrO4
− and Cr2O7−.
Table 6.1. Comparison of Cr(VI) uptake by different pure and doped CeO2 nanopowders.
Sample Cr(VI) % adsorb
100CeSDSasp 67
0.5SmCeSDSasp 78
1SmCeSDSasp 83.5
2SmCeSDSasp 82
5SmCeSDSasp 83
1SmCeSDSMWasp 81
1SmCeSDSNRasp 62
1SmCeSDS500 70

Chapter 6 Applications
175
In addition, it is also noteworthy that the 1SmCeSDSasp or 1SmCeSDSMWasp
nanopowder showed comparable 84 or 81 % Cr(VI) adsorption capacity, but a lower amount
of 62% Cr(VI) was adsorbed by the 1SmCeSDSNRasp nanopowder, which is obtained
without refluxing. A decrease in adsorption capacity was observed for the calcined samples.
Since the as-prepared 1 mol% Sm3+
doped CeO2 nanopowders obtained in conventional
refluxing method shows maximum adsorption capacity it was subjected for further studies in
order to find out the effect of other parameters on Cr(VI) adsorption capacities.
6.1.3.2. Effect of contact time
0 20 40 60 80 100 120 140 160 180 20060
65
70
75
80
85
90
200 300 400 500 600
O.D
Wavelength
100 mg l-1
Cr
5 min
15 min
30 min
45 min
60 min
90 min
Ad
so
rb (
%)
Contact time (min)
1 2 3 4 5 6 7 8 90
20
40
60
80
100
200 300 400 500 6000
1
2
3
4
O.D
Wavelength
100 mg l-1 Cr
pH 1.5
pH 3
pH 5
pH 7
pH 8Ad
so
rb (
%)
pH
Fig. 6.1. (A) Time profile of Cr(VI) removal with 1SmCeSDSasp without adjustment of pH.
The initial Cr(VI) concentration and the amount of adsorbent were 100 mgL-1
and 10 gL-1
,
respectively. (B) Effect of pH (varied from 1.5 to 8) on the Cr(VI) adsorption by
1SmCeSDSasp (time = 60 min, initial Cr(VI) conc. = 100 mg L-1
, and amount of
1SmCeSDSasp = 10 gL-1
).
Effect of contact time is one of most important parameter which has significant
influence on Cr(VI) adsorption capacity. To determine the equilibrium point, the adsorption
processes as a function of time were carried out by dispersing 0.10 g nanopowder in 10 mL of
100 mgL-1
Cr(VI) solution without any adjustment of pH i.e. at initial pH of 5 at room
temperature. The results are shown in Fig. 6.1 (A). It can be seen from the Fig. 6.1(A), that
the adsorption efficiency of Cr(VI) ions into nanopowders is gradually increasing from 69%
to 83.5% with increasing the contact time from 5 min to 1 h. Stability reached within 1 h and
no significant change in Cr(VI) adsorption was further observed. The complete adsorption
equilibrium was reached after 1h between the two phases. The Cr(VI) adsorption capacity was
(A) (B)

Chapter 6 Applications
176
found to be reached maximum of 8.35 mgg−1
in 1 h of contact time. No further significant
improvement in adsorption capacity was observed after 1h of contact time by placing the
adsorbent in contact with the Cr(VI) solutions for 3 days. The rapid adsorption equilibrium
could be attributed to the presence of large number of surface active sites due to high surface
area and mesoporous structure of the adsorbent. This behavior shows that adsorption of
Cr(VI) ions occurred in a single step. The slow adsorption before 1 h can be explained by ion
exchange of the Cr(VI) ions on the surface of the nanopowders.
6.1.3.3. Effect of pH
The effect of initial pH on the adsorption of Cr(VI) (100 mgL-1
) from aqueous solution
by the nanopowder (0.1 g dispersed in 10 mL solution) was examined by varying the pH of
the solution over the range of 1.5 to 8 and contact time of 1 h. The pH of the solution was
adjusted by adding HNO3 and NH4OH solutions. The adsorption of metal ions on powder
surfaces can be reduced or increased by varying the pH values of the medium, due to the
weaker interactions of metal ions with adsorbed functional groups on the powder surfaces
than the interactions with the surface hydroxyls of the mineral. The influence of initial pH on
the adsorption of Cr(IV) ions (100 mgL−1
solutions) is shown in Fig. 6.1(b). This nanopowder
exhibits a typical metal anion adsorption behavior. It was found that the maximum adsorption
occurs at lower pH, whereas negligible adsorption takes place at high pH. A sharp decrease in
adsorption capacity in alkaline media was observed. With decreasing the pH value from 7 to
3, the % of Cr(VI) adsorption was increased from 59% to 93% and no significant increase in
adsorption was observed on further decrease in the pH to 1.5. Whereas the increase in pH
value from 7 to 8, the maximum percentage of adsorption significantly decrease to 33%. The
maximum adsorption of Cr(VI) at lower pH values may be attributed due to the strong
electrostatic interaction between the positively charged surface and the negatively charged
hydrolyzed species of Cr(VI) ions. The most stable oxidation state of Cr(VI) in aqueous
solution are the hexavalent, Cr(VI) and the trivalent, Cr(III). In solution at pH higher than 5,
Cr(VI) exists in the form of CrO42− ions, whereas at lower pH values, the Cr(VI) is present
either as HCrO42− or Cr2O7
2− depending on the Cr concentration, which is adsorbed onto the
powder surface, thereby leading to high percentage of adsorption. At higher pH value, the
surface group may partially be deprotonated and the surface become negatively charged
which can in turn inhibit the adsorption of Cr(VI) due to the competition between Cr(VI) ion

Chapter 6 Applications
177
and hydroxide ion resulting a decrease of Cr(VI). The increase of alkaline media also
suppresses the hydrolysis of Cr(VI) ions leading to lower adsorption and the nano powders
acts as ion exchanger.
6.1.3.4. Effect of adsorbent dose
To investigate the amount of adsorbent dose on Cr(VI) adsorption capacity batch
experiments were carried out by taking 10 mL 100 mgL-1
Cr(VI) solution without adjustment
of pH, contact time of 1h and varying the adsorbent amount from 0.04 g to 0.12 g. It can be
seen from the Fig. 6.2 (A), that the adsorption capacity increases proportionally from 45% to
83.5% with increasing the amount of nanopowders from 0.04 to 0.10 g. On further increase in
the adsorbent dose to 0.12 g, a very little increase in adsorption capacity to 86% was
observed. So, 10 gL-1
of adsorbent is the optimum quantity for the quantitative removal of
Cr(VI) from wastewater. The increase in adsorption efficiency with the increase in adsorbent
dose may be attributed to the availability of the more number of active sites for adsorption.
On further increase in the adsorbent dose to 0.12 g, no significant increase in Cr(VI) removal
was observed due to the saturation of the active sites.
3 4 5 6 7 8 9 10 11 12 130
20
40
60
80
100
200 300 400 500 600
O.D
Wavelength
100 mg l -1
Cr
4 gm l-1
6 gm l-1
8 gm l-1
10 gm l-1
12 gm l-1
Ad
so
rb %
Adsorbent amount (gL-1)
10 20 30 40 50 60 70 80 90 100 11080
85
90
95
100
105
Ad
so
rb %
Cr(VI) concentration mg L-1
Fig. 6.2. Effect of (A) adsorbent dose and (B) adsorbate concentration on % Cr(VI)
adsorption by 1SmCeSDSasp (time: 60 min, initial Cr(VI) conc. 100 mgL-1
, and without any
further pH adjustment).
(A) (B)

Chapter 6 Applications
178
6.1.3.5. Effect of initial concentration
Assessment of the effect of initial adsorbate concentration on the percentage uptake of
the Cr(VI) adsorption on nanopowders was carried out by varying the adsorptive
concentrations from 20 mgL-1
to 100 mgL-1
at room temperature for 1h with 0.1g of adsorbent
in 10 mL solution and the results of the adsorption of Cr (VI) ions are shown in Fig. 6.2(B). It
was found that the adsorption of Cr (VI) onto nanopowders was strongly dependent on initial
metal ion concentration. As is seen in Fig. 6.2(b), the percentage of adsorption decreased from
100 to 83.5% when initial concentration of chromium ions increased from 20 to 100 mgL-1
respectively. The decrease of adsorption could be explained by the interaction of metal ions
adsorbed onto the surfaces, by a mechanism that involves specific metal ion adsorption at a
limited number of surface sites, because there are less number of surface active sites per gram
of sorbent available for deposition at higher initial concentration.
6.1.3.6. Maximum adsorption capacity
In order to find out the maximum adsorption capacity, the adsorption study was
performed by taking maximum initial Cr(VI) concentration (100 mg L-1
) and minimum
amount of nanopowder 2.0 g L-1
of 1 mol% Sm3+
doped CeO2 at optimum pH=2 and room
temperature of 25°C. From Fig.6.3, it was found that the adsorption process almost finished
within 8 h, and no significant change was observed from 8 to 12 h. The maximum adsorption
capacity was found to be 23.30 mg.g-1
.
0 2 4 6 8 10 12
14
16
18
20
22
24
Am
ou
nt
of
Cr(
VI)
(q
t, m
g/g
) a
ds
orb
Contact time (h)
Fig. 6.3. Maximum adsorption capacity of 1SmCeSDSasp, variation with time (in h), initial
Cr (VI) conc 100 mg L-1
, amount of 1SmCeSDSasp 2 g L-1
, at pH 2.

Chapter 6 Applications
179
6.1.3.7. Adsorption isotherm study
Adsorption isotherm models were used to determine the relationship between the
adsorbed species and their equilibrium concentrations. The obtained experimental data were
fitted to the common isotherm models i.e. Langmuir and Freundlich isotherms.
6.1.3.7.1. Langmuir isotherm
The Langmuir isotherm is assumed to be adsorption on homogeneous surfaces as well
as monolayer adsorption. According to this isotherm, available sites on the adsorbent surface
is constant. The linearized form of this isotherm is given by the equation 2.17 in chapter II. A
linear relationship was observed among the plotted data which revealed the applicability of
the Langmuir isotherm. Values of the Langmuir constants qm and b were calculated from the
slopes and intercepts, respectively, by plotting Ce/qe versus Ce (Fig. 6.4a) and are given in
Table 6.2. The values of qm and b for the removal of Cr(VI) were found to be 8.344 mg g-1
and 1.154 L mg-1
, respectively.
0 3 6 9 12 15 18
0.0
0.5
1.0
1.5
2.0
2.5
Ce
/qe
(g L
-1)
Ce (mg L-1
)
0.0 0.8 1.6 2.4 3.21.2
1.4
1.6
1.8
2.0
2.2
2.4
ln q
e
ln Ce Fig. 6.4. (A) Langmuir and (B) Freundlich adsorption isotherms for Cr(VI) adsorption by
1SmCeSDSasp.
Langmuir isotherm can be expressed in terms of dimension less separation factor, RL,
which describes the type of isotherm;
RL = 1 (1 + b𝐶0)⁄ (6.3)
Where C0 is the initial concentration of Cr(VI) (mg.L-1
) and b (L.mg-1
) is Langmuir
constant. The magnitude of RL determines the feasibility of the sorption process. If RL > 1,
(A) (B)

Chapter 6 Applications
180
the sorption is unfavourable; if RL = 1, the sorption is linear; if RL< 1, the sorption is
favorable and if RL = 0, the sorption is irreversible. The values for RL listed in Table 6.2
were calculated for the initial concentration of 100 mg.L-1
. The value of RL in the present
investigation has been found 0 <RL<1. Hence the sorption process was very favorable and the
adsorbent employed exhibited a good potential for the removal of Cr(VI) from aqueous
solution.
6.1.3.7.2. Freundlich isotherm
The Freundlich isotherm is based on a non-ideal multilayer adsorption on
heterogeneous surface. The linear form of Freundlich isotherm has been given by equation
2.19 in chapter II. Where qe is the amount adsorbed (mg g-1
) at equilibrium, Ce is the
equilibrium concentration (mg.L-1
), and Kf and 1/n are related to the adsorbent capacity and
sorption intensity of the adsorbent, respectively. The values of the Freundlich constants Kf
and n were determined from the intercept and slope, respectively, by plotting ln qe vs ln Ce
and the plot is shown in Fig. 6.4 (b). The values of Kf and n for removal of Cr(VI) from
aqueous solutions are found to be 4.354 mg g-1
, and 4.573 Lg-1
, respectively (Table 6.2).
Since the 1/n value is less than unity which signify the better adsorption at lower Cr(VI)
concentration. The R2 values for the parameters of the two isotherm models were calculated,
and these values suggest that both models fit the equilibrium data.
Table 6.2. Langmuir and Freundlich isotherm parameters for Cr(VI) adsorption by
1SmCeSDSasp.
Langmuir isotherm model Freundlich isotherm model
qm (mg/g) b (L/mg) RL R2 Kf (mg/g) n R
2
8.344 1.1547 0.00859 0.9827 4.354 4.573 0.9897
6.1.3.8. Adsorption kinetics
6.1.3.8.1. The pseudo first-order equation
The kinetics of the Cr(VI) adsorption was studied by pseudo first order rate equation
as given in equation 6.4. Where qe is the sorption capacity at equilibrium (mg g-1
), qt is the
sorption capacity at time t (mg g-1
), and K1 is the pseudo first-order kinetic constant (min−1
).
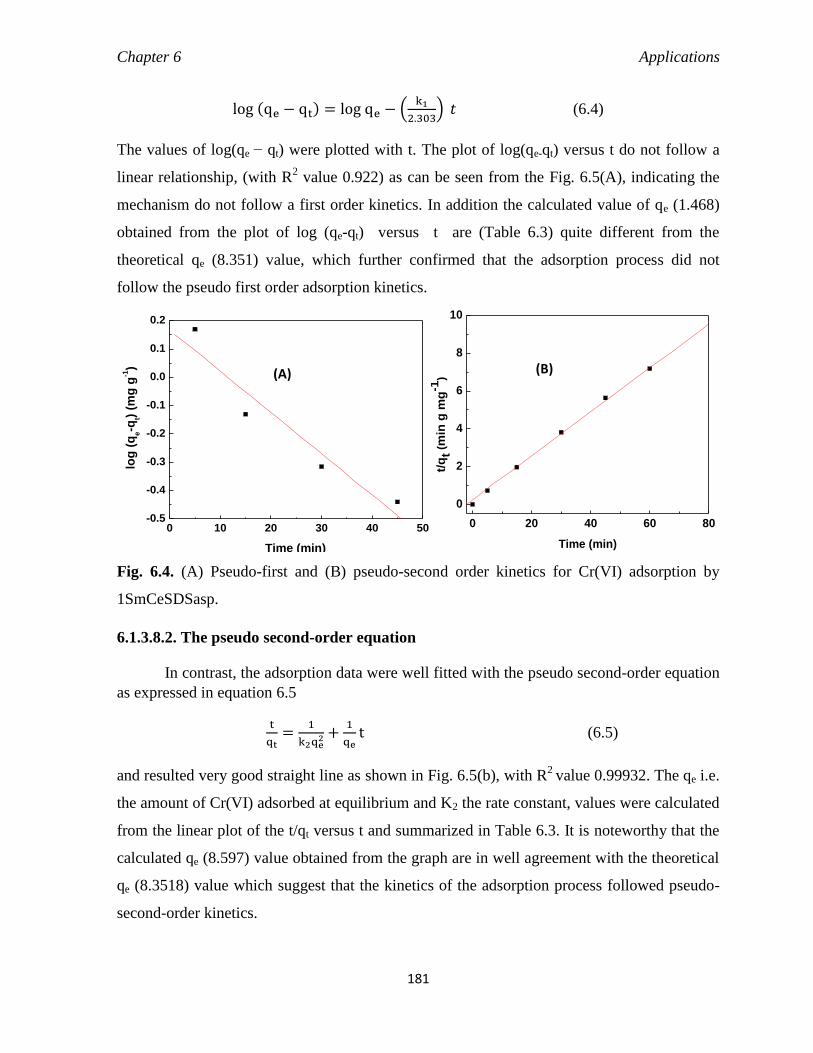
Chapter 6 Applications
181
log (qe − qt) = log qe − (k1
2.303) 𝑡 (6.4)
The values of log(qe − qt) were plotted with t. The plot of log(qe-qt) versus t do not follow a
linear relationship, (with R2 value 0.922) as can be seen from the Fig. 6.5(A), indicating the
mechanism do not follow a first order kinetics. In addition the calculated value of qe (1.468)
obtained from the plot of log (qe-qt) versus t are (Table 6.3) quite different from the
theoretical qe (8.351) value, which further confirmed that the adsorption process did not
follow the pseudo first order adsorption kinetics.
0 10 20 30 40 50-0.5
-0.4
-0.3
-0.2
-0.1
0.0
0.1
0.2
Time (min)
log
(q
e-q
t) (m
g g
-1)
0 20 40 60 80
0
2
4
6
8
10
t/q
t (m
in g
mg
-1)
Time (min)
Fig. 6.4. (A) Pseudo-first and (B) pseudo-second order kinetics for Cr(VI) adsorption by
1SmCeSDSasp.
6.1.3.8.2. The pseudo second-order equation
In contrast, the adsorption data were well fitted with the pseudo second-order equation
as expressed in equation 6.5
t
qt=
1
k2qe2 +
1
qet (6.5)
and resulted very good straight line as shown in Fig. 6.5(b), with R2
value 0.99932. The qe i.e.
the amount of Cr(VI) adsorbed at equilibrium and K2 the rate constant, values were calculated
from the linear plot of the t/qt versus t and summarized in Table 6.3. It is noteworthy that the
calculated qe (8.597) value obtained from the graph are in well agreement with the theoretical
qe (8.3518) value which suggest that the kinetics of the adsorption process followed pseudo-
second-order kinetics.
(A) (B)

Chapter 6 Applications
182
Table 6.3. Kinetic parameters for pseudo-first order and pseudo-second order kinetic models.
pseudo-first order pseudo-second order
Calculated
qe (mg g-1
)
Theoretical
qe (mg g-1
)
K2 (min-1
) R2 Calculated
qe (mg g-1
)
Theoretical
qe (mg g-1)
K2
(min-1
)
R2
1.4689 8.351853 0.0335 0.9228 8.59771 8.351853 0.05457 0.99932
6.1.4. Conclusion
The high surface area and mesostructured as-prepared 1 mol% Sm3+
doped CeO2
adsorbent obtained in conventional reflux method could effectively remove 84 % of toxic
Cr(VI) metal ions from aqueous solution within a short period of 1 h and without any
adjustment of pH. Kinetic studies confirmed that the adsorption process obeys pseudo-
second-order kinetics. The adsorption isotherm data were fitted to both Freundlich and
Langmuir models. The material was prepared through a simple and cost-effective method so
the adsorbents are suitable for large scale waste water treatment.
6.2. Evaluation of Photo degradation of Acid Orange 7 under natural sunlight
6.2.1. Introduction
Now a days, tremendous efforts have been dedicated in water treatment researches to
ensure sufficient water supply as the global consumption of water is increasing. Wastewater
generated from textile, leather, paper, plastics, pharmaceutical and food industries are
extensively containing azo dyes, which are largely non-biodegradable and toxic under aerobic
conditions and reduced to potential carcinogenic aromatic amines under anaerobic conditions,
and regarded as a major source of ecological and environmental problems.24,25
Acid Orange 7
[p-(2-hydroxy-1-naphthylazo) benzene sulfonic acid] (AO7) that has a –N=N– unit as
chromophore in their molecular structure, is a popular water-soluble dye that poses a severe
health threat to humans includes eye, skin, mucous membrane, and upper respiratory tract
irritation; severe headaches, nausea, methemoglobinemia, tumors, water-borne diseases such
as dermatitis etc.26
Therefore, development of a simple and effective technology for the
purification of dye-containing wastewater is imperative.

Chapter 6 Applications
183
For degrading organics and toxic materials, many treatment methods require high
pressure (0.5–20 Mp) and high temperature (80–320C),27
which limit the practical
application. To resolve this problem, in particular, heterogeneous photocatalysis using most
preferred TiO2 and ZnO photocatalysts have emerged as a promising advanced oxidation
processes for the purification of the dye-containing wastewater and also provides solutions to
many problems related to environmental pollution.28-30
Mostly these processes involve
UV/H2O2, UV/O3 for the oxidative degradation of dyes.29-31
Although H2O2 is an
environmentally friendly oxidant and widely used for environmental remediation,
disinfection, ect. but the current industrial process for H2O2 production requires toxic solvents
and high energy input, which is not environmentally benign.32,33
Photo assisted oxidation by
solar irradiation has been found to be a most cost effective and ideal approach, as it is readily
available and free that can be used directly to oxidize or degrade hazardous organic
chemicals.28
The advantage of CeO2 (band gap Eg ~ 2.9 eV) in comparison with TiO2 (Eg ~ 3.0
to 3.2 eV for anatase and absorbs less than 5% UV light of the sunlight) is that it absorbs over
a larger fraction of UV spectrum and the onset of absorption of CeO2 is ∼440 nm.34
CeO2
nanopowder has been reported to be more efficient photocatalyst than commercial TiO2
P25.34-36
So recently, CeO2 is gaining immense interest as photocatalysts for photocatalytic
degradation of various dyes as it is chemically stable, inexpensive and can be easily
synthesized through various reproducible solution based synthesis routes.37-41
It has already
been used in various catalytic applications such as fluid cracking, purification of harmful
gases in three way automotive catalytic converters, water splitting for the generation of H2
gas, as well as in biomedicine, solar cell, and inorganic phosphors.42-46
The key to the wide ranges of catalytic applications of ceria based materials is that CeO2
by shifting some Ce4+
to Ce3+
ions can easily produce oxygen vacancies, which act as sources
for the oxygen involved in reactions taking place on the catalyst surface.38,41,47
The
effectiveness of CeO2 photocatalyst can be enhanced by introducing other metal ions into it
by forming solid solution.39,41
It has been also reported that the lanthanide ion including La3+
,
Nd3+
, Pr3+
, Sm3+
, or Eu3+
doped in TiO2 photocatalysts improve the separation rate of photo-
induced charge carriers and greatly enhance the photocatalytic activity of TiO2 than that of
pure TiO2.48
Cai et al. observed improved degradation of AO7 in the dark as well as under the
visible light irradiation in the CeO2 –H2O2 system after Fe3+
doping.41

Chapter 6 Applications
184
It is well known that the concentration of oxygen vacancies can be remarkably enhanced
after doping with Sm, due to Sm3+
→ Ce4+
substitutions.43
Sm3+
doping also induces the least
distortion of the parent lattice when oxygen vacancies are created in the CeO2 lattice for
charge compensation. Many studies have reported on Sm0.2Ce0.8O1.9 system showing the
highest electrical conductivity (specific to ionic conductivity) required for solid oxide fuel cell
application.45
Also samarium doped ceria nanoparticles are very important in developing new
luminescence devices.43
But no investigation on Sm3+
doped CeO2 as photocatalyst has been
reported. Therefore, in this study, we aimed to obtain an efficient photocatalyst by doping
CeO2 with Sm3+
ions.
Recently, Sun et al. reported 97.6% degradation efficiency of AO7 by nitrogen-doped
CeO2 (N:Ce molar ratio of 0.3) nanoparticles synthesized solvothermally at 120C for 24 h in
an autoclave.37
They investigated degradation of 20 mg/L AO7 solution (at pH = 3.0)
containing 1 g/L of the as-synthesized sample, which had air bubbled through it at 60C at a
flow rate of 300 mL/min, using a domestic 10 W compact fluorescent lamp.37
Salker et al.
reported low solar light assisted photocatalytic activity of CeO2 for the degradation of textile
dye Naphthol Blue Black.49
But a significant increase in the photocatalytic activity was
observed by substitution of 30 mol% Mn4+
in CeO2 crystal lattice due to the enhancement of
the redox couple Ce4+
–Ce3+
and decrease in band gap energy.49
Few studies have also
demonstrated the potential use of CeO2,35,36,38
or doped CeO239-41
for photocatalytic
degradation of dyes under visible light irradiation (mostly λ 420 nm).36,39,41
However, in
most cases they are successful in the presence of high concentrations of oxidizing agents,38,41
and/or under specific pH conditions.37
These conditions limit the industrial application of
nanomaterials in environmental remediation. There is a need to develop general, simple and
economical routes for designing novel nanomaterials which can efficiently remove various
contaminants in the environment under solar illumination. Due to the higher reaction rate and
selectivity, microwave chemistry has recently been shown to be a fast-growing research area
with immense potential.50-52
Microwave-assisted methods are effectively employed to
synthesize a great many novel nanostructures with various shapes.50-52
However, the application of microwave heating with addition of surfactants to synthesize
mesostructured nanomaterials has hardly been exploited until now. Here, we used surfactant
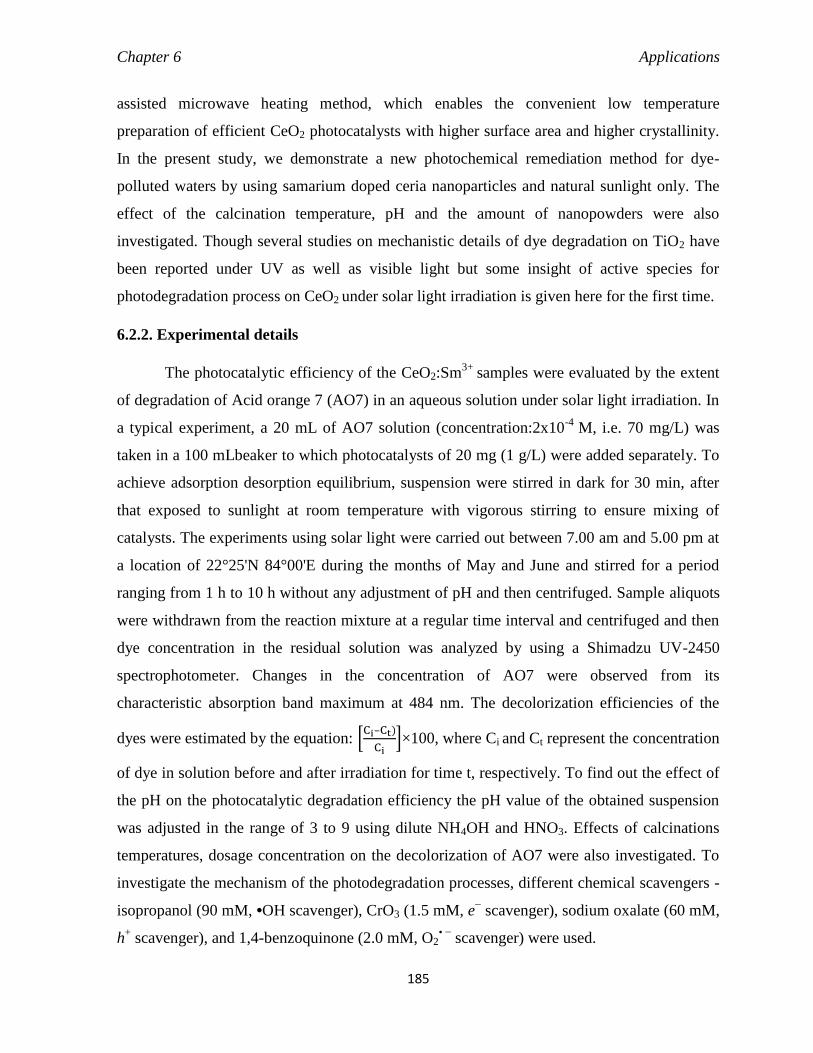
Chapter 6 Applications
185
assisted microwave heating method, which enables the convenient low temperature
preparation of efficient CeO2 photocatalysts with higher surface area and higher crystallinity.
In the present study, we demonstrate a new photochemical remediation method for dye-
polluted waters by using samarium doped ceria nanoparticles and natural sunlight only. The
effect of the calcination temperature, pH and the amount of nanopowders were also
investigated. Though several studies on mechanistic details of dye degradation on TiO2 have
been reported under UV as well as visible light but some insight of active species for
photodegradation process on CeO2 under solar light irradiation is given here for the first time.
6.2.2. Experimental details
The photocatalytic efficiency of the CeO2:Sm3+
samples were evaluated by the extent
of degradation of Acid orange 7 (AO7) in an aqueous solution under solar light irradiation. In
a typical experiment, a 20 mL of AO7 solution (concentration:2x10⁻⁴
M, i.e. 70 mg/L) was
taken in a 100 mLbeaker to which photocatalysts of 20 mg (1 g/L) were added separately. To
achieve adsorption desorption equilibrium, suspension were stirred in dark for 30 min, after
that exposed to sunlight at room temperature with vigorous stirring to ensure mixing of
catalysts. The experiments using solar light were carried out between 7.00 am and 5.00 pm at
a location of 22°25'N 84°00'E during the months of May and June and stirred for a period
ranging from 1 h to 10 h without any adjustment of pH and then centrifuged. Sample aliquots
were withdrawn from the reaction mixture at a regular time interval and centrifuged and then
dye concentration in the residual solution was analyzed by using a Shimadzu UV-2450
spectrophotometer. Changes in the concentration of AO7 were observed from its
characteristic absorption band maximum at 484 nm. The decolorization efficiencies of the
dyes were estimated by the equation: [Ci–Ct)
Ci]×100, where Ci and Ct represent the concentration
of dye in solution before and after irradiation for time t, respectively. To find out the effect of
the pH on the photocatalytic degradation efficiency the pH value of the obtained suspension
was adjusted in the range of 3 to 9 using dilute NH4OH and HNO3. Effects of calcinations
temperatures, dosage concentration on the decolorization of AO7 were also investigated. To
investigate the mechanism of the photodegradation processes, different chemical scavengers -
isopropanol (90 mM, •OH scavenger), CrO3 (1.5 mM, e− scavenger), sodium oxalate (60 mM,
h+ scavenger), and 1,4-benzoquinone (2.0 mM, O2
• − scavenger) were used.

Chapter 6 Applications
186
To determine the adsorption behavior of Sm3+
ion doped and pure CeO2 catalyst,
adsorption tests in the dark was performed. 20 mg of photocatalysts was added to 20 mL of
2x10⁻⁴
M AO7 solution. The mixture was well dispersed, and put in the dark for 10 h. The
AO7 concentration in the suspension before and after the adsorption tests was analyzed and
the adsorbed amount of AO7 on the catalysts was calculated.
6.2.3. Result and discussion
6.2.3.1. Effect of various photocatalysts
In order to find out the best performing photocatalyst, the photocatalytic degradation of
AO7 by using different nanopowders were evaluated by using 20 mL 2x10⁻⁴
M stock solution
of AO7 and 0.02 g nanopowder under natural sunlight for 1 h and the results are summarized in
Table 6.4.
Table 6.4. Comparison of photocatalytic degradation % of AO7 by different CeO2
nanopowders during the decolorization process at solar irradiation time of 1 h. pH neutral.
Sample Degradation % of AO7
100CeSDS500 55
100CeSDSMW500 60
0.5SmCeSDSMW500 71
1SmCeSDSMW500 82.5
2SmCeSDSMW500 77
5SmCeSDSMW500 70
10SmCeSDSMW500 62
1SmCeSDS500 75
It was found that Sm3+
doping significantly enhanced the photocatalytic activity. In addition it
is also notable that the nanopowder obtained in microwave assisted route showed higher
photodegradation efficiency than the nanopowder obtained in conventional route.
Furthermore, the effects of different amount of dopants were also examined under the same
experimental conditions and the results revealed that the 1 mol% Sm3+
doped CeO2 exhibits
highest photocatalyst efficiency. Hence, 1 mol% Sm3+
doped CeO2 obtained in microwave
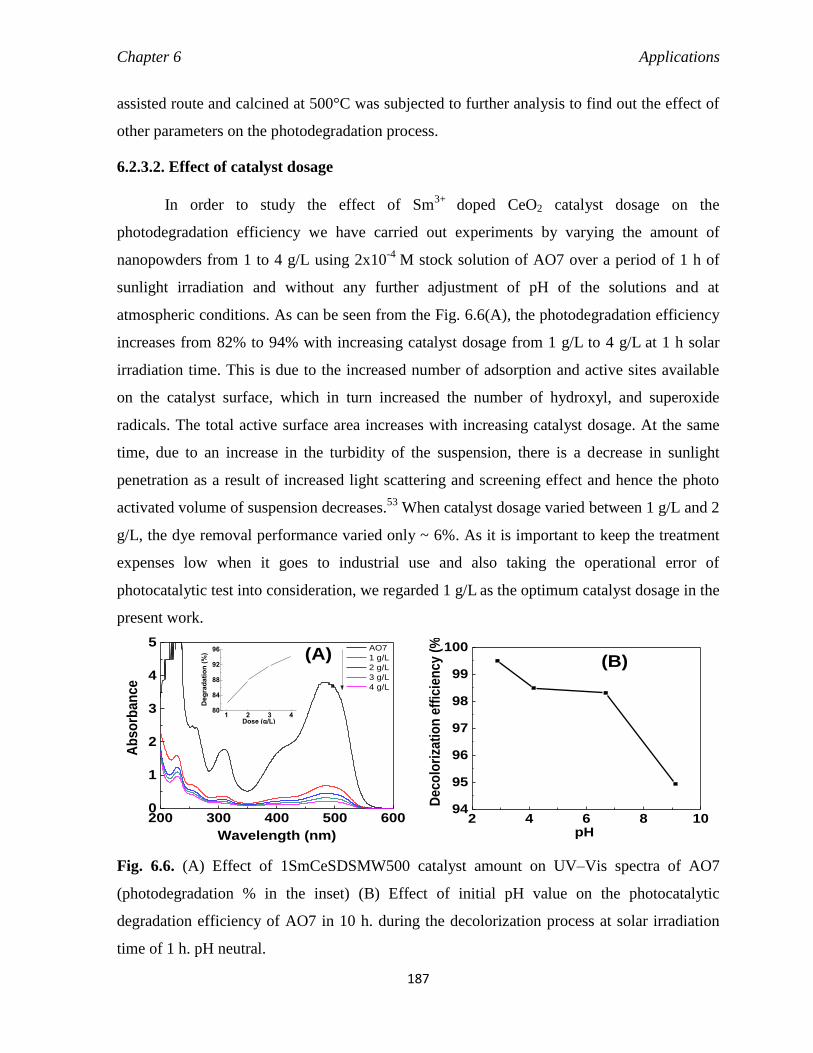
Chapter 6 Applications
187
assisted route and calcined at 500°C was subjected to further analysis to find out the effect of
other parameters on the photodegradation process.
6.2.3.2. Effect of catalyst dosage
In order to study the effect of Sm3+
doped CeO2 catalyst dosage on the
photodegradation efficiency we have carried out experiments by varying the amount of
nanopowders from 1 to 4 g/L using 2x10⁻⁴
M stock solution of AO7 over a period of 1 h of
sunlight irradiation and without any further adjustment of pH of the solutions and at
atmospheric conditions. As can be seen from the Fig. 6.6(A), the photodegradation efficiency
increases from 82% to 94% with increasing catalyst dosage from 1 g/L to 4 g/L
at 1 h solar
irradiation time. This is due to the increased number of adsorption and active sites available
on the catalyst surface, which in turn increased the number of hydroxyl, and superoxide
radicals. The total active surface area increases with increasing catalyst dosage. At the same
time, due to an increase in the turbidity of the suspension, there is a decrease in sunlight
penetration as a result of increased light scattering and screening effect and hence the photo
activated volume of suspension decreases.53
When catalyst dosage varied between 1 g/L and 2
g/L, the dye removal performance varied only ~ 6%. As it is important to keep the treatment
expenses low when it goes to industrial use and also taking the operational error of
photocatalytic test into consideration, we regarded 1 g/L as the optimum catalyst dosage in the
present work.
200 300 400 500 6000
1
2
3
4
5
1 2 3 480
84
88
92
96
Deg
rad
ati
on
(%
)
Dose (g/L)
Ab
so
rba
nc
e
Wavelength (nm)
AO7
1 g/L
2 g/L
3 g/L
4 g/L
(A)
2 4 6 8 1094
95
96
97
98
99
100
Deco
lori
zati
on
eff
icie
ncy (
%)
pH
(B)
Fig. 6.6. (A) Effect of 1SmCeSDSMW500 catalyst amount on UV–Vis spectra of AO7
(photodegradation % in the inset) (B) Effect of initial pH value on the photocatalytic
degradation efficiency of AO7 in 10 h. during the decolorization process at solar irradiation
time of 1 h. pH neutral.

Chapter 6 Applications
188
6.2.3.3. Effect of pH of the medium
The solution pH is an important parameter in photocatalytic degradation reactions and
the wastewaters from textile industries usually have a wide range of pH values. It has
significant influence on the surface charge of the metal oxide catalyst and therefore the
adsorption ability of pollutants onto the surface of the catalyst. Higher adsorption of dye
could lead to a higher degree of degradation. The effect of pH of the medium on the
photocatalytic degradation efficiency of AO7 under sunlight irradiation for 10 h was
examined in the pH range of 2.9 to 9.1 at a fixed dose of Sm3+
: CeO2 (1g/L) and keeping all
other experimental parameters constant.
Fig. 6.6(B) shows a direct influence of the initial solution pH values of 2.9, 4.2, 6.9, and
9.1 on the degradation efficiency of dyes on the catalyst. It is interesting to observe that the
Sm3+
: CeO2 photocatalyst was very efficient in degrading (99.5 % to 95 %) the dye over the
pH range from 2.9 to 9.1. At neutral pH of 6.9, photodegradation of AO7 was 98 %. The
photodegradation efficiency of AO7 is slightly higher in acidic solutions than that in alkaline
solutions. The zero point charge of ceria is at pH 4.2, which is close to the neutral pH of 6.9
of the solution. AO7 dye act as a Lewis base due to the presence of negatively charged acidic
sulfonate group on it and can easily adsorb on the positively charged Ce–OH2+ catalyst
surface in acidic pH, and hence increasing the degradation rate. In alkali medium may be due
to the increased OH− ion concentration with increased pH, there is a competitive adsorption
by hydroxyl groups and the dye molecule in addition the negatively charged catalyst surface
repels the dye, thereby undergoes a bit slower degradation.
6.2.3.4. Effect of calcination temperature
Calcination temperature is a vital parameter in the preparation of catalyst and has
prominent influence on the activity of the prepared photocatalysts. Fig.6.7 (A) shows the
effect of temperature ranging from 90 (as-prepared) to 800C of the catalyst on the
photocatalytic activity under sunlight irradiation for 1 h at normal pH condition. The results
revealed that the photocatalytic activity rapidly increased from 37 % to 82 % as the
calcination temperature increased from 90 (as-prepared) to 500C and was optimum at 500C.
A reduced photodegradation of 79 % and 36 % were observed for the catalysts calcined at 600

Chapter 6 Applications
189
and 800C, respectively. Therefore, the catalyst calcined at 500°C has the most favorable
physical properties for optimal photo activity.
200 300 400 500 600
(e)
(d)
(c)
(b)
0 200 400 600 800 100030
40
50
60
70
80
90
De
gra
da
tio
n (
%)
Calcination temperature (0C)
Ab
so
rban
ce
Wavelength (nm)
(a) pure AO7
(b) Asp
(c) 5000C
(d) 6000C
(e) 8000C
(a)
200 300 400 500 600
484
415310
254
Ab
so
rba
nc
e
Wavelength (nm)
pure AO7, 0h
1 h
2 h
3 h
4 h
5 h
6 h
10 h
228
Fig. 6.7. (A) Effect of calcination temperatures of 1SmCeSDSMW catalyst on UV–Vis
spectra of AO7 (photodegradation % in the inset) during the decolorization process at solar
irradiation time of 1 h. pH neutral. (B) Evolution of the UV–vis spectra with irradiated time
for the photocatalytic degradation of AO7 in aqueous solution in the presence of
1SmceSDSMW500, pH neutral.
Generally, the specific surface area, surface states and crystallinity play key roles in
the degradation efficiency.53
The catalyst calcined at 600C possesses lower surface area than
the as-prepared catalyst though showing prominently 42% higher photodegradation
efficiency. This indicates that surface area is not the only determining factor to cause the
different efficiencies seen in this study. The as-prepared catalyst also contains certain amount
of SDS molecules, which is attached to the inorganic framework and is difficult to remove
just by simple washing process. The SO4-
ions of SDS molecules present in the as-prepared
sample also decrease the adsoption of the negatively charged dye on its surface, thereby
decrease the photodegradation efficiency. Carbonaceous species formed during the sunlight
irradiation and low crystallinity could be possible reasons for the unusually low activity of as-
prepared catalyst despite having high surface area. Wang et al. found that organic impurities
(carbonaceous species) present in the well-known photocatalyst TiO2 diminishes the
photocatalytic activities by accelerating the electron and hole recombination by acting as
intermediate levels under UV light.54
(A)
(B)
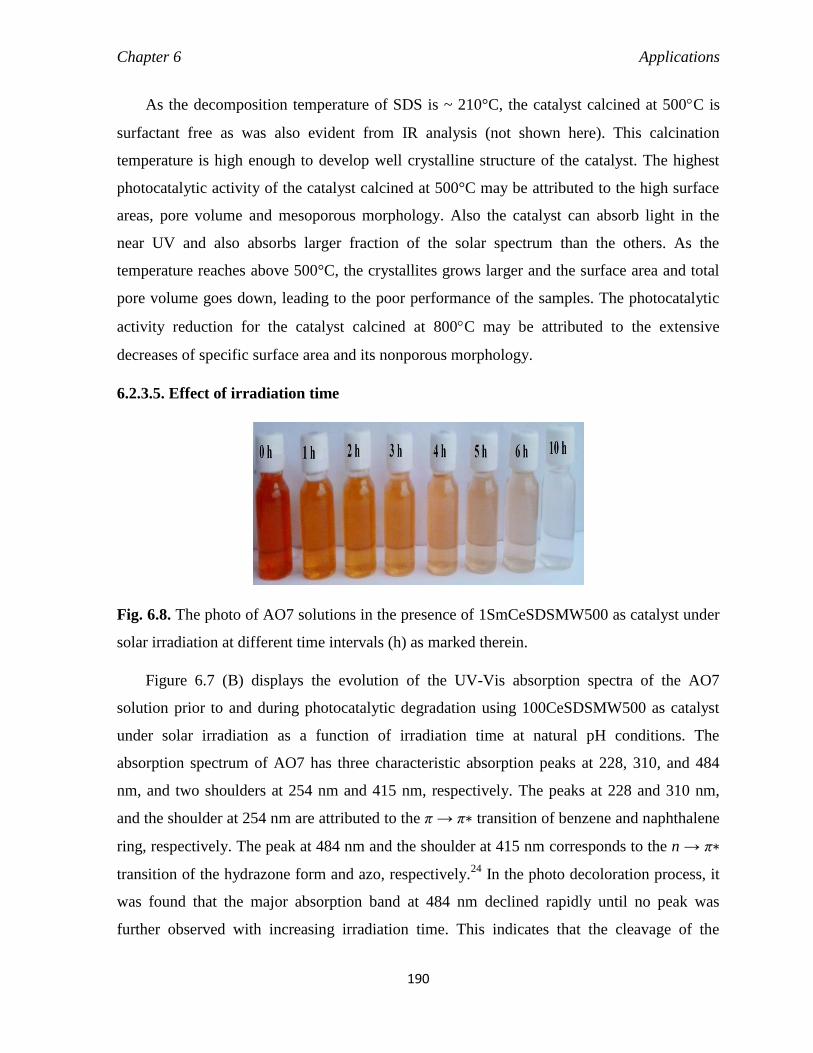
Chapter 6 Applications
190
As the decomposition temperature of SDS is ~ 210°C, the catalyst calcined at 500C is
surfactant free as was also evident from IR analysis (not shown here). This calcination
temperature is high enough to develop well crystalline structure of the catalyst. The highest
photocatalytic activity of the catalyst calcined at 500°C may be attributed to the high surface
areas, pore volume and mesoporous morphology. Also the catalyst can absorb light in the
near UV and also absorbs larger fraction of the solar spectrum than the others. As the
temperature reaches above 500°C, the crystallites grows larger and the surface area and total
pore volume goes down, leading to the poor performance of the samples. The photocatalytic
activity reduction for the catalyst calcined at 800C may be attributed to the extensive
decreases of specific surface area and its nonporous morphology.
6.2.3.5. Effect of irradiation time
Fig. 6.8. The photo of AO7 solutions in the presence of 1SmCeSDSMW500 as catalyst under
solar irradiation at different time intervals (h) as marked therein.
Figure 6.7 (B) displays the evolution of the UV-Vis absorption spectra of the AO7
solution prior to and during photocatalytic degradation using 100CeSDSMW500 as catalyst
under solar irradiation as a function of irradiation time at natural pH conditions. The
absorption spectrum of AO7 has three characteristic absorption peaks at 228, 310, and 484
nm, and two shoulders at 254 nm and 415 nm, respectively. The peaks at 228 and 310 nm,
and the shoulder at 254 nm are attributed to the π → π∗ transition of benzene and naphthalene
ring, respectively. The peak at 484 nm and the shoulder at 415 nm corresponds to the n → π∗
transition of the hydrazone form and azo, respectively.24
In the photo decoloration process, it
was found that the major absorption band at 484 nm declined rapidly until no peak was
further observed with increasing irradiation time. This indicates that the cleavage of the
Chapter 6 Applications
191
chromophore (N=N or C–N bond) responsible for characteristic color of the AO7 and the
representative photograph (Fig. 6.8) for the AO7 solution using the catalyst clearly shows the
decoloration process of AO7 solutions along with irradiation time.
It is observed that after the first 1 h of solar irradiation the absorbance peaks including
the shoulder in the visible region decreased over 82% from their initial value and almost
complete decolorization (98%) was achieved after 10 h of photocatalysis. The peaks at 228,
254 and 310 nm decreased significantly. This indicates that benzene and naphthalene rings of
AO7 are broken into smaller species.
6.2.3.6. FT-IR study on dye before and after photodegradation
1700 1600 1500 1400 1300 1200 1100 1000
(d)(c)
(b)
11
85
Tra
nsm
itta
nce
%
Wavenumbers (cm-1)
AO7
AO7+ sample
after 2 h
after 6 h
16
20
15
98
15
68 15
53
15
08
14
52
14
02 1
32
0
12
55
12
10
11
22 1
03
5
16
20
15
04
12
10
11
20
10
35
10
05
11
65
11
85
12
30
(a)
Fig. 6.9. FT–IR spectra of AO7 (a) isolated, (b) adsorbed on catalyst, and after
photodegradation at (c) 2 h, and (d) 6 h of irradiation.
Degradation of the dye solution was further confirmed with FT-IR spectroscopy. Fig.
6.9 presents FT-IR spectra of pure dye (AO7), and AO7 adsorbed over the
1SmCeSDSMW500 catalyst and finally after photocatalytic treatment under solar irradiation
for 2 and 6 h. The IR spectrum between 1000 and 1900 cm-1
in the fingerprint area of the pure
AO7 molecule exhibited several characteristic intense and prominent peaks at 1005, 1035,
1122, 1185, 1210 and 1508 cm-1
.55
The IR spectrum of AO7 exhibits characteristic bands of
aromatic skeletal vibrations at 1620, 1598, 1568, 1553 and 1452 cm-1
. The intense band at
1508 cm−1
, which is attributed to the vibrations of the –N=N– bond or aromatic ring sensitive
to the interaction with the azo bond, or to the N–H bending vibration mode (N–H) of the
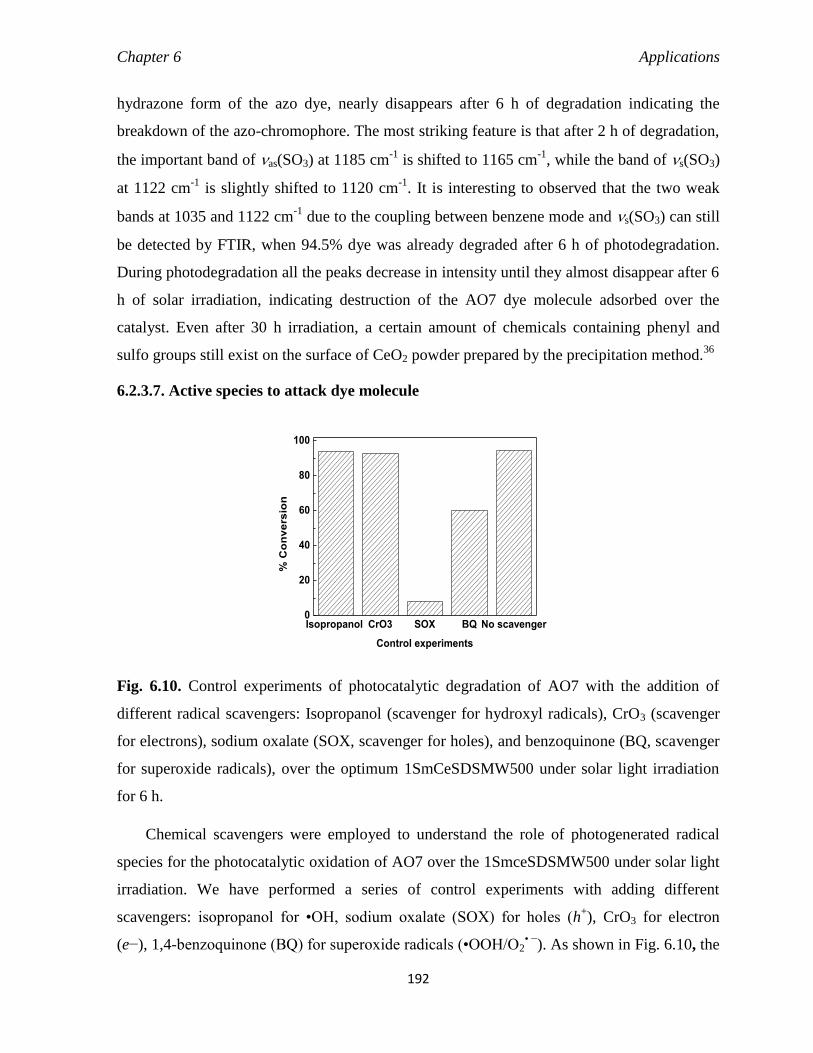
Chapter 6 Applications
192
hydrazone form of the azo dye, nearly disappears after 6 h of degradation indicating the
breakdown of the azo-chromophore. The most striking feature is that after 2 h of degradation,
the important band of as(SO3) at 1185 cm-1
is shifted to 1165 cm-1
, while the band of s(SO3)
at 1122 cm-1
is slightly shifted to 1120 cm-1
. It is interesting to observed that the two weak
bands at 1035 and 1122 cm-1
due to the coupling between benzene mode and s(SO3) can still
be detected by FTIR, when 94.5% dye was already degraded after 6 h of photodegradation.
During photodegradation all the peaks decrease in intensity until they almost disappear after 6
h of solar irradiation, indicating destruction of the AO7 dye molecule adsorbed over the
catalyst. Even after 30 h irradiation, a certain amount of chemicals containing phenyl and
sulfo groups still exist on the surface of CeO2 powder prepared by the precipitation method.36
6.2.3.7. Active species to attack dye molecule
Isopropanol CrO3 SOX BQ No scavenger0
20
40
60
80
100
% C
on
ve
rsio
n
Control experiments
Fig. 6.10. Control experiments of photocatalytic degradation of AO7 with the addition of
different radical scavengers: Isopropanol (scavenger for hydroxyl radicals), CrO3 (scavenger
for electrons), sodium oxalate (SOX, scavenger for holes), and benzoquinone (BQ, scavenger
for superoxide radicals), over the optimum 1SmCeSDSMW500 under solar light irradiation
for 6 h.
Chemical scavengers were employed to understand the role of photogenerated radical
species for the photocatalytic oxidation of AO7 over the 1SmceSDSMW500 under solar light
irradiation. We have performed a series of control experiments with adding different
scavengers: isopropanol for •OH, sodium oxalate (SOX) for holes (h+), CrO3 for electron
(e−), 1,4-benzoquinone (BQ) for superoxide radicals (•OOH/O2• −
). As shown in Fig. 6.10, the

Chapter 6 Applications
193
e− and •OH scavengers do not affect the photodegradation experiments. However, when BQ
is added to the reaction system, a significant inhibition effect on the decolorization of the
AO7 solution was observed. A remarkable inhibition effect on photodegradation of AO7 was
also observed when sodium oxalate scavenger for holes was used. The experiments clearly
suggest that the h+ play predominant role in the photocatalytic destruction of AO7. It worth
noting that though e− in bulk solution plays negligible role in photodegradation but
superoxide radicals appear to play secondary roles in the photocatalytic destruction of AO7(as
depicted in Fig.6.11).
A tentative photocatalytic reaction mechanism for degradation of AO7 over the
1SmCeSDSMW500 can be proposed as the following. Under solar light irradiation, the
electron-hole pairs are generated from CeO2. Part of the photogenerated e− also gets trapped
by the oxygen vacancies (F centres) before moving to conduction band.46
Adsorbed surface
oxygen first interact with the Ce3+
and oxygen vacancies to generate superoxide radical and
then form H2O2, •OOH and •OH. Due to the short lifetime of the resulting •OH on the
photocatalyst, the contribution of the oxidizing species in the bulk solution could be
insignificant. Active h+ and O2
• − generated in bulk solution is accepted to be produced by the
following equations:
CeO2 + h h+ + e−
Charge-carrier recombination: hvb+ + ecb
− → heat
Ce4+
+ e− Ce3+
Ce3+
+ O2(ads) Ce4+
+ O2• −
O2(ads) + F O2• −
+ F+
H2O + h+
•OH + H+
O2• −
+ H
+
• OOH
• OOH + H
+ + e− H2O2
H2O2 + e− •OH + OH−
h+
+ dye degraded product
O2• −
+ dye degraded product.
Adsorption experiment indicated that AO7 adsorbed strongly on CeO2 surface. Two
oxygen atoms from sulfonate group of AO7 are linked with two Ce surface and forms an
inner-sphere complex. AO7 molecules, being strong electron donors due to oxygen atoms of
SO32-
, are able to direct interact with valence band holes. The valence band hole primarily
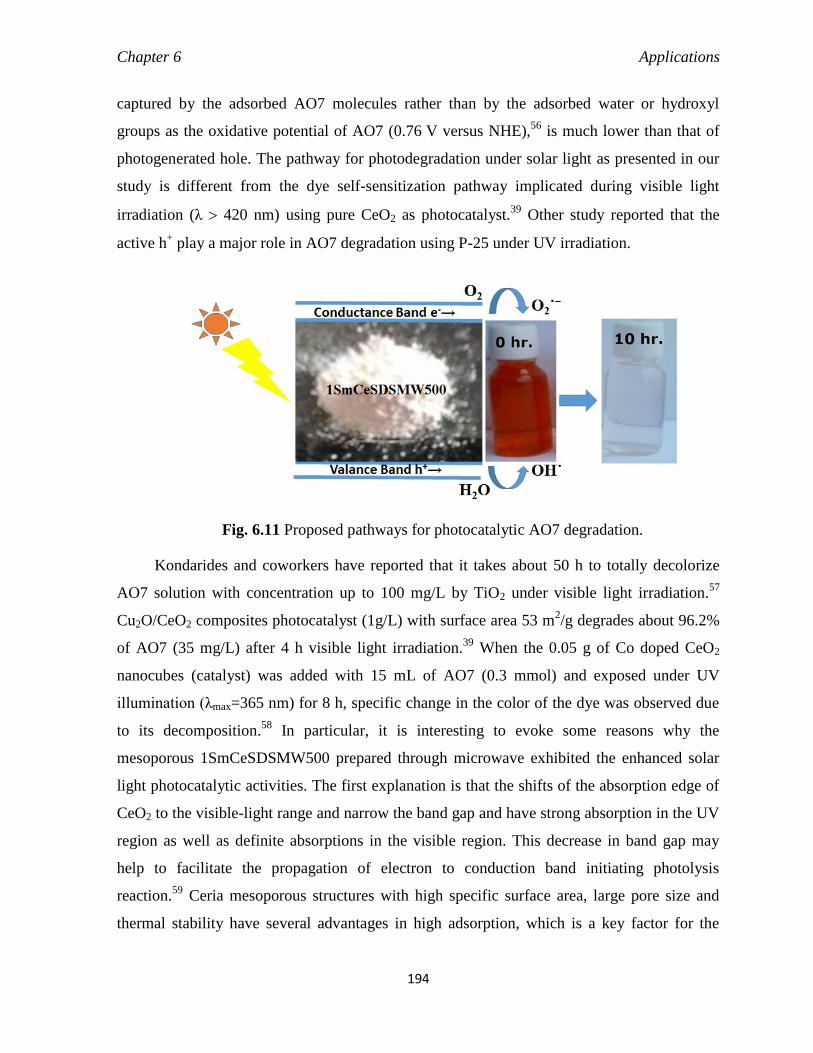
Chapter 6 Applications
194
captured by the adsorbed AO7 molecules rather than by the adsorbed water or hydroxyl
groups as the oxidative potential of AO7 (0.76 V versus NHE),56
is much lower than that of
photogenerated hole. The pathway for photodegradation under solar light as presented in our
study is different from the dye self-sensitization pathway implicated during visible light
irradiation (λ 420 nm) using pure CeO2 as photocatalyst.39
Other study reported that the
active h+ play a major role in AO7 degradation using P-25 under UV irradiation.
Fig. 6.11 Proposed pathways for photocatalytic AO7 degradation.
Kondarides and coworkers have reported that it takes about 50 h to totally decolorize
AO7 solution with concentration up to 100 mg/L by TiO2 under visible light irradiation.57
Cu2O/CeO2 composites photocatalyst (1g/L) with surface area 53 m2/g degrades about 96.2%
of AO7 (35 mg/L) after 4 h visible light irradiation.39
When the 0.05 g of Co doped CeO2
nanocubes (catalyst) was added with 15 mL of AO7 (0.3 mmol) and exposed under UV
illumination (λmax=365 nm) for 8 h, specific change in the color of the dye was observed due
to its decomposition.58
In particular, it is interesting to evoke some reasons why the
mesoporous 1SmCeSDSMW500 prepared through microwave exhibited the enhanced solar
light photocatalytic activities. The first explanation is that the shifts of the absorption edge of
CeO2 to the visible-light range and narrow the band gap and have strong absorption in the UV
region as well as definite absorptions in the visible region. This decrease in band gap may
help to facilitate the propagation of electron to conduction band initiating photolysis
reaction.59
Ceria mesoporous structures with high specific surface area, large pore size and
thermal stability have several advantages in high adsorption, which is a key factor for the
Chapter 6 Applications
195
degradation rate and photocatalysis. The mesoporous structure space effectively enhances the
spatial dispersion, which results in higher surface area and also mass transportation of
molecules both into and out of the pore structure.60
It has been suggested that the degradation
of organic dye in ceria/H2O2 system relies significantly on its adsorption on the surface of
CeO2.38
We found that the adsorption effects of AO7 in the dark after 11 h by pure CeO2 and
1 mol% Sm3+
doped CeO2 are 52.7 and 65%, respectively. The very high adsorption of AO7
by CeO2 is attributed to high surface area and pore volume of the mesoporous catalysts, high
oxygen vacancies on the surface originating from facile Ce3+
/Ce4+
redox cycle,38
and to the
ability of cerium ion to form complexes with the electron-rich sulfonate group (SO3−) of
AO7.36
Xiao et al. also demonstrated that Sm3+
-TiO2 had a higher methylene blue adsorption
capacity than undoped TiO2.61
Sm3+
doping further improved the concentration of Ce3+
or in
other words concentrations of oxygen vacancy in CeO2 samples as well as enhanced the
adsorption capacity of AO7, which resulted in better catalytic performances. Tang et al.
reported that the oxygen vacancy can not only act as impurity levels in the band structure of
ZnO but can also work as electron traps to accept the photogenerated electrons.62
Oxygen
vacancy on the CeO2 catalyst surface can easily trap the photo-generated electrons and
efficiently benefit for the separation of excited electron–hole pairs and thus can play a more
functional and effective role in photocatalytic application.
In our study, the optimum Sm3+
concentration in the CeO2 was 1.0 mol%, at which the
recombination of photo-induced electrons and holes could be effectively inhibited, and
thereby the highest photocatalytic activity was achieved. At natural pH conditions, the
photodegradation of AO7 under 1 h of solar light irradiation by the CeO2 photocatalysts
(calcined at 500 °C) with 0, 0.5, 1.0, 2.0 and 5.0 mol% Sm3+
doping were 60, 66, 82, 78, and
72%, respectively. It is well documented that a higher adsorption capacity with a higher Sm3+
content does not lead to a higher photocatalytic activity in TiO2.61
Cai et al. also showed that
doping Fe3+
improved the defect concentration and thus favored the catalytic activity of CeO2
at low levels, but retarded the degradation of AO7 at high levels, with an optimal Fe/Ce ratio
of 1/100.41
Probably at higher Sm3+
concentrations the Sm may be present at the surface of
particles and form clusters, which are detrimental for photocatalytic activity carried out at the
surface.63
Chapter 6 Applications
196
6.2.4. Conclusions
In summary, Sm3+
doped CeO2 mesoporous photocatalysts with high crystallinity and
high surface area have been successfully synthesized by a facile and low-cost surfactant-
assisted microwave heating method using (NH4)2Ce(NO3)6 and Sm2O3 and SDS. Structural,
spectroscopic, and electron microscopy techniques were used to characterize the
photocatalysts. The resultant Sm3+
doped CeO2 exhibits excellent photocatalytic activities for
degradation of Acid Orange 7 (AO7) under natural sunlight irradiation in absence of any
oxidising agents and over a broad range of pH values from 2.9 to 9.1. The results indicated
that the degree of AO7 degradation was influenced by calcination temperature and the amount
of photocatalyst. The main features those are responsible for making 1SmCeSDSMW500 a
promising material for use as an active solar light sensitive photocatalyst are its specific
surface area, crystallinity, enhanced dye adsorption capacity, importantly, high Uv-vis
absorption capability and reduced band gap of the material due to the presence of higher
concentration of Ce3+
in CeO2. It was found that besides holes, which are the main active
species in the photocatalytic destruction of AO7, O2•−
played secondary roles in the
photocatalytic degradation process. This new material is a promising candidate as a robust
solar-light active photocatalyst over a broad pH range of the dye polluted water without
addition of any oxidizing agents.
6.3. Autocatalytic activity
6.3.1. Introduction
The reversibly switching capability from Ce3+
to Ce4+
of mixed valence state CeO2
nanoparticles has also driven interest in biomedical applications as antioxidants.64-66
Some
reports suggest that a large amount of Ce3+
ions on the particle surface could enhance their
radical scavenging activity.67-69
The autoregeneration of the active Ce3+
oxidation state for
radical scavenging is an unique property of nanoceria, which separates it from other
antioxidant nanoparticles such as hydroxylated C-60 and SWCNTs.70
Zhang et al.
investigated antioxidant activity for nano-CeO2 with different morphologies synthesized by a
hydrothermal process.71
Prompted by the mesoporous structure, high surface area, pore
volume and mixed valence (Ce3+
and Ce4+
) state, we anticipated that these mesoporous Sm3+
doped CeO2 could be promising candidates for antioxidant application if they undergo
autocatalytic property. Here, for the first time, we monitored the anti-oxidation performances

Chapter 6 Applications
197
with H2O2 of mesoporous pure CeO2 and defect engineered 1SmCeSDS500. To evaluate the
autocatalytic activity of the prepared mesoporous 1SmCeSDS500, we have carried out UV-
visible transmission spectroscopic studies both in the absence and in the presence of H2O2 (an
oxidant).
6.3.2. Evaluation of autocatalytic behaviour
Autocatalytic activity was assessed by treating 20 mg mesoporous 1SmCeSDS500
samples dispersed in 10 mL of deionized water with 100 µl H2O2 solution. The transmission
spectra were recorded for these samples in the absence and presence of H2O2 at different time
intervals up to 10 days.
6.3.3. Toxicity analysis
Both mesoporous 100CeSDS500 and 1SmCeSDS500 were assessed to determine the
potential of toxicity. Cell viability utilizing MTT (3-(4,5-dimethylthiazol-2-yl)-2,5-
diphenyltetrazolium bromide) (Sigma-Aldrich) assays were evaluated for up to 5 days using
MG-63 cells cultured in DMEM (Dulbecco’s Modified Eagle’s Medium), 10% FBS (Fetal
Bovine Serum) and 1% antibiotic solution. The cells were seeded in 96-well plates at a
concentration of 10000 cells per well and were allowed to adhere at 37°C in 5% CO2 for 24 h.
The next day the cells were treated with 100 µg mL−1
mesoporous ceria samples. As a control
group, cells were cultured in the same media (without ceria particles). Following 24 h of
incubation with mesoporous ceria, the original media was removed from each well and 100
µL of fresh MTT reagent (1: 10 ratio with cell culture media) was added to each well and
incubated for 3 h. At the end of incubation purple color formazan crystals were formed, and
those were dissolved in DMSO and the absorbance of each well was measured (using a
Systronic double beam spectrophotometer 2203) at 590 nm. The experiment was done in
triplicate. A similar procedure was repeated after 3 and 5 days of treatment with mesoporous
ceria. The viability graphs were plotted by normalizing the data with respect to the control
group of the experiment of each day.
6.3.4. Results and discussion
6.3.4.1. Autocatalytic properties
Fig. 6.12a presents the UV-Vis transmittance spectra of the mesoporous 1SmCeSDS500
powder dispersing in deionized water both in absence and in presence of hydrogen peroxide

Chapter 6 Applications
198
H2O2 as an oxidizer. After the addition of H2O2, a large red shift ( ~73 nm) in the resulting
UV/Vis transmittance spectrum was observed as compared with the untreated sample may be
due to the change in the oxidation state from Ce3+
to Ce4+
induced by the hydroxyl free (OH•)
radical.72
The magnitude of the red-shifted wavelength of the UV-vis band (Δλ) was measured
between the untreated (235 nm) and the redshifted band position at transmittance value ~ 60.
Corresponding color change from light yellow to orange can be observed visually as shown in
the inset of Fig. 6.12c, upon addition of H2O2. During the next 10 consecutive days, at the
given time intervals, transmittance spectra of the H2O2 treated solution were recorded and a
gradual blue shift in the spectra was observed over time. The solution color also changed and
then turned back to its original light yellow color. The blue shift reflects the auto-regeneration
of the cerium oxide nanoparticles (Ce4+
Ce3+
) as the H2O2 decomposed from the
suspension.72
Again end of the 10 days, re-addition of H2O2 to the solution leads to the same
red shift in the corresponding transmission spectrum. This reversible behavior suggests their
possible application as an antioxidant.
Earlier, it has been reported that the surface Ce3+
in nano CeO2 can be stoichiometrically
oxidized to Ce4+
and the extent of red shift in transmission spectra is closely related to
antioxidant performance.67
Interestingly, we observed that after 30 min of addition of H2O2
there was no significant change in the red shift values for the doped and undoped CeO2
samples (see Fig. 6.12b). However, the auto regeneration of Ce3+
from Ce4+
after 3 days (as
can be seen from Fig. 6.12c) was much faster in the case of Sm3+
doped CeO2 samples. The
difference in the blue shift values observed after 3 days of H2O2 addition in the pure and
doped sample is ∼20 nm as marked in Fig. 6.12c. The total shift difference values between
the blue shift after 10 days and the red shift after 30 min is 55, 65 and 72 nm, for
100CeSDS500, 1SmCeSDSasp, and 1SmCeSDS500, respectively. So, the autocatalytic
ability after 10 days of these materials is in the following order: 100CeSDS500 <
1SmCeSDSasp < 1SmCeSDS500. Thus, it can be stated that the regeneration of Ce3+
from the
Ce4+
is much more difficult than the counter process in pure CeO2 sample. In contrast, Sm3+
doped CeO2 is able to regenerate Ce3+
easily, returning to its original values for Ce3+
and Ce4+
in the initial sample. A faster regeneration of Ce3+
can reduce the time lag for CeO2 to be
active repeatedly for radical scavenging.73
The more Ce3+
is converted back from Ce4+
, the
higher the extent of OH• radicals that can be scavenged in the following cycles. Therefore, the

Chapter 6 Applications
199
ability of regeneration of Ce3+
from the Ce4+
of nano-CeO2, is the rate-determining step in the
auto-catalytic cycle.
Fig. 6.12. Transmittance spectra showing autocatalytic behavior of (A) Sm3+
doped CeO2
calcined at 500C. Photographs [in the inset of (C)] of the aqueous solution of the sample in
absence and presence of H2O2 showing characteristic reversible color changes. Transmittance
spectra showing blue shift for the CeO2 (blue line) and Sm3+
doped CeO2 samples (black: as-
prepared; and red: calcined at 500C) after addition of H2O2 (B) 30 min, (C) 3 days, and (D)
30 min and 10 days (showing shift difference).
6.3.4.2. Effect of type of dopant
The effect of the dopant on the auto-catalytic properties were also examined. All the
samples treated with hydrogen peroxide were then kept in the dark for 3 days. After 3 days of
hydrogen peroxide treatment UV–visible transmittance spectra of these samples were taken. It
was found that Sm3+
doped CeO2 nanopowder exhibits maximum shift in the spectrum shown
in Fig. 6.13(A). This result indicates that the Sm3+
doped CeO2 nanopowder had a
significantly higher peroxide detoxification ability than pure CeO2 and Eu3+
doped CeO2.
200 250 300 350 400
(c) with H2O
2-3 d
Tra
ns
mit
tan
ce
(a
.u.)
Wavelength (nm)
Ce-Sm-asp
Ce-Sm-500
Ce-500
20
225 275 325 375
(b) with H2O
2-30 min
Tra
ns
mit
tan
ce
(a
.u.)
Wavelength (nm)
Ce-Sm-asp
Ce-Sm-500
Ce-500
200 250 300 350 400
10 d
30 min
(d)
Ce-Sm-asp 10 d
Ce-Sm-500 10 d
Ce-500 10 d
Ce-Sm-asp 30 min
Ce-Sm-500 30 min
Ce-500 30 min
Tra
ns
mit
tan
ce
(a
.u.)
Wavelength (nm)
65
72 55
With H2O2
200 250 300 350 400
Tra
ns
mit
tan
ce
(a
.u.)
Wavelength (nm)
without H2O
2
H2O
2-5 min
H2O
2-30 min
H2O
2-1 h
H2O
2-1 d
H2O
2-2 d
H2O
2-3 d
H2O
2-5 d
H2O
2-7 d
H2O
2-10 d
re-addition H2O
2-10 d
Ce-Sm-500(a)(A) (B)
(C) (D)
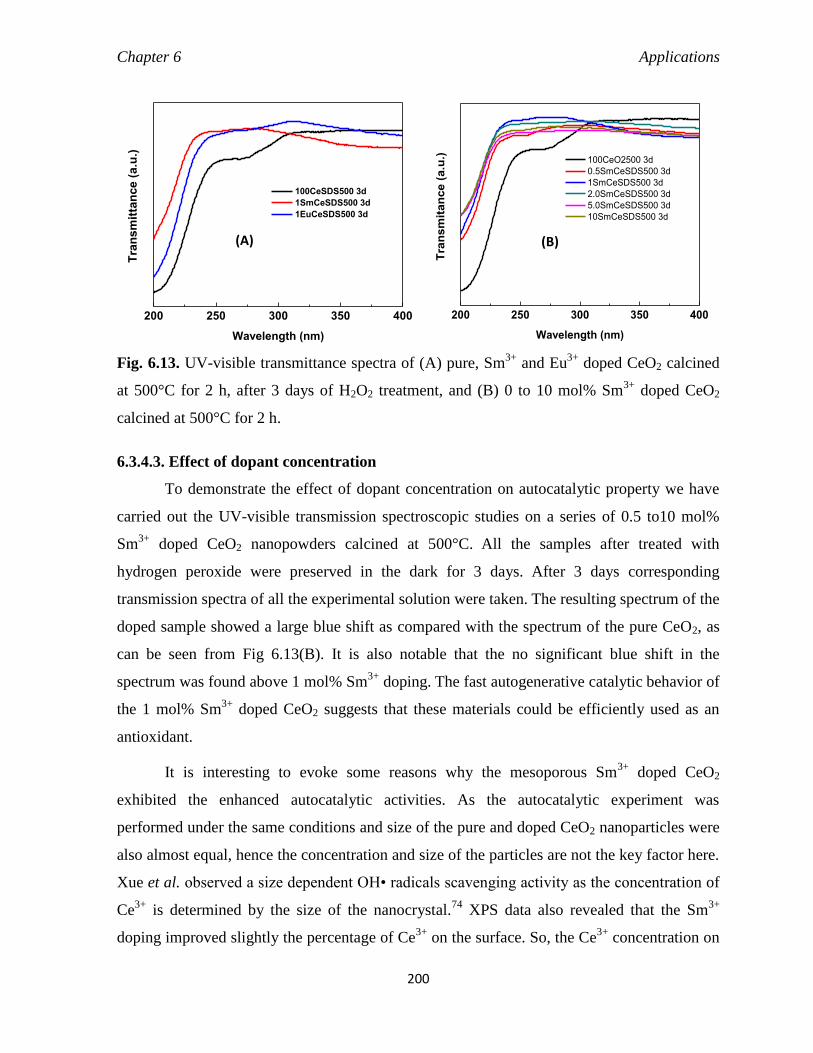
Chapter 6 Applications
200
200 250 300 350 400
Tra
nsm
itta
nce (
a.u
.)
Wavelength (nm)
100CeSDS500 3d
1SmCeSDS500 3d
1EuCeSDS500 3d
200 250 300 350 400
Tra
nsm
itan
ce (
a.u
.)
Wavelength (nm)
100CeO2500 3d
0.5SmCeSDS500 3d
1SmCeSDS500 3d
2.0SmCeSDS500 3d
5.0SmCeSDS500 3d
10SmCeSDS500 3d
Fig. 6.13. UV-visible transmittance spectra of (A) pure, Sm3+
and Eu3+
doped CeO2 calcined
at 500°C for 2 h, after 3 days of H2O2 treatment, and (B) 0 to 10 mol% Sm3+
doped CeO2
calcined at 500°C for 2 h.
6.3.4.3. Effect of dopant concentration
To demonstrate the effect of dopant concentration on autocatalytic property we have
carried out the UV-visible transmission spectroscopic studies on a series of 0.5 to10 mol%
Sm3+
doped CeO2 nanopowders calcined at 500°C. All the samples after treated with
hydrogen peroxide were preserved in the dark for 3 days. After 3 days corresponding
transmission spectra of all the experimental solution were taken. The resulting spectrum of the
doped sample showed a large blue shift as compared with the spectrum of the pure CeO2, as
can be seen from Fig 6.13(B). It is also notable that the no significant blue shift in the
spectrum was found above 1 mol% Sm3+
doping. The fast autogenerative catalytic behavior of
the 1 mol% Sm3+
doped CeO2 suggests that these materials could be efficiently used as an
antioxidant.
It is interesting to evoke some reasons why the mesoporous Sm3+
doped CeO2
exhibited the enhanced autocatalytic activities. As the autocatalytic experiment was
performed under the same conditions and size of the pure and doped CeO2 nanoparticles were
also almost equal, hence the concentration and size of the particles are not the key factor here.
Xue et al. observed a size dependent OH• radicals scavenging activity as the concentration of
Ce3+
is determined by the size of the nanocrystal.74
XPS data also revealed that the Sm3+
doping improved slightly the percentage of Ce3+
on the surface. So, the Ce3+
concentration on
(A)
(B)
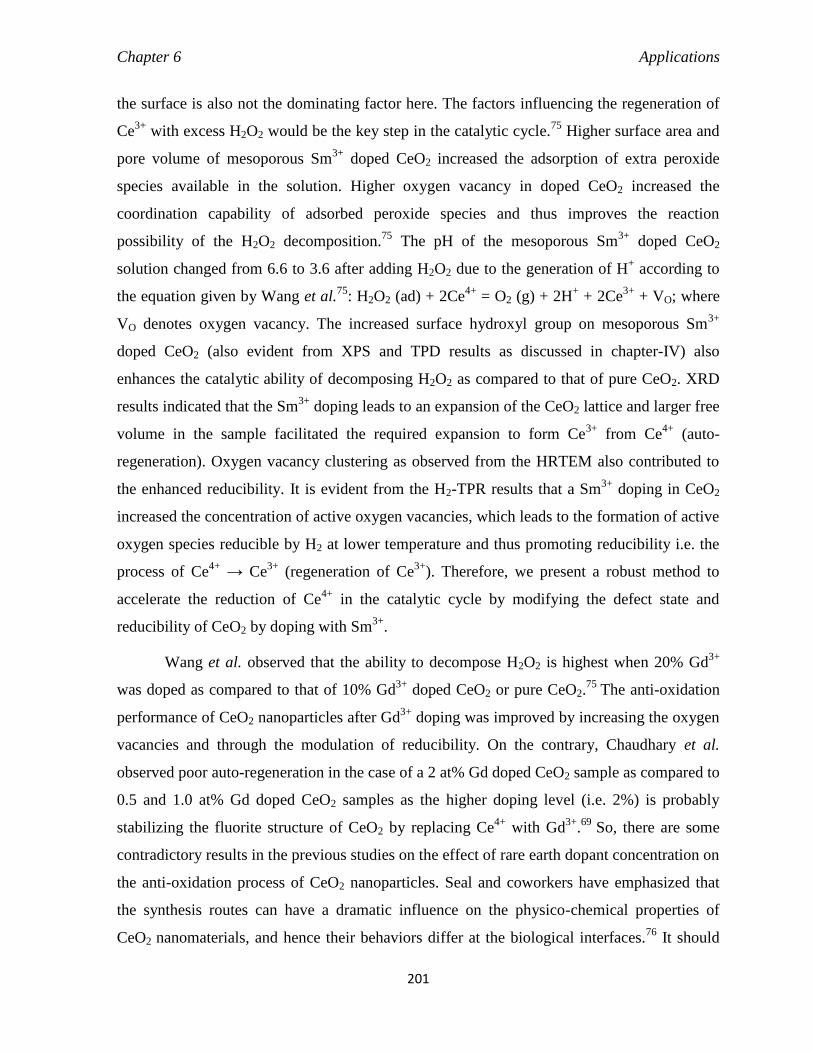
Chapter 6 Applications
201
the surface is also not the dominating factor here. The factors influencing the regeneration of
Ce3+
with excess H2O2 would be the key step in the catalytic cycle.75
Higher surface area and
pore volume of mesoporous Sm3+
doped CeO2 increased the adsorption of extra peroxide
species available in the solution. Higher oxygen vacancy in doped CeO2 increased the
coordination capability of adsorbed peroxide species and thus improves the reaction
possibility of the H2O2 decomposition.75
The pH of the mesoporous Sm3+
doped CeO2
solution changed from 6.6 to 3.6 after adding H2O2 due to the generation of H+ according to
the equation given by Wang et al.75
: H2O2 (ad) + 2Ce4+
= O2 (g) + 2H+ + 2Ce
3+ + VO; where
VO denotes oxygen vacancy. The increased surface hydroxyl group on mesoporous Sm3+
doped CeO2 (also evident from XPS and TPD results as discussed in chapter-IV) also
enhances the catalytic ability of decomposing H2O2 as compared to that of pure CeO2. XRD
results indicated that the Sm3+
doping leads to an expansion of the CeO2 lattice and larger free
volume in the sample facilitated the required expansion to form Ce3+
from Ce4+
(auto-
regeneration). Oxygen vacancy clustering as observed from the HRTEM also contributed to
the enhanced reducibility. It is evident from the H2-TPR results that a Sm3+
doping in CeO2
increased the concentration of active oxygen vacancies, which leads to the formation of active
oxygen species reducible by H2 at lower temperature and thus promoting reducibility i.e. the
process of Ce4+
→ Ce3+
(regeneration of Ce3+
). Therefore, we present a robust method to
accelerate the reduction of Ce4+
in the catalytic cycle by modifying the defect state and
reducibility of CeO2 by doping with Sm3+
.
Wang et al. observed that the ability to decompose H2O2 is highest when 20% Gd3+
was doped as compared to that of 10% Gd3+
doped CeO2 or pure CeO2.75
The anti-oxidation
performance of CeO2 nanoparticles after Gd3+
doping was improved by increasing the oxygen
vacancies and through the modulation of reducibility. On the contrary, Chaudhary et al.
observed poor auto-regeneration in the case of a 2 at% Gd doped CeO2 sample as compared to
0.5 and 1.0 at% Gd doped CeO2 samples as the higher doping level (i.e. 2%) is probably
stabilizing the fluorite structure of CeO2 by replacing Ce4+
with Gd3+
.69
So, there are some
contradictory results in the previous studies on the effect of rare earth dopant concentration on
the anti-oxidation process of CeO2 nanoparticles. Seal and coworkers have emphasized that
the synthesis routes can have a dramatic influence on the physico-chemical properties of
CeO2 nanomaterials, and hence their behaviors differ at the biological interfaces.76
It should
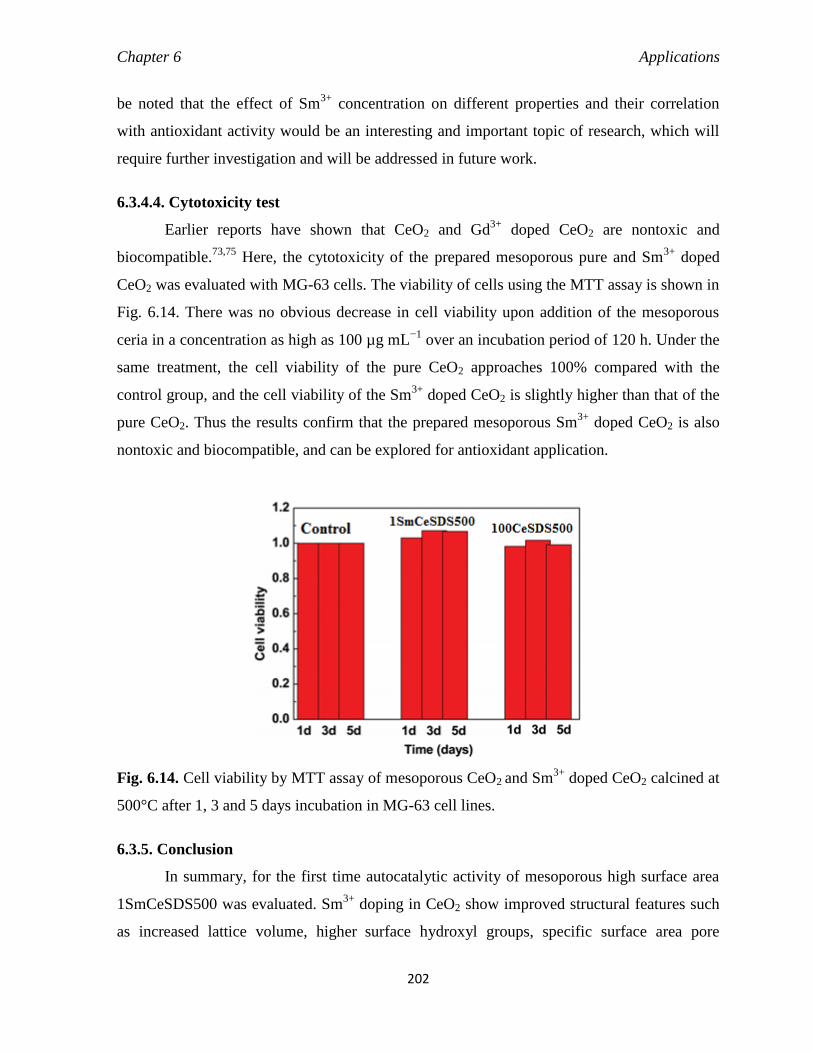
Chapter 6 Applications
202
be noted that the effect of Sm3+
concentration on different properties and their correlation
with antioxidant activity would be an interesting and important topic of research, which will
require further investigation and will be addressed in future work.
6.3.4.4. Cytotoxicity test
Earlier reports have shown that CeO2 and Gd3+
doped CeO2 are nontoxic and
biocompatible.73,75
Here, the cytotoxicity of the prepared mesoporous pure and Sm3+
doped
CeO2 was evaluated with MG-63 cells. The viability of cells using the MTT assay is shown in
Fig. 6.14. There was no obvious decrease in cell viability upon addition of the mesoporous
ceria in a concentration as high as 100 µg mL−1
over an incubation period of 120 h. Under the
same treatment, the cell viability of the pure CeO2 approaches 100% compared with the
control group, and the cell viability of the Sm3+
doped CeO2 is slightly higher than that of the
pure CeO2. Thus the results confirm that the prepared mesoporous Sm3+
doped CeO2 is also
nontoxic and biocompatible, and can be explored for antioxidant application.
Fig. 6.14. Cell viability by MTT assay of mesoporous CeO2 and Sm3+
doped CeO2 calcined at
500°C after 1, 3 and 5 days incubation in MG-63 cell lines.
6.3.5. Conclusion
In summary, for the first time autocatalytic activity of mesoporous high surface area
1SmCeSDS500 was evaluated. Sm3+
doping in CeO2 show improved structural features such
as increased lattice volume, higher surface hydroxyl groups, specific surface area pore
Chapter 6 Applications
203
volume, and Ce3+
and oxygen vacancies concentrations, and enhanced the reduction
behaviour of CeO2 which has been already discussed in Chapter (IV), leading to enhanced
autocatalytic activity. Ce4+
/Ce3+
recycle is easier for 1SmCeSDS500 sample than that for the
100CeSDS500 or 1EuCeSDS500 sample, which results in an improved autocatalytic activity.
These results suggest that high surface area, mesoporous and surface defects engineered Sm3+
doped CeO2 are very promising materials for multifunctional applications including waste
water treatment and antioxidant application.
References
1. M. C. Golonka, Polyhedron, 1995, 15, 3667.
2. C. Raji and T.S. Anirudhan, Water Res., 1998, 32, 3772.
3. V. Sarin and K. K. Pant, Bioresour. Technol., 2006, 97, 15.
4. Y. Zeng, H. Woo, G. Lee, and J. Park, Microporous Mesoporous Mater., 2010, 130, 83.
5. B. C. Schneider, Constant, L. Stephanie, Patierno, R. Steven, R. A. Jurjus, and S. M. Ceryak, Toxicol. Appl.
Pharm., 2012, 259, 38.
6. B. D. Kerger, W. J. Butler, D. J. Paustenbach, J. Zhang, and S. Li, J. Toxicol. Environ. Health A., 2009, 72, 329.
7. A. K. Kopec, S. Kim, A. L. Forgacs, T. R. Zacharewski, D. M. Proctor, M. A. Harris, L. C. Haws, and C. M.
Thompson, Toxicol. Appl. Pharmacol., 2012, 259, 13.
8. H. Dai, J. Liu, L. H. Malkas, J. Catalano, S. Alagharu, and R. J. Hickey, Toxicol. Appl. Pharmacol., 2009,
236, 154.
9. D. Mohan, K.P. Singh and V. K. Singh, Ind. Eng. Chem. Res., 2005, 44, 1027.
10. WHO, 2nd ed., Guidelines for Drinking Water Quality, vol. 1, World Health Organization, Geneva, 1993.
11. D. Mohan and C. U. Pittman Jr., J. Hazard. Mater. B., 2006, 137, 762.
12. S. M. Nomanbhay and K. Palanisamy, Elect. J. Biotechnol., 2005, 8, 43.
13. S. Babel and T.A. Kurniawan, J. Hazard. Mater. B., 2003, 97, 219.
14. A. M. Raichur and M.J. Basu, Sep. Purif. Technol., 2001, 24, 121.
15. S. Recillas, J. Colon, E. Casals, E. González, V. Puntes, A. Sánchez and X. Font, J. Hazard. Mater., 2010,
184, 425.
16. H. Y. Xiao, Z. H. Ai and L. Z. Zhang, J. Phys. Chem. C, 2009, 113, 16625.
17. L. S. Zhong, J. S. Hu, A. M. Cao, Q. Liu, W. G. Song and L. J. Wan, Chem. Mater., 2007, 19, 1648.
18. C. Y. Cao, Z. M. Cui, C. Q. Chen, W. G. Song and W. Cai, J. Phys. Chem. C, 2010, 114, 9865.
19. M. Kobayashi and M. F. Stephanopoulos, Ind. Eng. Chem. Res., 2002, 41, 3115.
20. S. Watanabe, S. Velu, X. Ma and C. Song, Prepr. Pap. Am. Chem. Soc., Div. Fuel Chem. 2003, 48, 695.
21. Z. Li and M. Stephanopoulos, Ind. Eng. Chem. Res., 1997, 36, 187.
22. A. D. Mayernick, R. Li, K. M. Dooley and M. J. Janik , J. Phys. Chem. C, 2011, 115, 24178.

Chapter 6 Applications
204
23. D. H. Lim, H. S. Kim, S. P. Yoon, J. Han, C.W. Yoon, S. H. Choi, S. W. Nam and H. C. Ham, Phys. Chem.
Chem. Phys., 2014, 16, 10727.
24. F. S. Freyria, B. Bonelli, R. Sethi, M. Armandi, E. Belluso and E. Garrone, J. Phys. Chem. C, 2011, 115,
24143.
25. A. Ozcan, M. A. Oturan, N. Oturan and Y. S ¨ ¸ahin, J. Hazard. Mater., 2009, 163, 1213.
26. V. K. Gupta, A. Mittal, V. Gajbe and J. Mittal, Ind. Eng. Chem. Res., 2006, 45, 1446.
27. G. Neri, A. Pistone, C. Milone and S. Galvagno, Appl. Catal., B, 2002, 38, 321.
28. B. Qiu, M. Xing and J. Zhang, J. Am. Chem. Soc., 2014, 136,5852.
29. Y.-G. Peng, J.-L. Ji, Y.-L. Zhang, H.-X. Wan and D.-J. Chen,Environ. Prog. Sustainable Energy, 2013, 33, 123.
30. J. B. Joo, I. Lee, M. Dahl, G. D. Moon, F. Zaera and Y. Yin, Adv.Funct. Mater., 2013, 23, 4246.
31. P. V. Nidheesh, R. Gandhimathi and S. T. Ramesh, Environ.Sci. Pollut. Res., 2013, 20, 2099.
32. G. Moon, W. Kim, A. D. Bokare, N. Sung and W. Choi, EnergyEnviron. Sci., 2014, 7, 4023.
33. S. Shibata, T. Suenobu and S. Fukuzumi, Angew. Chem., Int.Ed., 2013, 52, 12327.
34. P. Ji, J. Zhang, F. Chen and M. Anpo, J. Phys. Chem. C, 2008,112, 17809.
35. T. Feng, X. Wang and G. Feng, Mater. Lett., 2013, 100, 36.
36. P. Ji, J. Zhang, F. Chen and M. Anpo, Appl. Catal., B, 2009, 85, 148.
37. D. Sun, M. Gu, R. Li, S. Yin, X. Song, B. Zhao, C. Li, J. Li,Z. Feng and T. Sato, Appl. Surf. Sci., 2013,
280, 693.
38. F. Chen, X. Shen, Y. Wang and J. Zhang, Appl. Catal., B, 2012,121–122, 223.
39. S. Hu, F. Zhou, L. Wang and J. Zhang, Catal. Commun., 2011,12, 794.
40. S. Yuan, Q. Zhang, B. Xu, Z. Jin, Y. Zhang, Y. Yang, M. Zhangand T. Ohno, RSC Adv., 2014, 4, 62255.
41. W. Cai, F. Chen, X. Shen, L. Chen and J. Zhang, Appl. Catal.,B, 2010, 101, 160.
42. A. L. Gal and S. Abanades, J. Phys. Chem. C, 2012, 116, 13516.
43. V. V. Ursaki, V. Lair, L. Zivkovi ˙ ´ c, M. Cassir, A. Ringuede andO. Lupan, Opt. Mater., 2012, 34, 1897.
44. N. Sutradhar, A. Sinhamahapatra, S. Pahari,M. Jayachandran, B. Subramanian, H. C. Bajaj and A. B. Panda,
J. Phys. Chem. C, 2011, 115, 7628.
45. Y.-P. Fu, S.-B. Wen and C.-H. Lu, J. Am. Ceram. Soc., 2008, 91,127.
46. J. Chen, S. Patil, S. Seal and J. F. McGinnis, Nat. Nanotechnol.,2006, 1, 142.
47. X. Liu, K. Zhou, L. Wang, B. Wang and Y. Li, J. Am. Chem.Soc., 2009, 131, 3140.
48. Y. Q. Wang, H. M. Cheng, Y. Z. Hao, J. M. Ma, W. H. Li and S. M. Cai, Thin Solid Films, 1999, 349, 120.
49. P. Borker and A. V. Salker, Mater. Chem. Phys., 2007, 103, 366.
50. C.-Y. Cao, Z.-M. Cui, C.-Q. Chen, W.-G. Song and W. Cai, J.Phys. Chem. C, 2010, 114, 9865.
51. M. Godinho, C. Ribeiro, E. Longo and E. R. Leite, Cryst.Growth Des., 2008, 8, 384.
52. M. M. Natile, G. Boccaletti and A. Glisenti, Chem. Mater.,2005, 17, 6272.
53. U. G. Akpan and B. H. Hameed, J. Hazard. Mater., 2009, 170,520.
54. J. Wang, J. Wang, Q. Sun, W. Wang, Z. Yan, W. Gong and L. Min, J. Mater. Chem., 2009, 19, 6597.
55. C. Bauer, P. Jacques and A. Kalt, Chem. Phys. Lett., 1999, 307, 397.
56. K. Vinodgopal and P. V. Kamat, Environ. Sci. Technol., 1995, 29, 841.
Chapter 6 Applications
205
57. M. Stylidi, D. I. Kondarides and X. E. Verykios, Appl. Catal., B, 2004, 47, 189.
58. N. S. Arul, D. Mangalaraj, P. C. Chen, N. Ponpandian and C. Viswanathan, Mater. Lett., 2011, 65, 3320.
59. J. Schneider, M. Matsuoka, M. Takeuchi, J. Zhang, Y. Horiuchi, M. Anpo and D. W. Bahnemann, Chem.
Rev., 2014, 114, 9919.
60. H. Song, G. Zhou, C. Wang, X. Jiang, C. Wu and T. Li, Res. Chem. Intermed., 2013, 39, 747.
61. Q. Xiao, Z. Si, J. Zhang, C. Xiao and X. Tan, J. Hazard. Mater., 2008, 150, 62.
62. Y. Tang, H. Zhou, K. Zhang, J. Ding, T. Fan and D. Zhang, Chem. Eng. J., 2015, 262, 260.
63. D. de la Cruz, J. C. Arevalo, G. Torres, R. G. Bautista Margulis, C. Ornelas and A. Aguilar-Elguezabal,
Catal. Today, 2011, 166, 152.
64. I. Celardo, J. Z. Pedersen, E. Traversa and L. Ghibelli, Nanoscale, 2011, 3, 1411.
65. M. Li, P. Shi, C. Xu, J. S. Ren and X. G. Qu, Chem. Sci., 2013, 4, 2536.
66. A. Karakoti, S. Singh, J. M. Dowding, S. Seal and W. T. Self, Chem. Soc. Rev., 2010, 39, 4422.
67. J. M. Perez, A. Asati, S. Nath and C. Kaittanis, Small, 2008, 5, 552.
68. S. Kar, C. Patel and S. Santra, J. Phys. Chem. C, 2009, 113, 4862.
69. Y. S. Chaudhary, S. Panigrahi, S. Nayak, B. Satpati, S. Bhattacharjee, and N. Kulkarni, J. Mater. Chem., 2010,
20, 2381.
70. F. Muhammad, A. Wang, W. Qi, S. Zhang and G. Zhu, ACS Appl. Mater. Interfaces, 2014, 6, 19424.
71. Y. Zhang, K. Zhou, Y. Zhai, F. Qin, L. Pan and X. Yao, RSC Adv., 2014, 4, 50325.
72. M. Das, S. Patil, N. Bhargava, J. F. Kang, L. M. Riedel, S. Seal and J. J. Hickman, Biomaterials, 2007, 28, 1918.
73. A. S. Karakoti, S. Singh, A. Kumar, M. Malinska, S. V. N. T. Kuchibhatla, K. Wozniak, W. T. Self and S. Seal, J.
Am. Chem. Soc., 2009, 131, 14144.
74. Y. Xue, Q. Luan, D. Yang, X. Yao and K. Zhou, J. Phys. Chem. C, 2011, 115, 4433.
75. Y.-J. Wang, H. Dong, G.-M. Lyu, H.-Y. Zhang, J. Ke, L.-Q. Kang, J.-L. Teng, L.-D. Sun, R. Si, J. Zhang, Y.-J.
Liu, Y.-W. Zhang, Y.-H. Huang and C.-H. Yan, Nanoscale, 2015, 7, 13981.
76. A. Kumar, S. Das, P. Munusamy, W. Self, D. R. Baer, D. C. Saylee and S. Seal, Environ. Sci.: Nano, 2014, 1,
516.

Chapter 7 Conclusions
206
Chapter 7
Conclusion and Recommendation for Future Works
Outline
This is the last chapter of the thesis that discusses the summary of the outcomes of this
research work, frameworks precise conclusions drawn from both the experimental and
investigative efforts and proposes ideas and directions for future research scope as follows.
7.1. Summary and Conclusion
The chapter wise summary and conclusion of the thesis is given below
Chapter 1:
This chapter comprised a general introduction and thorough literature survey on
cerium oxide and its composite oxides including structural, properties, synthesis strategies
and potential applications. A short introduction of nanomaterials also includes. Synthesis and
application of mesoporous materials has also been discussed. Synthesis of mesoporous CeO2
and CeO2-based mixed oxides via templating method particularly, both the soft-templating
and hard templating methods are reviewed. Applications of mesoporous CeO2 and CeO2-
based oxides were also briefed with prominence to adsorption and removal of organic
pollutants from aqueous solution. The main objectives of the present work are summarized
towards the end of this chapter.
Chapter 7 Conclusions
207
Chapter 2:
This chapter deals with the synthetic methodology adopted for the synthesis of pure as
well as samarium (Sm3+
) and europium (Eu3+
) doped ceria (CeO2) and their characterization
by various sophisticated instrumental techniques employed in the present study to
understanding a complete structural, optical and spectroscopic properties such as
thermogravimetric analysis/differential scanning calorimetry (TGA/DSC), X-ray diffraction
(XRD), BET-BJH-surface area and pore size analysis, Fourier transform-infra red
spectroscopy (FTIR), UV-visible diffuse reflectance spectroscopy (UV-vis DRS), X-ray
photoelectron spectroscopy (XPS), field emission scanning electron microscopy (FESEM),
high resolution transmission electron microscopy (HRTEM), temperature programmed
reduction (TPR) and temperature programmed desorption (TPD).
Chapter 3:
This chapter focuses on the synthesis of pure ceria using surfactants as structure-
directing agents and analysis of the samples using various characterization techniques. Effect
of surfactant on the crystallization behavior, thermal properties, phase stability and
morphology of CeO2 has been investigated. The mesoporous CeO2 samples showed broad and
intense visible PL emission spectra when excited with light of wavelength 325 nm ascribed to
surface defects or oxygen vacancies. Thermal analysis showed that as-synthesized CeO2
samples obtained in surfactant mediated route showed a lower % of weight loss than nano
powder obtained in surfactant free route which revealed that the surfactant molecule promote
the crystalline phase transformation in as synthesized nano powder even at low temperature
at100C. The better formation of cubic phase nanocrystal ceria in surfactant mediated route
was further supported by XRD results. The surfactant mediated synthesized CeO2 samples
showed significantly better control over the reduction in the surface area that occurred during
the heat treatments than the CeO2 sample synthesized by surfactant free method. XPS analysis
confirms the existence of mixed valence states (Ce3+
and Ce4+
) in the nanocrystals.
Chapter 4:
This chapter focuses on the characterization of formation of nanocrystalline and high
surface area mesoporous samarium doped CeO2 samples with varying samarium content (0.5,
1, 2 and 5 mol %) prepared by co-precipitation of [(NH4)2Ce(NO3)6] and Sm2O3 using

Chapter 7 Conclusions
208
NH4OH as precipitating agent and SDS as template. Characterization of the synthesized
samples using several characterization techniques was also discussed in detail. For the
purpose of comparison, the representative sample 1 mol% Sm3+
doped CeO2 were also
synthesized by dodecyl amine (DDA) and polyethylene glycol (PEG) assisted route. In
addition the influence of microwave reflux method on the structural and optical properties of
the representative sample 1 mol% Sm3+
doped CeO2 nanopowder were also evaluated. XRD
studies along with HRTEM results confirmed the formation of mesoporous nanocrystalline
CeO2 at a lower temperature as low as 100°C. UV-vis absorption spectra of the samples
showed strong absorption in the UV region and good transmittance in the visible region. The
enhanced PL emission spectra of mesoporous Sm3+
doped CeO2 show narrow bands arising
from the 4G5/2→6H5/2 and 4G5/2→6H7/2 transitions of Sm3+
ion. The results of H2-TPR
profiles show that the total H2 consumption amount of Sm3+
doped CeO2 is much higher
(69.16 mg/g) than that of pure CeO2 (14.42 mg/g). It is clear from the NH3-TPD profiles that
the Sm3+
incorporation into CeO2 lattice induces an increase in the weak acidic sites and
created more number of strong acidic sites as compared to pure CeO2. High-resolution XPS
spectrum confirms the doping of Sm3+
in CeO2.
Chapter 5:
This chapter focuses on the characterization of formation of nanocrystalline and high
surface area mesoporous europium doped CeO2 samples with 0.5, 1, 2, and 5 mol% europium
content obtained in a SDS assisted homogeneous precipitation route followed by conventional
reflux method. At the same time the influence of microwave reflux method on the structural
properties were also evaluated. BET sorption isotherms displaying type IV adsorption
isotherm indicative of mesoporous structure containing some micropores. A detailed analysis
revealed that Eu3+
doping in to CeO2 has increased the lattice volume, surface area, mesopore
volume and engineered the surface defects. The as-prepared sample of 1 mol% europium
doped ceria possesses high surface area of 234 m2.g
-1 with average pore diameter of 4 nm. On
thermal treatment at 500°C, a high-quality surfactant-free nanoparticles with surface area of
148 m2.g
-1 and larger average pore sizes of 5.5 nm, respectively, were formed. The high
degree of crystallinity was further supported from the HRTEM images composed of well-
defined lattice fringes. All the nanopowder exhibit sharp peaks in the emission spectra upon

Chapter 7 Conclusions
209
excitation at 325 nm. The presence of Eu3+
ions in Eu3+
doped CeO2 nanocrystals was also
recognized by xps analysis.
Chapter 6:
This chapter discusses the application of synthesized nanopowder for environmental
remediation such as adsorption of Cr(VI) from aqueous solution photocatalytical degradation
of the organic dye (AO7). In order to study the adsorption behavior, high surface area,
mesoporous samaria doped ceria (1SmCeSDSasp) nanopowders were used for the removal of
Cr(VI) ions from aqueous solutions. The effects of contact time, initial sorbate concentration,
pH and dose of adsorbent on Cr(VI) adsorption were studied to optimize the conditions for
maximum adsorption. The kinetics of the adsorption has been studied. The sorption
characteristics have been modeled using Langmuir and Freundlich isotherms. In addition
samaria doped ceria (1SmCeSDSMW500) nanopowders were also successfully used as
remarkably efficient new photocatalysts for degradation of a representative azo dye Acid
Orange 7 (AO7) in aqueous medium under natural sunlight without addition of any external
reagents like peroxides, acid or base. The effects of calcination temperature, pH of the
medium, catalyst dosage and irradiation time on the decolorization of AO7 were investigated
and discussed in this chapter. Sm3+
doping in CeO2 narrowed the band gap and significantly
enhanced the photocatalytic degradation of the azo dye. The photocatalytic degradation of
AO7 is also investigated by using certain radical scavengers and the results suggest that under
solar-light irradiation predominantly positive holes and super oxide radicals (O2• −
) act as the
active species in the degradation process. Our results suggest these materials developed here
are promising alternative solar light sensitive photocatalyst. The auto-catalytic anti-oxidant
behavior of all the nano powder pure CeO2 (100CeSDS50) and Sm3+
doped CeO2
(1SmCeSDS500) and Eu3+
doped CeO2 (1EuCeSDS500) were evaluated by treating with H2O2.
7.2. New Achievements and Implications
The major achievements and implications achieved from this research work are as
follows:
Simple chemical routes have been developed using cheaper metal inorganic precursor
to derive a high quality mesoporous pure CeO2 as well as Sm
3+, and Eu
3+ doped CeO2.
Chapter 7 Conclusions
210
XRD results showed that even as-prepared material have cubic fluorite structure of CeO2
with no crystalline impurity phase. Thereby, confirming the ability of the present
aqueous based synthetic approach to prepare mesoporous crystalline CeO2 at 100°C.
Both the mesoporous pure CeO2 and rare earth (Sm3+
, and Eu3+
) doped CeO2 possess
high BET surface area and surfactant assisted route retard the decrease of surface area
during calcination as well as mesoporosity of the samples well retained up to 650°C.
Substantially high content of Ce3+
was found in CeO2.
These high surface area materials exhibited notable adsorption and effective removal of
Cr(VI) from aqueous solutions at room temperature and without any adjustment of pH.
1SmCeSDSMW500 samples could effectively photodegrade AO7 dye under natural
sunlight.
Mesoporous 1SmCeSDS500 samples also exhibited excellent autocatalytical properties.
Both pure and doped CeO2 nanocrystals possesses strong absorption properties near
the ultraviolet region revealed the possibility of these materials to be used as better UV
blockers.
Sm3+
and Eu3+
doped CeO2 nanopowder showed enhanced photoluminescence.
These novel high surface area CeO2 materials developed in this work are important for
a variety of applications in catalysts, membranes, optical materials, structural devices,
sensors, adsorbents, environmental pollution control, and other applications.
7.3. Further scope of the work
The novel piece of the research work carried out in this investigation have tremendous
scope of future research. Some of these points may be mentioned as follows.
Applications of the prepared material for various catalysis reactions.
Electrical, optical, and dielectric properties in pure, Sm3+
or Eu3+
doped CeO2 samples.
The prepared materials in the present study have good optical properties, which may
be utilized in various optical applications in future. The photoluminescence property
of doped CeO2 with various morphologies can also be explored.
The potential use of ceria based oxides in the field of SOFC can be analyzed.
To find out the potential use of synthesized nanoparticle for biomedical applications.
These mesoporous CeO2 materials can find remarkable environmental applications in
adsorption and removal of other toxic heavy metals e.g., As(III), As(V), Co(II), Cd(II),
etc. along with degradation of toxic organic compounds like dyes.
Extent the practical applications of the synthesized nanopowders in the bioremediation
of various dye effluents.

211
Bappaditya Mandal
26th
July, 1983
Nationality: Indian
Permanent address:
Vill-Bagdiha, PO-Bhuri
Dist-Burdwan, Pin-713378
West-Bengal
Present address:
Department of Chemistry
National Institute of Technology, Rourkela
Odisha-769008
Email: [email protected]
call@ +918908048510(Odisha)
call@ +917550813726(WB)
Academic profile:
Ph.D. (pursuing): In Materials Chemistry, Department of Chemistry, National Institute of
Technology, Rourkela, Odisha.
Thesis title: Surfactant Assisted Synthesis and Characterization of High Surface Area
Mesoporous Nanocrystalline Pure, Eu3+
and Sm3+
doped Ceria for Novel Applications
M.Sc (2007): Sambalpur University, Odisha, Spl: Organic Chemistry 1st Class.
B.Sc (2005): The University of Burdwan, West Bengal, Spl: Chemistry (Honors), physics
(pass), Math (pass), 2nd
Class.
12th
(2001): WBCHSE, West Bengal, Spl: Science, 1st Division.
10th
(1999): WBBSE, West Bengal, 1st Division.
Pre Doctoral Research Experience:
Project Assistant, CSIR-NML Jamshedpur, 26th
November 2007 to 30th
April 2010.
Project title: Recycling and Reuse of Electronic Waste.
Expertise/Techniques:
Instruments Handle:
Simultaneous thermal analysis (TG-DSC)
X-ray diffraction (XRD)
Fourier transform infrared spectroscopy (FTIR)
UV-visible spectroscopy(UV)
Photoluminescence spectroscopy (PL)
BET surface area analyzer (BET)
H2 temperature programmed reduction (TPR)
NH3 temperature programmed deposition (TPD)
212
Instruments Uses:
X-Ray Photo Electron Spectroscopy (XPS)
Field emission Scanning electron Microscope (FESEM)
High Resolution Transmitted Electron Microscope (HRTEM)
Publications:
Bappaditya Mandal and Aparna Mondal, “Solar Light Sensitive Samaria Doped Ceria
Photocatalysts: Microwave Synthesis, Characterization and Photodegradation of Acid
Orange 7 at Atmospheric Condition and in Absence of Any Oxidizing Agents” RSC
Adv., 2015, 5, 43081–43091.
Bappaditya Mandal, Aparna Mondal, Sirshendu Sekhar Ray and Amar Kundu “Sm
Doped Mesoporous CeO2 Nanocrystals: Aqueous Solution-Based Surfactant Assisted
Low Temperature Synthesis, Characterization and Their Improved Autocatalytic
Activity” Dalton Trans., 2016, 45, 1679–1692.
Bappaditya Mandal, Aparna Mondal “Effect of Surfactant on the Structural and
Optical Properties of Nanocrystalline Ceria” Under Preparation.
Conference:
Bappaditya Mandal, Priyadarshini Nayak, and Aparna Mondal, “Surfactant Assisted
Synthesis and Characterization of High Surface Area Samaria doped Ceria
Nanoparticles for Novel Applications” National Seminars on Recent Trends in
Condensed Matter Physics Including Laser Application (FNSCMPLA 2012), March
6-7, 2012. Department of Physics Centre of Advanced Study The University of
Burdwan, Golapbag, Burdwan.
Bappaditya Mandal, Dayanidhi Mohanta, and Aparna Mondal, “Synthesis of Visible
Light Responsive Titania Photocatlyst” (ICMAT-2013),7th
International Conference
On Materials for Advance Technologies 30th
June To 5th
July 2013, Suntectcity ,
Singapore.
Bappaditya Mandal, Bibhuti bhusan Nayak, and Aparna Mondal, “Effect of Surfactant
on the Structural and Optical Properties of Nanocrystalline Ceria” International
Conference on Functional Materials(ICFM-2014) February 5–7, 2014 Materials
Science Centre Indian Institute of Technology, Kharagpur, 721 302.
Bappaditya Mandal and Aparna Mondal, “Structural And Optical Properties Of Well-
Crystallized Samaria Doped Ceria Nanophosphor Prepared By Surfactant Assisted
Route” Advance in Chemistry and Their Biological and Industrial Relevance (ACBIR-
2014), January 10-11, 2014, Department of chemistry NIT Rourkela.