Embed Size (px)
Citation preview
NO
AA
’s S
TA
TE
OF
TH
E C
OA
ST
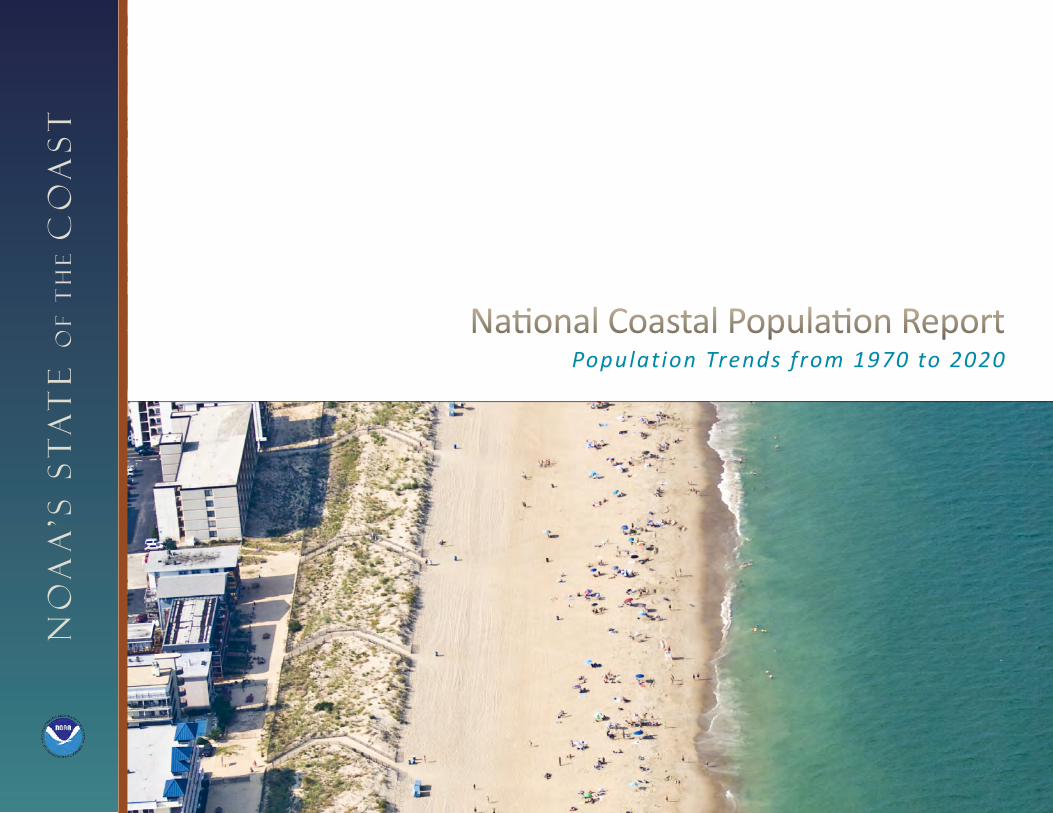
National Coastal Population ReportPopulation Trends from 1970 to 2020
Dear Reader,
This National Coastal Population Report continues the commitment by NOAA’s National Ocean Service to describe the nation’s coastal population, as a complement to the decadal Census conducted by the U.S. Census Bureau. One of our nation’s ongoing challenges is to manage ecologically sensitive coastal areas such that future generations of Americans will continue to reap the immeasurable economic, cultural, recreational, and aesthetic benefits provided by our coastal resources. At the core of this management challenge are both the large numbers and high densities of residents and visitors at the coast.
This concentration of people impacts the integrity of coastal ecosystems, and at the same time, the lives and livelihoods of some of these residents and visitors can be at risk from natural processes at the coast – such as hurricanes, erosion, and sea level rise. This report explores this dynamic relationship by presenting both the population in Coastal Watershed Counties and in Coastal Shoreline Counties. Joined by our federal and state coastal management partners, we hope this reporting framework will both increase awareness and enhance policy discussions, by promoting a deeper understanding of our nation’s coastal population.
Holly BamfordAssistant Administrator for Ocean Services and Coastal ManagementNational Ocean ServiceNOAA
National Coastal Population ReportPopulation Trends from 1970 to 2020
This document is a product of the NOAA State of the Coast Report Series, a publication of the National
Oceanic and Atmospheric Administration, Department of Commerce, developed in partnership with the U.S.
Census Bureau. Visit: http://stateofthecoast.noaa.gov.
Table of Contents
Our Nation’s Coastal PopulationHow to Use this Document
The Bottom LineCoastal Shoreline Counties
PopulationPopulation DensityAgeRaceHispanic OriginEducation AttainmentHousehold IncomeSeasonal HousingBuilding PermitsCoastal States Summary
Coastal Watershed CountiesPopulationPopulation DensityAgeRaceHispanic OriginEducation AttainmentHousehold IncomeSeasonal HousingBuilding PermitsCoastal States Summary
Appendix AAppendix BAppendix C
2
34
10
171819
March 2013
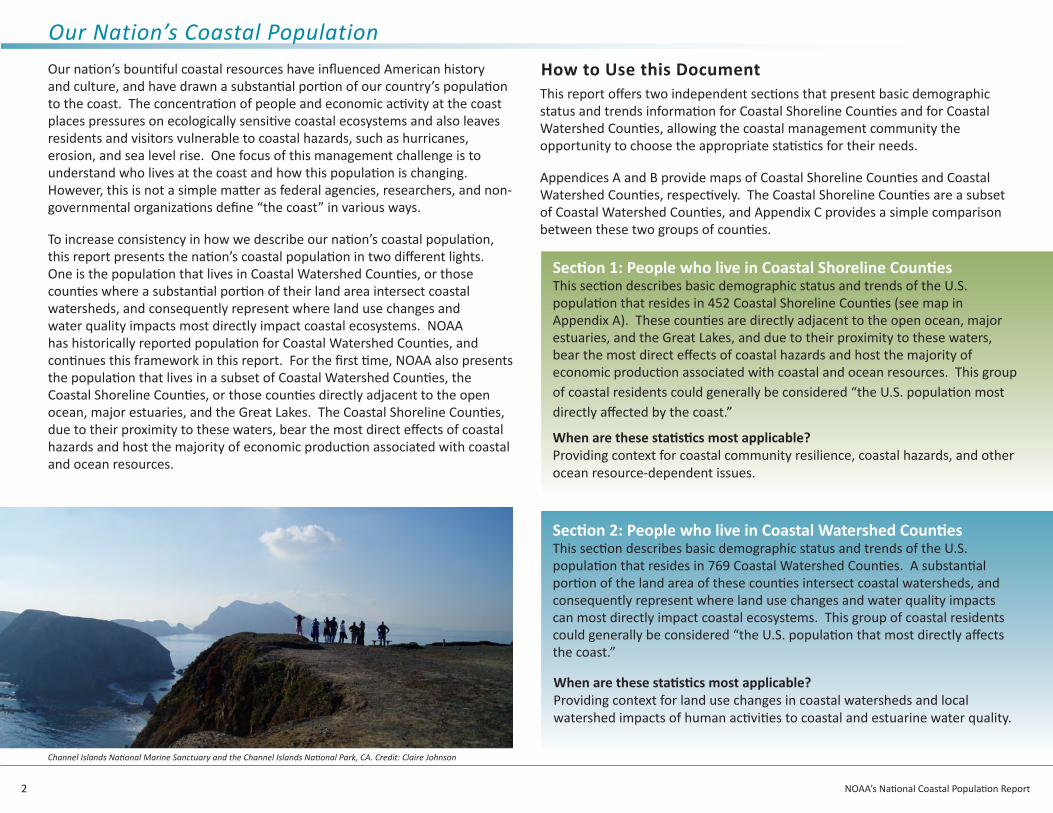
Our nation’s bountiful coastal resources have influenced American history and culture, and have drawn a substantial portion of our country’s population to the coast. The concentration of people and economic activity at the coast places pressures on ecologically sensitive coastal ecosystems and also leaves residents and visitors vulnerable to coastal hazards, such as hurricanes, erosion, and sea level rise. One focus of this management challenge is to understand who lives at the coast and how this population is changing. However, this is not a simple matter as federal agencies, researchers, and non-governmental organizations define “the coast” in various ways.
To increase consistency in how we describe our nation’s coastal population, this report presents the nation’s coastal population in two different lights. One is the population that lives in Coastal Watershed Counties, or those counties where a substantial portion of their land area intersect coastal watersheds, and consequently represent where land use changes and water quality impacts most directly impact coastal ecosystems. NOAA has historically reported population for Coastal Watershed Counties, and continues this framework in this report. For the first time, NOAA also presents the population that lives in a subset of Coastal Watershed Counties, the Coastal Shoreline Counties, or those counties directly adjacent to the open ocean, major estuaries, and the Great Lakes. The Coastal Shoreline Counties, due to their proximity to these waters, bear the most direct effects of coastal hazards and host the majority of economic production associated with coastal and ocean resources.
Our Nation’s Coastal Population
Section 2: People who live in Coastal Watershed Counties This section describes basic demographic status and trends of the U.S. population that resides in 769 Coastal Watershed Counties. A substantial portion of the land area of these counties intersect coastal watersheds, and consequently represent where land use changes and water quality impacts can most directly impact coastal ecosystems. This group of coastal residents could generally be considered “the U.S. population that most directly affects the coast.”
Section 1: People who live in Coastal Shoreline CountiesThis section describes basic demographic status and trends of the U.S. population that resides in 452 Coastal Shoreline Counties (see map in Appendix A). These counties are directly adjacent to the open ocean, major estuaries, and the Great Lakes, and due to their proximity to these waters, bear the most direct effects of coastal hazards and host the majority of economic production associated with coastal and ocean resources. This group of coastal residents could generally be considered “the U.S. population most directly affected by the coast.”
When are these statistics most applicable?Providing context for coastal community resilience, coastal hazards, and other ocean resource-dependent issues.
When are these statistics most applicable?Providing context for land use changes in coastal watersheds and local watershed impacts of human activities to coastal and estuarine water quality.
Channel Islands National Marine Sanctuary and the Channel Islands National Park, CA. Credit: Claire Johnson
2 NOAA’s National Coastal Population Report
How to Use this DocumentThis report offers two independent sections that present basic demographic status and trends information for Coastal Shoreline Counties and for Coastal Watershed Counties, allowing the coastal management community the opportunity to choose the appropriate statistics for their needs.
Appendices A and B provide maps of Coastal Shoreline Counties and Coastal Watershed Counties, respectively. The Coastal Shoreline Counties are a subset of Coastal Watershed Counties, and Appendix C provides a simple comparison between these two groups of counties.
3NOAA’s National Coastal Population Report
The Bottom Line
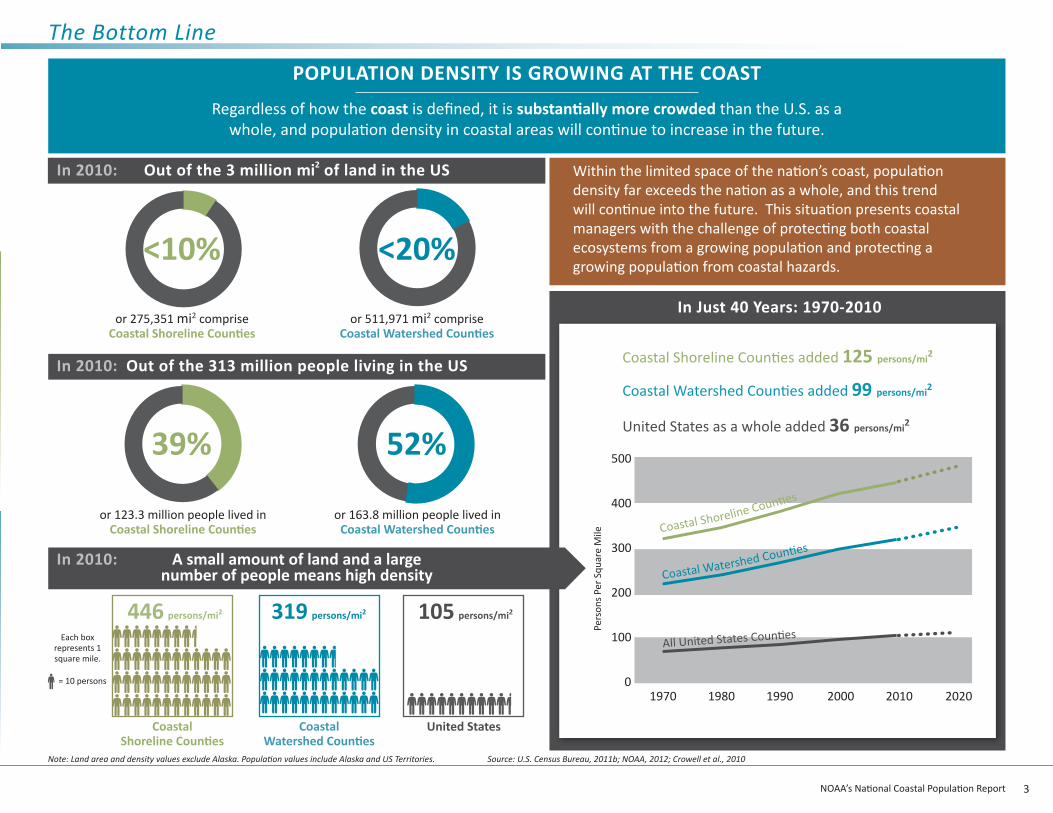
Regardless of how the coast is defined, it is substantially more crowded than the U.S. as a whole, and population density in coastal areas will continue to increase in the future.
Note: Land area and density values exclude Alaska. Population values include Alaska and US Territories. Source: U.S. Census Bureau, 2011b; NOAA, 2012; Crowell et al., 2010
POPULATION DENSITY IS GROWING AT THE COAST
Out of the 3 million mi2 of land in the US
Out of the 313 million people living in the US
A small amount of land and a large number of people means high density
<10%
or 275,351 mi2 comprise Coastal Shoreline Counties
or 511,971 mi2 comprise Coastal Watershed Counties
<20%
39% 52%
or 123.3 million people lived in Coastal Shoreline Counties
or 163.8 million people lived inCoastal Watershed Counties
Coastal Shoreline Counties
319 persons/mi2
United States
105 persons/mi2446 persons/mi2
Coastal Watershed Counties
1970 1980 1990 2000 2010 2020
Pers
ons P
er S
quar
e M
ile
500
400
300
200
100
0
All United States Counties
In Just 40 Years: 1970-2010
Coastal Shoreline Counties added 125 persons/mi2
Coastal Watershed Counties added 99 persons/mi2
United States as a whole added 36 persons/mi2
Within the limited space of the nation’s coast, population density far exceeds the nation as a whole, and this trend will continue into the future. This situation presents coastal managers with the challenge of protecting both coastal ecosystems from a growing population and protecting a growing population from coastal hazards.
In 2010:
In 2010:
In 2010:
= 10 persons
Each box represents 1 square mile.
Coastal Shoreline Counties
39%
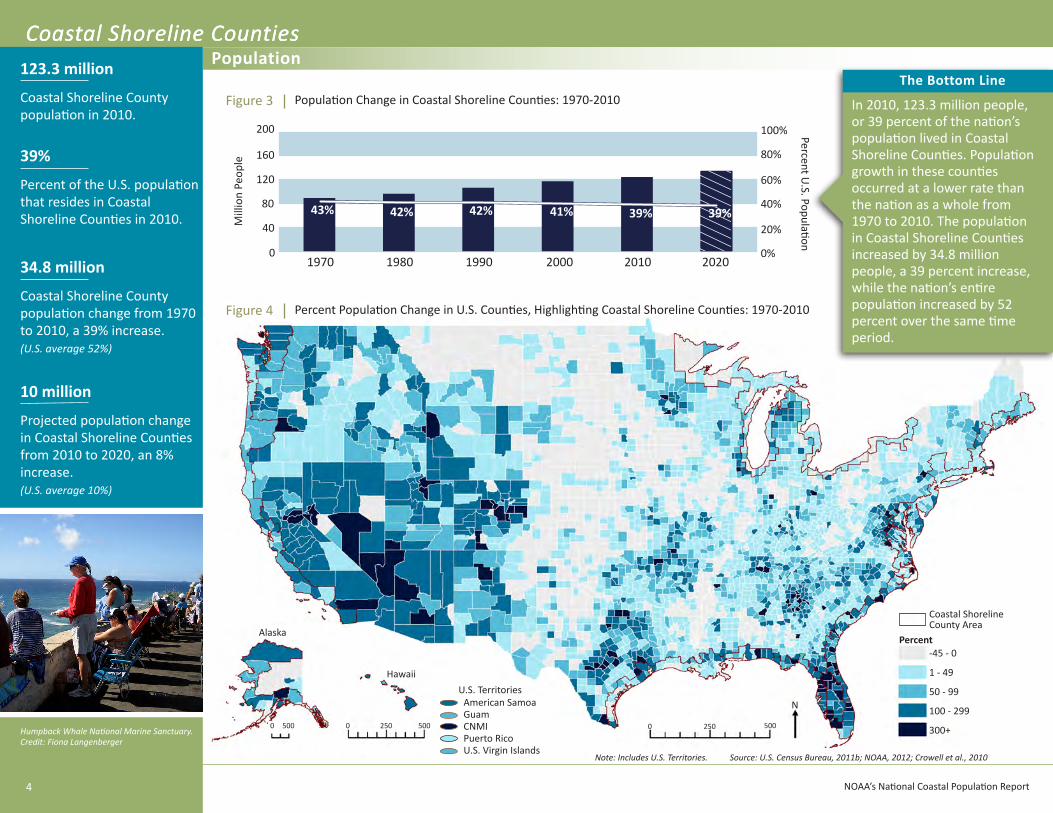
Percent of the U.S. population that resides in Coastal Shoreline Counties in 2010.
34.8 million
Coastal Shoreline County population change from 1970 to 2010, a 39% increase. (U.S. average 52%)
123.3 million
Coastal Shoreline County population in 2010.
Humpback Whale National Marine Sanctuary. Credit: Fiona Langenberger
10 million
Projected population change in Coastal Shoreline Counties from 2010 to 2020, an 8% increase. (U.S. average 10%)
Population Change in Coastal Shoreline Counties: 1970-2010Figure 3
Percent Population Change in U.S. Counties, Highlighting Coastal Shoreline Counties: 1970-2010Figure 4
1970 1980 1990 2000 2010 2020
Hawaii
AlaskaPercent
-45 - 0
1 - 49
50 - 99
100 - 299
300+0 250 500
American SamoaGuamCNMIPuerto RicoU.S. Virgin Islands
U.S. Territories
Coastal Shoreline County Area
Population
0 250 5000 500
4
Coastal Shoreline Counties
NOAA’s National Coastal Population Report
Source: U.S. Census Bureau, 2011b; NOAA, 2012; Crowell et al., 2010Note: Includes U.S. Territories.
200
120
40
160
80
0M
illio
n Pe
ople
100%
0%
20%
40%
60%
80%
Percent U.S. Population
43% 42% 42% 41% 39% 39%
The Bottom Line
In 2010, 123.3 million people, or 39 percent of the nation’s population lived in Coastal Shoreline Counties. Population growth in these counties occurred at a lower rate than the nation as a whole from 1970 to 2010. The population in Coastal Shoreline Counties increased by 34.8 million people, a 39 percent increase, while the nation’s entire population increased by 52 percent over the same time period.
N
Coastal Shoreline Counties
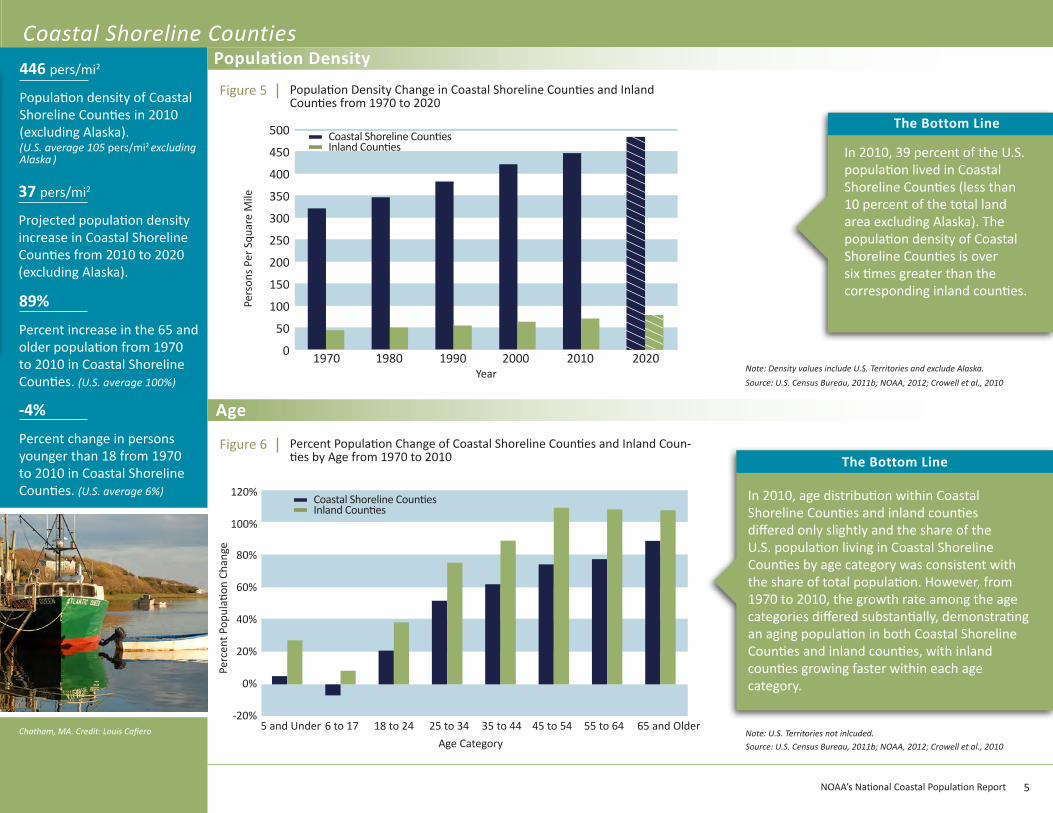
89%
Percent increase in the 65 and older population from 1970 to 2010 in Coastal Shoreline Counties. (U.S. average 100%)
-4%
Percent change in persons younger than 18 from 1970 to 2010 in Coastal Shoreline Counties. (U.S. average 6%)
Chatham, MA. Credit: Louis Cafiero
Percent Population Change of Coastal Shoreline Counties and Inland Coun-ties by Age from 1970 to 2010
Figure 6
Population Density
Age
1970 1980 1990 2000 2010 2020
Pers
ons P
er S
quar
e M
ile
400
300
200
100
0
350
250
150
50
Population Density Change in Coastal Shoreline Counties and Inland Counties from 1970 to 2020
Figure 5
Year
500
450
446 pers/mi2
Population density of Coastal Shoreline Counties in 2010 (excluding Alaska). (U.S. average 105 pers/mi2 excluding Alaska )
37 pers/mi2
Projected population density increase in Coastal Shoreline Counties from 2010 to 2020 (excluding Alaska).
Coastal Shoreline CountiesInland Counties
5NOAA’s National Coastal Population Report
Source: U.S. Census Bureau, 2011b; NOAA, 2012; Crowell et al., 2010
Source: U.S. Census Bureau, 2011b; NOAA, 2012; Crowell et al., 2010Note: Density values include U.S. Territories and exclude Alaska.
Note: U.S. Territories not inlcuded.
The Bottom Line
In 2010, 39 percent of the U.S. population lived in Coastal Shoreline Counties (less than 10 percent of the total land area excluding Alaska). The population density of Coastal Shoreline Counties is over six times greater than the corresponding inland counties.
The Bottom Line
In 2010, age distribution within Coastal Shoreline Counties and inland counties differed only slightly and the share of the U.S. population living in Coastal Shoreline Counties by age category was consistent with the share of total population. However, from 1970 to 2010, the growth rate among the age categories differed substantially, demonstrating an aging population in both Coastal Shoreline Counties and inland counties, with inland counties growing faster within each age category.
18 to 246 to 175 and Under 25 to 34 35 to 44 45 to 54 55 to 64 65 and OlderAge Category
100%
0%
20%
40%
60%
80%
-20%
120%
Perc
ent P
opul
ation
Cha
nge
Coastal Shoreline CountiesInland Counties

Coastal Shoreline Counties
Miami, FL. Credit: B. O’Grady
Hispanic Origin
Race
0
20%
80%
40%
60%
American Indian and
Alaska Native Alone
Black or African
American Alone
White Alone
Asian Alone
Native Hawaiian and Pacific
Islander Alone
Some Other Race Alone
Two or More Races
Percent Population of Coastal Shoreline Counties and Inland Counties by Race in 2010
Figure 7 Share of the U.S. Population by Race in Coastal Shoreline Counties in 2010
Table 1
35%47%27%
64%60%
49%47%
White AloneBlack or African American AloneAmerican Indian and Alaska Native AloneAsian AloneNative Hawaiian and Pacific Islander AloneSome Other Race AloneTwo or More Races
Race CategoryPercent U.S. Population
Race Category
Total Population 39%
Percent of Population in Coastal Shoreline Counties
Percent of Population in Inland Counties
0 60% 100%80%20% 40%
Hispanic or Latino
Non Hispanic or Latino
49%37%
Hispanic or LatinoNon Hispanic or Latino
Ethnicity Category Percent U.S. Population
Percent Population of Coastal Shoreline Counties and Inland Counties by Hispanic or Latino Origin in 2010
Figure 8 Share of the U.S. Population by Hispanic or Latino Origin in Coastal Shoreline Counties in 2010
Table 2
Total Population 39%
Coastal Shoreline CountiesInland Counties
64%
Share of the U.S. Asian Alone population living in Coastal Shoreline Counties.(Share of total U.S. Population 39%)
211%
Percent increase in Hispanic or Latino population from 1980 to 2010 in Coastal Shoreline Counties. (U.S. average 220%)
Percent Population
6
Perc
ent P
opul
ation
Coastal Shoreline Counties
47%
Share of the U.S. Black or African American Alone population living in Coastal Shoreline Counties.(Share of total U.S. Population 39%)
NOAA’s National Coastal Population Report
Source: U.S. Census Bureau, 2011b; NOAA, 2012; Crowell et al., 2010
Source: U.S. Census Bureau, 2011b; NOAA, 2012; Crowell et al., 2010
Note: The U.S. Census Bureau uses the word “Alone” following certain race categories to distiquish those populations that chose a single race to characterize themselves. U.S. Territories not included.
Note: U.S. Territories not included.
The Bottom Line
In 2010, minority population groups residing in Coastal Shoreline Counties represented a combined 35 percent of the Coastal Shoreline County population. This is higher than the combined share of the total U.S. population at 28 percent.
Coastal Shoreline Counties
Santa Cruz, CA. Credit: K. Crossett
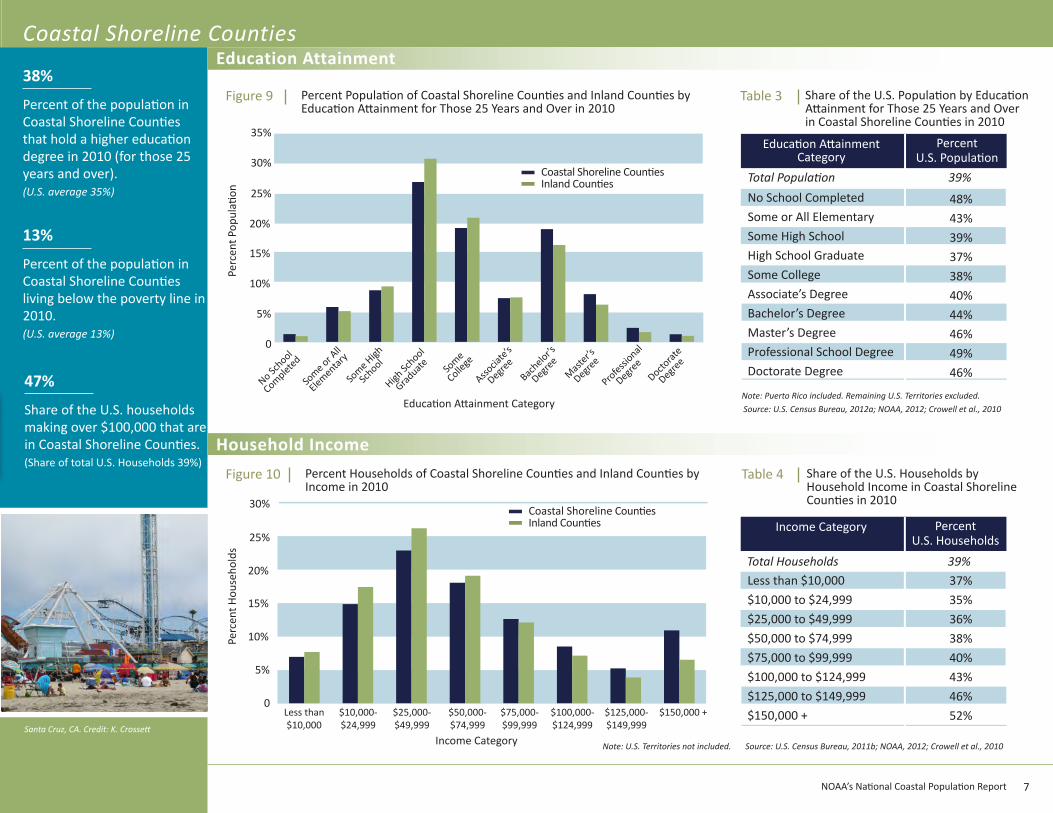
Percent Population of Coastal Shoreline Counties and Inland Counties by Education Attainment for Those 25 Years and Over in 2010
Figure 9
48%43%39%37%38%40%44%46%49%46%
No School CompletedSome or All ElementarySome High SchoolHigh School GraduateSome CollegeAssociate’s DegreeBachelor’s DegreeMaster’s DegreeProfessional School DegreeDoctorate Degree
Education Attainment Category
Percent U.S. Population
37%35%36%38%40%43%46%52%
Less than $10,000$10,000 to $24,999$25,000 to $49,999$50,000 to $74,999$75,000 to $99,999$100,000 to $124,999$125,000 to $149,999$150,000 +
Income Category Percent U.S. Households
Percent Households of Coastal Shoreline Counties and Inland Counties by Income in 2010
Figure 10
0
5%
20%
10%
15%
25%
30%
Share of the U.S. Population by Education Attainment for Those 25 Years and Over in Coastal Shoreline Counties in 2010
Table 3
Total Households 39%
Share of the U.S. Households by Household Income in Coastal Shoreline Counties in 2010
Table 4
Total Population 39%
Coastal Shoreline CountiesInland Counties
Associa
te’s
Degree
Bachelor’s
Degree
Professional
Degree
Doctorat
e
Degree
Master’s
Degree
Some
College
High Sc
hool
Graduate
Some High
School
Some or A
ll
Elementary
No School
Completed0
5%
20%
10%
15%
35%
25%
30%Coastal Shoreline CountiesInland Counties
Education Attainment Category
Income Category
Education Attainment
Household Income
47%
Share of the U.S. households making over $100,000 that are in Coastal Shoreline Counties.(Share of total U.S. Households 39%)
38%
Percent of the population in Coastal Shoreline Counties that hold a higher education degree in 2010 (for those 25 years and over). (U.S. average 35%)
13%
Percent of the population in Coastal Shoreline Counties living below the poverty line in 2010. (U.S. average 13%)
7
Perc
ent H
ouse
hold
sPe
rcen
t Pop
ulati
on
Less than $10,000
$10,000-$24,999
$25,000-$49,999
$50,000-$74,999
$75,000-$99,999
$100,000-$124,999
$125,000-$149,999
$150,000 +
NOAA’s National Coastal Population Report
Source: U.S. Census Bureau, 2012a; NOAA, 2012; Crowell et al., 2010
Source: U.S. Census Bureau, 2011b; NOAA, 2012; Crowell et al., 2010
Note: Puerto Rico included. Remaining U.S. Territories excluded.
Note: U.S. Territories not included.
Coastal Shoreline Counties
Delaware
Alaska
Michigan
Alabama
Oregon
Florida
Minnesota
South Carolina
North Carolina
Maine
Massachusetts
South Carolina
New Hampshire
Washington
Maine
California
New Jersey
New York
Michigan
Florida
0 5% 10% 15% 20%Percent
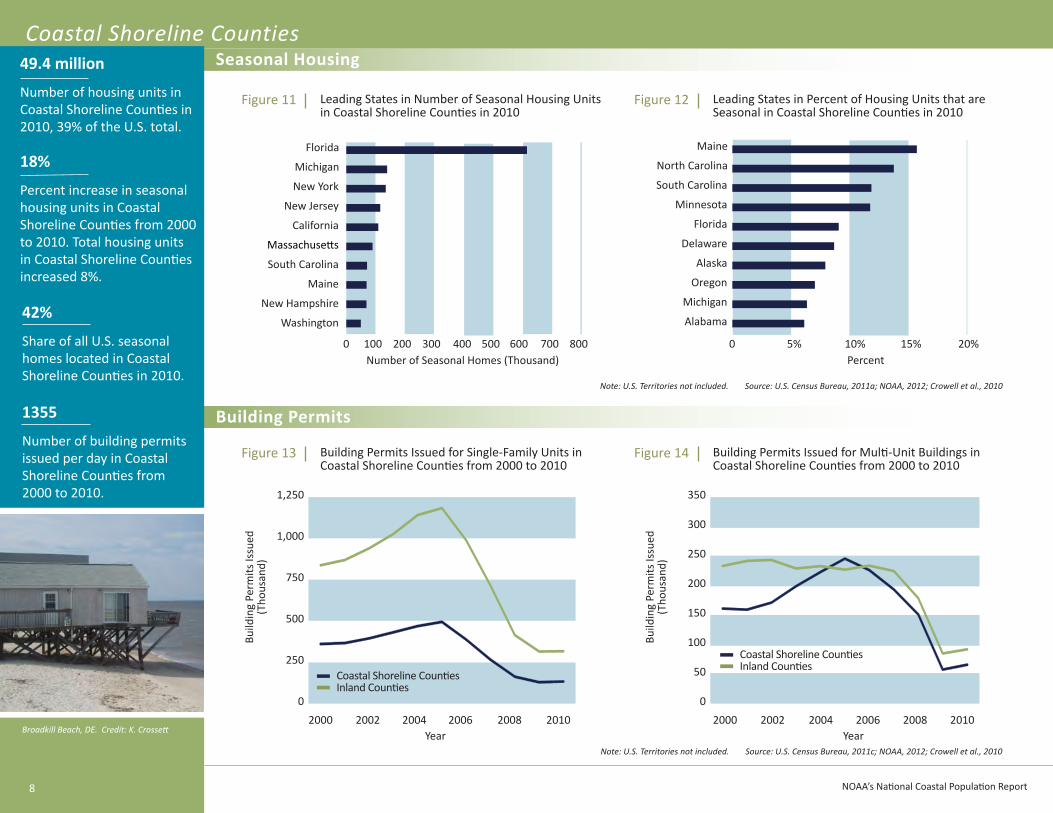
Leading States in Number of Seasonal Housing Units in Coastal Shoreline Counties in 2010
Figure 11 Leading States in Percent of Housing Units that are Seasonal in Coastal Shoreline Counties in 2010
Figure 12
0
Build
ing
Perm
its Is
sued
(Tho
usan
d)
250
200
100
50
150
300
350
2000 2002 2004 20082006Year
20100
Build
ing
Perm
its Is
sued
(Tho
usan
d)
1,250
1,000
500
250
750
2000 2002 2004 2006 2010Year
2008
Building Permits Issued for Single-Family Units in Coastal Shoreline Counties from 2000 to 2010
Figure 13 Building Permits Issued for Multi-Unit Buildings in Coastal Shoreline Counties from 2000 to 2010
Figure 14
Coastal Shoreline CountiesInland Counties
Seasonal Housing
Building Permits
Number of Seasonal Homes (Thousand)0 100 200 400300 500 600 700 800
42%
Share of all U.S. seasonal homes located in Coastal Shoreline Counties in 2010.
1355
Number of building permits issued per day in Coastal Shoreline Counties from 2000 to 2010.
49.4 million
Number of housing units in Coastal Shoreline Counties in 2010, 39% of the U.S. total.
18%
Percent increase in seasonal housing units in Coastal Shoreline Counties from 2000 to 2010. Total housing units in Coastal Shoreline Counties increased 8%.
Broadkill Beach, DE. Credit: K. Crossett
Coastal Shoreline CountiesInland Counties
8 NOAA’s National Coastal Population Report
Source: U.S. Census Bureau, 2011c; NOAA, 2012; Crowell et al., 2010Note: U.S. Territories not included.
Source: U.S. Census Bureau, 2011a; NOAA, 2012; Crowell et al., 2010Note: U.S. Territories not included.
2010Population
U.S. State or Territory
2010Population
Density(pers/mi2)
1970-2010Percent Increase in 65 and Older
PopulationRank Rank
2010-2020Percent Projected
Population Change
2010Percent
Population Living in Poverty
1970-2010Percent Historic
Population Change
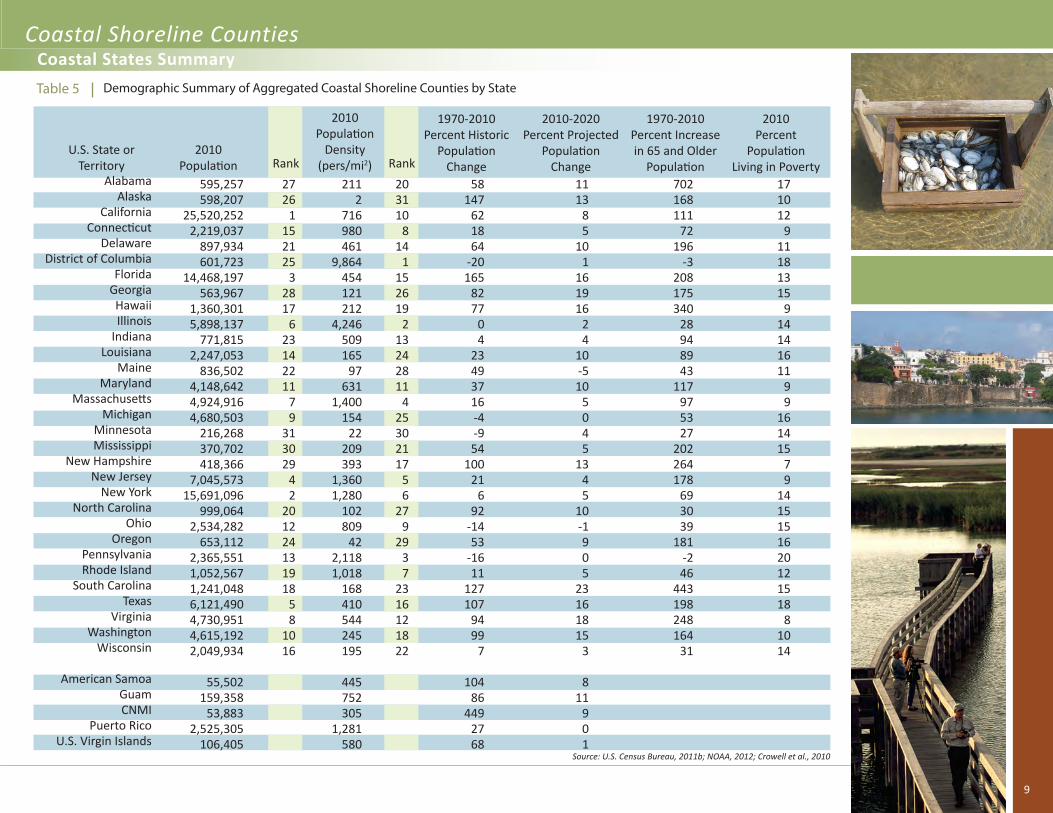
Coastal Shoreline Counties
Source: U.S. Census Bureau, 2011b; NOAA, 2012; Crowell et al., 2010
Coastal States SummaryDemographic Summary of Aggregated Coastal Shoreline Counties by StateTable 5
595,257 598,207
25,520,252 2,219,037
897,934 601,723
14,468,197 563,967
1,360,301 5,898,137
771,815 2,247,053
836,502 4,148,642 4,924,916 4,680,503
216,268 370,702 418,366
7,045,573 15,691,096
999,064 2,534,282
653,112 2,365,551 1,052,567 1,241,048 6,121,490 4,730,951 4,615,192 2,049,934
55,502 159,358
53,883 2,525,305
106,405
AlabamaAlaska
CaliforniaConnecticut
DelawareDistrict of Columbia
FloridaGeorgiaHawaiiIllinois
IndianaLouisiana
MaineMaryland
MassachusettsMichigan
MinnesotaMississippi
New HampshireNew Jersey
New YorkNorth Carolina
OhioOregon
PennsylvaniaRhode Island
South CarolinaTexas
VirginiaWashington
Wisconsin
American SamoaGuamCNMI
Puerto RicoU.S. Virgin Islands
2112
716980461
9,864454121212
4,246509165
97631
1,400154
22209393
1,3601,280
102809
422,1181,018
168410544245195
445752305
1,281580
702168111
72196
-3208175340
28948943
117975327
202264178
693039
181-246
443198248164
31
2726
1152125
32817
623142211
79
313029
42
201224131918
58
1016
203110
814
1152619
213242811
425302117
56
279
2937
2316121822
1113
85
101
161916
24
10-510
5045
1345
10-1905
23161815
3
811
901
171012
911181315
914141611
99
161415
79
1415151620121518
81014
58147
621864
-20165
8277
04
23493716-4-954
10021
692
-1453
-1611
127107
9499
7
10486
4492768
9
Coastal Watershed Counties
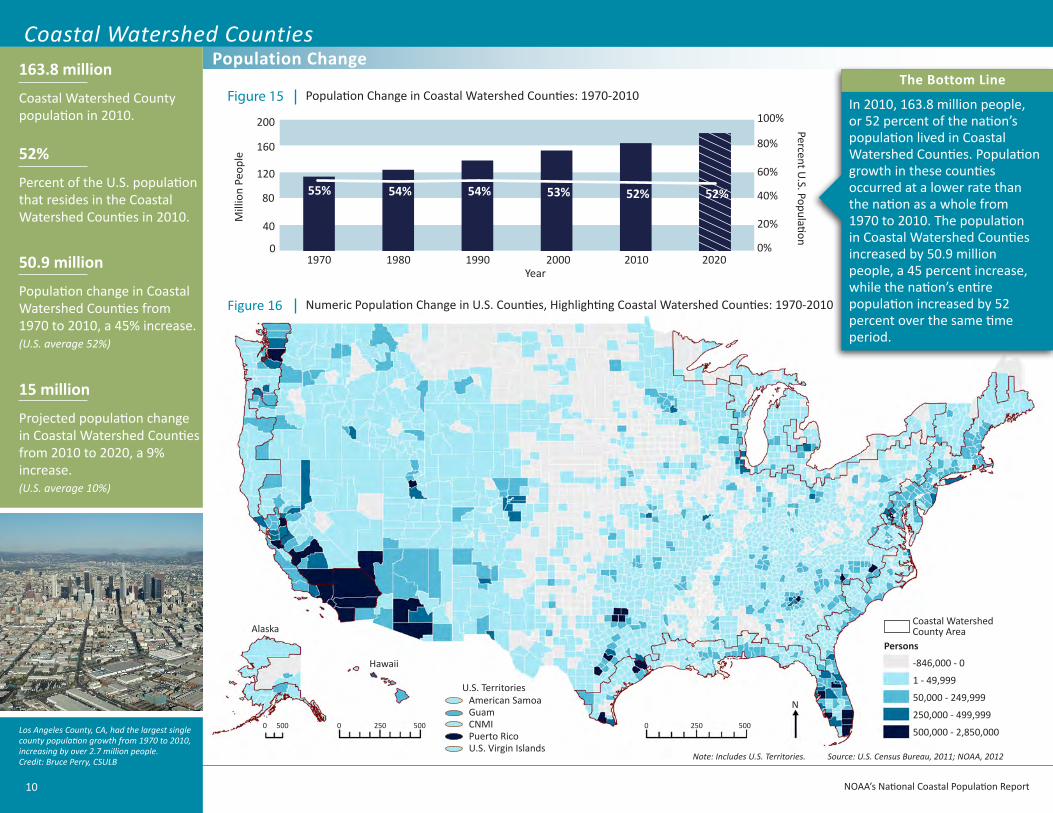
52%
Percent of the U.S. population that resides in the Coastal Watershed Counties in 2010.
50.9 million
Population change in Coastal Watershed Counties from 1970 to 2010, a 45% increase. (U.S. average 52%)
163.8 million
Coastal Watershed County population in 2010.
Los Angeles County, CA, had the largest single county population growth from 1970 to 2010, increasing by over 2.7 million people. Credit: Bruce Perry, CSULB
15 million
Projected population change in Coastal Watershed Counties from 2010 to 2020, a 9% increase. (U.S. average 10%)
Source: U.S. Census Bureau, 2011; NOAA, 2012
Numeric Population Change in U.S. Counties, Highlighting Coastal Watershed Counties: 1970-2010Figure 16
NOAA’s National Coastal Population Report
Population Change
Hawaii
Alaska
Persons
-846,000 - 0
1 - 49,999
50,000 - 249,999
250,000 - 499,999
500,000 - 2,850,0000 250 500
American SamoaGuamCNMIPuerto RicoU.S. Virgin Islands
U.S. Territories
Coastal Watershed County Area
Population Change in Coastal Watershed Counties: 1970-2010Figure 15
1970 1980 1990 2000 2010 2020
200
120
40
55% 54% 54% 53% 52%
100%
0%
160
80
0M
illio
n Pe
ople
20%
40%
60%
80%
Percent U.S. Population
52%
0 250 5000 500
10
Year
Note: Includes U.S. Territories.
The Bottom Line
In 2010, 163.8 million people, or 52 percent of the nation’s population lived in Coastal Watershed Counties. Population growth in these counties occurred at a lower rate than the nation as a whole from 1970 to 2010. The population in Coastal Watershed Counties increased by 50.9 million people, a 45 percent increase, while the nation’s entire population increased by 52 percent over the same time period.
N
Coastal Watershed Counties
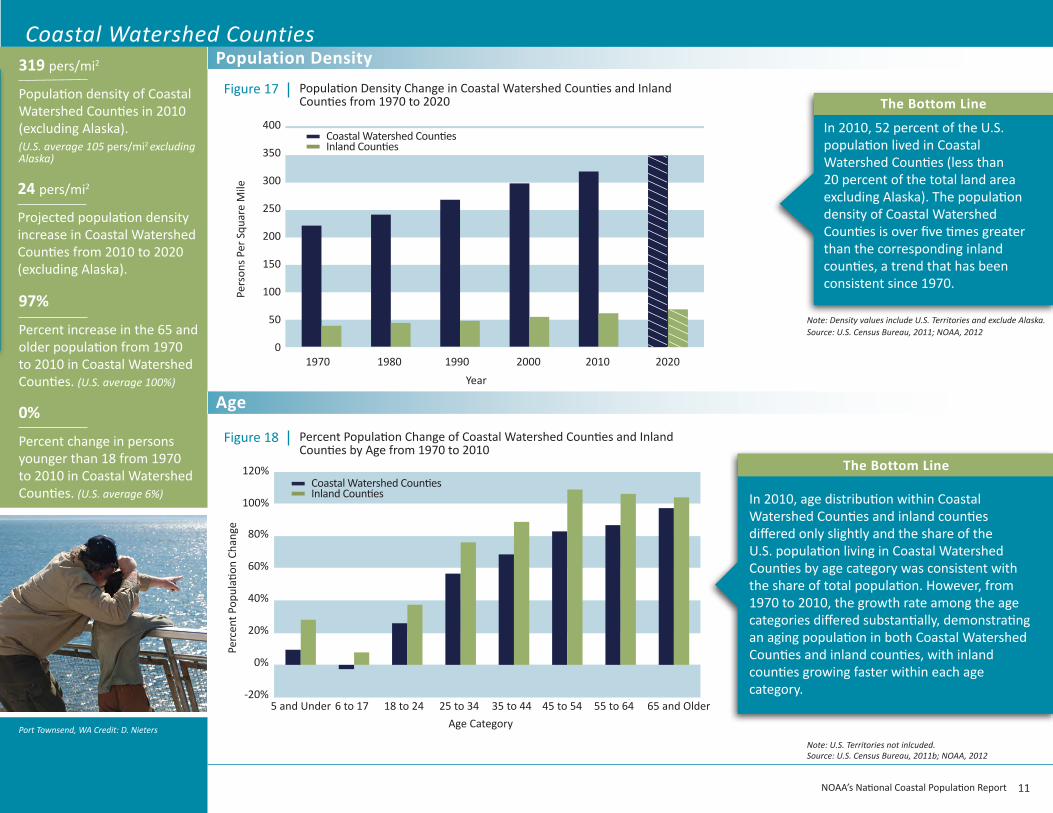
97%
Percent increase in the 65 and older population from 1970 to 2010 in Coastal Watershed Counties. (U.S. average 100%)
0%
Percent change in persons younger than 18 from 1970 to 2010 in Coastal Watershed Counties. (U.S. average 6%)
Port Townsend, WA Credit: D. Nieters
Population Density
Age
Source: U.S. Census Bureau, 2011b; NOAA, 2012
319 pers/mi2
Population density of Coastal Watershed Counties in 2010 (excluding Alaska). (U.S. average 105 pers/mi2 excluding Alaska)
24 pers/mi2
Projected population density increase in Coastal Watershed Counties from 2010 to 2020 (excluding Alaska).
1970 1980 1990 2000 2010 2020
Pers
ons P
er S
quar
e M
ile
400
300
200
100
0
350
250
150
50
Population Density Change in Coastal Watershed Counties and Inland Counties from 1970 to 2020
Figure 17
Year
Source: U.S. Census Bureau, 2011; NOAA, 2012
11
Note: Density values include U.S. Territories and exclude Alaska.
NOAA’s National Coastal Population Report
Note: U.S. Territories not inlcuded.
The Bottom Line
In 2010, 52 percent of the U.S. population lived in Coastal Watershed Counties (less than 20 percent of the total land area excluding Alaska). The population density of Coastal Watershed Counties is over five times greater than the corresponding inland counties, a trend that has been consistent since 1970.
100%
0%
20%
40%
60%
80%
-20%
120%
18 to 246 to 175 and Under 25 to 34 35 to 44 45 to 54 55 to 64 65 and OlderAge Category
Percent Population Change of Coastal Watershed Counties and Inland Counties by Age from 1970 to 2010
Figure 18
Perc
ent P
opul
ation
Cha
nge
The Bottom Line
In 2010, age distribution within Coastal Watershed Counties and inland counties differed only slightly and the share of the U.S. population living in Coastal Watershed Counties by age category was consistent with the share of total population. However, from 1970 to 2010, the growth rate among the age categories differed substantially, demonstrating an aging population in both Coastal Watershed Counties and inland counties, with inland counties growing faster within each age category.
Coastal Watershed CountiesInland Counties
Coastal Watershed CountiesInland Counties
Coastal Watershed Counties
Black or African
American Alone
Hispanic Origin
Source: U.S. Census Bureau, 2011b; NOAA, 2012
Percent of Population in Coastal Watershed Counties
Percent of Population in Inland Counties
0 60% 100%80%20% 40%
Hispanic or Latino
Non Hispanic or Latino
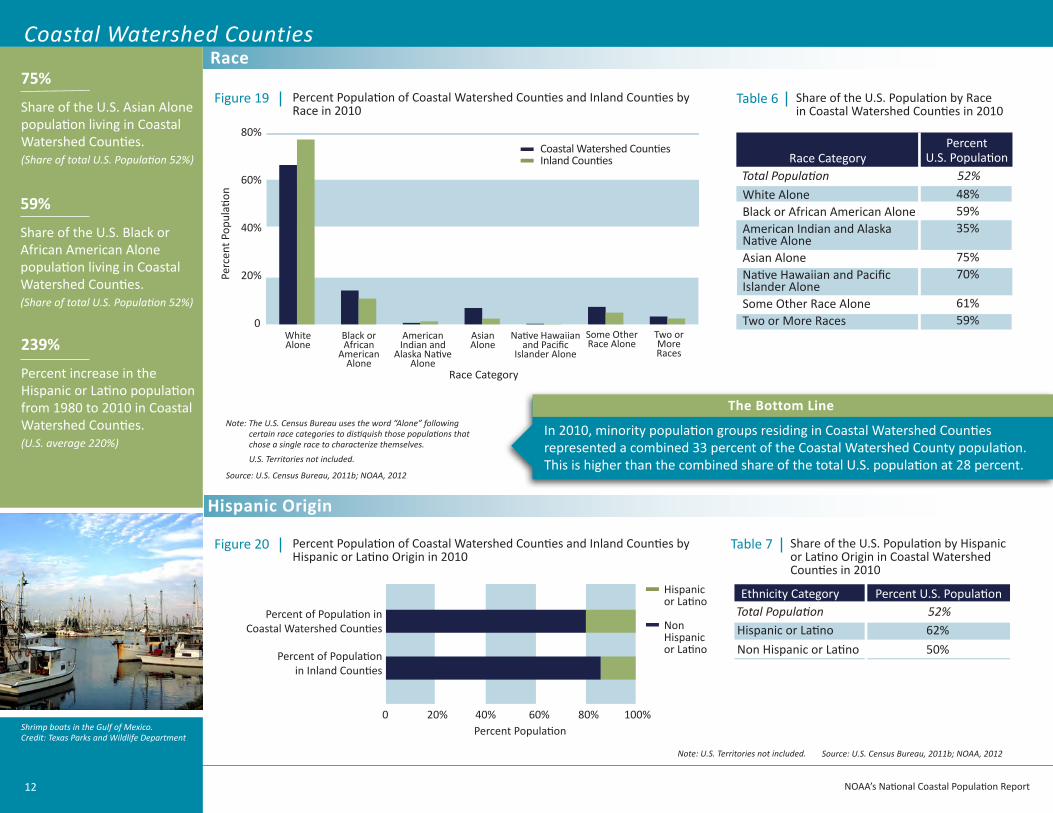
62%50%
Hispanic or LatinoNon Hispanic or Latino
Ethnicity Category Percent U.S. Population
Percent Population of Coastal Watershed Counties and Inland Counties by Hispanic or Latino Origin in 2010
Figure 20 Share of the U.S. Population by Hispanic or Latino Origin in Coastal Watershed Counties in 2010
Table 7
Total Population 52%
Coastal Watershed CountiesInland Counties
American Indian and
Alaska Native Alone
White Alone
Asian Alone
Native Hawaiian and Pacific
Islander Alone
Some Other Race Alone
Two or More Races
Percent Population of Coastal Watershed Counties and Inland Counties by Race in 2010
Figure 19 Share of the U.S. Population by Race in Coastal Watershed Counties in 2010
Table 6
48%59%35%
75%70%
61%59%
White AloneBlack or African American AloneAmerican Indian and Alaska Native AloneAsian AloneNative Hawaiian and Pacific Islander AloneSome Other Race AloneTwo or More Races
Race Category
Race Category
Total Population 52%
0
20%
80%
40%
60%
75%
Share of the U.S. Asian Alone population living in Coastal Watershed Counties.(Share of total U.S. Population 52%)
239%
Percent increase in the Hispanic or Latino population from 1980 to 2010 in Coastal Watershed Counties. (U.S. average 220%)
Race
Percent PopulationShrimp boats in the Gulf of Mexico. Credit: Texas Parks and Wildlife Department
Percent U.S. Population
12
Perc
ent P
opul
ation59%
Share of the U.S. Black or African American Alone population living in Coastal Watershed Counties.(Share of total U.S. Population 52%)
NOAA’s National Coastal Population Report
Note: U.S. Territories not included.
Source: U.S. Census Bureau, 2011b; NOAA, 2012
Note: The U.S. Census Bureau uses the word “Alone” following certain race categories to distiquish those populations that chose a single race to characterize themselves. U.S. Territories not included.
The Bottom Line
In 2010, minority population groups residing in Coastal Watershed Counties represented a combined 33 percent of the Coastal Watershed County population. This is higher than the combined share of the total U.S. population at 28 percent.
Coastal Watershed Counties
Martha’s Vineyard, MA. Credit: K. Crossett
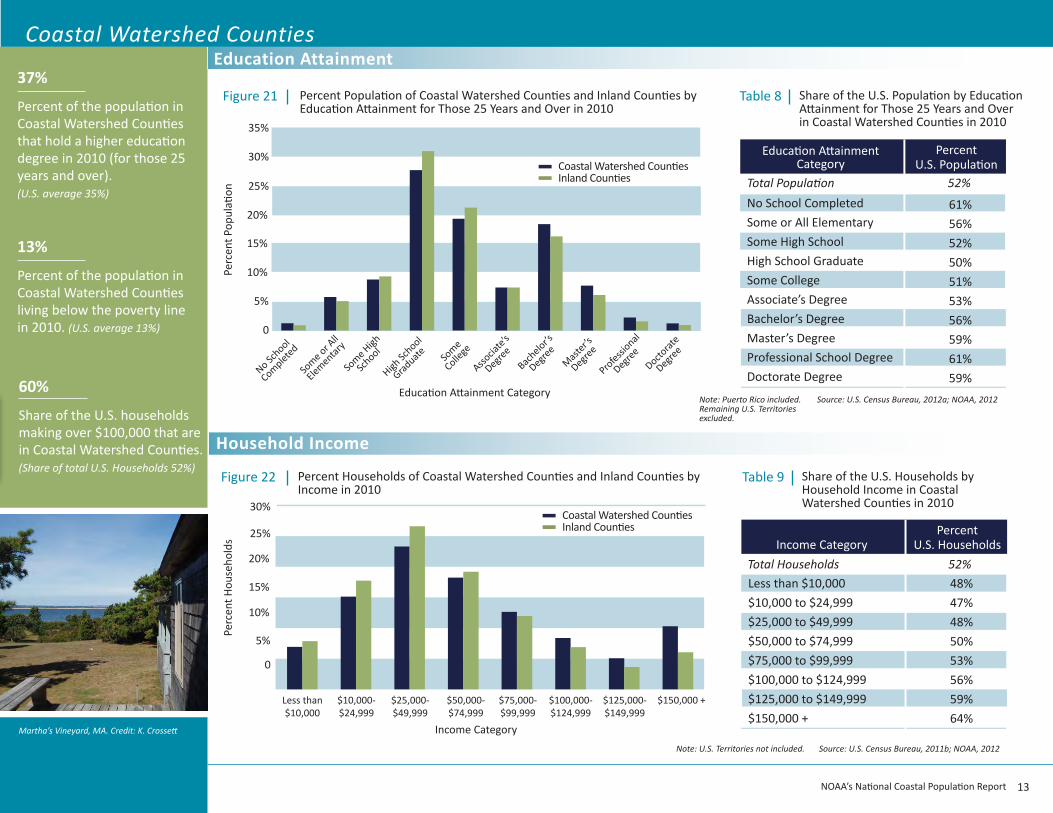
Percent Population of Coastal Watershed Counties and Inland Counties by Education Attainment for Those 25 Years and Over in 2010
Figure 21
61%56%52%50%51%53%56%59%61%59%
No School CompletedSome or All ElementarySome High SchoolHigh School GraduateSome CollegeAssociate’s DegreeBachelor’s DegreeMaster’s DegreeProfessional School DegreeDoctorate Degree
Education Attainment Category
Percent U.S. Population
Associa
te’s
Degree
Bachelor’s
Degree
Professional
Degree
Doctorat
e
Degree
Master’s
Degree
Some
College
High Sc
hool
Graduate
Some High
School
Some or A
ll
Elementary
No School
Completed
0
5%
20%
10%
15%
35%
25%
30%
48%47%48%50%53%56%59%64%
Less than $10,000$10,000 to $24,999$25,000 to $49,999$50,000 to $74,999$75,000 to $99,999$100,000 to $124,999$125,000 to $149,999$150,000 +
Income CategoryPercent
U.S. Households
Percent Households of Coastal Watershed Counties and Inland Counties by Income in 2010
Figure 22
Less than $10,000
$10,000-$24,999
$25,000-$49,999
$50,000-$74,999
$75,000-$99,999
$100,000-$124,999
$125,000-$149,999
$150,000 +
0
5%
20%
10%
15%
25%
30%
60%
Share of the U.S. households making over $100,000 that are in Coastal Watershed Counties.(Share of total U.S. Households 52%)
37%
Percent of the population in Coastal Watershed Counties that hold a higher education degree in 2010 (for those 25 years and over). (U.S. average 35%)
13%
Percent of the population in Coastal Watershed Counties living below the poverty line in 2010. (U.S. average 13%)
Share of the U.S. Population by Education Attainment for Those 25 Years and Over in Coastal Watershed Counties in 2010
Table 8
Total Households 52%
Share of the U.S. Households by Household Income in Coastal Watershed Counties in 2010
Table 9
Total Population 52%
Source: U.S. Census Bureau, 2012a; NOAA, 2012
Coastal Watershed CountiesInland Counties
Coastal Watershed CountiesInland Counties
Education Attainment Category
Income Category
Education Attainment
Household Income
Source: U.S. Census Bureau, 2011b; NOAA, 2012
13
Perc
ent H
ouse
hold
sPe
rcen
t Pop
ulati
on
NOAA’s National Coastal Population Report
Note: Puerto Rico included. Remaining U.S. Territories excluded.
Note: U.S. Territories not included.
Coastal Watershed Counties
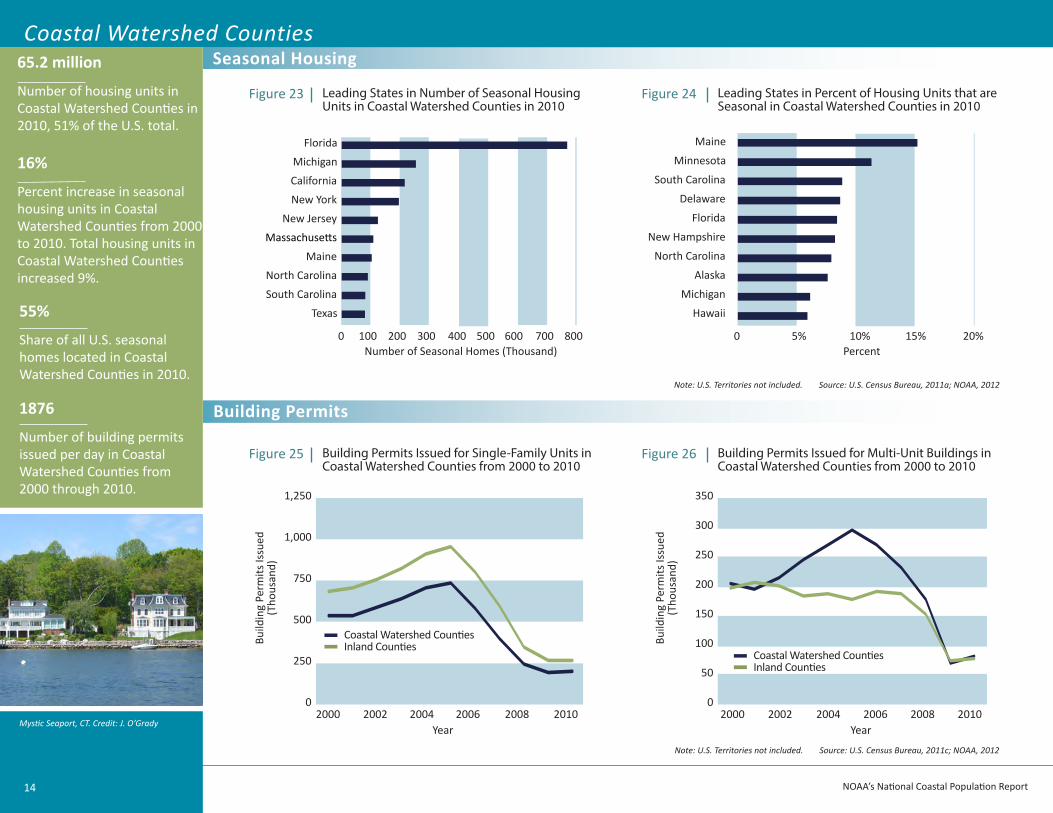
55%
Share of all U.S. seasonal homes located in Coastal Watershed Counties in 2010.
1876
Number of building permits issued per day in Coastal Watershed Counties from 2000 through 2010.
65.2 million
Number of housing units in Coastal Watershed Counties in 2010, 51% of the U.S. total.
Source: U.S. Census Bureau, 2011c; NOAA, 2012
16%
Percent increase in seasonal housing units in Coastal Watershed Counties from 2000 to 2010. Total housing units in Coastal Watershed Counties increased 9%.
New Hampshire
North Carolina
Michigan
Hawaii
Alaska
Florida
Delaware
South Carolina
Minnesota
Maine
Massachusetts
Maine
South Carolina
Texas
North Carolina
New Jersey
New York
California
Michigan
Florida
0 100 200 400300 500 600 700 800PercentNumber of Seasonal Homes (Thousand)
Leading States in Number of Seasonal Housing Units in Coastal Watershed Counties in 2010
Figure 23 Leading States in Percent of Housing Units that are Seasonal in Coastal Watershed Counties in 2010
Figure 24
0
Build
ing
Perm
its Is
sued
(Tho
usan
d)
250
200
100
50
150
300
350
2000 2002 2004 20082006Year
20100
Build
ing
Perm
its Is
sued
(Tho
usan
d)
1,250
1,000
500
250
750
2000 2002 2004 2006 2010Year
2008
Building Permits Issued for Single-Family Units in Coastal Watershed Counties from 2000 to 2010
Figure 25 Building Permits Issued for Multi-Unit Buildings in Coastal Watershed Counties from 2000 to 2010
Figure 26
Coastal Watershed CountiesInland Counties
Coastal Watershed CountiesInland Counties
Seasonal Housing
Building Permits
0 5% 10% 15% 20%
14 NOAA’s National Coastal Population Report
Note: U.S. Territories not included.
Source: U.S. Census Bureau, 2011a; NOAA, 2012Note: U.S. Territories not included.
Mystic Seaport, CT. Credit: J. O’Grady
764,613 598,207
32,258,738 3,574,097
897,934 601,723
18,427,589 1,043,009 1,360,301 5,898,137 1,432,512 3,573,854 1,238,956 5,287,553 6,318,177 8,797,000
251,654 628,502
1,073,438 8,683,202
17,586,787 2,254,172 4,326,145 1,982,081 6,388,180 1,052,567 1,932,243 8,287,623 5,425,647 5,229,486 2,569,028
55,519 159,358
53,883 3,725,789
106,405
AlabamaAlaska
CaliforniaConnecticut
DelawareDistrict of Columbia
FloridaGeorgiaHawaiiIllinois
IndianaLouisiana
MaineMaryland
MassachusettsMichigan
MinnesotaMississippi
New HampshireNew Jersey
New YorkNorth Carolina
OhioOregon
PennsylvaniaRhode Island
South CarolinaTexas
VirginiaWashington
Wisconsin
American SamoaGuamCNMI
Puerto RicoU.S. Virgin Islands
882
415738461
9,864362
77212
4,246352137
61703961173
2493
2551,241
604114411
94834
1,018127207392212167
445752305
1,088580
131702127
75196
-3228138340
28879585
138417833
154138
7031
19855
1015446
290202198170
42
2730
1142629
22521
920152211
84
312823
53
171318
72419
6101216
273111
710
1142818
2152229
85
20302616
39
241225
64
2319131721
91311
610
117
916
2688
115348
104481845
17191817
5
811
921
181013
911181318
914141712
810141417
79
1418141412121719
81012
44147
791864
-20178
7277
0162740461512-5599022
659-456141183
13083
10314
10386
4493768
2010Population
U.S. State or Territory
2010Population
Density(pers/mi2)
1970-2010Percent Increase in 65 and Older
PopulationRank Rank
2010-2020Percent Projected
Population Change
2010Percent
Population Living in Poverty
1970-2010Percent Historic
Population Change
Coastal Watershed Counties
Source: U.S. Census Bureau, 2011a; NOAA, 2012
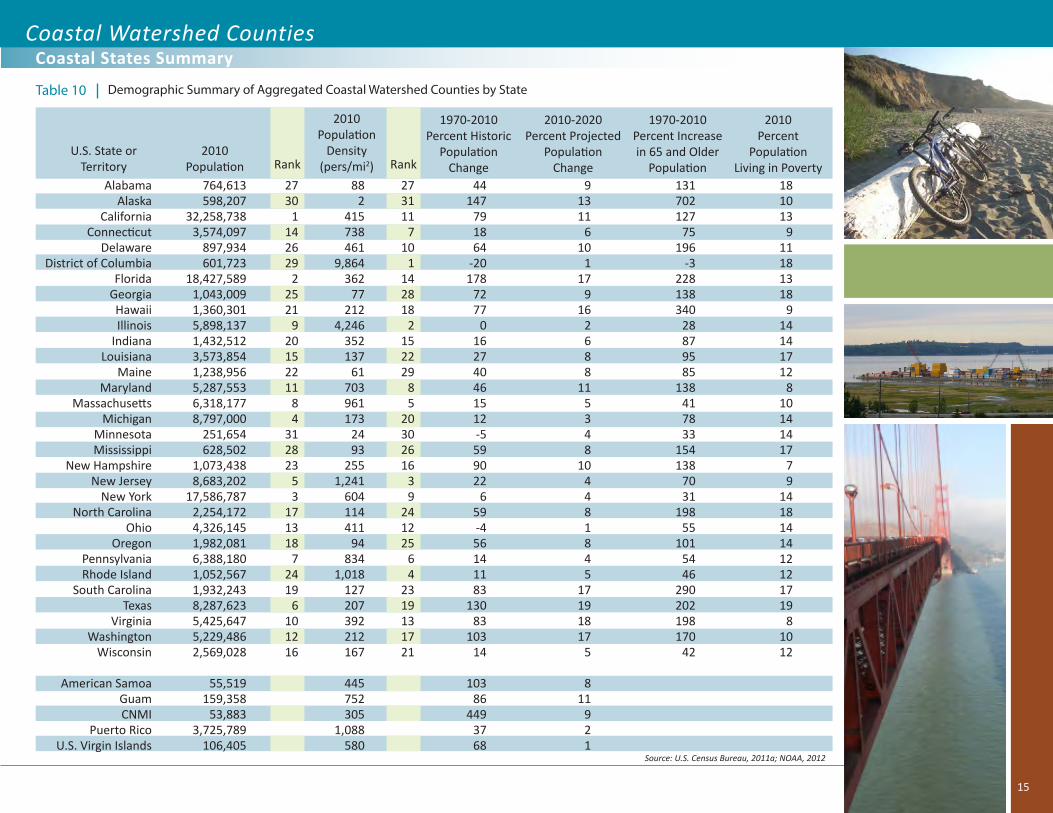
Coastal States Summary
Demographic Summary of Aggregated Coastal Watershed Counties by StateTable 10
15
16 NOAA’s National Coastal Population Report
Ache, B., K. Crossett, P. Pacheco, J. Adkins, P. Wiley. 2012. “The Coast” is Complicated: A Model to Consistently Describe the Nation’s Coastal Population. Estuaries and Coasts. In Press.
Crowell, M., Coulton, K., Johnson, C., Westcott, J., Bellomo, D., Edelman, S., and Hirsch, E., 2010. An Estimate of the U.S. Population Living in 100-year Coastal Flood Hazard Areas. Journal of Coastal Research, Vo. 26, No. 2, pp. 201-211.
National Ocean Service, NOAA. 2012. Spatial Trends in Coastal Socioeconomics. Demographic Trends Database 1970-2010; Woods and Poole Economics, Inc. Projections Database 1970-2040. Available from: http://coastalsocioeconomics.noaa.gov (accessed June 8, 2012).
U.S. Census Bureau. 2011a. American Community Survey 5-Year Estimates, 2006-2010. Available from: http://factfinder.census.gov/home/saff/main.html?_lang=en
U.S. Census Bureau. 2011b. Census 2010. Available from: http://factfinder2.census.gov/faces/nav/jsf/pages/index.xhtml
___. 2011c. Residential Construction Files 1998-2010.
This document was compiled by the following individuals of the National Oceanic and Atmospheric Administration:
Kristen CrossettBrent AchePercy PachecoKate Haber
The authors would like to thank the following individuals for their contributions to the National Coastal Population Report:
National Oceanic and Atmospheric AdministrationJeff AdkinsChris ClementTheresa GoedekeAlison HammerJohn HayesSusan HolmesLinwood PendletonPeter Wiley
U.S. Census BureauThomas FischettiMarc PerrySteven Wilson
Federal Emergency Management AgencyMark Crowell
Acknowledgements References
Photo CreditsCover:Ocean City, MD. Credit: Christopher Parypa (Shutterstock)
Inside Cover:San Francisco, CA. Credit: D. Nieters
Title Page:Lower Mississippi River. Credit: NOAA’s National Ocean ServiceChicago coastal skyline. Credit: NOAA’s National Ocean ServiceKayaks in Santa Cruz, CA. Credit: K. CrossettPuerto Rico. Credit: Cary Friday
Page 2:Channel Islands National Park, CA. Credit: Claire JohnsonCambria, CA. Credit: J. O’GradySan Diego, CA. Credit: J. O’GradyNubble Light House, Cape Neddick, CA. Credit: J. O’GradyRockport, TX. Credit: Texas Parks and Wildlife Department
Page 9:Martha’s Vineyard, MA. Credit: K. CrossettSan Juan, PR. Credit: B. O’GradyPort Aransas, TX. Credit: Texas Parks and Wildlife Department
Page 15:San Simeon, CA. Credit: J. O’GradyAnchorage, AK. Credit: D. NietersSan Francisco, CA. Credit: D. Nieters
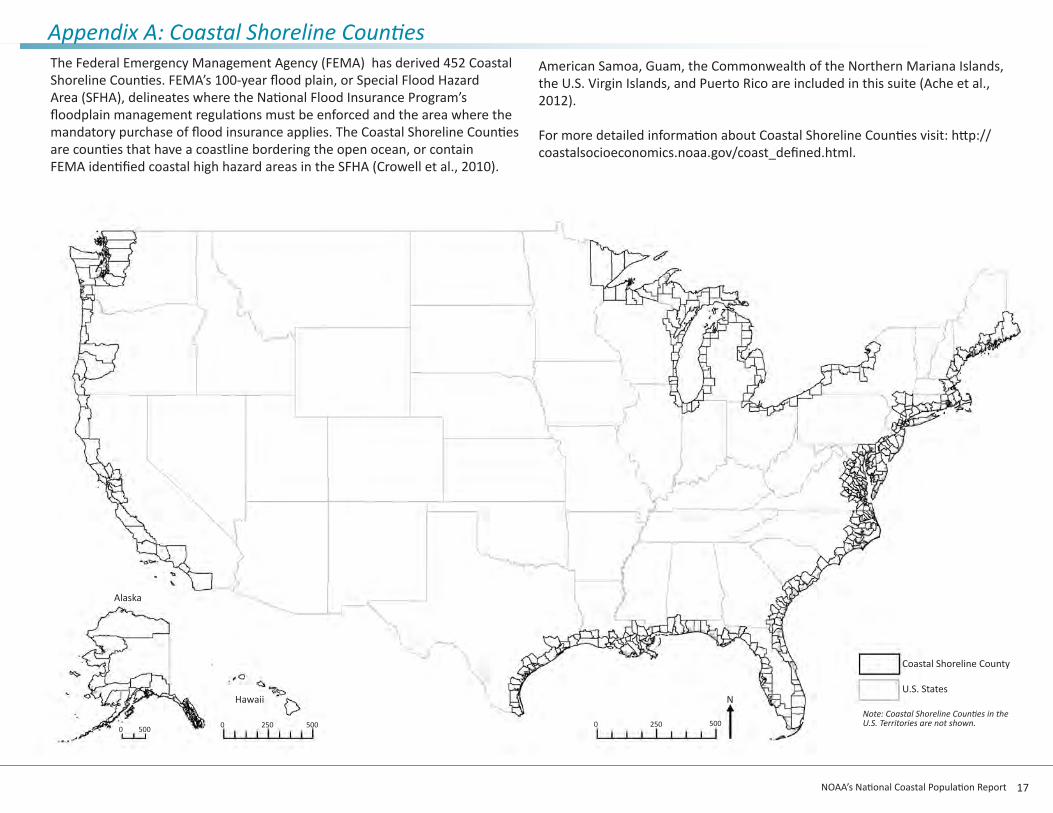
The Federal Emergency Management Agency (FEMA) has derived 452 Coastal Shoreline Counties. FEMA’s 100-year flood plain, or Special Flood Hazard Area (SFHA), delineates where the National Flood Insurance Program’s floodplain management regulations must be enforced and the area where the mandatory purchase of flood insurance applies. The Coastal Shoreline Counties are counties that have a coastline bordering the open ocean, or contain FEMA identified coastal high hazard areas in the SFHA (Crowell et al., 2010).
American Samoa, Guam, the Commonwealth of the Northern Mariana Islands, the U.S. Virgin Islands, and Puerto Rico are included in this suite (Ache et al., 2012).
For more detailed information about Coastal Shoreline Counties visit: http://coastalsocioeconomics.noaa.gov/coast_defined.html.
Hawaii
Alaska
0 250 500
Coastal Shoreline County
U.S. States
0 250 5000 500
Appendix A: Coastal Shoreline Counties
Note: Coastal Shoreline Counties in the U.S. Territories are not shown.
N
17NOAA’s National Coastal Population Report
18 NOAA’s National Coastal Population Report
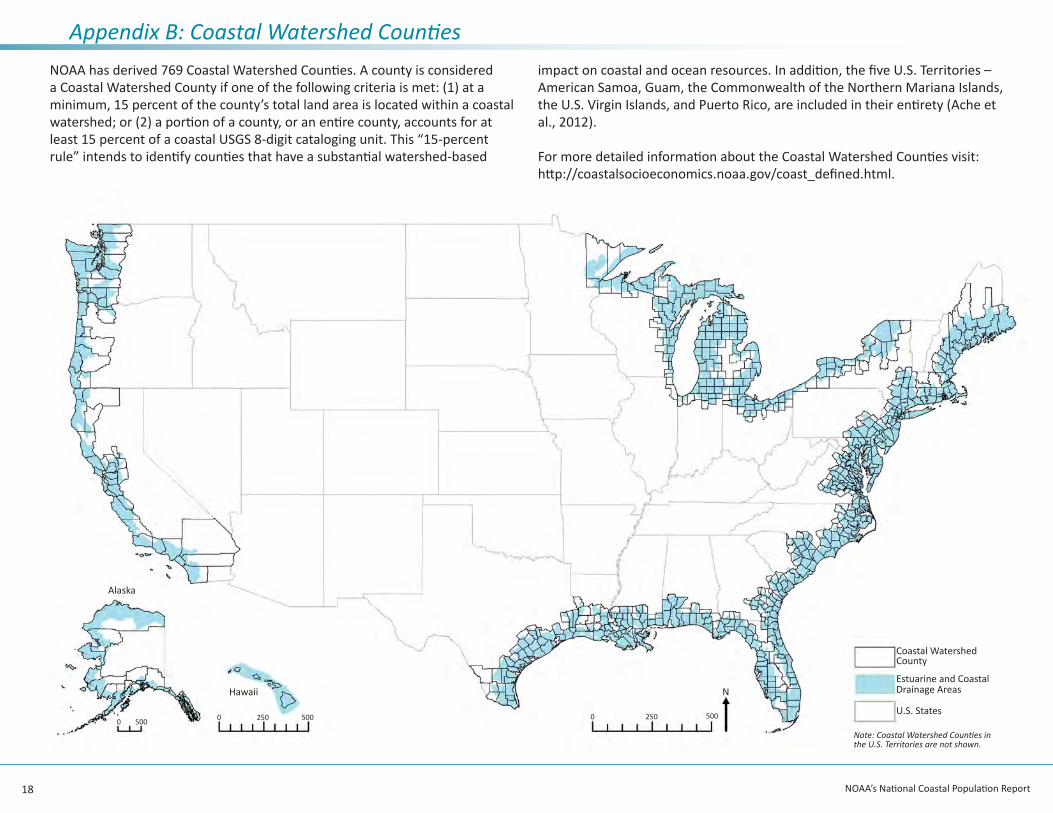
Appendix B: Coastal Watershed CountiesNOAA has derived 769 Coastal Watershed Counties. A county is considered a Coastal Watershed County if one of the following criteria is met: (1) at a minimum, 15 percent of the county’s total land area is located within a coastal watershed; or (2) a portion of a county, or an entire county, accounts for at least 15 percent of a coastal USGS 8-digit cataloging unit. This “15-percent rule” intends to identify counties that have a substantial watershed-based
impact on coastal and ocean resources. In addition, the five U.S. Territories – American Samoa, Guam, the Commonwealth of the Northern Mariana Islands, the U.S. Virgin Islands, and Puerto Rico, are included in their entirety (Ache et al., 2012).
For more detailed information about the Coastal Watershed Counties visit: http://coastalsocioeconomics.noaa.gov/coast_defined.html.
Hawaii
Alaska
0 250 500
Coastal Watershed County
Estuarine and Coastal Drainage Areas
U.S. States0 250 5000 500
Note: Coastal Watershed Counties in the U.S. Territories are not shown.
N
Hawaii
Alaska
0 250 500
Extent of Coastal Watershed CountiesExtent of Coastal Shoreline Counties
U.S. States0 250 5000 500
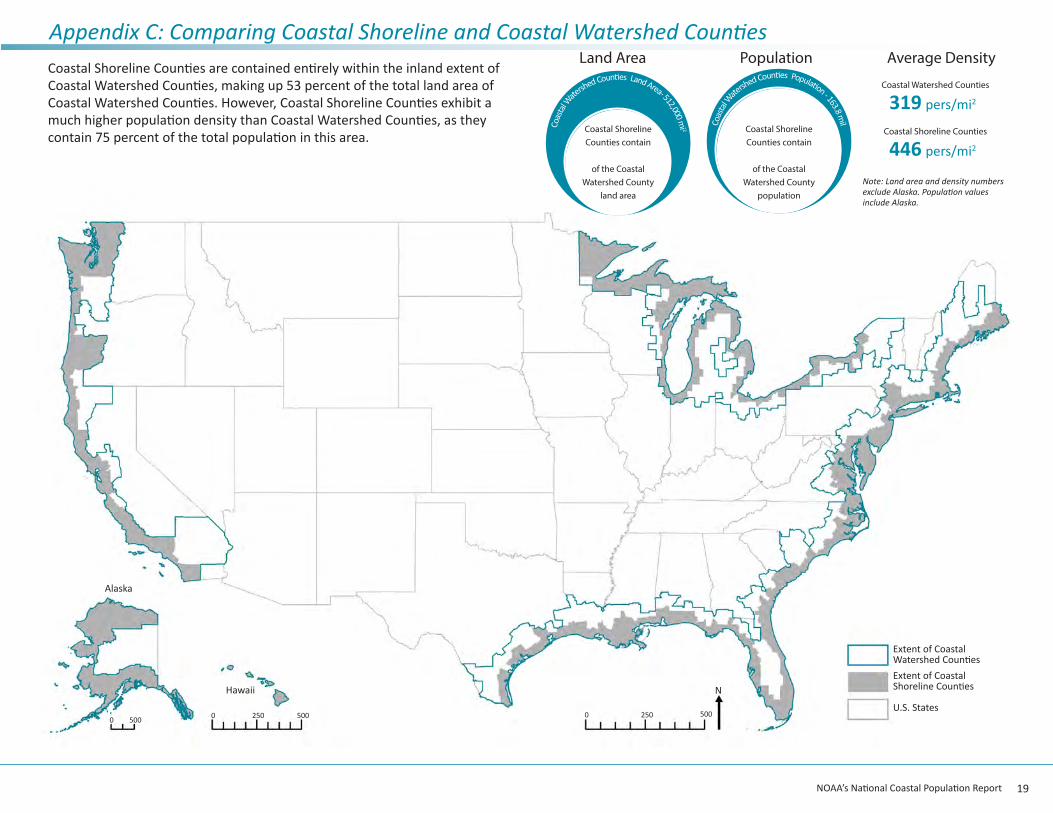
Appendix C: Comparing Coastal Shoreline and Coastal Watershed Counties
Coas
tal W
atershed Counti es Land Area- 512,000 m
i 2
Land Area Population
Coastal Shoreline Counties contain
53% of the Coastal
Watershed County land area
Coas
tal W
atershed Counti es Populati on - 163.8 m
il
Coastal Shoreline Counties contain
75% of the Coastal
Watershed County population
Average DensityCoastal Shoreline Counties are contained entirely within the inland extent of Coastal Watershed Counties, making up 53 percent of the total land area of Coastal Watershed Counties. However, Coastal Shoreline Counties exhibit a much higher population density than Coastal Watershed Counties, as they contain 75 percent of the total population in this area.
Coastal Watershed Counties
Coastal Shoreline Counties
319 pers/mi2
446 pers/mi2
Note: Land area and density numbers exclude Alaska. Population values include Alaska.
N
19NOAA’s National Coastal Population Report
stateofthecoast.noaa.gov