Embed Size (px)
Citation preview

National Bank of Ethiopia
2010/11 annual report | VII. Investment 96 1
Contents
Page
Governors note ................................................................................................................................ 1
I. Overall Economic Performance ................................................................................................. 6
1.1 Economic Growth ................................................................................................................. 6
1.2 GDP by sector ........................................................................................................................ 6
1.3 GDP by Expenditure by Component ................................................................................... 10
1.4 Micro and Small Scale Enterprises ...................................................................................... 11
1.5 Access to Water Supply ......................................................................................................... 13
1.6 Road Transport Development .............................................................................................. 15
1.7 Educational Sector Developments ........................................................................................ 19
1.8 Telecommunication ............................................................................................................... 22
II. Energy Production .......................................................................................................................... 27
2.1 Electric Power Generation ............................................................................................................... 27
2.2 Volumes and Value of Petroleum Imports ........................................................................................... 29
III. Price Developments ........................................................................................................................ 33
3.1 Development in Consumer Price at National Level ............................................................. 33
3.2 Regional Consumer Price Developments .............................................................................. 35
IV. Monetary and Financial Developments .................................................................................. 39
4.1 Monetary Developments and Policy ....................................................................................... 39
4.1.1 Developments in Monetary Aggregates .......................................................................... 39
4.1.2 Developments in Reserve Money and Monetary Ratios ................................................ 43
4.2 Development in Interest Rate .................................................................................................. 44
4.3 Developments in Financial Sector ........................................................................................... 46
4.3.1 Resource Mobilization by Banks ..................................................................................... 51
4.3.2 New Lending Activities .................................................................................................... 54
4.3.3 Outstanding Loans ........................................................................................................... 56
4.4 Financial Activities of NBE ...................................................................................................... 58
4.5 Developments in Financial Markets ........................................................................................ 59
4.5.1 NBE Treasury Bills Market ............................................................................................. 61
4.5.2 Bonds Market .................................................................................................................... 62
4.5.3 Interbank Money Market ................................................................................................ 63
V. Development in External Sector ............................................................................................................................................................................. 65
5.1 Overall Balance of Payments .......................................................................................................................................................................................... 65
................................................................................................................................................................................................................................................
5.2 Developments in Merchandise Trade ........................................................................................................................................................................ 68
5.2.1 Exports ............................................................................................................................................................................................................................. 68

National Bank of Ethiopia
2010/11 annual report | VII. Investment 96 2
5.2.2 Imports ............................................................................................................................................................................................................................ 73
5.2.3 Direction of Trade ...................................................................................................................................................................................................... 75
5.3 Service and Transfers .......................................................................................................................................................................................................... 79
5.3.1 Services ............................................................................................................................................................................................................................. 79
5.3.2 Unrequited Transfers .............................................................................................................................................................................................. 79
5.4 Current Account .................................................................................................................................................................................................................... 80
5.5 Capital Account ...................................................................................................................................................................................................................... 80
5.6 Changes in Reserve Position ............................................................................................................................................................................................ 81
5.7 External Debt ........................................................................................................................................................................................................................... 81
5.8 Developments in Foreign Exchange Market ......................................................................................................................................................... 83
5.8.1 Developments in Normal Exchange Rate ................................................................................................................................................... 83
5.8.2 Movements in Real Effective Exchange Rate ............................................................................................................................................ 85
5.8.3 Foreign Exchange Transactions ...................................................................................................................................................................... 87
VI. General Government Finance .................................................................................................................................................................................................. 88
6.1 Government Finance .............................................................................................................................................................................................. 88
6.2 Revenue and Grants ................................................................................................................................................................................................ 89
6.3 Expenditure .................................................................................................................................................................................................................. 92
6.4 Debit Financing ........................................................................................................................................................................................................... 95
VII. Investment ........................................................................................................................................ 96
7.1 Investment by Sector ............................................................................................................................................................................................... 102
7.2 Distribution by region ............................................................................................................................................................................................. 103
VIII. International Economic Developments ....................................................................................................................................................................... 104
8.1 International Economic Developments ......................................................................................................................................................... 104
8.1.1 Overview of World Economy ............................................................................................................................................................... 104
8.1.2 World Trade .................................................................................................................................................................................................... 108
8.1.3 Inflation and Commodity Prices ........................................................................................................................................................... 109
8.1.4 Exchange Rates .............................................................................................................................................................................................. 112
8.1.5 Capital Flows .................................................................................................................................................................................................... 114
8.2 Implications for Ethiopian .................................................................................................................................................................................. 114

National Bank of Ethiopia
2010/11 annual report | VII. Investment 96 3
Statistical tables
Estimate of Agriculture Production ....................................................................................................................................................................................... 137
Gross Domestic product by Economic Sectors .................................................................................................................................................................. 138
Expenditure on Gross Domestic Product at Current Market Price .................................................................................................................... 139
Balance of Payments ........................................................................................................................................................................................................................ 141
Summary of External Public Debt .......................................................................................................................................................................................... 142
Value of Major Exports ................................................................................................................................................................................................................. 144
Quantity of Major Exports .......................................................................................................................................................................................................... 144
Value of Major Imports (in Thousand of Birr) ................................................................................................................................................................. 144
Value of Major Imports ( in Metric Tons) ........................................................................................................................................................................... 145
Value of Imports by End Use ...................................................................................................................................................................................................... 147
Value of Imports by Country of Origin ................................................................................................................................................................................ 148
Value of Exports by Country of Destination ...................................................................................................................................................................... 150
Trade Balance with Major Trading Partners ................................................................................................................................................................... 151
Components of Broad Money ................................................................................................................................................................................................... 152
Domestic Credit by Sector ............................................................................................................................................................................................................ 153
Gold and Foreign Exchange Holdings of the Nbe and Commercial Banks .................................................................................................... 154
Treasury Bills Auction Results ................................................................................................................................................................................................... 155
Number and Capital of Domestic & Foreign Projects Approved by Sectors ................................................................................................. 156
Number and Capital of Domestic & Foreign Investment Projects .......................................................................................................................
Expected Employment Creation of Approved Domestic and Foreign Investment .................................................................................... 157
Employment Created by Domestic and Foreign Investment Projects by Sector ......................................................................................... 158
Number and Capital of Domestic & Foreign Investment Projects ....................................................................................................................... 159
Number and Capital of Investment Projects Approved by Region ..................................................................................................................... 160

National Bank of Ethiopia
2010/11 annual report | VII. Investment 96 4
Governor’s Note
Ethiopia continued to maintain the double digit growth it has started since the last
eight years. In 2010/11, real GDP growth was 11.4 percent moderately higher than the
10 percent growth a year earlier. This robust and broad based economic growth places
Ethiopia among the top performing African and other developing Asian countries.
During the fiscal year, agriculture grew by 9.0 percent due to improved productivity,
good weather conditions and conducive policy environment. The industry sector
expanded by 15.0 percent, owing to investment in electricity & water and construction
sector. Service sector growth, however, slightly declined to 12.5 percent from 13.0
percent a year ago.
Despite the fact that Ethiopia had historically been a low inflation country, it has
begun witnessing some inflationary pressure during the last two years. Annual
average general inflation at the close of the fiscal year 2010/11 hiked up to 18.1
percent, about 15.3 percentage point higher than the preceding year. This was largely
attributed to the surge in the prices of food items which contributed 14.1 percentage
point to the total annual change in headline inflation. Annualized food inflation,
scaled up to 15.7 percent from -5.4 percent in June 2010 registering a 21.1 percentage
point increase on account of higher food prices in the international market, domestic
supply side constraints and reserve money growth largely due to higher NFA.
Annual average core inflation also slightly increased to 21.8 percent from 18.2
percent at the end of last fiscal year, owing to higher commodity prices, mainly fuel
prices in the international market.
The government’s fiscal operations revealed an overall fiscal deficit of 4.8 percent of
GDP in contrast to 4.6 percent a year earlier. General government revenue, including
grants depicted a 29.2 percent surge to Birr 85.6 billion due to improved tax
administration and continued economic growth. Yet, revenue to GDP ratio remained

National Bank of Ethiopia
2010/11 annual report | VII. Investment 96 5
modest at 13.5 percent from 14.1 percent a year ago, which was quite low compared
to other similar developing countries indicating the need for increased tax effort.
General government expenditure also registered a 31.5 percent annual increase to
reach Birr 93.8 billion, as poverty related expenditure tended to play a significant role.
Monetary policy continued to focus on containing inflationary pressure and building
international reserves of the country. Efforts were made to make the growth of broad
money supply in line with nominal GDP growth. Accordingly, broad money to GDP
ratio increased from 27.2 percent in 2009/10 to 29.1 percent in 2010/11 on account of
remarkable growth in net foreign assets and domestic credit. Similarly, annual
reserve money growth was 39.7 percent owing to same reason. As for interest rate,
the NBE continued to set the minimum interest rate on saving and time deposits while
leaving lending rates to be freely determined by banks. The minimum interest rate on
deposits rate was set at 5 percent while lending rate ranged between 7.5 and 16.25
percent. As inflation remained high, real rate of interest remained negative through
out the fiscal year.
Regarding financial sector development, the Ethiopian banking system continued to
perform well. Consequently, the number of banks operating in the country reached 17
as two new private banks joined the industry during the year. Of the total banks, 14
were privately owned. The number of bank branches reached 970. About 23 percent
of the public banks and 49 percent of private bank branches were concentrated in
Addis Ababa. Ethiopia is still one of the most under banked countries in the world
with one bank branch serving over 82,000 people.
Banks operating in the country registered high profit, enhanced their resource
mobilization, expanded their capital base, disbursed significant amount of credit and
reduced their non-performing loans to a minimum level. Accordingly, deposit
mobilized by the banking system surged 42.5 percent and their outstanding loans rose
by 24.7 percent. New loans disbursed amounted to Birr 42.2 billion, about 46.0
percent higher than last year. Excess reserves scaled up by 16.1 percent to reach at
Birr 7.3 billion compared to 6.3 billion a year earlier as a result of enhanced deposit
mobilization and loan collection by banks. Total capital of the banks reached Birr
15.9 billion showing a 23.3 percent annual growth. The share of private banks in total

National Bank of Ethiopia
2010/11 annual report | VII. Investment 96 6
capital was Birr 7.23 billion accounting for 44 percent in contrast to 40 percent in
2009/10.
The number of insurance companies increased to 14 as two more private insurance
companies were opened during the year. Their branch network reached 221 following
the opening of 11 additional branches during the same period. Except 1, all the other
insurance companies with a branch network of 81.4 percent were privately owned.
The total capital of insurance companies reached Birr 955.7 million of which private
insurance companies accounted for about 70 percent. About 51 percent of the
insurance companies were located in the capital, Addis Ababa.
As for microfinance institutions, their number increased to 31. Their total capital and
assets reached Birr 2.9 billion and Birr 10.2 billion, registering 24 and 27.6 percent
annual growth, respectively. Their credit extension at Birr 7 billion showed a 20
percent increase. They mobilized deposits to the tune of Birr 3.8 billion which rose 42
percent over last year. These developments clearly witness the growing role of MFIs
in income generation, asset building and poverty reduction as they largely serve low
income groups with no or little access to formal bank loans.
With regard to external sector developments, the review fiscal year revealed strong
growth in export, a surge in services and private transfers and slightly narrowing
current account deficit. Export proceeds reached USD 2.8 billion, indicating 37.1
percent annual growth, due to higher earnings from all major export items except
oilseeds.
Hence, the ratio of exports to GDP increased to about 10 percent compared to 6.7
percent a year ago. The export receipts covered about 33 percent of the import bill
during the review year in contrast to 24 percent last year.
Meanwhile, total import bill with marginal decline of 0.8 percent stood at USD 8.3
billion. This was attributed to the slowdown in import items like raw materials (13.5
percent), capital goods (4.5 percent) and consumer goods (8.8 percent).

National Bank of Ethiopia
2010/11 annual report | VII. Investment 96 7
Import bills of other commodities particularly fuel, however, tended to increase. The
share of imports in total GDP marginally rose to 29.6 percent from 27.8 percent a year
ago.
Net private transfers witnessed 16.7 percent growth in the fiscal year and reached Birr
3.2 billion. Private individuals remitted USD 2.3 billion in cash and in kind showing
24.6 percent annual growth partly reflecting the increasing use of official transmission
channels. Official transfers, however, slightly declined to USD 1.89 billion.
Consequently, the country’s current account (including official transfers) registered a
surplus of USD 234.4 million in the review year vis-a-vis USD 1.2 billion deficit in
the preceding year. The country also saw growth in FDI and net long term capital as a
result of improved policy environment.
Following positive developments in external sector, the overall balance of payments
registered a surplus of USD 1.37 billion, almost four times higher than last year.
Regarding exchange rate developments, the fiscal year 2010/11 revealed the fast
depreciation of Birr against USD mainly due to the impact of NBE’s intervention in
September 2010 which led to a one-go devaluation of the Birr by twenty percent. The
aim was to enhance the country’s international competitiveness. Accordingly, in
2010/11 the Birr depreciated by 25.0 percent against USD in the official inter-bank
market and 20.8 percent in the parallel market. This resulted in the narrowing of the
premium between the official and parallel exchange rates to 2.6 percent from 6.1
percent a year ago. NBE continued to focus on maintaining exchange rate stability of
the Birr through periodic monitoring of exchange rate developments and participating
in the interbank foreign exchange market.
Money market in the country remains shallow and narrow. Treasury bills market is
the only active primary market in the Ethiopian financial market although the sale of
corporate bonds is gradually looming large.

National Bank of Ethiopia
2010/11 annual report | VII. Investment 96 8
Treasury bills with a maturity period of 28 days, 91 days and 182 days are traded bi-
weekly where few institutional investors participate. The amount of T-bills sold in the
review year was Birr 52.3 billion, 25.3 percent higher than last year. The weighted
yield across maturities increased to 1.126 from 0.786 a year earlier.
During the 2010/11 fiscal year, there was no inter-bank money market transaction due
to the absence of liquidity shortage in the banking system. The sale of corporate
bonds increased largely owing to huge demand for infrastructure development in the
country. All in all, the fiscal year 2010/11, was a year of success in maintaining
sustainable economic growth, despite some hiccups regarding inflationary pressure.
Looking ahead, the Ethiopian economy is projected to grow by about 11 percent
(lower case scenario) in 2011/12 as macroeconomic conditions are envisaged to
continue improving. Inflation is expected to be a major challenge. Therefore,
coordinated and prudent monetary and fiscal policies will continue during the fiscal
year. To this end, developments in reserve money will be closely monitored.
Attention will also be given to improving the country’s international competitiveness
and building international reserves by using appropriate exchange rate policy and
other export enhancing mechanisms.
Finally, I would like to thank the management and staff of the NBE for their effort in
the implementation of the country’s monetary and financial sector policies as well as
in contributing to the continued growth of the economy. I am confident that they will
continue to do more in the coming year(s). I also thank all those stakeholders for their
cooperation in realizing the objectives of the NBE throughout the fiscal year and
expect the same in the fiscal year ahead.
National Bank of Ethiopia
2010/11 annual report | VII. Investment 96 9
I. OVERALL ECONOMIC PERFORMANCE 1.1 Economic Growth Ethiopia continued to maintain the
double digit growth rate which
averaged 11.4 percent over the last
eight years. In the fiscal year 2010/11,
real GDP growth was 11.4 percent
moderately higher than the previous
year’s growth of 10.4 percent. This
robust economic growth, which is
broad based, placed Ethiopia among
the top performing African and other
developing Asian countries.
Accordingly, Ethiopia’s real per capita
GDP rose to USD 392 from USD 377
a year earlier.
The resilience of the Ethiopian
economy is projected to continue
through 2011/12 and show 11.0
percent growth compared to 5.5
percent for Sub-Saharan Africa and 4.4
percent for the entire world.
1.2 GDP By Sector
Regarding sectoral development,
agriculture grew by 9 percent, industry
15 percent and services 12.5 percent.
Consequently, agriculture and allied
activities accounted for 41 percent of
GDP, industry 13.4 and services 45.6
percent. Similary, agriculture
contributed 4.7, industry 1.5 and
service 5.3 percentage points to the
11.4 percent real GDP growth in
2010/11. Although, the share of
agriculture in GDP tended to decline
over time, it still remains the largest
employer, the main source of foreign
exchange, and supplier of raw
materials and market to domestic
industries (Fig.I.1 below).

National Bank of Ethiopia
2010/11 Annual Report 10
Table 1.1 Sectoral Contribution to GDP and GDP Growth (In Millions of Birr)
Items Fiscal Year
2004/05 2005/06 2006/07 2007/08 2008/09 2009/10 2010/11
Sector Agriculture 39,728 44,062 48,225 51,843 55,141 59,348 64,698
Industry 11,402 12,561 13,757 15,150 16,616 18,374 21,178
Services 33,312 37,747 43,534 50,519 57,576 65,084 73,368
Total 84,443 94,371 105,517 117,514 129,333 142,807 159,244 Less FISM 639 896 1,018 1,323 1,489 1,619 1780 Real GDP 83,804 93,474 104,499 116,190 127,844 141,187 157,464
Growth in Real GDP 12.6 11.5 11.8 11.2 10 10.4 11.4
Real GDP per capita 1,334.0 1,441.0 1,553.0 1,664.0 1,764.0 1,933.0 1,946.4
Share in GDP (in percent )
Agriculture 47.4 47.1 46.1 44.6 43.1 42.0 41.1
Industry 13.6 13.4 13.2 13.0 13.0 13.0 13.4
Services 39.7 40.4 41.7 43.5 45.0 46.1 46.1
Growth in Real GDP per capita 9.0 8.0 7.8 7.1 6.0 9.6 8.5
Agriculture
Absolute Growth 13.5 10.9 9.4 7.5 6.4 7.6 9.0
Contribution to GDP growth 6.4 5.1 4.4 3.3 2.7 3.2
4.69
Contribution in percent 50.8 44.5 36.9 29.9 27.6 30.8
41.1
Industry
Absolute Growth 9.4 10.2 9.5 10.0 9.9 10.6 15.0
Contribution to GDP growth 1.3 1.4 1.3 1.3 1.3 1.4
1.53
Contribution in percent 10.1 11.8 10.7 11.7 12.9 13.3
13.4
Services
Absolute Growth 12.8 13.3 15.3 16.0 14.0 13.0 12.5
Contribution to GDP growth 5.1 5.4 6.4 7.0 6.3 6.0
5.26
Contribution in percent 40.1 46.6 54.2 62.5 63.4 57.6
45.6
Source: MoFED and Staff Computation
Note: Sectoral contributions will not add-up to overall GDP growth because of Financial Intermediary Service Indirect Measurement (FISIM)
Figure. I.1: GDP Growth by Major Sectors

National Bank of Ethiopia
2010/11 annual report 11
Source: Central Statistical Agency (CSA)
The growth in agricultural outputs was
largely attributed to improved
productivity aided by favorable
weather condition and conducive
economic policy. Cultivated land
expanded by 4.6 percent and reached
12 million hectares in 2010/11.
Production is estimated to have
increased by about 8.8 percent while
productivity rose from 15.7
quintal/hectare in 2004/05 to 16.3
quintal/hectare in 2010/11. Cereal
production accounted for about 87.7
percent of the total production
estimated for 2010/11.
Meanwhile, the 15 percent annual
growth in industry was largely due to
expansion in electricity and water
subsectors. Manufacturing grew by 12
percent with mining and quarrying
expanded by 57.7 percent. The 12.5
percent growth in services sector
which has gained momentum in recent
years was attributed to growth in
financial sector, real estate and hotel &
tourism sectors.

National Bank of Ethiopia
2010/11 Annual Report 12
Table 1.2: Estimates of Agricultural Production and Cultivated Areas of Major Crops for Private Peasant Holdings - Meher Season
(Area and production are in thousands of hectars and quintals, respectively)
Source: CSA
Agricultural Production
2007/08 2008/09 2009/10 2010/11
Cultivated Area
Total Production
Cultivated Area
Total Production
Cultivated Area
Total Production
Cultivated Area
Total Production
Cereals 8,730.0 137,169.9 8,770.0 144,964.1 9233.0 155342.2 9905.5 172,383.2 (Percent Change) 3.0 6.5 0.5 5.7 5.3 7.2
7.3 11.0
Pulses 1,517.7 17,827.4 1,585.2 19,646.3 1489.3 18980.5 1343.9 17,487.7
(Percent Change) 10.1 12.9 4.4 10.2 -6.1 -3.4
-9.8 -7.9
Oilseeds 707.6 6169.3 855.1 6,557.0 780.9 6436.1 781.2 6765.2
(Percent Change) -4.6 24.1 20.8 6.3 -8.7 -1.8
0.04 5.1
Total 10,955.3 161,166.6 11,210.3 171,167 11,503.2 180758.8 12,030.6 196,636.1 (Percent Change) 3.4 7.8 2.3 6.2 2.6 5.6
4.6 8.8

National Bank of Ethiopia
2010/11 Annual Report 13
1.3 GDP by Expenditure Component In the fiscal year under review, total
consumption expenditure as a percent
of GDP slowed down to 91.2 from
94.8 percent in last year, largely due to
a 3 percentage point slowdown in
private consumption. On the other
hand, gross domestic saving as percent
of GDP went up to 8.8 percent from
5.5 percent a year earlier. The ratio of
gross capital formation to GDP
increased to 25.5 percent from 22.3
percent in 2009/10.
The resource gap narrowed to 15
percent of GDP from 19.4 percent last
fiscal year.
Table: 1.3: Expenditure on GDP and Gross Domestic Savings (As Percentage
of GDP)
Year
Domestic Absorption
Consumption Expenditure
Gross Capital Formation
Resource Balance
Exports of Goods & Services
Imports of Goods & Services
Gross Domestic Savings 1996/97 Total Govt. Pvt.
1997/98 109.2 88.0 9.8 78.2 21.2 -7.7 12.8 20.5 12.0 1998/99 113.9 92.0 15.6 76.4 21.9 -12.4 11.6 24.0 8.01999/00 111.3 91.0 17.9 73.1 20.3 -11.9 12.0 23.9 9.0 2000/01 111.5 90.0 14.6 75.4 21.5 -11.7 12.0 23.7 10.0 2001/02 118.1 94.0 14.8 79.2 24.1 -14.0 12.6 26.6 6.0 2002/03 118.2 96.0 13.4 82.6 22.2 -14.1 13.3 27.4 4.0 2003/04 114.6 88.1 13.1 75.0 26.5 -16.7 14.9 31.6 11.9 2004/05 117.9 94.1 12.4 81.7 23.8 -20.4 15.1 35.5 5.9 2005/06 120.6 95.4 12.2 83.2 25.2 -22.7 13.8 36.5 4.6 2006/07 113.1 91.3 10.5 80.8 22.1 -19.3 12.7 32.0 8.7 2007/08 117.2 94.8 9.8 85.0 22.4 -19.4 11.4 30.8 5.2 2008/09 116.3 93.6 8.2 85.4 22.7 -18.2 10.5 28.7 6.4 2009/10 116.7 94.8 8.6 86.2 24.7 -19.4 13.6 33.0 5.2 2010/11 116.7 91.2 8.1 83.1 25.5 -15 16.8 31.8 8.8 Average: 115.4 92.6 12.4 80.2 22.8 -16.0 12.8 28.8 7.4
Source: MoFED (Based on the Newly Revised Series)

National Bank of Ethiopia
2010/11 Annual Report 14
1.4 Micro and Small-Scale Enterprises
The five-year Growth and
Transformation Plan (GTP) envisages to
create a total of three million micro and
small-scale enterprises (MSE’s) at the
end of the plan period. The development
of this sector is believed to be the major
source of employment and income
generation for a wider group of the
society in general and urban youth in
particular. According to the Ministry of
Urban Development and Construction
(MoUDC), a total of 51,983 MSEs were
established in 2010/11 employing
541,883 people. The number of
establishments and total employment
went down by 70.6 percent and 18.7
percent respectively, compared to a year
ago. The total amount of loan received
from micro finance institutions was Birr
983 million, 20.7 percent higher than last
fiscal year.
Table: 1.4 Numbers, Amount of Credit and Jobs Created through MSEs (Credit in Millions of Birr)
Source: MoUDC
2009/10 2010/11 Percentage Change
A B C= (B/A)
No. of MSEs 176,543
51,983 -70.6
Total Employment 666,192 541,883 -18.7
Amount of credit (in millions of Br) 814.1 983 20.7

National Bank of Ethiopia
2010/11 Annual Report 15
Table: 1.5. Number, Amount of Credit and Jobs Created through MSEs by Region (Credit in Millions of Birr)
Oromia Amhara SNNPR Tigray Harari Dire Dawa
Addis Ababa
Grand Total
No. of MSEs 11,684 26,273 4,586 859 137 68 8,166 51,983 Amount of Credit 115.78 160.60 100.13 197.50 4.66 6.27 397 982.51 Total Employment 264,443 97,447 48,767 54,238 1433 9,575 60481 541,883
Percentage Share by Region
No. of MSEs 22.48 50.54 8.82 1.65 0.26 0.13 15.71 100 Amount of Credit 11.78 16.35 10.19 20.10 0.47 0.64 40.39 100 Total Employment 48.80 17.98 9.00 10.01 0.26 1.77 11.16 100
Source: MoUDC
Regarding regional distribution, Amhara
region with 50.5 percent of total MSEs,
was the leading in establishing MSEs,
followed by Oromia (22.5 percent),
Addis Ababa (15.7 percent), SNNPR
(8.8 percent) and Tigray (1.7 percent).
Of the total credit disbursed through
MFIs, Addis Ababa accounted for 40.4
percent, Tigray 20.1 percent, Amhara
16.4 percent, Oromia 11.8 percent,
SNNR 10.2 percent, Dire Dawa 0.6
percent and Harari 0.5 percent.

National Bank of Ethiopia
2010/11 annual report 16
OromiaAmaharaSNNPRTigray AfarGambelaBen.GumzeSomaliHarariDire DawaAddis Ababa
2010/11 Amount of credit 11.8 16.3 10.2 20.1 0.5 0.6 40.42010/11 No.of MSE'S 22.5 50.5 8.8 1.7 0.3 0.1 15.72009/10 Amount of credit 15.8 15.5 15.0 19.8 0.5 0.4 0.2 33.32009/10 No.of MSE'S 8.9 31.1 2.5 48.6 5.4 0.1 3.4
0%10%20%30%40%50%60%70%80%90%
100%
In P
erce
nt
Fig I.2 Regional share of Number of MSE's and amountof credit During Fiscal year of 2010/11
2010/11 Amount of credit
2010/11 No.of MSE'S
2009/10 Amount of credit
2009/10 No.of MSE'S
Source: MoUDC
1.5 Access to Water Supply
The five-year Growth & Transformation
Plan, envisaged to increase the total
population having access to safe
drinking water (rural and urban) from
68.5 percent in 2005/06 to 98.5 percent
by 2015. In addition, urban population
having access to potable water within
0.5 km and rural population having
access to potable water within 1.5 km
are expected to grow to 100 and 98.5
percent, respectively by the end of the
plan period from 91.5 and 68.5 percent
in 2010/11.
The overall national access to potable
water supply climbed to 73.3 percent
(i.e., 92.5 percent for urban and 71.3
percent for rural) in 2010/11 from 68.5
percent (i.e., 91.5 percent for urban and
65.8 percent for rural) in 2009/10
showing annual growth of 4.8
percentage points.
Similarly, urban population with access
to potable water within 0.5 km went up
from 91.5 percent in 2009/10 to 92.5
percent in 2010/11 depicting a 1.0
percentage point rise over the preceding

National Bank of Ethiopia
2010/11 annual report 17
fiscal year. Besides, rural population
with access to potable water within 1.5
km reached 71.3 percent by the end of
2010/11, exhibiting a 5.5 percent growth
compared to 65.8 percent in the previous
year.
.
Table: 1.6 Percentages of People with Access to Potable Water by Region
2009/10 2010/11 Change in percentage
point A B C D E F
Region Rural Urban Average Rural Urban Average D-A E-B F-C
Addis Ababa 96.0 96.0 96.08 96.08 0.0 0.1 0.1
Tigray 58.8 85.3 64.0 60.4 89.7 66.1 1.6 4.4 2.1
Amhara 80.0 90.0 76.0 89.9 90.6 84.9 9.9 0.6 8.9
Oromia 64.5 95.5 68.5 70.1 97.3 73.6 5.6 1.8 5.1
SNNPR 58.7 90.9 62.0 63.0 92.8 66.0 4.3 1.8 4.0
Afar 67.0 77.7 69.5 65.7 84.2 68.1 -1.3 6.5 -1.4
Somali 37.0 76.5 42.5 36.1 74.6 41.5 -0.9 -1.9 -1.0
Ben-Gumz 81.0 90.1 80.2 86.9 87.4 85.0 5.9 -2.7 4.8
Harari 53.0 95.0 75.8 56.5 122.5 92.3 3.5 27.5 16.5
Gambella 63.1 73.0 65.7 73.6 70.1 72.7 10.5 -2.9 7.0
Dire Dawa 76.0 79.7 78.1 74.2 77.8 76.2 -1.8 -1.9 -1.9 National Average 65.8 91.5 68.5 71.3 92.5 73.3 5.5 1.0 4.8
Source: Ministry of Water Resources Development (MoWRD) and NBE Staff Computation
Note: Water supply access is calculated based on the provision of 20 liters/capita/day for urban
and 15 l/c/d for rural at a radius of 0.5 and 1.5 kilo meters, respectively.

National Bank of Ethiopia
2010/11 annual report 18
1.6 Road Transport Development
During 2010/11, the Ethiopian road
network reached 53,143 km (42.2
percent Federal and 57.8 percent rural)
with annual growth rate of 10.7 percent
as a result of 3,662 km new road being
constructed. Of the total 22,431 km
Federal roads, asphalt road constituted
37 percent and gravel road 63 percent.
Moreover, the share of the total paved or
asphalt road reached to 15.6 percent,
about 2.0 percentage points higher than
the preceding year.
The community road, which was not
calculated as part of the total road
network as it was non-engineered road,
was 854km declined by 99.1 percent
over the previous year.
During the review year, road density
including community road was 48.1km
per 1,000 square km moving upwards by
5.9 from the previous year in line with
the five year Growth and Transformation
Plan which planned to increase total road
net work to 64,500 km in 2015.

National Bank of Ethiopia
2010/11 annual report - 19 -
Likewise, road density per 1, 000 sq km.
is targeted to rise to 123.7 sq. km in
2015 from 48.1 sq. km in 2010/11 while
road density per 1000 population will
increase to 1.54 in 2015 from 0.65 in
2010/11.
The performance of road density per
1,000 sq. km showed 8.8 percent annual
growth in 2010/11 and road density per
1000 population 8.3 percent compared
to last fiscal year.
All-weather road (rural road) expanded
by 7 percent per annum constituting 54
percent or 14,869 miles of the total road
network in 2007/08. Besides, the annual
All-weather road (rural road) expanded
by 14 percent per annum constituting
57.8 percent (or 30,712 kms) in 2010/11.
Besides, average distance from all-
weather roads slightly declined to 10.35
from 11.3 kilometers a year ago.
Similarly, the proportion of area more
than 5 km from all weather roads went
down to 61.69 percent in 2010/11 from
64.2 percent in 2009/10.

National Bank of Ethiopia
2010/11 annual report - 20 -
Fig. I.4: Status of Roads (%)
Source: Ethiopian Roads Authority and NBE Staff Computation

National Bank of Ethiopia
2010/11 annual report - 21 -
Fig. I.5: Investment in Road Construction and Expansion (In million of Birr)
Source: Ethiopian Roads Authority and NBE Staff Computation
The percentage of total road network
in good status was 57 percent in the
review period.
Figure I.5 illustrates the total
investment capital for road
construction and expansion. It has
been steadily rising over the last ten
years reaching Birr 19.5 billion in
2010/101 of which Birr 17 billion (or
87.2 percent) was attributed to Federal
roads.
National Bank of Ethiopia
2010/11 annual report 22
1.7 Development on Education Sector
The education sector has witnessed its
improvement both in terms of quality
and coverage since 2006/07, positive
trend to achieve Growth and
Transformation Plan goal of producing
democratic, efficient and effective,
knowledge based, inspired and
innovative citizens who can contribute
to the realization of the long term
vision of making Ethiopia into a
Middle Income Economy.
In line with this, Primary education (1-
8 grades) enrolment grew from 14
million in 2006/07 to 15.8 million in
2009/10 and 17 million in 2010/11.
Besides, the number of primary
schools reached 28,301 in 2010/11
from 20,660 in 2006/07. Of the total
primary schools, 24,313 or 86 percent
were located in the rural areas where
about 77 percent of the total population
lives.
On the other hand, secondary
education enrolment stood at 1.8
million, 4 and 26 percent higher than
2009/10 and 2006/07, respectively.
In addition, by the end of 2010/11, the
number of secondary schools (9-12
grades) reached 1,392 exhibiting a 46
percent growth since 2006/07. Of the
total secondary schools, 1,053 or 76
percent were found in urban areas.
Technical and Vocational Education
and Training (TVET) enrolment was
371,347, 5.1 and 94.3 percent above in
a year earlier and 2006/07,
respectively. Parallel to this, the
number of TVET institutions increased
to 505 against 388 in five years ago.
The education share of the annual
national budget was 17.5 percent,
which was 32 and 29 percentage points
lower than that of the preceding year
and 2006/07, respectively.

National Bank of Ethiopia
2010/11 annual report 23
Table 1.7: Education Sector Data
Indicators 2006/07 2007/08 2008/09 2009/10 2010/11
1999 2000 2001 2002 2003 Improvement of Education Service Number of primary schools (urban, rural) 20,660 23,354 25,092 26,951 28,301
i. Urban 2,680 3,100 3,206 3,206 3,988 ii. Rural 17,980 20,254 21,886 23,745 24,313
Number of secondary schools (urban, rural) 952 1087 1185 1351 1392
iii. Urban 803 904 976 1,053 1,053 iv. Rural 149 183 209 298 339
Number of TVET centers (public, private, mission) 388 458 458 448 505 Number of tertiary level institutions by universities (public, private), colleges (public, private) 55 61 72 90 86 Universities 21 22 22 22 26 Student intake capacity of higher education institutions 43,764 56,421 NA NA 95,000 Participation of women in higher education institutions (%) 26 24 22.2 27 27 Primary enrolment (in million) 14.0 15.3 15.6 15.8 16.7 Secondary enrolment (in thousands) 1,399 1,501 1,588 1,696 1,760 TVET enrolment 191,151 229,252 308,501 353,420 371,347 Girls' primary enrolment (%) 45.9 46.5 47.3 47.4 47.3 Grades (1-4) gross enrolment ratio (%) 117.1 127.8 122.6 118.8 124 a. Girls' gross enrolment ratio (%) 111.2 122.8 118.4 114.3 119.1 b. Boys' gross enrolment ratio (%) 122.9 133 126.7 123.2 128.8 Grades (5-8) gross enrolment ratio (%) 61.1 60.2 63.1 65.5 66.1 a. Girls' gross enrolment ratio (%) 53.7 55.5 60.5 63.5 64.8 b. Boys' gross enrolment ratio (%) 68.3 64.8 65.6 67.4 67.4 Girls’ gross primary enrolment ratio (%) 85.1 90.5 90.7 101.6 93.2Boys' gross primary enrolment ratio (%) 98 100.5 97.6 108.4 99.5 Gross Primary Enrolment ratio (%) (urban, rural, regional) 91.7 95.6 94.4 93.4 96.4 a. Tigray 104.8 109 107.1 103.3 102.1 b. Afar 22.2 26.2 31.2 39.3 40.1 c. Amhara 93.1 112.4 112.5 104.9 104.2 d. Oromia 91.4 91.4 89.3 88.4 94.8 e.Somali 38.5 32.7 35 65.6 61.3 f. Ben.Gumuz 127.9 112.3 112.1 114.6 119.7 g. SNNPR 97.8 102.9 101 97.3 102.6 h. Gambella 181.4 121.4 112.5 125.1 132 i. Harari 116.8 108.4 107.9 95.3 91.5 j. A.A 114.3 109.2 107.3 103.1 k. Dire Dawa 80 86.3 92.1 91.3 89.1 Primary net enrolment rate (%) 79.1 83.4 83 82.1 89.7 No. of students registered in the first cycle primary schools(1-4) (in million) 9.8 10.7 10.6 10.5 11.3

National Bank of Ethiopia
2010/11 annual report 24
No. of students registered in the second cycle primary schools(5-8) (in million) 4.2 4.6 5 5.3 5.5Number of students registered in the first cycle secondary schools(9-10) (in million) 1.2 1.3 1.4 1.5 1.5 Gross enrolment rate in (9-10 grades)(%) 37.3 37.1 38.1 39.1 38.4 Number of students registered in the second cycle secondary schools(11-12)(in million )
0.2 0.2 0.21 0.24 0.23Preparatory admission 101,367 100,651 118,289 142,781 NA TVET Admission 99,430 95,563 NA 95,563 NA Completion rate of primary school (%) 42.9 44.7 43.6 47.8 49.4 Girls/boys ratio in primary schools (%) 85 87 89.7 91 90.4 Girls/boys ratio in secondary schools (%) 59 63 67 0.75 79 Girls/boys ratio in(9-10) 0.61 0.65 0.72 0.78 0.81 Girls/boys ratio in (11-12) 0.5 0.48 0.4 0.56 0.83 Girls/boys ratio inTVET 0.78 0.92 0.86 0.8 0.86 Girls/boys ratio in higher education 0.25 0.24 0.28 0.36 0.36 Grade 1-8(primary) repetition rates (%) 6.1 6.7 6.7 4.9 8.5 Primary school dropout rate (%) 12.4 14.6 14.6 18.6 13.1 1st grade dropout rate (%) 20.1 18.3 22.9 28.1 19.9 Pupil/teacher ratio i. Grade (1-8) 59 57 54 51 51 ii. Grade (9-12) 48 43 41 36 31 iii. TEVT 27 25 34 NA 29 iv. In higher education 24.3 NA 28.2 26.8 Pupil/section ratio i. Grade (1-8) 64 62 59 57 57 ii. Grade (9-12) 79 74 68 64 58 Number of class rooms in primary schools 206,106 236,712 247,759
254,744 279,292
Pupil-textbook ratio i. Grade(1-8) 1.5 1.5 1.5 1.5 NA ii. Grade(9-12) 1 1 1 1 NAPupil-school ratio i. Grade(1-8) 678.3 657 619 573 590 ii. Grade(9-12) 1,449 1,381 1,345 1270 1160 iii. TVET 493 501 673 788 735 Annual education share of the national budget{%} 24.6 22.8 23.6 25.9 17.5 Proportion of pupils starting grade 1 who reach grade 5(%) 59.3 49.2 39.6 75.6 69.1 Percentage of female enrolled in under graduate degree (%) 26 24.1 29 27 27 Percentage of female graduated in under-graduate degree (%) 18 20.6 29.7 23.4 27.2 Percentage of female enrolled in post-graduate degree 10 9.6 11.3 11.9 13.8 Percentage of female graduated in post- graduate degree 9.4 10.7 10.5 13.9 14.4
Source:- Education Statistics Annual Abstract, Ministry of Education & NBE Staff Computation

National Bank of Ethiopia
2010/11 annual report 25
1.8 Telecommunications
Ethio-Telecom, the former
Ethiopian Telecommunications Corpor
ation (ETC), has been undertaking
several huge network expansion
projects during the last few years with
a view to enhancing the development
of the telecom sector and to support
the steady growth of the country.
To ensure that Ethio Telecom runs
parallel with top telecom operators, the
Ethiopian government has reached an
agreement with France Telecom, one
of the world’s leader
telecommunication companies. This
agreement will help Ethio Telecom to
improve its management capability
through the transfer of world-
renowned know-hows and skills.
Ethio- Telecom has
provided national and international tele
communications services using Satellit
e, microwave Digital Radio Multi-
Access System (DRMAS), VSAT,
UHF, VHF, Long Line and HF Radio.
The current task of Ethio-Telecom is
the expansion of Telecom services
intensively throughout the country
with required standards through
deployment of Next Generation
Network (NGN) projects. In parallel
with the country’s endeavor to access
the Ethiopian society with multi-
faceted NGN based telecom services
across the nation, the government has
already engaged in deploying a new
telecom company through the
application of transformational plan
leading to create a world-class telecom
service provider.
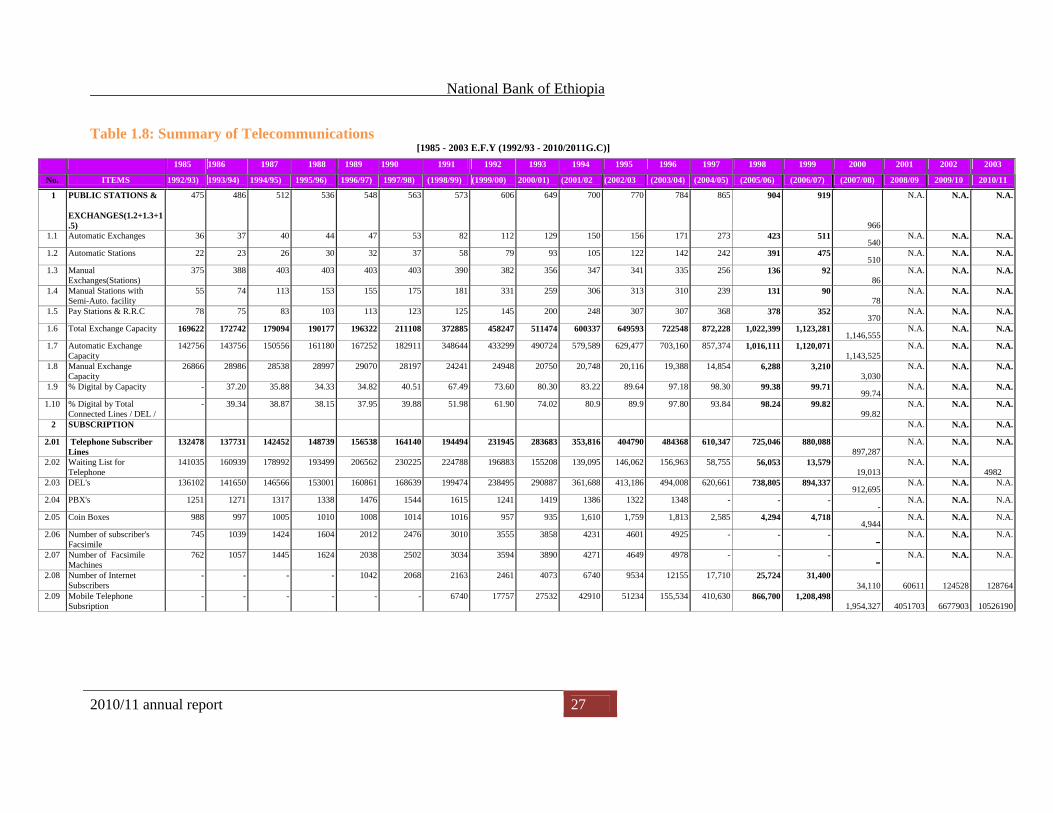
The number of waiting list for fixed
telephone subscribers was 4,982 in the
review year 2010/11 (Table 1.8).
Similarly, the number of Internet subsc
ribers went up from 124,528 in
2009/10 to 128,764 in the reported
period registering a 3.4 percent
increase.
Besides, the country's telecommunicati
on penetration rate (tele-density mobile
plus fixed telephone subscribers per
100 inhabitants) increased from 10.1 in
2009/10 to 13.9 in 2010/11.
The country’s five-year development
plan Growth & Transformation Plan
(GTP) envisages increasing the
number of fixed line subscribers from
1 million in 2010/11 to 3.05 million by
the end of 2014/15.

National Bank of Ethiopia
2010/11 annual report 26
The number of mobile-telephone
subscribers and Internet users is also
expected to pick up to a respective 40
million and 3.69 million by the end of
the plan period from 6.52 million and
187,000 in 2010/11.
National Bank of Ethiopia
2010/11 annual report 27
Table 1.8: Summary of Telecommunications [1985 - 2003 E.F.Y (1992/93 - 2010/2011G.C)]
1985 1986 1987 1988 1989 1990 1991 1992 1993 1994 1995 1996 1997 1998 1999 2000 2001 2002 2003
No. ITEMS 1992/93) 1993/94) 1994/95) 1995/96) 1996/97) 1997/98) (1998/99) (1999/00) 2000/01) (2001/02 (2002/03 (2003/04) (2004/05) (2005/06) (2006/07) (2007/08) 2008/09 2009/10 2010/11
1 PUBLIC STATIONS & EXCHANGES(1.2+1.3+1.5)
475 486 512 536 548 563 573 606 649 700 770 784 865 904 919
966
N.A. N.A. N.A.
1.1 Automatic Exchanges 36 37 40 44 47 53 82 112 129 150 156 171 273 423 511 540
N.A. N.A. N.A.
1.2 Automatic Stations 22 23 26 30 32 37 58 79 93 105 122 142 242 391 475 510
N.A. N.A. N.A.
1.3 Manual Exchanges(Stations)
375 388 403 403 403 403 390 382 356 347 341 335 256 136 92 86
N.A. N.A. N.A.
1.4 Manual Stations with Semi-Auto. facility
55 74 113 153 155 175 181 331 259 306 313 310 239 131 90 78
N.A. N.A. N.A.
1.5 Pay Stations & R.R.C 78 75 83 103 113 123 125 145 200 248 307 307 368 378 352 370
N.A. N.A. N.A.
1.6 Total Exchange Capacity 169622 172742 179094 190177 196322 211108 372885 458247 511474 600337 649593 722548 872,228 1,022,399 1,123,281 1,146,555
N.A. N.A. N.A.
1.7 Automatic Exchange Capacity
142756 143756 150556 161180 167252 182911 348644 433299 490724 579,589 629,477 703,160 857,374 1,016,111 1,120,071 1,143,525
N.A. N.A. N.A.
1.8 Manual Exchange Capacity
26866 28986 28538 28997 29070 28197 24241 24948 20750 20,748 20,116 19,388 14,854 6,288 3,210 3,030
N.A. N.A. N.A.
1.9 % Digital by Capacity - 37.20 35.88 34.33 34.82 40.51 67.49 73.60 80.30 83.22 89.64 97.18 98.30 99.38 99.71 99.74
N.A. N.A. N.A.
1.10 % Digital by Total Connected Lines / DEL /
- 39.34 38.87 38.15 37.95 39.88 51.98 61.90 74.02 80.9 89.9 97.80 93.84 98.24 99.82 99.82
N.A. N.A. N.A.
2 SUBSCRIPTION
N.A. N.A. N.A.
2.01 Telephone Subscriber Lines
132478 137731 142452 148739 156538 164140 194494 231945 283683 353,816 404790 484368 610,347 725,046 880,088 897,287
N.A. N.A. N.A.
2.02 Waiting List for Telephone
141035 160939 178992 193499 206562 230225 224788 196883 155208 139,095 146,062 156,963 58,755 56,053 13,579 19,013
N.A. N.A. 4982
2.03 DEL's 136102 141650 146566 153001 160861 168639 199474 238495 290887 361,688 413,186 494,008 620,661 738,805 894,337 912,695
N.A. N.A. N.A.
2.04 PBX's 1251 1271 1317 1338 1476 1544 1615 1241 1419 1386 1322 1348 - - --
N.A. N.A. N.A.
2.05 Coin Boxes 988 997 1005 1010 1008 1014 1016 957 935 1,610 1,759 1,813 2,585 4,294 4,718 4,944
N.A. N.A. N.A.
2.06 Number of subscriber's Facsimile
745 1039 1424 1604 2012 2476 3010 3555 3858 4231 4601 4925 - - - - N.A. N.A. N.A.
2.07 Number of Facsimile Machines
762 1057 1445 1624 2038 2502 3034 3594 3890 4271 4649 4978 - - - - N.A. N.A. N.A.
2.08 Number of Internet Subscribers
- - - - 1042 2068 2163 2461 4073 6740 9534 12155 17,710 25,724 31,400 34,110 60611 124528 128764
2.09 Mobile Telephone Subsription
- - - - - - 6740 17757 27532 42910 51234 155,534 410,630 866,700 1,208,498 1,954,327 4051703 6677903 10526190

National Bank of Ethiopia
2010/11 annual report 28
Cont’d Table 1.8: [1985 - 2003 E.F.Y (1992/93 - 2010/2011G.C)]
1985 1986 1987 1988 1989 1990 1991 1992 1993 1994 1995 1996 1997 1998 1999 2000 2001 2002 2003No. ITEMS 1992/93) 1993/94) (1994/95 1995/96) 1996/97) 1997/98)
(1998/99)(1999/00) (2000/01) (2001/02) (2002/03) (2003/04) (2004/05) (2005/06) (2006/07) (2007/08) (2008/0
9) (2009/10) (2010/11)
2.10
Percentage of lines residential/business
62.4/19.6 63.4/17.7 62/18 62/19 62/20 61/20 62/19 63/20 67/19 70/17.7 70.5/16.5 72.5/16.6 74/16.5 74.8/16.5 73.2/14.975.6/15.5
N.A. N.A. N.A.
2.11 Number of Digital Data Circuits - - - - - - - - - - 129 178 - - --
N.A. N.A. N.A.
2.12 Number of Digital Data Customers - - - - - - - - - - 65 91 - - --
N.A. N.A. N.A.
2.13 Number of Rural Kebeles - - - - - - - - - - - - 60 4,837 7,389 8,676
N.A. N.A. N.A.
3 TELEPHONE TRAFFIC (millions)
N.A. N.A. N.A.
3.1 Metered -Pulses 470.8 523.6 540 568.3 619.45 704.4 786.42 1010.21 1253.41 1573.99 1890.37 2,225.14 2,341.99 2,475.56 2,714.31 2,715.07
N.A. N.A. N.A.
3.2 Metered -CDR * 344.60 346.11
N.A. N.A. N.A.
3.3 Interurban calls (via operator) 3.7 4.4 5.4 6.08 6.65 7.22 6.78 7.72 10.37 12.73 14.18 15.57 - - --
N.A. N.A. N.A.
3.4 International calls (OG) 2.8 3.1 3.1 3.41 3.56 3.94 4.08 4.36 4.62 4.62 4.93 6.67 8.57 11.48 5.73 -
N.A. N.A. N.A.
3.5 International minutes (OG) 10.9 11.5 10.5 10.35 10.69 11.84 12.45 13.42 13.42 12.88 14.31 17.70 20.59 28.68 15.95 27.10 32777569 35894689
3.6 International calls (IC) 4.09 4.49 5.45 6.47 6.76 7.11 8.15 7.68 8.63 8.71 - - - - --
N.A. N.A. N.A.
3.7 International minutes (IC) 22.88 23.17 26.15 32.5 38.14 38.8 38.59 36.73 42.71 35.56 54.81 133.68 199.12 240.01 289.09 504.90538062202 611198303
4 Mobile Telephone and Internet Traffic
N.A. N.A. N.A. N.A.
4.1 Mobile -Local (million mins.) - - - - - - - 26.76 60.80 77.01 120.75 165.76 N.A. N.A. N.A. N.A. N.A. N.A. N.A.
4.2 Mobile -International (million mins.) - - - - - - - 1.41 2.43 2.45 3.34 3.83 N.A. N.A. N.A. N.A. N.A. N.A. N.A.
4.3 Internet Traffic ( ' 000 hours ) - - - - - - - 334.60 577.11 622.05 2,325.33 3,285.74 N.A. N.A. N.A. N.A. N.A. N.A. N.A.
5 TELEGRAPH MESSAGES (Thousands)
N.A. N.A. N.A. N.A.
5.1 National 152.4 153.5 165.9 183.3 158.2 124.3 126 107.2 102.6 85.9 80.3 64.34 55.04 - - N.A. N.A. N.A. N.A.
5.2 International (OG) 5 3 3 2.7 2.3 1.6 1.2 1.4 0.66 0.41 0.95 0.36 0.11 - - N.A. N.A. N.A. N.A.
6 INTERNATIONAL CIRCUITS N.A. N.A. N.A. N.A.6.1 Satellite Telephone Circuits 247 346 345 369 350 386 386 380 427 430 514 802 1,816 1,749 1,756 - 2119 2730 27086.2 Microwave Telephone Circts 49 91 91 186 193 25 25 26 53 53 109 109 137 167 167 - 178 178 3016.3 Submarine Cable 18 18 24 24 24 - - - 25 73 102 101 250 578 1,018 1768 3087 3625

National Bank of Ethiopia
2010/11 annual report 29
Cont’d Table 1.8:
[1985 - 2003 E.F.Y (1992/93 - 2010/2011G.C)]
1985 1986 1987 1988 1989 1990 1991 1992 1993 1994 1995 1996 1997 1998 1999 2000 2001 2002 2003
No. ITEMS ( 1992/93) 1993/94) (1994/95 1995/96) 1996/97) 1997/98) (1998/99) (1999/00) (2000/01) (2001/02) (2002/03) (2003/04) (2004/05) (2005/06) (2006/07 (2007/08 N.A. N.A. N.A.
7 PERSONNEL N.A. N.A. N.A. N.A.
Male 3434 3352 3514 3470 3582 3861 4267 4607 4868 5058 5416 5987 6,763 7,764 8,087 8,712 8913 9145 6999
Female 1862 1870 1982 1993 2037 2225 2306 2476 2502 2522 2497 2632 3,015 3,470 3,557 3,548 3471 3697 1622
Total 5296 5222 5496 5463 5619 6086 6573 7083 7370 7580 7913 8619 9,778 11,234 11,644 12,260 12384 12842 8621
8 FINANCE
8.1 Income (Millions Birr) 253.40 292.10 445.80 496.73 551.80 624.34 624.09 720.37 932.19 914.82 1042.66 1241.76 1,813.80 2,155.04 N.A.3,292.25 5663 7050.7 8556.08
8.2 Expense (Millions Birr) 154.30 179.20 194.46 199.98 222.30 280.86 285.64 371.12 718.74 468.40 487.43 638.42 820.26 1,499.60 N.A.951.74 2113 2967.09 2894.79
8.3 Gross Profit (Millions Birr)
99.10 112.90 251.34 296.75 329.50 343.48 338.45 349.25 213.45 446.42 555.23 603.34 993.54 655.44 N.A.2,340.51 4398 5348.97 6999.56
8.4 ASSETS (Millions Birr)
8.5 Fixed Gross (Millions Birr)
536.80 573.20 603.49 695.34 731.35 837.47 911.46 1218.92 1611.42 1818.60 2340.06 2596.34 2,806.21 2,843.80 N.A.4,667.90 4637 4730.07 21735.48
8.6 Depreciation (Millions Birr)
302.10 326.10 348.65 376.35 408.26 442.62 483.4 544.72 630.09 748.28 918.89 1084.14 1,256.37 1,430.73 N.A.1,595.66 230 253.27 2191.97
8.7 Net Asset (Millions Birr) 234.70 247.10 254.84 318.99 323.09 394.85 428.08 674.20 981.33 1070.32 1421.17 1512.20 1,549.84 1,413.07 N.A.3,072.25 2211 2051.48 16865.39
9 Population /in millions/ 51.43 53.02 54.65 56.37 58.12 59.88 61.67 63.49 65.3947 67.22 69.13 71.10 73.2 75.2 77.1 79.4
N.A. N.A. 80.9.
10 Teledensity 0.26 0.26 0.26 0.26 0.27 0.27 0.32 0.37 0.43 0.53 0.59 0.68 0.83 0.98 1.161.15
N.A. N.A. N.A.
11 Teledensity (Fixed + Mobile)
- - - - - - 0.33 0.39 0.48 0.59 0.66 0.90 1.39 2.14 2.733.61 6.56 10.06 13.88
Source: Ethiopian Telecommunications Corporation, Annual Statistical Bulletin, (2007/08) Note: - Average annual growth rate is computed for the years 1992/93-2007/08 E.F.Y. * Traffic of CDR-10 and AXE-10 exchanges measured in pulses; but for the remaining exchanges in CDR -Figures in brackets under annual growth column show declines
National Bank of Ethiopia
2010/11 annual report 30
II. ENERGY PRODUCTION
2.1 Electric Power Generation
Ethiopia is one of the few African
countries with a huge potential to
produce hydroelectric and geothermal
power. Nine of its major rivers are
suitable for hydroelectric power with a
total capacity of generating 45,000
MW. The country also has vast
potential for geothermal energy
generation.
The Ethiopian Electric Power
Corporation (EEPCo) supplies power
to more than 1,830,052 customers.
Under the five year Growth and
Transformation Plan (GTP), the
country’s installed electricity
generating capacity is expected to
reach 8000 MW by the end of fiscal
year 2014/15 from the current level of
2000 MW. This is anticipated to be
achieved by committing huge
investment to construction of dams and
harnessing other power generation
schemes such as geothermal, wind and
solar powers.
The Ethiopian Electric Power
Corporation, a government corporation
mandated with the task of generating,
transmitting, distributing, and selling
electricity, generates electricity
through two different power supply
systems, namely, the Inter Connected
System (ICS) and Self Contained
System (SCS).
The ICS, which is largely generated by
hydropower plants, constitutes the
major source of electric power in
Ethiopia. The SCS system contributes
less than 3 percent. In 2010/11 power
supply through ICS accounted for 99
percent.
The total amount of electric power
generated during the current fiscal year
was 4980.5 million KWH, which is
27.5 percent higher than the previous
year.

National Bank of Ethiopia
2010/11 annual report 31
Of this, hydropower accounting for
about 99.0 percent and the remaining
being the share of thermal (0.6
percent) and geothermal (0.4 percent)
sources. (See Table 2.1 below).
Source: EEPCo
By end 2015 the coverage of electricity
is planned to scale up to 75 percent
compared to 41 percent in 2010.
Energy utilization capacity is also to
grow five fold to 10,000 MW from
2000 MW during the same period.
The number of customers with access
to electric power is targeted to reach 4
million in 2015 from about 2 million in
2010.
To achieve these objectives, the
Ethiopian government is undertaking
several programs such as electric
power generation and construction
program, electricity transmission lines
construction program, the power
distribution and expansion program
and universal electrification access
programs.

National Bank of Ethiopia
2010/11annual report 32
Table 2.1: Electric Power Generation in ICS and SCS
(In 000 KWH)
Source 2008/09 2009/10 2010/11
Percentage Change
[A] [B] [C] [C/A] [C/B]
ICS
Hydro Power 3,277,138 3,418,610 4,922,069 50.2 44.0Thermal Power 380,416 418,170 13,716 -96.4 -96.7Geothermal 6,581 23,522 19,267 192.8 -18.1
Sub Total 3,664,134 3,860,302 4,955,052 35.2 28.4
SCS
Hydro Power 7,928 20,113 9,351 17.9 -53.5Thermal Power 30,542 24,960 16,094 -47.3 -35.5Geothermal
Sub Total 38,470 45,073 25,445 -33.9 -43.5
Total
Hydro Power 3,285,066 3,438,723 4,931,420 50.1 43.4Thermal Power 410,958 443,130 29,810 -92.7 -93.3Geothermal 6,581 23,522 19,267 192.8 -18.1
Grand Total 3,702,604 3,905,375 4,980,497 34.5 27.5 Source: EEPCo
2.2 Volume and Value of Petroleum
Imports
Ethiopia's second commercial energy
resource is oil. During the year under
review a total of 1902.23 million metric
tons of petroleum products worth Birr
26.75 billion were imported by the
Ethiopian Petroleum Enterprise (EPE).
Although the import volume dropped by
about 23 percent, import value recorded
a 60 percent over the previous years
presumably due to the devaluation of the
Ethiopian Birr against the USD and the
increase of petroleum price in the world
commodity market.
Component wise, except fuel oil, the
volume of all other petroleum products
imported tended to decline. On the
other hand, the value of all petroleum
products exhibited 59 percent price
surges on average.

National Bank of Ethiopia
2010/11annual report 33
Table 2.2: Volume and Value of Petroleum Imports
(Volume in MT and Value in '000 Birr)
Products 2009/10 2010/11 Percentage
Change Volume Value Volume Value [A] [B] [C] [D] [C/A] [D/B]
Regular Gasoline (MGR) 194,066 1,375,397 143878.8 1,743,315 -25.9 26.7 Jet Fuel 610,846 4,451,842 559522.5 9,738,630 -8.4 118.8 Fuel Oil 123,621 744,190 150,968 1171276.2 22.1 57.4 Gas Oil (ADO) 1,568,443 10,254,924 1,047,862 14096853 -33.2 37.5 Total 2,496,977 16,826,353 1,902,232 26,750,074 -23.8 59.0
Source: Ethiopian Petroleum Enterprise
-
200,000
400,000
600,000
800,000
1,000,000
1,200,000
1,400,000
2002/03 2003/04 2004/05 2005/06 2006/07 2007/08 2008/09 2009/10 2010/11
Volu
me
In M
T
Year
Fig. II.2 Trends in Volume of Petroleum Imports
MGR Jet Fuel Fuel Oil Gas Oil
Source: Ethiopian Petroleum Enterprise

National Bank of Ethiopia
2010/11annual report 34
0
2,000,000
4,000,000
6,000,000
8,000,000
10,000,000
12,000,000
14,000,000
16,000,000
2002/03 2003/04 2004/05 2005/06 2006/07 2007/08 2008/09 2009/10 2010/11
Val
ue in
'000
Bir
r
Year
Fig. II.3 Trends in Value of Petroleum Imports
MGR Jet Fuel Fuel Oil Gas Oil
Source: EPE
Generally, domestic retail prices of
petroleum products are adjusted monthly
in line with the movements of oil prices
in the world market. As a result, the
average domestic prices of all petroleum
products increased over the previous
fiscal year. Specifically, in Addis Ababa,
the average retail prices of petroleum
products grew by 37 percent. Component
wise, MGR, Fuel oil, Gas oil and
kerosene surged by about 38 percent, 31
percent, 41 percent and 37 percent,
respectively.

National Bank of Ethiopia
2010/11annual report 35
Table2.3 :- Annual Retail Prices of Petroleum Products in Addis Ababa ( Birr / liter)
YEAR Quarter MGR Fuel Oil Gas
Oil Kerosene
2007/08
Qtr.1 7.80 4.10 5.40 4.10 Qtr.2 7.80 4.10 5.40 4.10 Qtr.3 9.60 5.90 6.90 5.70 Qtr.4 9.60 5.90 6.90 5.70
Average 8.70 5.00 6.20 4.90
2008/09
Qtr.1 9.61 5.89 6.90 5.72 Qtr.2 9.61 7.40 9.40 7.50 Qtr.3 8.14 5.90 7.81 6.00 Qtr.4 8.20 5.80 7.30 5.70 Average 8.89 6.25 7.85 6.23
2009/10
Qtr.1 9.67 8.10 8.45 7.46
Qtr.2 12.33 9.53 10.15 8.88 Qtr.3 12.99 9.88 10.53 9.29 Qtr.4 13.10 9.87 10.72 9.50 Average 12.02 9.34 9.96 8.78
2010/11
Qtr.1 13.14 10.08 10.98 9.75 Qtr.2 15.10 11.64 12.87 11.43
Qtr.3 17.14 12.98 14.75 12.92
Qtr.4 20.94 14.09 17.73 14.05
Average 16.58 12.20 14.08 12.04
Source:EthiopianPetroleumEnterprise

National Bank of Ethiopia
2010/11annual report 36
III. PRICE DEVELOPMENTS
3.1. Developments in Consumer Price at National Level
Annual average general inflation at the
close of the fiscal year 2010/11 was 18.1
percent, 15.3 percentage point higher than
the preceding year level. This was
predominantly due to the hike in the prices
of food items that contributes the lion’s
share of 14.1 percentage point of the total
annual change in headline inflation while
non-food items made up the remaining 1.2
percentage point (Table 3.1).
Annualized food inflation, scaled up to
15.7 percent from -5.4 percent in June
2010 registering notable rise of 21.1
percentage point on account of a
significant surge in the prices of cereals
(which accounts roughly for about 39.5
percent of food CPI,) coffee, potatoes, oil
and fats, milk & cheese, bread and
prepared food among others.
Likewise, annual average core inflation
slightly increased to 21.8 percent from
18.2 percent at the end of last fiscal year
(Table 3.1 and Fig. 3.1) as a result of
higher prices of all non-food items.
Year-on-year, headline inflation surged to
38.1 percent from 7.3 percent a year ago
(Fig 3.2) as both food and non-food price
inflation registered 45.0 and 8.1
percentage points increase, respectively.
Annual food inflation, which was just 0.0
percent in June 2010, increased to 45.0
percent in June 2011 while core inflation
picked up to 27.9 percent from 19.7 over
the same period.

National Bank of Ethiopia
2010/11annual report 37
Table 3.1: Annual Average Inflation Rates (in percent)
Consumption Items
2009/10 2010/11 Change (in Percentage Points)
Contribution to Change in Headline Inflation (in Percentage Points)
A B B-A C General 2.8 18.1 15.3 15.3 Food -5.4 15.7 21.1 14.1 Non-Food 18.2 21.8
3.6 1.2 Source: CSA and NBE Staff Computation
-10.00.0
10.020.030.040.050.060.070.0
J J AS O ND
J F M AM
J J A S ONDJ F MAMJ J AS ON DJ F MAM
J J AS O ND
J F M A M
J
2007/08 2008/09 2009/10 2010/11
Inflation in %
Figure III.1 Developments in Annualized National Headline, Food & Core Inflation
General Food Core
Source: CSA and NBE Staff Computation

National Bank of Ethiopia
2010/11annual report 38
-20.0
0.0
20.0
40.0
60.0
80.0
100.0
J F M A M
J J A S O N D J F M A MJ J A S O N D J F M A M
J J A S O N D J F MA M
J
2008/09 2009/10 2010/11
Inflation in %
Figure III.2 Developments in Annual (year-on-year) National Headline, Food and Core Inflation
Headline Food Core
Source: CSA and NBE Staff Computation
3.2 Consumer Price Developments in
Regional States
At the end of 2010/11, regional simple
average headline inflation jumped to
16.3 percent from 4.0 percent a year
earlier. Addis Ababa, Amhara, Harari,
Oromia, SNNP and Somali regional
states registered headline inflation rates
above the regional simple average (Table
3.2). The highest surge in headline
inflation (18.2 percentage point) was
recorded in Oromia and the lowest (6.9
percentage point) in Afar.

National Bank of Ethiopia
2010/11annual report 39
Table 3.2: Regional Average Annual Inflation (2010/11 FY)
Regions 2009/10 2010/11 Change
General Food Non Food General Food Non
Food General Food Non Food
A B C D E F G=D-A H=E-B I=F-C Addis Ababa 10.1 4.1 16.0 19.4 14.8 23.5 9.3 10.7 7.5Afar 12.7 7.5 22.4 19.6 14.9 27.1 6.9 7.4 4.7Amhara 0.7 -6.9 20.0 15.9 11.8 24.0 15.2 18.7 4B.Gumz -2.9 -11.7 14.5 9.5 4.0 17.9 12.4 15.7 3.4D.Dawa 5.5 1.0 12.2 14.7 13.2 16.6 9.2 12.2 4.4Gambella -3.2 -9.4 8.2 11.3 8.3 16.1 14.5 17.7 7.9Harari 6.8 2.5 12.9 19.3 20.5 17.8 12.5 18 4.9Oromia 1.1 -7.0 17.3 19.3 18.4 22.0 18.2 25.4 4.7SNNP 4.0 -4.7 18.9 19.7 18.8 19.1 15.7 23.5 0.2Somali 8.3 3.7 19.6 20.9 21.5 19.6 12.6 17.8 0.0Tigray 1.0 -7.5 18.9 9.7 5.3 16.9 8.7 12.8 -2.0
Mean 4.0 -2.6 16.4 16.3 13.8 20.1 12.3 16.4 3.6Standard dev. 5.2 6.5 4.2 4.3 6.0 3.6 3.5 5.4 3.1Coeff. of Var. 1.3 -2.5 0.3 0.3 0.4 0.2 0.3 0.3 0.9
Source: CSA and NBE Staff Computation
-10.00.0
10.020.030.040.0
Addis A
baba
Afar
Am
hara
B. G
umuz
Dire D
awa
Gam
bella
Harari
Orom
ia
SNN
P
Somali
Tigray
Infla
tion
in %
Fig.III.3: Regional Annual Average Headline Inflation
2009/10 2010/11
Source: CSA and NBE Staff Computation
The regional simple average food inflation
was 13.8 percent at the end of June 2011
with Addis Ababa, Afar, Oromia, Harari,
SNNP and Somali regions experiencing
higher food price inflation than the
regional simple average (Table 3.2).

National Bank of Ethiopia
2010/11annual report 40
The highest increase in food inflation was
registered in Oromia (25.4 percentage
points) and the lowest in Afar (7.4
percentage points). Over the two-year
period (2009/10 to 2010/11), food price
instability was high in Gambella,
Benishangul Gumz, Amhara, Oromia and
Tigray states but relatively low in Dire
Dawa, Afar, and Addis Ababa.
-10.0
-5.0
0.0
5.0
10.0
15.0
20.0
25.0
Add
is A
baba
Afa
r
Am
hara
B. G
umuz
Dir
e D
awa
Gam
bella
Har
ari
Oro
mia
SNN
P
Som
ali
Tig
ray
Val
ues i
n %
Fig.III.4: Regional Annual Average Food Inflation
2009/10 2010/11
2
Source: CSA and NBE Staff Computation
During 2010/11, simple average regional
non-food inflation stood at 20.1 percent
(Table 3.2). Addis Ababa, Afar, Amhara,
and Oromia regions recorded non-food
inflation higher than the regional simple
average. Compared to 2009/10, all
regional states, except Tigray, exhibited a
surge in non-food inflation.

National Bank of Ethiopia
2010/11annual report 41
Source: CSA and NBE Staff Computation
The highest rise in non-food inflation was
recorded in Gambella (7.9 percentage
points), and the lowest (-2.0 percentage
points) in Tigray.
Regarding convergence as measured by the
change in coefficient of variation1 in
regional rates of inflation between 2009/10
and 2010/11, no significant change was
observed apparently due to the growing
regional market integration as transportation
and communication improved. In general,
inflation soared largely due to increasing
food and oil prices in the international
market.
1Coefficient of variation is the ratio of standard deviation to mean.

National Bank of Ethiopia
2010/11annual report 42
IV. MONETARY AND FINANCIAL DEVELOPMENTS
4.1 Monetary Developments and Policy During the year under review, Ethiopia’s
monetary policy was geared towards
containing inflationary pressure.
Accordingly the National Bank of Ethiopia
has been closely monitoring monetary
development so as to arrest the speed of
inflation and inflation expectation.
However, annual average head line
inflation at the end of the fiscal year
reached 18.1 percent from 2.8percent last
year due the surge in international
commodity prices and marginal increase in
base money.
4.1.1 Developments in Monetary
Aggregates
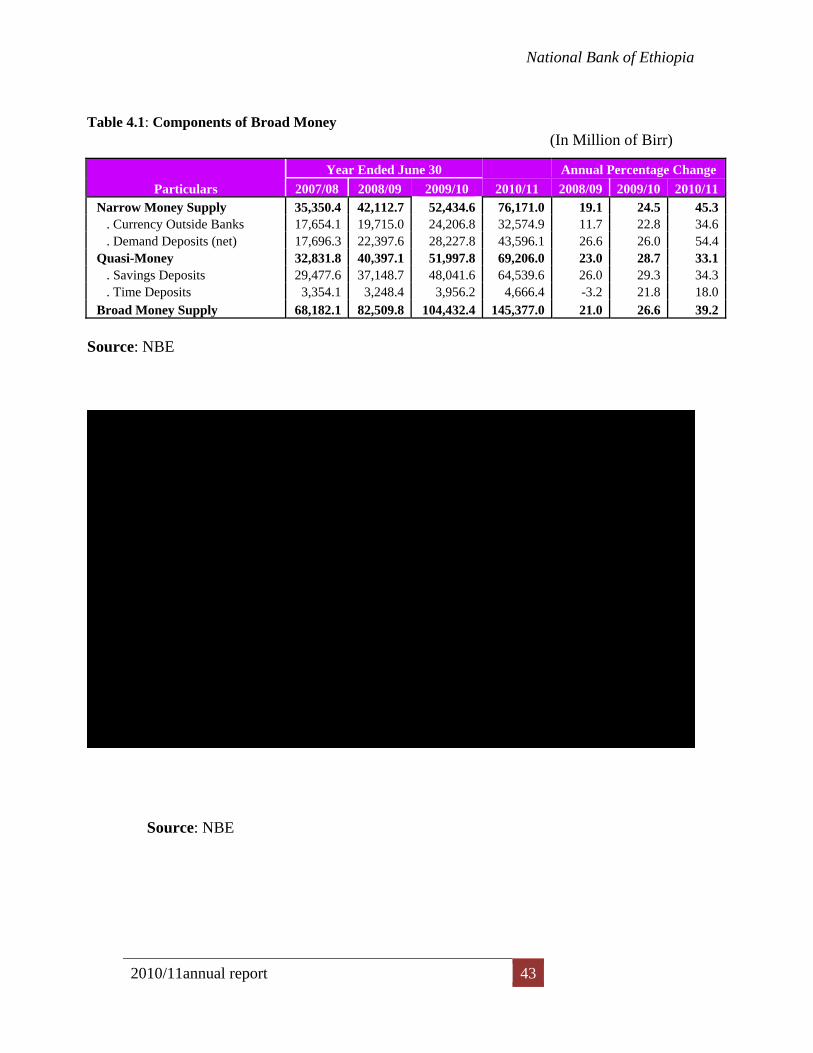
As at end 2010/11, domestic liquidity as
measured by broad money supply (M2)
reached Birr 145.4 billion reflecting 39.2
percent growth over last year, largely due
to 104.2 percent surge in net foreign assets
and 29.8 percent growth in domestic credit.
Domestic credit to the non-government
sector rose by 49.9 percent while credit to
central government slowed down by 13.3
percent.
In terms of components of broad money,
narrow money rose by 45.3 percent due to
34.5 percent rise in currency outside banks
and 54.4 percent surge in demand deposits
reflecting the growth in economic activities
and improvements in transactions demand
for money. Similarly, quasi-money that
comprises savings and time deposits went
up by 33.1 percent and reached Birr 62.9
billion, owing to improved financial
intermediation by banks through opening
up of 289 new branches.
National Bank of Ethiopia
2010/11annual report 43
Table 4.1: Components of Broad Money (In Million of Birr)
Particulars Year Ended June 30 Annual Percentage Change
2007/08 2008/09 2009/10 2010/11 2008/09 2009/10 2010/11 Narrow Money Supply 35,350.4 42,112.7 52,434.6 76,171.0 19.1 24.5 45.3 . Currency Outside Banks 17,654.1 19,715.0 24,206.8 32,574.9 11.7 22.8 34.6 . Demand Deposits (net) 17,696.3 22,397.6 28,227.8 43,596.1 26.6 26.0 54.4 Quasi-Money 32,831.8 40,397.1 51,997.8 69,206.0 23.0 28.7 33.1 . Savings Deposits 29,477.6 37,148.7 48,041.6 64,539.6 26.0 29.3 34.3 . Time Deposits 3,354.1 3,248.4 3,956.2 4,666.4 -3.2 21.8 18.0 Broad Money Supply 68,182.1 82,509.8 104,432.4 145,377.0 21.0 26.6 39.2
Source: NBE
02,0004,0006,0008,000
10,00012,00014,00016,00018,00020,00022,00024,000
04/05 05/06 06/07 07/08 08/09 9/10 10/11
(In Millions of Birr)
Fig IV.1: Major Components of Broad Money(1992/93 - 2010/11)
Quasi- Money Net Demand Deposit Currency Outside Banks 1 10025.95
Broad Money
Year
Source: NBE

National Bank of Ethiopia
2010/11annual report 44
Table 4.2: Factors Influencing Broad Money In Millions of Birr)
Source: NBE
-50.0
0.0
50.0
100.0
150.0
200.0
250.0
300.0
350.0
400.0
-30.0
-20.0-10.0
0.0
10.020.0
30.0
40.050.0
60.070.0
80.0
Annual Percentage Growth
Ethiopian Fiscal year
Fig IV.2: Major Determinants of Monetary Growth
Credit to Central Gov't Credit to Non-Central Gov'tBroad Money Net Foreign Assets
NFAOthers
Source: NBE
Particulars Year Ended June 30 Percentage Change
2007/08 2008/09 2009/10 2010/11 2007/08 2008/09 2009/10 2010/11 External Assets (net) 11,665.6 17,976.8 27,189.8 55,534.7 -12.6 54.1 51.2 104.2 Domestic Credit 79,969.3 89,203.0 104,413.5 135,553.9 29.3 11.5 17.1 29.8 . Claims on Central Gov't (net) 33,075.7 32,786.5 33,013.1 28,651.7 9.0 -0.9 0.7 -13.2 . Claims on Non-Central Gov't 46,893.6 56,416.5 71,400.4 106,902.2 48.8 20.3 26.6 49.7 Other Items (net) 23,452.7 24,670.1 27,170.9 45,711.6 26.5 5.2 10.1 68.2 Broad Money (M2) 68,182.1 82,509.8 104,432.4 145,377.0 20.4 21.0 26.6 39.2

National Bank of Ethiopia
2010/11annual report 43
4.1.2. Developments in Reserve Money
and Monetary Ratios
During the year under review, reserve
money or base money rose by 39.7
percent over last year due to the 35.8
percent increase in currency in
circulation and 45.2 percent growth in
bank deposits. The growth in reserve
money was attributed to the surge in net
foreign assets and net domestic credit.
Excess reserves of commercial banks
increased to Birr 7.3 billion from Birr
6.3 billion last year reflecting the
increased deposit mobilization
capabilities of banks as a result of strong
branch expansion. Deposit liabilities of
banks surged by 42.5 percent during the
review period.
The ratio of M2/GDP, an indicator of
financial deepening, went up merely by
6.7 percent to 29.1 percent in 2010/11,
partly indicating the tight monetary
policy measures taken to mitigate the
inflationary pressures. Money multiplier
defined as narrow money to reserve
money and broad money to reserve
money remained the same at 1.1 and 2.1
percent, respectively.
Table 4.3: Reserve Money and Monetary Ratios (In Millions of Birr)
Source: NBE)
* M2/GDP ratio was calculated on the basis of new GDP series.
Year Ended June 30 Percentage Change
Particulars 2007/08 2008/09 2009/10 2010/11 2007/08 2008/09 2009/10 2010/11 Reserve Requirement (CB's) 9,112.9 11,183.3 14,368.0 20,495.2 251.5 22.7 28.5 42.6 Actual Reserve (CB's) 15,233.0 19,569.4 20,620.9 27,757.3 29.8 28.5 5.4 34.6 Excess Reserve (CB's) 6,120.1 8,386.0 6,252.9 7,262.1 -33.1 37.0 -25.4 16.1 Reserve Money 35,551.1 45,107.0 49,424.5 69,043.1 30.2 26.9 9.6 39.7 . Currency in Circulation 20,216.4 23,836.4 28,802.9 39,100.6 33.2 17.9 20.8 35.8 . Bank Deposits 15,334.7 21,270.7 20,621.5 29,942.5 26.3 38.7 -3.1 45.2 Money Multiplier (Ratio): . Narrow Money to Reserve Money 1.0 0.9 1.1 1.1 -8.3 -6.1 13.6 4.0 . Broad Money to Reserve Money 1.9 1.8 2.1 2.1 -7.5 -4.6 15.5 -0.3 Other Monetary Ratios (%): . Currency to Narrow Money 49.9 46.8 46.2 42.8 7.9 -6.3 -1.4 -7.4 . Currency to Broad Money 25.9 23.9 23.2 22.4 7.0 -7.7 -3.0 -3.3
. Narrow Money to Broad Money 51.8 51.0 50.2 52.4 -0.8 -1.6 -1.6 4.4 . Quasi Money to Broad Money 48.2 49.0 49.8 47.6 0.9 1.7 1.7 -4.4 M2/GDP Ratio* 27.5 24.6 27.2 29.1 -16.6 -10.4 10.7 6.7

National Bank of Ethiopia
2010/11annual report 44
01000020000300004000050000600007000080000
Value in Millions of Birr
year
Fig. IV.3: Reserve Money
Reserve Requirement (CB's) Actual Reserve (CB's)Excess Reserve (CB's) Reserve Money
Source: NBE
4.2. Developments in Interest Rate
Following the policy adjustment in
minimum deposit interest rate on December
1, 2010 all commercial banks changed their
lending rates. Accordingly, the minimum
deposit interest rate on saving deposits
increased to 5.04 percent per annum from 4
percent last year. With, the maximum
deposit rate reaching 5.75 percent, the
average interest rate on savings deposit rate
rose to 5.4 percent from 4.5 percent in the
preceding year. Similarly the weighted
annual average interest rate on time deposit
increased to 5.49 percent from 4.79 percent
of last year. Average lending rate witnessed
a decline from 12.25 percent to 11.88
percent due to lowering of minimum lending
rate from 8 to 7 percent and maximum
lending rate from 16.50 to 16.25 percent.
Yet, all rates, including yield on T-Bills
remained negative in real terms with annual
average headline inflation hovering around
18.1 percent during the review fiscal year.

National Bank of Ethiopia
2010/11annual report 45
Table 4.4: Interest Rate Structure of Commercial Banks ( In % per annum)
Rates 2001/02 2002/03 2003/04 2005/06 2005/06 2006/07 2007/08 2008/09 2009/10 2010/11
Deposit Rate Savings Deposit Minimum 3.00 3.00 3.00 3.00 3.00 3.00 4.00 4.00 4.00 5.04 Maximum 3.15 3.15 3.15 3.15 3.15 3.15 4.15 5.00 5.00 5.75 Average* 3.08 3.08 3.08 3.08 3.08 3.08 4.08 4.50 4.50 5.40 Time deposit Up to 1 year 3.30 3.35 3.40 3.60 3.60 3.64 4.67 4.12 4.56 5.37 1 -2 years 3.51 3.62 3.64 4.01 4.01 4.11 5.23 4.48 4.80 5.51 Over 2 years 3.57 3.82 3.84 4.30 4.30 4.49 5.59 4.73 5.01 5.60 Average* 3.46 3.60 3.62 3.97 3.97 4.08 5.16 4.44 4.79 5.49 Demand Deposit (Average*) 0.04 0.04 0.05 0.06 0.06 0.06 0.04 0.06 0.06 0.06 Lending Rate Minimum 7.50 7.00 7.00 7.00 7.00 7.00 8.00 8.00 8.00 7.50 Maximum 14.00 14.00 14.00 14.00 14.00 14.00 15.00 16.50 16.50 16.25 Average* 10.75 10.50 10.50 10.50 10.50 10.50 11.50 12.25 12.25 11.88 Real Rate of Interest Deposit 1/ 13.65 -14.70 0.70 -7.73 -7.73 -12.03 -51.13 1.80 1.70 -12.70 Deposit 2/ 2.79 1.98 0.48 -7.93 -7.93 -7.83 -19.13 -10.50 -13.70 -16.40 Lending/1 21.32 -7.27 8.12 -0.30 -0.30 -4.60 -43.70 9.55 13.70 -6.23 T-bills (Nominal) 1.98 1.31 1.05 0.04 0.04 0.50 0.67 0.80 0.89 1.31
Source: NBE 1/ Real saving deposit interest rates and real lending rates computed based on average headline inflation. 2/ Real saving deposit interest rates computed based on average core inflation.
• It is simple average for saving deposit and lending rates, while weighted mean for time and demand deposits. As a result, the movements in the average interest rate on time and demand deposits reflect the change in the proportion of commercial bank deposits that would pay higher interest rate on time and demand deposits, rather than the change in interest rate.

National Bank of Ethiopia
2010/11annual report 46
0.002.004.006.008.00
10.0012.0014.00
Value in %
Years
Fig. IV.4: Interest Rate Structure of Commercial Banks
Average Saving Deposit Rate Average Time Deposit Rate
Average Lending Rate
Source: NBE
4.3 Developments in Financial Sector
The major financial institutions operating in
Ethiopia are banks, insurance companies and
micro-finance institutions. The number of
banks operating in the country during the
fiscal year reached 17 following the
establishment of two new banks. In terms of
ownership, fourteen were private
commercial banks and the remaining three
state-owned.
During the fiscal year, 289 new bank
branches were opened raising the total
branch network in the country to 970 from
681 last year. As a result, the bank to people
ratio declined from 117,4742 people to
82,474 in 2010/11.
The significant branch expansion was
undertaken by CBE (208), followed by Bank
of Abyssinia (10 branches), Oromia
International Bank (9 branches), with Awash
International Bank, United Bank and Lion
International Bank opening 8 branches each.
Due to the aggressive branch expansion by
CBE, the share of private banks branch
network went down to 49 percent at the end
of 2010/11 from 60 percent last year.
2 Taking total population80 million

National Bank of Ethiopia
2010/11annual report 47
The number of bank branches in Addis
Ababa, the capital and major business center
of the country, increased by 13.9 percent
from last year, indicating booming economic
activities in the city.
Following significant capital injection by
private banks mainly Awash International
Bank (Birr 383 million), Wegagen Bank
(Birr 265 million), Nib International Bank
(Birr 260 million), United bank (Birr 242
million) and Dashen bank (Birr 185 million),
the total capital of the banking industry
increased by 23.3 percent and reached Birr
15.9 billion by the end of June 2011. As a
result, the share of private banks in the total
capital rose to 43.6 percent from 40.2
percent last year.
In the meantime, the number of insurance
companies increased to 14 from last year
level of 12. The number of branches reached
221 following the opening of 11 additional
branches. Major expansions of branches
were undertaken by Awash Insurance,
Oromia Insurance, Ethiopian Insurance and
Nib insurance.
Of the total insurance branches, 50.7 percent
were concentrated in Addis Ababa. Private
insurance companies owned 81.4 percent of
the total branches.
On the other hand, the total capital of
insurance companies declined by 0.7 percent
from Birr 962.4 million to Birr 955.7
million. Private insurance companies
accounted for 69.5 percent of the total
capital, while the remaining share was taken
up by the single public owned enterprise, the
Ethiopian Insurance Corporation.

National Bank of Ethiopia
2010/11annual report 48
Source: Commercial Banks

National Bank of Ethiopia
2010/11annual report 49
Table. 4.5. A: Capital and Branch Network of the Banking System at the Close of June 30,
2011 (Branch in Number and Capital in Million Birr)
Banks
Branch Network Capital 2009/10 2010/11 2009/10 2010/11
Addis Ababa Regions Total %
Share Regions Addis Ababa Total %
Share Total
Capital %
Share Total
Capital %
Share
1. Public Banks • Commercial Bank of
Ethiopia 49 160 209 30.7 323 94 417 43.0
5,532.0
42.8
6,262.0 39.3 • Construction &
Business Bank 15 17 32 4.7 17 17 34 3.5
229.0
1.8
277.0 1.7 • Development Bank of
Ethiopia 1 31 32 4.7 31 1 32 3.3
1,969.0
15.2
2,179.0 13.7 Total Public Banks 65 208 273 40.1 371 112 483 49.8 7,730.0 59.8 8,718.0 54.7 2. Private Banks
• Awash International Bank 31 31 62 9.1 36 34 70 7.2
721.0
5.6
1,104.0
6.9
• Dashen Bank 30 29 59 8.7 31 34 65 6.7
967.0
7.5
1,152.0
7.2
• Abyssinia Bank 25 22 47 6.9 25 32 57 5.9
482.0
3.7
532.0
3.3
• Wegagen Bank 23 27 50 7.3 29 24 53 5.5
828.0
6.4
1,093.0
6.9
• United Bank 27 15 42 6.2 18 32 50 5.2
506.0
3.9
748.0
4.7
• Nib International Bank 31 17 48 7.0 19 32 51 5.3
723.0
5.6
983.0
6.2 • Cooperative Bank of
Oromiya 5 32 37 5.4 38 5 43 4.4
169.0
1.3
207.0
1.3 • Lion International
Bank 11 11 22 3.2 17 13 30 3.1
201.0
1.6
318.0
2.0 • Oromia International
Bank 6 21 27 4.0 25 11 36 3.7
208.0
1.6
265.0
1.7
• Zemen Bank 3 0 3 0.4 0 3 3 0.3
121.0
0.9
193.0
1.2 • Buna International
Bank 3 0 3 0.4 2 9 11 1.1
169.0
1.3
220.0
1.4 • Berhan International
Bank 5 3 8 1.2 3 7 10 1.0
108.0
0.8
138.0
0.9
• Abay Bank 0 0 0 0.0 7 1 8 0.8 - -
161.0
1.0 • Addis International
Bank 0 0 0 0.0 n/a n/a - - - -
117.0
0.7
Total Private Banks 200 208 408 59.9 250.0 237.0 487 50.2
5,203.0
40.2
7,231.0
43.6
3.Grand Total Banks 265 416 681 100 621 349 970 100.0
12,933.0 100.0
15,949.0
98.3 Source: Commercial Banks

National Bank of Ethiopia
2010/11annual report 50
Table.4.5. B: Branch Network & Capital of Insurance Companies at a close of June 2011. (Branch in Number and Capital in Million Birr)
No. Insurance Companies Branch Capital
2009/10 2010/11 2009/10 2010/11 % Change A.A Regions Total A.A Regions Total A B B/A
1 Ethiopian Ins. Cor. 11.0 28.0 39 11 30 41 333.9 291.0 -12.9 2 Awash Ins.Com.S.C. 15.0 11.0 26 18 11 29 93.7 89.0 -5.0 3 Africa Ins.Com S.C. 6.0 7.0 13 6 7 13 23.4 81.0 245.4 4 National Ins. Co. of Eth. 8.0 8.0 16 8 8 16 105.2 27.9 -73.4 5 United Ins.Com. S.C 15.0 7.0 22 15 8 23 20.4 88.0 331.3 6 Global Ins. Com.S.C 6.0 4.0 10 6 4 10 90.0 27.8 -69.1 7 Nile Ins.Com.S.C 11.0 9.0 20 11 10 21 77.9 100.3 28.7 8 Nyala Ins.Com.S.C 8.0 8.0 16 8 8 16 102.7 96.3 -6.2 9 Nib Ins. Com.S.C 12.0 8.0 20 14 8 22 77.0 87.4 13.4 10 Lion Ins. Com.S.C 6 5 11 6 5 11 13.2 17.3 31.1 11 Ethio-Life Ins.Com.S.c - - - 0 0 - 4.4 4.9 11.8
12 Oromia Ins.Com.S.c 6 8 14 8 8 16 20.5 23.9 16.8
13 Abay Insurance Company S.C 1 2 3 1 2 3 - 11.4 -
14 Berhan insurance S.C - - - - - - - 9.4 -
15 Total 105.0 105.0 210 112 109 221 962.4 955.7 -0.7 Source: Insurance Companies
Note: A.A=Addis Abeba
Source: Insurance Companies

National Bank of Ethiopia
2010/11annual report 51
By the end of 2010/11, the number of
microfinance institutions (MFIs) operating
in the country rose by 1 and reached 31.
Their total capital increased by 24 percent to
Birr 2.9 billion and their assets rose by 27.6
percent to Birr 10.2 billion mirroring their
ever growing rose in the economy.
Deposit mobilization and credit prevision of
microfinance institutions have also
witnessed a remarkable increment.
Compared to last year, deposit mobilization
went up by 42 percent and reached Birr 3.8
million. Their total credit to clients also rose
by 20 percent to Birr about 7 billion
indicating the expanding outreach of
microfinance institutions.
Of the total MFIs, 14 (46.7 percent) were
operating in Addis Abeba. The three largest
MFIs, namely Amhara, Oromia and Dedebit
Credit and Savings institutions accounted
for 67.1 percent of the total capital, 81.4
percent of the savings, 74.0 percent of the
credit and 76.2 percent of the total assets of
MFIs by the end of 2010/11.
Table 4.6: Microfinance Institutions Performance as of June 2010 (In Thousands of Birr)
Micro-Financing Institutions
2008/09 2009/2010 2010/2011 % Change
A
B C C/B*100
Total Capital 1,737,402.7 2,375,228.0 2,945,970.0 24
Saving 2,098,742.1 2,658,962.0 3,779,089.0 42
Credit 4,936,135.2 5,824,489.0 6,991,986.0 20
Total Assets 6,620,630.8 7,958,194.0 10,156,387.0 27.6 Source: Microfinance Institutions 4.3.1 Resource Mobilization
Total resource mobilization by the
banking system in the form of net
deposits, collection of loans and net
borrowings increased by 58.9 percent
and reached Birr 76.5 billion at the end
of 2010/2011.

National Bank of Ethiopia
2010/11annual report 52
Spurred by remarkable branch expansion,
deposit liabilities of the banking system
reached Birr 140.5 billion reflecting
annual growth rate of 42.5 percent over
last year. Component wise, demand
deposits registered a 53.5 percent growth
followed by savings deposits (34.3
percent), and time deposits (16.4
percent). Demand deposits accounted for
50.4 percent of the total deposits
followed by saving deposits (46 percent)
and time deposit (3.8 percent).
The surge in demand deposit over saving
deposit indicates the relative increase in
transaction demand for money. At the
same time the growth in saving deposits
reflected an increase in financial
intermediation of banks.
Despite the arrival of two new private
banks and opening of 61 new branches
by private commercial banks, the share
of private banks in deposit mobilization
went down to 33.3 percent from 35.2
percent last year. CBE alone mobilized
58.3 percent of the total deposit due to its
large branch network.
Raising funds through borrowing was not
an important source of resource
mobilization. As a result, total
outstanding borrowing at the end of the
fiscal year was only Birr 9.6 billion. Of
the total borrowing, domestic sources
accounted for 89.5 percent, while foreign
sources took the remaining balance.
On the other hand, loan collection by the
banking system stood at Birr 30.6 billion
up by 21.9 percent over last year. More
than half of the loan collection (60.8
percent) was by the private banks.

National Bank of Ethiopia
2010/11annual report 53
Table 4.7: Annual Resource Mobilization & Disbursing Activities of Commercial Banks and DBE (Specialized Bank) at June 30, 2011 (In Million Birr)
Particulars
2008/09 2009/10 2010/11 Percent Change Public Banks
Private Banks
Total (A)
Public Banks
Private Banks
Total (B)
Public Banks
Private Banks
Total (C) C/A C/B
1. Deposits (net change)
7,524.9 7,670.8 15,195.7 11,863.0 8,618.4 20,481.4 30,423.2 11,475.2 41,898.4 175.7 104.6 Demand
4,482.9 3,042.3 7,525.2 6,813.9 2,067.9
8,881.8
19,721.7 4,971.7
24,693.4 228.1 178.0 Savings
2,905.7 4,765.4 7,671.1 4,574.5 6,322.0
10,896.6
10,114.6 6,364.2
16,478.8 114.8 51.2 Time
136.3
(137.0)
(0.6) 474.5 228.5
703.0
586.9 139.3
726.2
(112,867.5) 3.3 2. Borrowing (net change)
366.2 - 366.2 2,597.5 -
2,597.5
4,041.7 -
4,041.7 1,003.7 55.6 Local
225.0 - 225.0 2,266.1 -
2,266.1
4,001.0 -
4,001.0 1,678.1 76.6 Foreign
141.2 - 141.2 331.4 -
331.4
40.8 -
40.8
(71.1)
(87.7) 3. Collection of Loans
10,368.8 11,596.7 21,965.5 10,168.0 14,898.8
25,066.8
11,987.8 18,560.4
30,548.2 39.1 21.9 4. Total Resources Mobilized (1+2+3)
18,260.0 19,267.5 37,527.4 24,628.4 23,517.2
48,145.6
46,452.7 30,035.6
76,488.4 103.8 58.9
5. Disbursement 12,782.3 12,694.7 25,477.0 13,939.3 14,965.8
28,905.1
21,955.8 20,252.0
42,207.9 65.7 46.0 6. Change in Liquidity (4-5) 5,477.7 6,572.8 12,050.5 10,689.2 8,551.4 19,240.5 24,496.9 9,783.6 34,280.5 184.5 78.2 Memorandum Item: 7. Outstanding Credit*
33,912.8 17,720.8 51,633.5 39,384.7 22,896.0
62,280.7
50,743.5 26,947.0
77,690.5 50.5 24.7
Source: Commercial Banks &Staff Computation * Includes coupon bonds issued by the government.

National Bank of Ethiopia
2010/11annual report 54
Table 4.8: Deposits and Borrowings of Commercial Banks and DBE at June 30, 2011 (in Million Birr)
2008/09 2009/10 2010/11 C/A C/B A B C
A. Deposits -Demand 37,267.3 46,149.0 70,842.4 90.1 53.5 -Savings 37,153.3 48,049.9 64,528.7 73.7 34.3 -Time 3,731.4 4,434.4 5,160.6 38.3 16.4 T o t a l 78,152.0 98,633.3 140,531.8 79.8 42.5 B. Borrowings -Local 2,399.4 4,665.6 8,666.5 261.2 85.8 -Foreign 647.3 978.7 1,019.4 57.5 4.2 T o t a l 3,046.7 5,644.2 9,686.0 217.9 71.6
Source: Commercial Banks &Staff Computation
4.3.2 New Lending Activities
Commercial banks including DBE
disbursed Birr 42.2 billion to various
economic sectors. Despite the tight
monetary policy measures followed by
the National Bank of Ethiopia, the fiscal
year witnessed a 46 percent increase in
fresh loan disbursements by banks,
indicating the surge in deposit
mobilization and loan collection. Of the
total new loans disbursed 48 percent was
provided by private banks, while the
public banks took the remaining balance.
The ratio of new loan disbursement to
total deposit was 40.5 percent for private
banks and 24.2 percent for public banks.
About 25 percent of the new loans went
to finance international trade followed by
industry (24.8 percent) and domestic
trade (16 percent), while other sectors
took the remaining share. The share of
the new loan disbursement to the
production sector (agriculture, industry
and housing & construction) rose from 46
percent last year to 51.2 percent in the
review year reflecting the shift in loan
disbursement towards production sector
in contrast to service sector.

National Bank of Ethiopia
2010/11annual report 55
Source: Commercial Banks and DBE Table.4.9: Loans and Advances by Lenders at June 30, 2011 (In Million Birr)
Lenders 2009/10 2010/11
Percentage Change D* C* O/S* D* C* O/S* A B C D E F D/A E/B F/C
A. Public Banks
1.Commercial Bank of Ethiopia 10697.0 9116.5 22,859.0 17796.8 10156.7 34,217.7 66.4 11.4 49.7 2. Construction & Business Bank of Ethiopia 494.3 496.5 1,748.3 367.2 593.8 1,726.6 -25.7 19.6 -1.2 3 .Development Bank of Ethiopia 2747.9 555.1 8,787.2 3791.8 1237.3 11,980.5 38.0 122.9 36.3 Sub-Total 13,939.3 10,168.0 33,394.6 21,955.8 11,987.8 47,924.8 57.5 17.9 43.5 B. Private Banks 4 Awash International Bank 2955.7 3153.3 3163.6 4654.0 4257.3 3994.8 57.5 35.0 26.3 5. Dashen Bank 2231.8 2434.3 5033.1 2912.0 2748.1 6141.7 30.5 12.9 22.0 6. Bank of Abyssinia 2139.8 1884.6 3153.2 2497.9 2338.4 3315.9 16.7 24.1 5.2 7. Wegagen Bank 2189.4 2324.4 2473.9 2612.0 2640.7 2910.0 19.3 13.6 17.6 8. United Bank 2283.7 2153.6 2524.7 2557.1 2287.4 3277.0 12.0 6.2 29.8 9. Nib International Bank 1066.8 1325.0 2546.1 1645.0 1724.9 2766.5 54.2 30.2 8.7 10. Cooperative Bank of Oromia 572.4 635.4 721.9 660.2 703.6 799.5 15.3 10.7 10.7 11. Lion International Bank 355.0 313.7 583.5 472.9 514.8 677.0 33.2 64.1 16.0 12. Oromia International Bank 424.0 263.2 383.9 649.4 465.4 645.2 53.1 76.8 68.1 13. Zemen Bank 367.6 275.6 369.0 817.4 490.0 661.7 122.4 77.8 79.3 14.Berhan International Bank 155.5 108.3 153.2 312.4 192.0 330.0 100.9 77.3 115.4 15.Bunna International Bank 224.2 27.6 191.4 309.5 187.0 366.3 38.1 577.8 91.4 16.Abay Bank 152.3 10.8 161.0 0.0 0.0 0.0 Sub-Total 14,965.8 14,898.8 21,297.5 20,252.0 18,560.4 26,046.6 35.3 24.6 22.3 Grand Total 28,905.1 25,066.8 54,692.1 42,207.9 30,548.2 73,971.4 46.0 21.9 35.3 Source: Commercial Banks
O/S Credit excludes lending to central government D*=Disbursement, C*=Collection, O/S*= Outstanding Credit

National Bank of Ethiopia
2010/11annual report 56
Table 4.10: Percentage Share of Loans and Advances by Lenders at June 30, 2011 (In Million Birr)
Lenders
2009/10 2010/11 Percentage change D* C* O/S* D* C* O/S*
A B C D E F D/A E/B F/C A. Public Banks 1.Commercial Bank of Ethiopia 37.0 36.4 41.8 42.2 33.2 46.3 13.9 -8.6 10.7 2.Development Bank of Ethiopia 9.5 2.2 16.1 0.9 1.9 2.3 -90.8 -12.2 -85.5 3. Construction & Business Bank of Ethiopia 1.7 2.0 3.2 9.0 4.1 16.2 425.4 104.5 406.7 Sub-Total 48.2 40.6 61.1 52.0 39.2 64.8 7.9 -3.3 6.1 B. Private Banks 4 Awash International Bank 10.2 12.6 5.8 11.0 13.9 5.4 7.8 10.8 -6.6 5. Dashen Bank 7.7 9.7 9.2 6.9 9.0 8.3 -10.6 -7.4 -9.8 6. Bank of Abyssinia 7.4 7.5 5.8 5.9 7.7 4.5 -20.1 1.8 -22.3 7. Wegagen Bank 7.6 9.3 4.5 6.2 8.6 3.9 -18.3 -6.8 -13.0 8. United Bank 7.9 8.6 4.6 6.1 7.5 4.4 -23.3 -12.8 -4.0 9. Nib International Bank 3.7 5.3 4.7 3.9 5.6 3.7 5.6 6.8 -19.7 10. Cooperative Bank of Oromia 2.0 2.5 1.3 1.6 2.3 1.1 -21.0 -9.1 -18.1 11. Lion Interenational Bank 1.2 1.3 1.1 1.1 2.1 1.2 -8.8 64.1 16.0 12. Oromia International Bank 1.5 1.1 0.7 1.5 1.9 1.2 4.9 76.8 68.1 13. Zemen Bank 1.3 1.1 0.7 1.9 2.0 1.2 52.3 77.8 79.3 14.Berhan International Bank 0.5 0.4 0.3 0.7 0.8 0.6 - - - 15.Bunna International Bank 0.8 0.1 0.3 0.7 0.7 0.7 - - - Sub-Total 50.5 58.9 38.3 47.6 60.5 35.0 -5.6 2.8 -8.6 Grand Total 98.7 99.5 99.4 99.6 99.8 99.8 1.0 0.3 0.4
Source: Commercial Banks D*=Disbursement, C*=Collection, O/S*= Outstanding Credit 4.3.3 Outstanding Loans
Total Outstanding credit of the banking
system, including the central government,
increased by 24.7 percent and reached
Birr 77.7 billion at end June 2011.
Outstanding claims on the central
government dropped by 51.1 percent
while those on the private sector
including cooperatives surged by 31
percent to Birr 60.3 billion.
Sectoral distribution of outstanding loans
indicated that credit to trade sector (both
domestic and international) accounted for
32.5 percent followed by industry (26.6
percent) and agriculture (13.6 percent).

National Bank of Ethiopia
2010/11annual report 57
Table 4.11: Loans & Advances by Economic Sectors1
Source: Commercial Banks &Staff Computation D*=Disbursement, C*=Collection, O/S*= Outstanding Credit 1/ includes lending to central government
Economic Sectors 2009/10 2010/11 Percentage Change
D* C* O/S* D* C* O/S* D* C* O/S* A B C D E F D/A E/B F/C
Government Deficit Financing 0 0 7,600.1 0 0 3,719.1 (51.1) Agriculture 4,437.1 3,619.6 6,819.6 8,248.0 5,114.4 10,575.3 85.9 41.3 55.1 Industry 4,958.2 2,213.3 12,234.9 10,465.2 3,556.5 20,650.5 111.1 60.7 68.8 Domestic Trade 5,169.4 5,550.2 6,210.0 6,733.5 6,148.3 7,261.1 30.3 10.8 16.9 International Trade 8,217.4 8,114.0 14,433.9 10,569.9 9,943.5 18,025.7 28.6 22.5 24.9 Export 5,279.5 4,472.5 5,137.3 5,921.4 6,078.5 7,222.8 12.2 35.9 40.6 Import 2,937.9 3,641.5 9,296.6 4,648.5 3,895.6 10,802.8 58.2 7.0 16.2 Hotels and Tourism 320.2 265.5 1,257.4 395.4 333.1 1,435.5 23.5 25.5 14.2 Transport and Communication 965.6 1,122.6 2,786.5 1,850.6 1,455.4 3,558.6 91.6 29.7 27.7 Housing and Construction 3,916.0 3,163.6 8,222.5 2,900.9 2,739.5 9,023.1 (25.9) (13.4) 9.7 Mines, Power and Water resource 7.2 6.7 3.4 7.3 14.9 37.2 0.2 123.5 986.6 Others 343.5 727.7 2,233.8 711.9 729.0 3,076.6 107.3 0.2 37.7 Personal 272.3 134.7 229.2 311.7 359.4 315.0 14.5 166.8 37.4 Interbank Lending 298.25 148.9997 260.9 13.66 123.5853 12.9 (95.4) (17.1) (95.0)
Total 28,905.1 25,066.8 62,292.2 42,207.9 30,548.2 77,690.5 46.0 21.9
24.7

National Bank of Ethiopia
2010/11annual report 58
Table 4.12: Loans and Advances by Borrowers at June 30, 2011 (In Million Birr)
Borrowing Sector
2007/08 2008/09 2009/10 2010/11 Percentage change O/S* O/S* O/S* D* C* O/S*
A B C E F G G/B G/C
Central Government 6,902.0 5,628.8 7,600.1 0.0 0.0 3,719.1 -33.9 -51.1
Public Enterprises 8,732.6 8,170.8 8,442.7 6,102.6 1,611.0 13,687.9 67.5 62.1
Cooperatives 3,161.1 3,364.5 5,077.8 7,502.5 4,494.7 8,377.5 149.0 65.0
Private & Individuals 29,269.6 34,041.9 40,910.7 28,589.2 24,319.0 51,893.1 52.4 26.8
Inter-bank Lending 176.5 427.5 260.9 13.7 123.5 12.9 -97.0 -95.0
Total 48,241.8 51,633.5 62,292.2 42,207.9 30,548.2 77,690.5 50.5 24.7
Total less Inter-bank Lending 48,065.3 51,206.0 62,031.3 42,194.2 30,424.7 77,677.5 51.7 25.2
Source: Commercial Banks &Staff Computation D*=Disbursement, C*=Collection, O/S*= Outstanding Credit
4.4. Financial Activities of NBE
By the end of 2010/11, outstanding
claims of NBE on the central
government went up by 20.3 percent to
Birr 55.3 billion. This was attributed to
a 27 percent rise in direct advances to
Birr 46.3 billion. Direct advances to
the government accounted for 83.6
percent of the total claims, while bond
holdings took the remaining 16.4
percent.
Total deposits at the NBE grew by 34.3
percent due to 30.7 percent rise in
deposits of financial institutions and
46.2 percent in that of central
government.

National Bank of Ethiopia
2010/11annual report 59
Table 4.14: Financial Activities of National Bank of Ethiopia at the Close of June 30, 2010
( in Million Birr)
Particulars 2008/09 2009/10 2010/11 % Change
A B C C/A C/B Loans and Advances (1+2) 44,498.7 45,989.7 61,570.7 38.4 33.9 1. Claims on Central Gov’t 44,498.7 45,989.7 55,320.7 24.3 20.3 1.1 Direct Advance 34,891.0 36,434.1 46,265.0 32.6 27.0
1.2 Bonds 9,607.7
9,555.6 9,055.7 -5.7 -5.2
2. Claims on DBE - - 6,250.0
-
-
3. Deposit Liabilities
28,054.3
30,310.3
40,705.9 45.1 34.3
3.1 Government 6,671.5
7,036.6 10,290.9 54.3 46.2 3.2 Financial Institutions 21,382.8 23,273.8 30,415.0 42.2 30.7
Source: NBE and Staff Computation
4.5 Developments in Financial Markets
4.5.1 Treasury Bills Market
Treasury bills market is the only regular
market where securities are transacted on a
fortnightly basis. Three types of T-bills with
a maturity period 28 days, 91 days and 182
days are supplied to the market. There is no
secondary market for the security.
Government bonds are occasionally issued to
finance government expenditures and/or to
absorb excess liquidity in the banking system.
The amount of Treasury-bills offered to the
fortnightly auction market during the fiscal
year reached Birr 83.4 billion, about 51
percent higher than last year. Total demand
also registered a 8.8 percent growth.
On the other hand, the amount of T-
bills sold during the year stood at
Birr 52.3 billion (98.3 percent of
total demand), depicting 25.3 percent
increase.
The dominance of commercial banks
in the T-bills market continued to
diminish through the review year
owing to enhanced participation of
non-bank institutions.

National Bank of Ethiopia
2010/11annual report 60
At the end of 2010/2011, the total outstanding
T-bills stood at Birr 10.8 billion, of which
91.7 percent was hold by non-bank
institutions.
The average weighted yield for all types of
bills increased to 1.13 from 0.79 percent last
year.
The yields for 28-days 91-days and
182 days T-bills grew by 94.7, 21.5
and 15.7 percent respectively over
last year reflecting the higher
demand for short term bills than the
long term bills.

National Bank of Ethiopia
2010/11annual report 61
Table 4.15: Results of Treasury Bills Auction at June 30, 2011
Particulars 2008/09 2009/10 2010/11 Percentage Change
A B C C/A C/B
Number of Bidders 261 280 220 -15.7 -21.4 Amount Demanded (Mn.Birr) 46,767.2 51,258.0 55,760.0 19.2 8.8 28-day bill 10,441.9 19,760.0 30,635.0 193.4 55.0 91-day bill 29,477.7 27,553.8 22,159.9 -24.8 -19.6 182-day bill 6,847.6 3,944.3 2,965.2 -56.7 -24.8
Amount Supplied (Mn.Birr) 28,471.9 55,203.3 83,390.7 192.9 51.1 28-day bill 4,265.0 15,110.0 41,575.9 874.8 175.2 91-day bill 15,931.7 28,150.5 35,152.6 120.6 24.9 182-day bill 8,275.2 11,942.8 6,662.1 -19.5 -44.2
Amount Sold (Mn.Birr) 27,839.8 41,736.4 52,316.0 87.9 25.3 Banks 2,672.0 13,902.0 20,271.3 658.7 45.8 Non-Banks 25,167.8 27,834.4 32,044.8 27.3 15.1
Average Weighted Price for Successful bids(Birr) 99.797 97.017 99.745 -0.052 2.811 28-day bill 99.951 99.943 99.886 -0.065 -0.057 91-day bill 99.783 99.757 99.703 -0.080 -0.054 182-day bill 99.657 91.352 99.645 -0.012 9.078
Average Weighted Yeild for Successful bids(%) 0.743 0.786 1.126 51.517 43.236 28-day bill 0.636 0.750 1.460 129.595 94.706 91-day bill 0.871 0.976 1.186 36.193 21.529 182-day bill 0.723 0.633 0.732 1.295 15.722 Outstanding bills at the end of period (Mn.Br.) 7,783.100 11,566.200 10,796.620 38.719 -6.654 Banks 1,672.000 4,400.000 900.000 -46.172 -79.545 Non-Banks 6,111.100 7,166.200 9,896.620 61.945 38.101
Source: NBE
4.5.2 NBE Bill Market
On April 4, 2011 NBE introduced NBE
Bill market to mobilize resource from the
banking system to finance priority sectors
identified as the driving forces of the
economy. Following the introduction of
the NBE Bill market, the total NBE bill
purchased by the banking sector reached
Birr 6.3 billion at the end of the fiscal
year. .

National Bank of Ethiopia
2010/11annual report 62
Source: NBE
4.5.3. Bonds Market
In recent years, following the strong growth
in economic activities and real income, the
issuance of corporate bonds has tended to
increase. Outstanding Corporate bond
holdings of CBE issued by regional states,
EEPCO and DBE increased to Birr 40.3
billion (or shared 45.2 percent) in 2010/11
from Birr 27.7 billion a year ago.
During the review year alone, corporate bond
issued by public institutions and regional
governments reached Birr 18.2
billion reflecting 67.2 percent growth
over last year.

National Bank of Ethiopia
2010/11annual report 63
Table 4.16 Disbursement, Redemption and Outstanding of Coupon and Corporate Bond Purchases by the Banking System at June 30, 2011 (In Millions of Birr)
Particulars
Annual Percentage
Change 2009/10 2010/11
A/B A. B 1. Corporate Bond Purchases by holders 10,860.0 18,157.0 67.2
EEPCO 5,000.0 13,000.0 160.0 Regional governments 3,560.0 3,007.0 -15.5 Development Bank of Ethiopia 2,300.0 2,150.0 -6.5 Private Sector
2. Redemption of Bonds by Clients 1,235.7 5,611.7 354.1 EEPCO 0.0 0.0 - Regional governments 1,116.4 1,167.1 4.5 Development Bank of Ethiopia 119.3 4,444.6 3,626.1 Private Sector
3. Outstanding Bonds by Clients 27,727.3 40,258.3 45.2 EEPCO 16,600.0 29,600.0 78.3 Regional governments 7,032.7 8,858.3 26.0 Development Bank of Ethiopia 4,094.6 1,800.0 -56.0 Private Sector
Source: Commercial Banks
4.5.4. Inter-bank Money Market
The interbank money market was not
active in Ethiopia due to the existence of
excess reserves in the banking system.
Accordingly, no inter-bank money
market transaction was conducted since
April 2008. Ever since the introduction of
the interbank money market in September
1998, merely twenty three transactions
worth Birr 259.2 million were conducted
with interest rates ranging between 7 to
11 percent per year. The maturity period
of these loans widely spanned from
overnight to 5 years.

National Bank of Ethiopia
2010/11annual report 64
Table 4. 17: Interbank Money Market Transactions up to June 20, 2011
Borrower Lender
Amount Borrowed (In
Thousand Birr) Interest Rate %
Date of Transaction
Maturity Period
Nib International Bank Awash International Bank 7,000.0 11 November, 2000 Overnight Wegagen Bank Commercial Bank of Ethiopia 10,000.0 8 January, 2001 5 years Nib International Bank ,, 10,000.0 8 March, 2001 3 months Wegagen Bank ,, 10,000.0 8 March, 2001 1 year Nib International Bank ,, 3,600.0 8 May, 2001 6 months Nib International Bank ,, 3,700.0 8 June, 2001 6 months Nib International Bank ,, 778.0 8 November, 2001 6 months Nib International Bank Bank of Abyssinia 28,999.8 7 December, 2002 3.5 months Nib International Bank Bank of Abyssinia 19,046.9 7 January, 2003 3.5 months Nib International Bank Bank of Abyssinia 20,310.0 7 February, 2003 3.5 months Nib International Bank Bank of Abyssinia 28,987.0 7 March, 2003 3.5 months Nib International Bank Commercial Bank of Ethiopia 25,000.0 7.5 July, 2003 5.2 months Nib International Bank Bank of Abyssinia 50.1 7.5 March, 2005 open Nib International Bank Bank of Abyssinia 50.5 7.5 March, 2003 open Wegagen Bank Awash International Bank 19,744.6 7.5 December, 2006 21/05/07 Wegagen Bank Awash International Bank 19,870.4 7.5 January, 2007 21/05/07 Wegagen Bank Awash International Bank 10,937.2 7.5 February, 2007 21/05/07 Awash International Bank Nib International Bank 30,000.0 7.5 February, 2007 18/08/07 Wegagen Bank Awash International Bank 10,931.4 7.5 March, 2007 21/05/07 Nib International Bank Awash International Bank 142.0 8.5 January, 2008 25/4/08 Nib International Bank Awash International Bank 7.0 8.5 February, 2008 25/04/08 Nib International Bank Awash International Bank 3.0 8.5 March, 2008 25/04/08 Nib International Bank Awash International Bank 17.0 8.5 April,2008 25/04/08 Total/Average - 259,174.8 7.87 - -
Source: NBE

National Bank of Ethiopia
2010/11annual report 65
V. DEVELOPMENTS IN EXTERNAL SECTOR
5.1 Overall Balance of Payments The overall balance of payments in
2010/11 recorded USD 1.37 billion in
surplus compared to USD 316.6 million
in the preceding year. This achievement
was the result of robust growth in net
service receipts, private transfers, long
term official loan disbursement and
estimated foreign direct investment
inflows.
The deficit in merchandise trade during
the review period narrowed by 12.1
percent owing to a strong rise in
merchandize export (37.1 percent) and a
slight contraction in total imports (0.2
percent). The current account also
registered USD 234.4 million in surplus
in contrast to the USD 1.2 billion deficit
mainly due to the increase in net service
receipts (50.4 percent) and private
transfers (16.7 percent). As a result,
current account (including official
transfer) to GDP ratio improved to 0.8
percent from -4 percent in 2009/10.
Table 5.1 Balance of Payments

National Bank of Ethiopia
2010/11annual report 66
(In Millions of USD)
Particulars
2008/09
2009/10
2010/11 Percentage
Change A B C C/B C/A
Trade Balance -6,279.2 -6,265.8 -5,506.2 -12.1 -12.3Exports 1,447.4 2,003.1 2,747.1 37.1 89.8Imports 7,726.6 8,268.9 8,253.3 -0.2 6.8
Net Services 384.7 457.5 688.1 50.4 78.9Travel 207.9 224.1 574.9 156.5 176.5Transportation 223.0 241.3 322.5 33.7 44.6Government (n.i.e.) 160.4 225.2 247.4 9.9 54.2Investment income -34.6 -55.2 -69.6 26.1 101.2
Interest -10.3 -28.3 -41.5 46.7 302.9 Cash (net) -8.5 -26.1 -40.9 56.7 381.2 Arrears 0.0 0.0 0.0 Relief 1.8 -2.2 -0.6 -72.6 -133.3 Dividend -24.3 -26.9 -28.1 4.5 15.6Other Services -172.1 -177.8 -387.1 117.7 124.9
Private Transfers 2,706.8 2,709.7 3,161.5 16.7 16.8Current Account Balance(excl. public transfers) -3,187.6 -3,099.5 -1,656.6
- 46.6 -48.0
Public Transfers 1,551.4 1,905.6 1,891 -0.8 21.9Current Account Balance(incl. public transfers) -1,636.2 -1,193.9 234.4
-119.6 -114.3
Non-monetary Capital 1,647.9 1,996.2 2,473.3 23.9 50.1 Long-term (net) 722.2 1,043.6 1,387.4 32.9 92.1
Disbursements 781.3 1,118.1 1,538.9 37.6 97.0 Repayments 59.2 74.5 151.5 103.4 155.9 Cash 42.3 64.7 143.7 122.1 239.7 Arrears 0.0 0.0 -
Relief 16.9 9.8 7.8 -20.2 -53.8 Direct Investment (net) 893.7 956.4 1,242.5 29.9 39.0 Short-term (net) 32.0 -3.8 -156.6 Net Errors & Omissions 501.8 -485.7 -1,340.4 Overall Balance 513.5 316.6 1,367.3 331.9 166.3 Financing -513.5 -316.6 -1,367.3 Reserves (-:increase) -494.8 -304.6 -1,358.9
NBE net foreign asset -558.7 57.8 -915.3 CBs net foreign asset 63.9 -362.4 -443.6
Debt Relief 18.7 -12.0 -8.4 Principal 16.9 9.8 7.8 Interest 1.8 2.2 0.6
Source: NBE Staff Compilation

National Bank of Ethiopia
2010/11annual report 67
Table 5.2: Components of External Trade as Percentage of GDP
Particulars 2008/09 2009/10 20010/11 Percentage
Change
A B C C/B C/A Exports 4.5 6.7 9.9 47.8 120.0 Imports 24.0 27.8 29.6 6.5 23.3 Trade Balance -19.5 -21.1 -19.9 -5.7 2.1 Net Services 1.2 1.5 2.5 66.7 108.3 Net Private Transfers 8.4 9.1 11.4 25.3 35.7 Current Account Deficit (Excluding Official Transfers) -9.9 -10.4 -6.0 -42.3 -39.4 Current Account Deficit (Including Official Transfers) -5.1 -4.0 0.8 -120.0 -115.7
Source: NBE Staff Compilation
0
1000
2000
3000
4000
5000
6000
7000
8000
9000
2000/012001/022002/032003/042004/052005/062006/072007/082008/092009/102010/11
in Mi
llion U
SD
Fig. V.1 Trends in Components of Current Account
Exports ImportsNet Services Private Transfers

National Bank of Ethiopia
2010/11annual report 68
5.2 Developments in Merchandise Trade Merchandise trade deficit in 2010/11
narrowed by 12.1 percent to USD 5.5
billion vis-a-vis the preceding fiscal year,
largely due to the significant growth in
total exports and a small reduction in total
imports. Hence, total export of goods to
GDP ratio improved to 10 percent from
6.7 percent in 2009/10.
Total merchandise export proceeds in
2010/11 amounted to USD 2.75 billion,
showing 37.1 percent growth over the
previous fiscal year largely owing to
higher earnings from export of coffee
(59.3 percent), gold (64.1 percent),
live animals (63 percent), leather & leather
products (84.1 percent), meat & meat
products (86.2 percent), chat (13.7
percent), pulses (6 percent) and flower (3
percent). This improvement in receipts
was driven by the rise in global
commodity prices and expansion in
volume of exports.
5.2.1 Exports
Earning from export of coffee rose sharply
by 59.3 percent in 2010/11 to USD 841.8
million on account of a 40 and 14 percent
growth in world coffee price and volume
of export, respectively. As a result, the
share of coffee in total exports of goods
increased to 30.6 percent from 26.4
percent in the previous year.

National Bank of Ethiopia
2010/11annual report 69
Table 5.3 Values of Major Export Items (In Millions of USD)
Export Commodities
2008/09 2009/10 2010/2011 Percentage Change Value Share
(%) Value Share (%) Value Share
(%) A B C C/B C/A
Coffee 375.9 26.0 528.3 26.4 841.8 30.6 59.3 124.0 Oilseeds 356.1 24.6 358.5 17.9 326.6 11.9 -8.9 -8.3 Leather & Leather products 75.3 5.2 56.4 2.8 103.8 3.8 84.1 37.9 Pulses 90.7 6.3 130.1 6.5 137.9 5.0 6.0 51.9 Meat & Meat Products 26.6 1.8 34.0 1.7 63.3 2.3 86.2 138.1 Fruits & Vegetables 12.1 0.8 31.47 1.6 31.50 1.1 0.1 159.6 Live Animals 52.7 3.6 90.7 4.5 147.9 5.4 63.0 180.7 Chat 138.7 9.6 209.5 10.5 238.3 8.7 13.7 71.8 Gold 97.8 6.8 281.4 14.0 461.7 16.8 64.1 371.9 Flower 130.7 9.0 170.2 8.5 175.3 6.4 3.0 34.1 Others 91.3 6.3 112.5 5.6 219.1 8.0 94.7 139.9 Total 1,447.9 100.0 2,003.1 100.0 2,747.1 100.0 37.1 89.7
Source: Ethiopian Revenue and Customs Authority
Similarly, gold export proceeds expanded
by 64.1 percent to USD 461.7 million,
supported by a 25.3 and 31 percent rise in
volume of export and world gold price,
respectively. Revenue from gold export
accounted for 16.8 percent of total export
revenue compared to 14 percent in the
preceding year.
The country earned USD 148 million
from export of live animals depicting a 63
percent an annual growth solely due to
the 66.1 percent increment in volume
despite a 2 percent fall in international
price. Revenue from live animals export
constituted 5.4 percent of the total
merchandise export.
Owing to a significant growth in volume
of exports and marginal increase in
international price, export revenue from
leather & leather products in 2010/11
depicted an 84.1 percent surge over the
previous year and stood at USD 103.8
million. Consequently, its share in the
total exports improved to 3.8 percent
from 2.8 percent a year ago.
Meanwhile, earnings from export of meat
& meat products rose by 86.2 percent to
USD 63.3 million as a result of 65.8
percent surge in volume of exports and
12.3 percent rise in international price.
Export of chat went up moderately by
13.7 percent to USD 238.3 million owing

National Bank of Ethiopia
2010/11annual report 70
to 13.5 percent growth in volume of
export. However, its share in the total
export of goods went down to 8.7 percent
relative to 10.5 percent last year.
Despite a slight drop in volume of
exports, pulses export proceeds increased
marginally by 6 percent and stood at USD
138 million wholly driven by moderate
improvement in international prices.
Revenue from export of pulses
constituted only 5 percent of the total
income from exports.
Earning from export of flower was USD
175.3 million, showing 3 percent increase
solely due to a 15.6 percent growth in
volume of exports despite 11 percent
decline in price. Of the total revenue
from exports, flower export accounted for
6.4 percent, down from 9 and 8.5 percent
in the past two years, respectively.
On the other hand, export of oilseeds
went down by 9 percent and fetched USD
326.6 million during the review period.
The poor performance was ascribed to the
decline in volume of exports (15 percent)
inspite of a 7.2 percent improvement in
world prices.
0100200300400500600700800900
In M
illio
n U
SD
Fig. V 2 Foreign Exchange Earning From Selected Export Items
Coffee Oilseeds Leather and Leather Products Pulses Chat Gold
Source: Ethiopian Revenue and Customs Authority

National Bank of Ethiopia
2010/11annual report 71
Coffee30.6%
Oilseeds11.9%
Leather and Leather Products
3.8%Pulses5%
Chat8.7%
Gold16.8%
Flower6.4%
Others16.8%
Fig V 3. Export Share of Selected Commodities in 2010/11
Source: NBE Staff Compilation
Table 5.4: Volume of Major Exports (In Millions of Kg)
Particulars
2008/09 2009/10 2010/11 Percentage Change
A B C C/B C/A Coffee 134.0 172.2 196.1 13.9 46.4
Oilseeds 287.0 299.0 254.2 -15.0 -11.4
Leather and Leather products 7.3 2.9 5.2 77.8 -29.1
Pulses 138.0 225.7 224.5 -0.5 62.7
Meat & Meat Products 7.5 10.2 16.9 65.8 125.7
Fruits & Vegetables 38.5 66.3 91.6 38.1 138.0
Live Animals 36.7 67.9 112.8 66.1 207.1
Chat 25.4 36.1 41.0 13.5 61.3
Gold 0.0049 0.0089 0.0112 25.3 129.2
Flower 29.2 36.0 41.6 15.6 42.5 Source: Ethiopian Revenue and Customs Authority
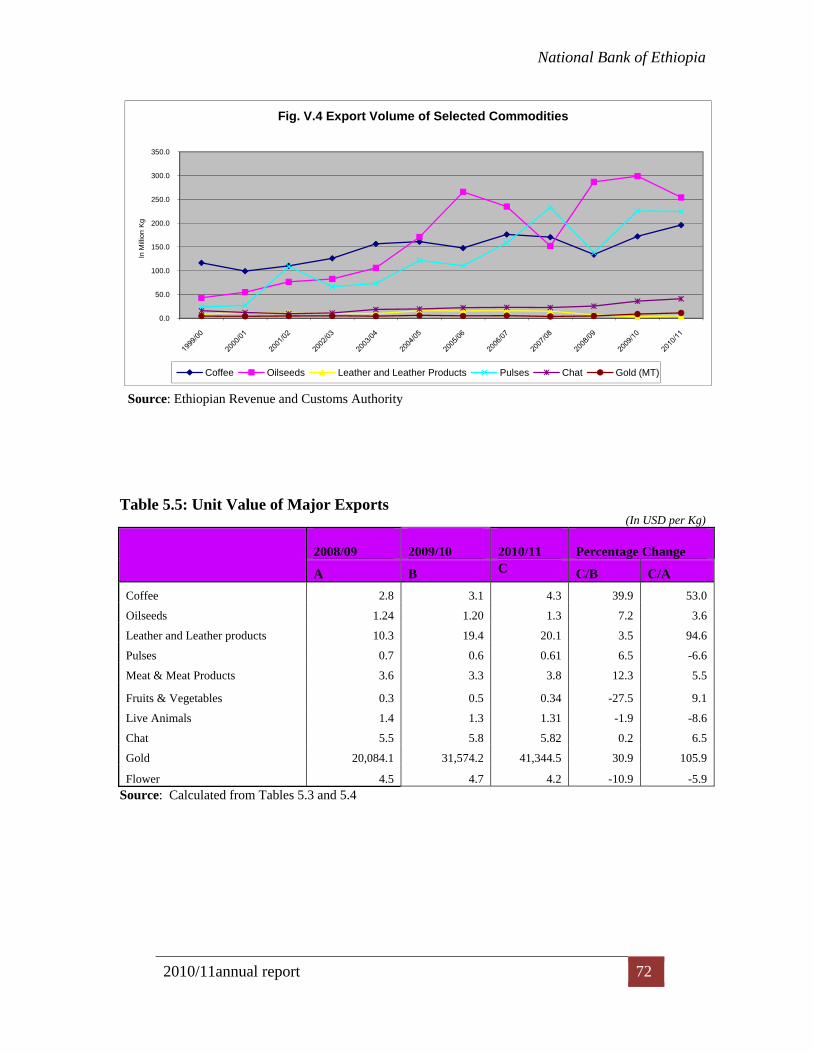
National Bank of Ethiopia
2010/11annual report 72
0.0
50.0
100.0
150.0
200.0
250.0
300.0
350.0In
Mill
ion
Kg
Fig. V.4 Export Volume of Selected Commodities
Coffee Oilseeds Leather and Leather Products Pulses Chat Gold (MT)
Source: Ethiopian Revenue and Customs Authority Table 5.5: Unit Value of Major Exports
(In USD per Kg)
2008/09
2009/10
2010/11
Percentage Change
A B C C/B C/A Coffee 2.8 3.1 4.3 39.9 53.0
Oilseeds 1.24 1.20 1.3 7.2 3.6
Leather and Leather products 10.3 19.4 20.1 3.5 94.6
Pulses 0.7 0.6 0.61 6.5 -6.6
Meat & Meat Products 3.6 3.3 3.8 12.3 5.5
Fruits & Vegetables 0.3 0.5 0.34 -27.5 9.1
Live Animals 1.4 1.3 1.31 -1.9 -8.6
Chat 5.5 5.8 5.82 0.2 6.5
Gold 20,084.1 31,574.2 41,344.5 30.9 105.9
Flower 4.5 4.7 4.2 -10.9 -5.9 Source: Calculated from Tables 5.3 and 5.4

National Bank of Ethiopia
2010/11annual report 73
0.0
5.0
10.0
15.0
20.0
25.0
USD
/Kg
Fig. V. 5 Unit Value of Exports of Selected Commodities
Coffee Oilseeds Leather and Leather Products Pulses Chat
Source: NBE Staff Compilation
4.2.2. Imports
Total merchandise imports in 2010/11
contracted slightly by 0.2 percent relative
to the preceding year and reached USD
8.25 billion owing to lower imports of
raw materials, capital goods particularly
industrial goods; and consumer goods.
Nevertheless, the ratio of imports to GDP
slightly rose to 29.6 percent from 27.8
percent in 2009/10.
Imports of capital goods fell by 4.5
percent compared to last year and
amounted to USD 2.8 billion, wholly on
account of a 13.4 percent reduction in
imports of industrial goods. Imports of
transport goods and agricultural goods,
however, depicted 35 and 6.4 percent
growth, respectively. As a result, the
share of capital goods in total imports
declined to 33.4 percent from 35 percent
last year.
Likewise, import of consumer goods
dropped by 8.8 percent owing to a 13.6
percent contraction in imports of non-
durable consumer goods. The curb in
import of cereals (61.8 percent) was the
sole contributing factor for lower imports
of non-durable goods. Consumer goods

National Bank of Ethiopia
2010/11annual report 74
accounted for 27.8 percent of the total
import bill.
Meanwhile, raw material imports went
down by 13.5 percent compared to the
preceding year and constituted 2.2
percent of the total imports.
On the other hand, import of fuel grew
strongly by 26.6 percent and reached
USD 1.7 billion largely owing to the
continued rise in international oil price
and increased volume. Consequently, the
share of fuel import in total imports of
goods rose to 20.1 percent from 16
percent in 2009/10.
Imports of semi-finished goods reached
USD 1.23 billion, close to the
performance in the preceding fiscal year.
However, import of fertilizer surged by
37.3 percent to USD 342.4 million,
largely driven by higher world prices.
Table 5. 6: Value of Imports by End Use
(In Millions of USD)
Categories
2008/09 2009/10 2010/11 Percentage
Change Value Share (%) Value Share (%) Value Share (%) A B C C/B C/A
Raw Materials 354.2 4.6 212.4 2.6 183.7 2.2 -13.5 -48.1 Semi-finished Goods 1,140.1 14.8 1,226.5 14.8 1,228.0 14.9 0.1 7.7 Fertilizers 270.7 3.5 249.4 3.0 342.4 4.1 37.3 26.5 Fuel 1,256.6 16.3 1,310.7 15.9 1,659.3 20.1 26.6 32.0 Petroleum Products 1,246.9 16.1 1,303.0 15.8 1,648.8 20.0 26.5 32.2 Others 9.7 0.1 7.7 0.1 10.5 0.1 36.9 8.7 Capital Goods 2,474.7 32.0 2,886.3 34.9 2,757.0 33.4 -4.5 11.4 Transport 384.2 5.0 509.8 6.2 688.1 8.3 35.0 79.1
Agricultural 31.3 0.4 59.8 0.7 63.6 0.8 6.4 103.
3 Industrial 2,059.2 26.7 2,316.7 28.0 2,005.4 24.3 -13.4 -2.6 Consumer Goods 2,383.5 30.8 2,515.7 30.4 2,294.8 27.8 -8.8 -3.7 Durables 674.8 8.7 865.0 10.5 868.5 10.5 0.4 28.7 Non-durables 1,708.7 22.1 1,650.7 20.0 1,426.3 17.3 -13.6 -16.5 Miscellaneous 117.4 1.5 117.3 1.4 130.5 1.6 11.3 10.9 Total Imports 7,726.6 100.0 8,268.9 100.0 8,253.3 100.0 -0.2 6.8
Source: Ethiopian Revenue and Customs Authority

National Bank of Ethiopia
2010/11annual report 75
5.2.3 Direction of Trade
In 2010/11, Europe emerged as the
largest market for Ethiopia’s exports. It
accounted for 50 percent of the total
merchandise exports of the nation. With
in European countries, Switzerland was
the vast market for about 34 percent of
the total exports particularly gold and
coffee, followed by Germany,
constituting 23.1 percent. Germany was
the second important market, mainly for
coffee, flower, leather & leather products
and textile exports. The Netherlands, with
a 12 percent share in Ethiopia’s export to
Europe, was major destination for flower,
vegetables, coffee and pulses exports.
Italy, a market for coffee, leather &
leather products, cereals and textile
exports, accounted for 7.7 percent of
Ethiopia’s export to Europe during the
review period.
Meanwhile, about 26.5 percent of the
total Ethiopia’s exports were shipped to
Asian countries of which China
constituted 34.2 percent, Saudi Arabia 19
percent, United Arab Emirates 10.3
percent, Israel 8.4 percent and Japan 5.4
percent.
The major export items to China include
oilseeds, mineral products and leather &
leather products. Coffee, meat & meat
products, spices and live animals were
exported to Saudi Arabia. Live animals,
meat & meat products, oilseeds, pulses
and vegetables were the major export
products to United Arab Emirates. Israel
bought mainly coffee and oilseeds while
Japan imported largely coffee.
African nations accounted for about 18
percent of Ethiopia’s total exports in the
same period. Somalia, Sudan, Djibouti,
and Egypt constituted 95 percent of the
total exports to the African continent.
Exports to Somalia included mainly chat,
live animals and vegetables. Coffee,
spices, pulses, live animals and cereals
were exported to Sudan. Djibouti mainly
imported live animals, chat and
vegetables while Egypt imported live
animals.
American markets accounted for 5.1
percent Ethiopia’s total exports during
2010/11. United States and Canada
alone constituted 93.4 percent of the
exports. The United States imported
mainly coffee and oilseeds while Canada
bought coffee.

National Bank of Ethiopia
2010/11annual report 76
Africa18%
Europe49.9%
America5.1%
Asia26.5%
Oceania0.5%
Fig V.6 Export by Destinations
Source: NBE staff compilation

National Bank of Ethiopia
2010/11annual report 77
Regarding Ethiopia’s imports by
countries of origin, about 67 percent of
its imports in 2010/11 were originated
from Asia, 21.3 percent from Europe,
5.5 percent from America and 6 percent
from Africa. Among Asian countries, China
accounted for 23.3 percent, Saudi Arabia
13.4 percent, India 10.8 percent, United
Arab Emirates 10.3 percent, Japan 8.1
percent, Malaysia 3.8 percent and
Thailand 2 percent. The main items
imported from China included
chemicals, clothing, glass & glass wares,
machinery, medical & pharmaceutical
products, road & motor vehicles, metals,
electric materials and rubber products.
Petroleum products were the major
imports from Saudi Arabia which
accounted for 64.1 percent of the total
petroleum imports of Ethiopia in
2010/11. Imports from India were mainly
electrical materials, machinery, metals,
medical & pharmaceutical products and
rubber products. Road & motor
vehicles, machinery and rubber products
were imported from Japan. United Arab
Emirates supplied petroleum products
and metals to Ethiopia.
Of the Ethiopian imports from Europe,
Italy accounted for 21 percent, Turkey
16.6 percent, Germany 10.8 percent,
France 7.7 percent, Ukraine 7 percent,
Spain 6.2 percent, United Kingdom 5.4
percent and the Netherlands 5.3 percent.
Machinery, electrical materials, vehicles
and medical & pharmaceutical products
were the major import from Italy.
Metal, machinery and electrical
materials came from Turkey. Part of
imported machinery, road & motor
vehicles and electrical materials were
imported from Germany and France. About 91.2 percent of Ethiopia’s import
from America originated from USA,
Brazil and Canada. The main imports
were glass & glass wares, machinery,
road & motor vehicles, electrical
materials and grain. Likewise, 77.2 percent of Ethiopia’s
imports from African nations originated
from Egypt (27 percent), Sudan (26.8
percent), South Africa (14.5 percent) and
Kenya (9 percent). Import items
included petroleum products, electrical
materials, vehicles, metals and soap &
polish.

National Bank of Ethiopia
2010/11annual report 78
Africa5.9% Europe
21.3%
America5.5%Asia
67%
Oceania0.3%
Fig. V. 7 Imports by Origin

National Bank of Ethiopia
2010/11annual report 79
5.3 Services and Transfers 5.3.1 Services
The services account in 2010/11 recorded
USD 688.1 million in net inflows,
depicting 50.4 percent growth over the
preceding year. This was attributed to
higher net receipts from travel, transport
and government services.
Net receipts from travel rose sharply by
156.5 percent due to the increase in
tourism. Net incomes from transport
service went up by 33.7 percent largely
driven by the expansion of air transport
services. Net government service
receipts also showed a moderate growth
of 10 percent during the review period.
5.3.2 Unrequited Transfers
Net receipts from private transfers in
2010/11 improved by 16.7 percent to
USD 3.2 billion largely because of the
87.4 percent growth in cash receipts of
individual remittances and 3.8 percent
rise in cash transfers to non-governmental
organizations Underground transfers and
transfer in kind, however, declined by
21.3 and 34 percent, respectively.

National Bank of Ethiopia
2010/11annual report 80
Table 5. 7: Unrequited Transfers (In Millions of USD)
No. Particulars
2008/09 2009/10 2010/11 Percentage Change
A % Share B % Share C % Share C/B C/A
1 Private Transfers 2,706.8 63.6 2,709.7 58.7 3,161.5 62.6 16.7 16.8
1.1 Receipts 2,733.3 63.6 2,736.2 58.8 3,202.9 62.5 17.1 17.2
NGOs 921.0 21.4 888.9 19.1 901.8 17.6 1.5 -2.1
Cash 916.9 21.3 860.5 18.5 893.5 17.4 3.8 -2.5
Other 0.0 0.0 28.4 0.6 0.0 0.0 - -
Food 4.1 0.1 0.0 0.0 8.3 0.2
Private individuals 1,812.3 42.1 1,847.3 39.7 2,301.1 44.9 24.6 27.0
Cash 723.2 16.8 790.3 17.0 1,481.2 28.9 87.4 104.8
In kind 195.5 4.5 96.7 2.1 63.9 1.2 -33.9 -67.3
Underground Private Transfers 893.6 20.8 960.3 20.6 756.0 14.7 -21.3 -15.4
1.2 Payments -26.5 63.4 -26.6 74.5 -41.4 55.7 55.9 56.3
2. Official Transfers 1,551.4 36.4 1,905.6 41.3 1,891.0 37.4 -0.8 21.9
2.1 Receipts 1,566.7 36.4 1,914.7 41.2 1,923.8 37.5 0.5 22.8
Cash 1,444.8 33.6 1,741.5 37.4 1,893.7 36.9 8.7 31.1
Other 0.2 0.0 0.0 0.0 0.0 0.0
Food 121.7 2.8 173.2 3.7 30.1 0.6 -82.6 -75.2
2.2 Payments -15.3 36.6 -9.1 25.5 -32.9 44.3 261.6 115.4
Total Receipts 4,300.0 101 4,650.9 101 5,126.7 101 10.2 19.2
Total Payments -41.8 -1.0 -35.7 -0.8 -74.3 -1.5 108.3 78.0
Total Net Transfers 4,258.2 100 4,615.2 100 5,052.4 100 9.5 18.7 Source: NBE, MoFED and Disaster Prevention & Preparedness Agency
In contrast, net official transfers during
2010/11 dropped by 0.8 percent to USD 1.9
billion relative to the preceding year as a
result of a sharp decline in food aid.
5.4. Current Account The current account balance (including
public transfers) registered USD 234.4
million in surplus against USD 1.2 billion
deficit in the preceding fiscal year due to
higher income from net services and private
transfers.
5.5 Capital Account In 2010/11, the surplus in capital account
reached USD 2.5 billion compared to USD
2 billion surpluses in the preceding fiscal
year. This was ascribed to strong growth in
official long term loan disbursements (33
percent) and estimated foreign direct
investment inflows (30 percent).

National Bank of Ethiopia
2010/11annual report 81
5.6 Changes in Reserve Position Reflecting the surpluses in current and
capital accounts, the banking system
recorded USD 1.37 billion reserve build up
by end 2010/11. Consequently, the gross
foreign reserve position of the NBE was
adequate to cover 3.1 months of imports of
goods and non-factor services.
5.7 External Debt As at end 2010/11, Ethiopia’s total external
debt stock reached USD 7.3 billion,
depicting a 31.4 percent growth over last
year. Of the total debt stock by creditors,
debt owed to international financial
institutions rose by 27.5 percent to USD 3.5
billion and accounted for 47.6 percent.
Debt owed to bilateral and commercial
creditors also increased by 24.1 and 45.7
percent to reach USD 1.7 billion and USD
2.1 billion, and constituted 23.6 and 28.8
percent of the total debt stock, respectively.
Accordingly, the total debt stock to GDP
ratio, increased to 26.3 percent from 17.8
percent a year earlier. However, the ratio
of total debt stock to total receipts from
export of goods and non-factor services
remained unchanged at 1.4 percent due to
proportional growths in total debt stock
(31.4 percent) and total receipts from
export of goods and non-factor services
(31.8).
Debt service (including both principal and
interest) to total export receipts of goods
and services ratio, rose to 3.7 percent from
2.3 percent in the preceding fiscal year as
the debt service grew significantly faster
than total receipts from export of goods and
services.

National Bank of Ethiopia
2010/11annual report 82
Table 5. 8 External Public Debts (In Millions of USD)
Particulars
2008/09 2009/10 2010/11 Percentage change
A B C C/B C/A
Debt Outstanding
Lender Total 3,304.5 5,569.8 7,318.8 31.4 121.5
Multilateral 2,029.1 2,729.1 3,480.9 27.5 71.5
Bilateral 1,020.5 1,389.7 1,724.5 24.1 69.0
Commercial 254.9 1,451.0 2,113.4 45.7 729.1
Drawing by Lender 650.4 842.4 1,038.2 23.2 59.6
Lender Total 650.4 842.4 1,038.2 23.2 59.6
Drawing by Sector 650.4 842.4 1,038.2 23.2 59.6
Sector Total 650.4 842.4 1,038.2 23.2 59.6
Debt Service 67.6 94.8 196.0 106.8 190.1
Principal repayments 42.1 64.7 143.7 122.0 241.5
Interest payments 25.5 30.0 52.3 74.1 105.1
Debt stock to GDP ratio (in percent ) 10.2 18.7 26.3 40.3 156.6 Debt stock to export of goods and non-factor services 1.0 1.4 1.4 -0.5 40.1 Receipts from goods and non-factor services 3,381.4 4,047.0 5,332.6 31.8 57.7
Debt service ratio ( percent )1/ 2.0 2.3 3.7 57.0 83.9
Arrears 0.0 0.0 0.0 - -
Principal 0.0 0.0 0.0 - -
Interest 0.0 0.0 0.0 - -
Relief 18.7 12.0 8.4 -29.8 -55.0
Principal 16.9 9.8 7.8 -20.2 -53.8
Interest 1.8 2.2 0.6 -72.6 -66.3 Source: Ministry of Finance and Economic Development 1. A ratio of debt service to total receipts from export of goods and non-factor services Note: Outstanding as at end period

National Bank of Ethiopia
2010/11annual report 83
5.8. Developments in Foreign Exchange Markets
5.8.1 Developments in Nominal Exchange Rate
During 2010/11, the weighted average
exchange rate of the Birr in the inter-bank
market depreciated by 25 percent to Birr
16.1178/USD with respect to Birr
12.8909/USD recorded in the previous
year (Table 5.9).
The Birr also weakened in the parallel
market where it depreciated by 20.8
percent during the same period to reach
Birr 16.5292/USD. As a result, the average
premium between the official and parallel
average market rates narrowed to 2.6
percent from 6.1 percent last year mainly
due to faster depreciation of the Birr in the
official foreign Exchange market.
Table 5.9 Inter-Bank and Parallel Forex Market Exchange Rates
Period
Average Weighted
Rate
Amount Traded in millions of USD Number of Trades Average Rates
in Parallel Market Total
o/w Among CBs Total o/w Among CBs
2008/09 10.4205 18.4 0.0 1818.0 0.0 11.8102
Qtr. I 9.6602 6.3 0.0 483.0 0.0 10.2623
Qtr. II 9.8670 6.0 0.0 531.0 0.0 10.7540
Qtr. III 10.9521 3.0 0.0 387.0 0.0 12.8163
Qtr. IV 11.2028 3.1 0.0 417.0 0.0 13.4083
2009/10 12.8909 12.6 0.0 252.0 0.0 13.6806
Qtr. I 12.3746 3.3 0.0 65.0 0.0 13.2933
Qtr. II 12.5851 3.3 0.0 66.0 0.0 13.3933
Qtr. III 13.1342 3.0 0.0 60.0 0.0 13.8495
Qtr. IV 13.4697 3.1 0.0 61.0 0.0 14.1863
2010/11 16.1178 90.2 25.1 284.0 11.0 16.5292
Qtr. I 14.5535 3.2 0.0 64.0 0.0 14.9833
Qtr. II 16.4667 3.3 0.0 65.0 0.0 16.9567
Qtr.III 16.6342 3.0 0.0 60.0 0.0 17.1067
Qtr. IV 16.8169 80.8 25.1 95.0 11.0 17.0700 Source: NBE

National Bank of Ethiopia
2010/11annual report 84
Likewise, the average retail buying and
selling rates of forex bureaux of
commercial banks depicted a 25.7 and 25
percent depreciation during 2010/11 and
stood at Birr 16.1914/USD and Birr
16.4333/USD, respectively.
Consequently, the average premium
between the buying and selling rates of
forex bureaux narrowed to 1.5 percent
from 2.1 percent in the preceding year
(Table 5.13).
Table 5.10: End Period Mid Market Rates (USD per Unit of Foreign Currency)
Currency
2008/9 2009/10 2010/11 Percentage change
A B C C/B C/A
Pound Sterling 1.6824 1.5052 1.6036 6.5 -4.7
Swedish Kroner 0.1324 0.1279 0.1566 22.4 18.3
Djibouti Frank 0.0639 0.0057 0.0056 -2.2 -91.2
Swiss Frank 0.9356 0.9190 1.1989 30.5 28.1
Saudi Riyal 0.2698 0.2666 0.2666 0.0 -1.2
UAE Dirhams 0.2755 0.2723 0.2723 0.0 -1.2
Canadian Dollar 0.8753 0.9523 1.0274 7.9 17.4
Japanese Yen 0.0106 0.0113 0.0123 9.5 16.7
Euro 1.4274 1.2187 1.4434 18.4 1.1
SDR 1.5690 1.4796 1.5903 7.5 1.4 Source: NBE

National Bank of Ethiopia
2010/11annual report 85
Table 5.11: End Period Mid Market Rates (Birr per Unit of Foreign Currency)
Currency
2008/9 2009/10 2010/11 Percentage change
A B C C/B C/A
USD 11.2190 13.5998 16.9927 24.9 51.5
Pound Sterling 18.8749 20.4704 27.2494 33.1 44.4
Swedish Kroner 1.4855 1.7395 2.6612 53.0 79.1
Djibouti Frank 0.0639 0.0781 0.0954 22.2 49.2
Swiss Frank 10.4965 12.4986 20.3725 63.0 94.1
Saudi Riyal 3.0274 3.6261 4.5308 25.0 49.7
UAE Dirham 3.0911 3.7027 4.6264 24.9 49.7
Canadian Dollar 9.8201 12.9510 17.4588 34.8 77.8
Japanese Yen 0.1186 0.1533 0.2096 36.8 76.7
Euro 16.0137 16.5741 24.5272 48.0 53.2
SDR 17.6022 20.1222 27.0234 34.3 53.5 Source: NBE
The mid exchange rate of the US dollar
relative to major international currencies
at end 2010/11 showed a noticeable
depreciation, though at different rates.
The US dollar depreciated with respect to
Swiss Frank (30.5 percent), Euro (18.4
percent), Japanese Yen (9.5 percent) and
Pound Sterling (6.5 percent) (Table 5.10).
Likewise, the end period exchange rate
depreciation of the Birr in relation to the
international currencies varied. For
instance, the Birr weakened strongly
relative to Swiss Frank (63 percent) Euro
(48 percent), Japanese Yen (36.8 percent)
and Pound Sterling (33.1 percent) (Table
5. 11).
5.8.2. Movements in Real Effective
Exchange Rate The pace of depreciation in the real
effective exchange rate (REER) in
2010/11 slowed down to 14.8 percent
from 23.1 percent in the preceding fiscal

National Bank of Ethiopia
2010/11annual report 86
year, largely as a result of the rise in
domestic prices (Table 5.12).
Nominal effective exchange rate (NEER)
also depreciated by 23.8 percent, slightly
slower than the rate of depreciation
recorded in 2009/10.
Table 5. 12: Trends in Real and Nominal Effective Exchange Rates
Years REERI NEERI
Percentage Change
REERI NEERI
2004/05 94.0 83.1 _ _
2005/06 102.9 80.9 9.4 -2.7
2006/07 121.3 77.6 17.9 -4.1
2007/08 136.3 72.4 12.4 -6.7
2008/09 184.7 76.1 35.5 5.1
2009/10 142.1 57.4 -23.1 -24.6
2010/11 121.1 43.7 -14.8 -23.8 Source: NBE Staff Compilation
1. Regarding the methodology for constructing the effective exchange rate indices, see annual report of NBE, 2004-2005, P. 66 2. An increase in REERI and NEERI indicates appreciation and vice versa. Where: REERI = Real Effective Exchange Rate Index NEERI = Nominal Effective Exchange Rate Index

National Bank of Ethiopia
2010/11annual report 87
5.8.3 Foreign Exchange Transactions The amount of foreign exchange transaction
in the inter-bank foreign exchange market
during 2010/11 increased significantly to
USD 90.2 million from USD 12.6 million in
2009/10. Of the total transaction, USD 65.1
million was traded between NBE and
commercial banks, and the remaining USD
25.1 million among commercial banks
themselves (Table 5.13).
The volume of foreign exchange purchased
by forex bureaux of commercial banks during
2010/11 declined by 8.3 percent to USD
199.4 million while their sales went up by
14.6 percent to USD 57 million in the same
period (Table 5.13).
Table 5.13: Foreign Exchange Transactions by Forex Bureaux of Commercial Banks (In Millions of USD)
Name of Forex Bureau
2008/09 2009/10 2010/11 Percentage Change A B C D E F E/C F/D
Purchases Sales Purchases Sales Purchases Sales Purchases Sales Commercial Bank of Ethiopia 44.80 11.68 40.64 0.20 55.56 1.21 36.7 515.1 Bank of Abyssinia 3.48 4.18 2.96 4.23 5.67 4.75 91.6 12.3 Dashen Bank 16.86 17.60 13.64 20.57 15.48 19.89 13.5 -3.3 Awash International Bank 1.94 6.70 8.96 5.96 25.94 8.19 189.4 37.5 Construction & Business Bank 1.43 0.53 0.97 0.16 2.27 0.22 134.6 34.9 Wegagen Bank 7.73 6.38 11.78 3.38 16.08 4.11 36.5 21.7 United Bank 13.09 5.48 30.44 7.90 20.96 8.68 -31.2 9.8 Development Bank 0.00 0.00 0.00 0.00 0.00 0.00 Nib International Bank 53.56 6.91 97.41 5.11 52.46 6.94 -46.1 35.9 Lion International Bank 1.43 0.13 7.89 0.97 1.38 0.42 -82.6 -56.3 Oromia International Bank 0.03 0.00 2.10 0.25 1.59 0.60 -24.3 140.3 Zemen Bank 0.10 0.04 0.54 0.74 0.99 1.50 83.1 101.8 Cooperative Bank of Oromia 0.00 0.05 0.03 0.10 0.03 0.04 -6.7 -56.7 Buna International Bank 0.00 0.00 0.19 0.05 0.92 0.26 389.1 381.1 Birhan International Bank 0.00 0.00 0.00 0.00 0.07 0.05 Total 144.5 59.7 217.5 49.6 199.4 56.9 -8.3 14.6 Average Exchange Rate 11.1113 11.3107 12.8763 13.1481 16.1914 16.4333 25.7 25.0
Source: NBE

National Bank of Ethiopia
2010/11annual report 88
VI. GENERAL GOVERNMENT FINANCE
6.1. Government Finance Overall fiscal performance of the general
government during the review period
indicated an expansion of the overall
fiscal deficit (excluding grants) from
Birr 17.5 billion in 2009/10 to Birr 24.7
billion in 2010/11. Its ratio to GDP also
tended to rise marginally from 4.6
percent to 4.8 percent a year earlier.
General government revenue (including
grants) improved by 29.2 percent in
2010/11 compared to last year. The ratio
of revenue to GDP was 13.5 percent,
almost the same as last fiscal year.
General government expenditure also
went up by 31.5 percent while its ratio to
GDP fell to 18.4 percent from 18.6
percent a year ago (Table 6.1).
Table 6.1: Measuring Fiscal Sustainability (In %)
Fiscal Year PD/GDP IP/RR Debt/GDP R (Debt) R (GDP) Exp/GDP Rev/GDP R (OR)
1996/97 4.1 11.7 29.8 3.4 24.2 19 8.1 1997/98 -1.5 9.9 24.7 7.9 -3.9 20.7 15.4 2.8 1998/99 -4.0 10.1 15.4 11.9 5.9 24.7 16.0 8.3 1999/00 -6.4 11.8 25.4 61.1 13.4 26.1 14.4 8.3 2000/01 -2.2 10.6 21.4 -7.1 2.1 23.4 15.1 7.1 2001/02 -10.7 9.7 23.2 8.2 -2.2 32.6 16.5 2.3 2002/03 -5.2 10.9 25.6 10.7 10.3 27.9 15.2 7.1 2003/04 -1.8 7.8 26.6 22.6 18.0 23.7 16.1 24.8 2004/05 -3.9 6.5 22.2 2.3 22.9 19.3 14.6 12 2005/06 -5.5 5.4 20.1 12.2 23.7 22.3 14.8 25.1 2006/07 -3.0 5.5 17.6 13.5 29.8 20.8 12.7 11.6 2007/08 -2.1 3.8 15.6 27.1 42.9 19.1 12.1 36.7 2008/09 -0.9 3.2 14.8 28.7 35.1 17.2 12.2 34.8 2009/10 -1.3 2.9 11.9 2.3 14.3 18.6 14.1 34.1 2010/11 -1.6 2.2 26.5 29.8 33.5 18.4 13.5 28.3
Source: Staff computation Definitions: PD = Primary Deficit IP/RR= Share of Interest Payments in Recurrent Revenue DDebt/GDP=Ratio of Domestic Debt to GDP R (Debt) = Growth Rate of Domestic Debt R (GDP) = Growth Rate of GDP at Current Market Price Exp/GDP=Ratio of General Government Expenditure to GDP Rev/GDP= Ratio of General Government Revenue to GDP R (OR) = Growth Rate of Ordinary Revenue Note: Starting from 1997/98; the figure was based on revised GDP data

National Bank of Ethiopia
2010/11annual report 89
6.2 Revenue and Grants
Under the review period, Birr 85.6
billion (including grants) was collected
which was close to the planned target. It
increased by 29.2 percent as a result of
improved tax administration and
economic growth. Its share in GDP was
16.7 percent. Of the total domestic
revenue, about 85.3 percent was
generated from taxes, and 14.7 percent
was from non-taxes.
Tax revenue rose 36.2 percent in the
fiscal year owing to a 31.2 percent
growth in direct taxes, which largely
constitute personal income and business
taxes. These taxes alone accounted for
96.2 percent of the direct taxes. The
share of rural and urban land use fee,
however, was only 3.8 percent. Revenue
from indirect taxes was Birr 39.4 billion
and its share in total tax revenue reached
66.9 percent.
About 60.2 percent of the indirect tax
revenue was generated through import
duties whose share grew by about 34.2
percentage points over last year.
Non-tax revenue reached Birr 10.1
billion showing a 3.9 percent decline
largely due to lower income from
government investment income.
External grants showed a 33.3 percent
increase compared to last year.

National Bank of Ethiopia
2010/11annual report 90
0
10000
20000
30000
40000
50000
60000
70000
80000
90000
In million Birr
Fiscal Year
Fig. VI.1 Trend of General Government Revenue by Component
Total Revenue and Grants Tax Revenue Direct tax revenue
Indirect tax revenue Non-tax revenue Grants

National Bank of Ethiopia
2010/11annual report 91
Table 5.2: Summary of General Government Revenue by Component
(In Million of Birr)
Particulars
2009/10 2010/11 Percentage
Change Perform-ance Rate
[A] [B] [C]
[C/A]
Pre. Act Revised Budget Pre. Act [C/B]
Total Revenue and Grants 66,237 86164.2 85,611 29.2 99.4 Total Revenue 1/ 53,861 66172.5 69,120 28.3 104.5
Tax Revenue 43,315 56,173 58,981 36.2 105.0 1. Direct Tax Revenue 14,903 19,517 19,550 31.2 100.2
1.1 Income and Profit Taxes 14,027 17,403 18,809 34.1 108.1 Personal 4,391 5,321 5,733 30.6 107.8 Business 7,391 9,619 10,055 36.0 104.5
Others 2/ 2,245 2,464 3,021 34.5 122.6 1.2 Rural Land Use Fee 270 315 317 17.3 100.4 1.3 Urban Land Use Fee 606 1,798 424 -30.1 23.6
2. Indirect Taxes 28,412 36,656 39,431 38.8 107.6 2.1 Domestic Taxes 10,727 13,225 15,705 46.4 118.8 2.2 Foreign Trade Taxes 17,685 23,431 23,726 34.2 101.3
Import 17,685 23,431 23,726 34.2 101.3 Export - - - - -
3. Non-Tax Revenue 10,546 9,999 10,139 -3.9 101.4 3.1 Charges and Fees 489 737 970 98.4 131.7
3.2 Govt. Invt. Income 3/ 6,979 5,602 4,476 -35.9 79.9 3.3 Reimb. And Property
Sales 108 113 194 80.2 172.3 3.4 Sales of Goods & Services 1,032 1,603 1,775 71.9 110.7
3.5 Others 4/ 1,939 1,945 2,725 40.6 140.1 4. Grants 12,376 19992 16,491 33.3 82.5
Source: Ministry of Finance and Economic Development 1/ It does not include privatization proceeds
2/ Others include rental income tax, with holding income tax on imports, interest income tax, capital gains tax, agricultural income and other incomes
3/Gov. Investment income includes : Residual surplus, capital charge, interest payments and state
dividend 4/ Other extra ordinary, miscellaneous, pension contribution and other
revenue

National Bank of Ethiopia
2010/11annual report 92
6.3 Expenditure
General government expenditure
amounted to Birr 93.8 billion exhibiting
31.5 percent growth over last year. Its
share in GDP declined marginally to
18.4 percent from 18.6 percent last fiscal
year.
Recurrent expenditure at Birr 40.5
billion went up by 26.6 percent over last
fiscal year and accounted for 43.2
percent of total expenditure and 7.9
percent of GDP. The largest share of the
current expenditure went to finance
social and general services.
Capital expenditure reached Birr 53.3
Billion from Birr 39.3 Billion of a year
earlier on account of higher spending on
all its components.
About 81.4 percent of the capital
spending was for poverty related
programs (like education, health and
food security etc.). Its share in GDP
stood at about 10.4 percent.
In summary, expenditure performance
rate was 95.4 percent of the annual
budget.

National Bank of Ethiopia
2010/11annual report 93
Table 6.3: Summary of General Government Expenditure (In Million Birr)
Particulars
2009/10 2010/11 Percentage
Change Performance Rate [A] [B] [C]
[C/A] Pre actual Revised Budget Pre actual [C/B]
Total Expenditure 71,335 98,406 93,831 31.5 95.4 1. Current Expenditure 32,012 43,246 40,535 26.6 93.7
General Services 12,864 12,666 15,655 21.7 123.6 Economic Services 4,064 4,840 5,325 31.0 110.0 Social Services 12,349 15,397 16,057 30.0 104.3 Interest and Charges 1,587 2,326 1,913 20.5 82.2 External Assistance* 631 750 338 -46.5 45.0 Others (miscellaneous) 517 7,268 1,248 141.4 17.2
2. Capital Expenditure 39,322 55,159 53,297 35.5 96.6 Economic Development 27,240 33,949 35,310 29.6 104.0 Social Development 9,793 17,364 14,707 50.2 84.7 General Development 2,289 3,846 3,280 43.3 85.3
3,Special programs - - - - -Source: Ministry of Finance and Economic Development
Note: * value estimated
National Bank of Ethiopia
2010/11annual report 94
0.0
5.0
10.0
15.0
20.0
25.0
30.0
35.0
1996/97
1997/98
1998/99
1999/00
2000/01
2001/02
2002/03
2003/04
2004/05
2005/06
2006/07
2007/08
2008/09
2009/10
2010/11
In Percent of GDP
Fiscal Year
Fig. VI.3 Trends in General Government Expenditure and Revenue (% of GDP)
Expenditure/GDP Revenue/GDP
Source MoFED

National Bank of Ethiopia
2010/11annual report 95
6.4. Deficit Financing
General government budgetary
operations resulted in a deficit of Birr
8.2 billion during the review year, about
61.3 percent higher than a year earlier.
Fiscal deficit as percentage GDP was 1.6
percent. More than 94 percent of the
deficit was financed by net external
borrowing. While the remaining balance
was covered by net domestic borrowing
and privatization receipts.
Table 6.4 Summary of General Government Finance (In Million Birr)
Particulars
2009/10 2010/11 Percentage
Change performance
rate
[A] [B] [C]
[C/A] [C/B] Pre. Act Revised Budget Pre. Act
Revenue and Grants 66,237 86,164 85611.2 29.2 99.36 Revenue 53,861 66,172 69119.9 28.3 104.45
Grants 12,376 19,992 16491.4 33.3 82.49 Total Expenditure 71,335 98,406 93831.4 31.5 95.35
Current Expenditure 32,012 43,246 40534.7 26.6 93.73 Capital Expenditure 39,322 55,159 53296.7 35.5 96.62
Overall Surplus/ Deficit (Including Grants) (5,097) (12,242) (8220.2) 61.3 67.15 (Excluding Grants) (17,473) (32,234) (24711.5) 41.4 76.66
Total Financing 5,097 12,242 8220.2 61.3 67.15
Net External Borrowings 4,131 4,520 7797.6 88.7 172.51
Gross Borrowing 4,446 5,126 8435.5 89.7 164.56
Amortization Paid 459 748 770.3 68.0 102.98
HIPC relief & MDRI 144 142 132.4 -7.8 93.35
Net Domestic Borrowings 1,758 7,356 111.2 -93.7 1.51
Banking System 1,382 7,356 (3039.5) -319.9 (41.32)
Non-Banking Systems 375 - 3150.7 739.5
Privatization Receipts 697 366 1457.6 109.0 398.25
Others and Residuals (1,489) (0) -1146.3 -23.0
Source: Ministry of Finance and Economic Development
National Bank of Ethiopia
2010/11annual report 96
VII. INVESTMENT
The Ethiopian Investment Agency and
regional Investment Offices licensed some
56,421 investment projects with an
aggregate capital of Birr 1.1 trillion during
1992/93 – 2010/11. Of these projects,
47,420 (or 84.1 percent) were domestic,
8,896 (or 15.7 percent) foreign and 105 (or
0.2 percent) public. In terms of capital, Birr
424.1 billion (or 39.4 percent) was attributed
to domestic investors, Birr 382.2 billion (or
35.4 percent) to foreign investors and Birr
272.4 billion (or 25.2 percent) to the public
sector (Table 7.1).
In 2010/11, a total of 6,322 investment
projects with a combined capital of Birr
249.5 billion were approved, a record high
in a single year since 1992/93.
Domestic investment accounted for more
than 84 percent of the total projects
approved during the review period. The
number of foreign projects reached 952
which were 33 percent lower than the same
period last year.
With regard to investment capital, domestic
private projects which make up Birr 42.1
billion or 17 percent while foreign
investment projects accounted for Birr 53.4
billion (or 21 percent) of the total approved
investment capital the rest 62 percent
investment was carried out by the
government.
Upon commencement of operation, the
approved investment projects are expected
to create job opportunities for 227,715
permanent and 586,380 casual workers
(Table 7.2).

National Bank of Ethiopia
2010/11annual report 97
Table 7.1: Number and Investment Capital of Approved Projects by Ownership since 1992/93
(Investment capital in millions of Birr)
Fiscal Year
Domestic projects
Foreign Projects
Public Projects
Total Projects
No. of Projects
Investment Capital
No. of Projects
Investment Capital
No. of Projects
Investment Capital
No. of Projects
Investment Capital
1992/93 542 3,750 3 233 0 0.00 545 3,983.0 1993/94 521 2,926 4 438 1 57.00 526 3,421.0 1994/95 684 4,794 7 505 2 39.00 693 5,338.0 1995/96 897 6,050 10 434 1 6.00 908 6,490.0 1996/97 752 4,447 42 2,268 1 7.00 795 6,722.0 1997/98 816 5,819 81 4,106 1 14.00 898 9,939.0 1998/99 674 3,765 30 1,380 9 4,915.00 713 10,060.0 1999/00 561 6,740 54 1,627 9 5,760.00 624 14,127.0 2000/01 635 5,675.7 45 2,923 7 257.00 687 8,856.0 2001/02 756 6,117.3 35 1,474 10 1,598.80 801 9,190.2 2002/03 1,127 9,362.9 84 3,369 6 706.11 1,217 13,437.9 2003/04 1,862 12,177.7 347 7,205 16 1,837.04 2,225 21,220.0 2004/05 2,240 19,571.7 622 15,405 10 1,486.48 2,872 36,463.3 2005/06 5,100 41,841.1 753 19,980 6 18,215.08 5,859 80,036.3 2006/07 5,322 46,630.1 1,150 46,949 0 0.00 6,472 93,579.0 2007/08 7,307 77,868.2 1,651 92,249 3 261.56 8,961 170,378.5 2008/09 7,184 83,630.2 1,613 73,111 10 82,783.52 8,807 239,524.8 2009/10 5,080 40,852.2 1,413 55,169 3 393.89 6,496 96,415.4 2010/11 5,360 42,093 952 53,357 10 154,019 6,322 249,469 Average Annual 2,496 223,22 468 20,115 6 14,335 2,969 56,771
Cumulative 47,420 424,111 8,896 382,182 105 272,356 56,421 1,078,650 Source: Ethiopian Investment Agency

National Bank of Ethiopia
2010/11annual report 98
Source: Ethiopian Investment Agency

National Bank of Ethiopia
2010/11annual report 99
Source: Ethiopian Investment Agency

National Bank of Ethiopia
2010/11annual report 100
Table 7.2 Numbers, Capital and Expected Job Opportunities
(Capital in millions of Birr)
2008/09 2009/10 2010/11
Percentage change
A B C C/A C/B
1.Total Investment
Number 8,807 6,496 6,322 -28.2 -2.7 Capital 239,525 96,415 249,469 4.2 158.7 Permanent Workers 614,172 224,633 227,715 -62.9 1.4 Casual Workers 1,166,468 488,330 586,380 -49.7 20.1
2. Total Private
Number 8,797 6,493 6,312 -28.2 -2.8 Capital 156,741 96,022 95,450 -39.1 -0.6 Permanent Workers 405,296 223,161 212,470 -47.6 -4.8 Casual Workers 868,166 488,162 412,117 -52.5 -15.6
3. Domestic
Number 7,184 5,080 5,360 -25.4 5.5 Capital 83,630 40,852 42,093 -49.7 3.0 Permanent Workers 196,420 152,283 146,378 -25.5 -3.9 Casual Workers 569,864 311,185 283,277 -50.3 -9.0
4. Foreign
Number 1,613 1,413 952 -41.0 -32.6 Capital 73,111 55,169 53,357 -27.0 -3.3 Permanent Workers 208,876 70,878 66,092 -68.4 -6.8 Casual Workers 298,302 176,977 128,840 -56.8 -27.2
5.Public
Number 10 3 10 0.0 233.3 Capital 82,784 394 154,019 86.0 39002.4 Permanent Workers 208,876 1,472 15,245 -92.7 935.7 Casual Workers 298,302 168 174,263 -41.6 103628.0
Source: Ethiopian Investment Agency

National Bank of Ethiopia
2010/11annual report 101
Table 7.3 Number and Capital of Investment Projects Approved by Sector (Capital in millions of Birr)
Sectors
2008/09 2009/10 2010/11
Percentage Share to total in 2010/11
No. of Projects
Investment Capital
No. of Projects
Investment Capital
No. of Projects
Investment Capital
No. of Projects
Investment Capital
Manufacturing 1804 58351.11 1,433 35,583 1,294 43,530 20.47 17.45 Agriculture, hunting and forestry 2455 47153.74 1,342 21,625 907 82,769 14.35 33.18
Real estate, renting and Business activities 1506 21489.76 1,155 11,617 1,652 10,439 26.13 4.18
Hotel and restaurants 1091 10466.32 617 10,463 609 9,968 9.63 4.00
Education 249 5664.00 181 1,464 143 1,586 2.26 0.64 Health and social work 155 2255.24 99 2,519 87 1,143 1.38 0.46
Construction 826 81162.70 942 9,924 947 11 14.98 0.00 Construction Machinery Leasing 0 0.00 0.00
Wholesale, retail trade and repair service 242 2712.63 154 893 158 586 2.50 0.23
Transport, storage and communication 346 1510.43 477 1,596 413 1,743 6.53 0.70
Fishing 7 100.21 8 19 1 8 0.02 0.00 Mining and quarying 25 317.84 9 358 17 222 0.27 0.09
Electricity, gas, steam and water supply 12 7825.13 4 33 7 85,570 0.11 34.30
Public administration and defense; compulsory social security 0 0.00 0.00 0.00 0.00
Other community, social and personal service activities 89 515.68 75 321 87 756 1.38 0.30
Grand Total 8807 239525 6496 96415 6322 249,469 100 100
Source: Ethiopian Investment Agency
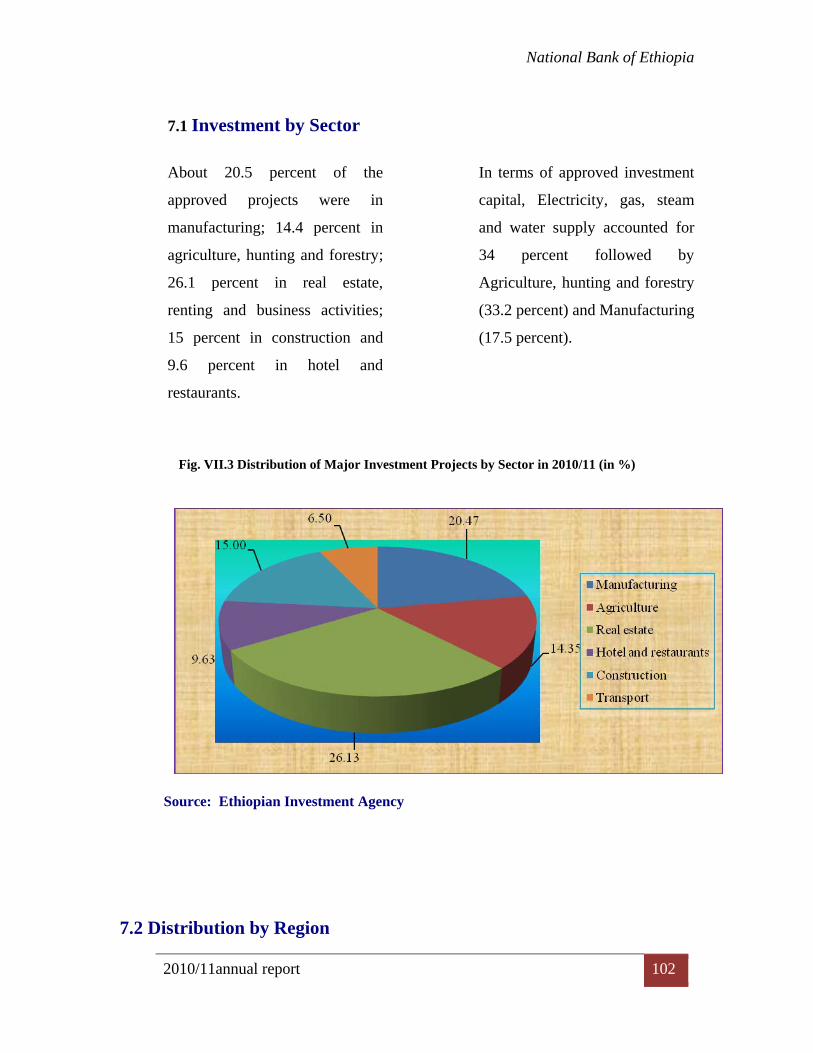
National Bank of Ethiopia
2010/11annual report 102
7.1 Investment by Sector
About 20.5 percent of the
approved projects were in
manufacturing; 14.4 percent in
agriculture, hunting and forestry;
26.1 percent in real estate,
renting and business activities;
15 percent in construction and
9.6 percent in hotel and
restaurants.
In terms of approved investment
capital, Electricity, gas, steam
and water supply accounted for
34 percent followed by
Agriculture, hunting and forestry
(33.2 percent) and Manufacturing
(17.5 percent).
Fig. VII.3 Distribution of Major Investment Projects by Sector in 2010/11 (in %)
Source: Ethiopian Investment Agency 7.2 Distribution by Region

National Bank of Ethiopia
2010/11annual report 103
The regional distribution of the approved
investment projects depicted that Addis
Ababa attracted 3,221 projects with Birr
30.6 billion investment capital, followed
by Oromia 1,386 projects, with Birr 32.2
billion, Amhara 722 projects with Birr
32.7 billion; Tigray 349 projects with
Birr 11.1 billion capital and SNNPR
with 160 projects and Birr 49.7 billion
capital. Table 7.4: Number and Capital of Approved Projects by Region
(Capital in millions Birr)
Regions
2008/09 2009/10 2010/11
percentage share to Total
No. of Projects
InvestmentCapital
No. of Projects
InvestmentCapital
No. of Projects
Investment Capital
No. of Projects
InvestmentCapital
Tigray 543 10862.8 626 7,224 349 11,112 5.52 4.45 Afar 46 4880 32 1,307 26 399 0.41 0.16 Amhara 1,425 12167.2 743 17,371 722 32,753 11.42 13.13 Oromia 2,689 63572.5 1,558 20,739 1,386 32,219 21.93 12.92 Somali 11 55.7 58 345 127 2,738 2.01 1.10 Benishangul-Gumuz 182 643.9 111 1,389 56 81,611 0.89 32.71 SNNPR 543 4487.8 163 2,020 160 49,751 2.53 19.94 Gambella 132 681.04 11 2,675 14 3,920 0.22 1.57 Harari 2 7 48 276 0.76 0.11 Addis Ababa 2,773 120471.3 2,902 29,195 3,221 30,627 50.97 12.28 Dire Dawa 190 8078.9 172 1,455 207 2,995 3.28 1.20 Multiregional Projects 273 13623.4 118 12,689 6 1,067 0.09 0.43 Grand Total 8,807 239,524.8 6496 96415.44 6322 249,469 100 100 Source: Ethiopian Investment Agency

National Bank of Ethiopia
2010/11 annual report 104
8.1 International Economic
Developments 8.1.1 Overview of World Economy3
In 2010, global economic activity continued
to recover from the severe recession
recorded during the global financial crisis.
Particularly in the first half of the year, the
economic upturn was sustained by monetary
and fiscal policy stimulus measures, some
further normalization of global financing
conditions and improvements in consumer
and business confidence. In addition, a
prolonged inventory cycle supported the
global economic recovery, as firms rebuilt
their stocks in response to a more favorable
global economic outlook. In fact, the
restocking contributed significantly to GDP
growth in major economies over this period.
Accordingly, the global composite
Purchasing Managers’ Index (PMI)
continued to recover in early 2010 and
reached a peak of 57.7 in April, which was
above the levels prevailing just before the
intensification of the global economic crisis
after the collapse of Lehman Brothers in
September 2008.
The overall improvement in the economic
situation and the rebound in activity – which
3 Excerpted from European Central Bank, Annual Report 2010.
was led by the manufacturing sector – were
accompanied by a strong recovery in world
trade, as reflected in very buoyant export
and import growth rates, particularly in the
first half of the year. However, the pace of
the recovery was rather uneven across
regions. In advanced economies, the upturn
remained fairly modest. At the same time,
emerging economies, particularly in Asia,
led the global recovery, even raising
concerns about overheating pressures in
several countries. Global employment
indicators also gradually improved in the
course of the year, following widespread job
losses throughout the preceding two years.
In the second half of the year, the global
recovery temporarily lost some momentum
in the light of waning support from the
global inventory cycle and the retrenchment
of fiscal stimuli, but the recovery seemed to
have moved onto a more self-sustained
trajectory. Several countries also announced
consolidation measures to address the
precarious fiscal situation. The process of
balance sheet adjustment in various sectors
and subdued labour market developments,
particularly in advanced economies, further
dampened the recovery of the world
economy. Correspondingly, global trade

National Bank of Ethiopia
2010/11 annual report 105
dynamics also slowed down in the second
half of 2010, six months. However,
available information suggests that the
growth momentum picked up again at the
turn of the year.
In the United States, the economy continued
to recover in 2010. A modest cyclical
upswing gained traction, with the support of
substantial macroeconomic policy stimuli
and a gradual improvement in financial
conditions. The recovery in private
domestic demand was slow by historical
standards, reflecting subdued growth in
consumer spending. Household consumption
remained constrained by high
unemployment, low confidence and
continuing efforts to repair stretched balance
sheets. A strong rebound in business
investment in equipment and software was
an important driver of the recovery,
underpinned by improving access to credit,
as well as solid corporate profitability
against the background of cost-cutting
measures implemented during the downturn.
Growth was also supported by temporary
factors such as government policies enacted
to foster the economic recovery and the
restocking of inventories. The housing
sector failed to improve: after tentatively
increasing in the first half of the year,
housing activity and prices weakened again
in the second half following the expiration
of some housing support initiatives.
Economic activity in Canada picked up
rapidly in early 2010, after emerging from
the recession in mid-2009, supported by
solid domestic demand, macroeconomic
stimuli and a rebound in exports. By the
third quarter of 2010, however, the recovery
had lost momentum owing to a slowdown in
construction activity, coupled with a
negative net trade contribution to growth.
Labour market conditions were relatively
favourable, as they continued to improve
gradually in parallel with the evolving
economic upturn. However, despite
declining to 7.6% in December 2010, the
unemployment rate remained well above its
pre-recession levels. Economic activity
continued to be supported by a low interest
rate environment, stable financial market
conditions and a resilient banking system,
which allowed for a continued flow of credit
to businesses and households.
Table 8.1 Overview of World Economic Outlook and Projection

National Bank of Ethiopia
2010/11 annual report 106
(Annual Percentage Change)
2009 2010
Projection
2011
2012
World Output -0.7 5.1 4.0 4.0Advance Economies -3.7 3.1 1.6 1.9United States -3.5 3.0 1.5 1.8Euro Area -4.3 1.8 1.6 1.1Japan -6.3 4.0 -0.5 2.3Other Emerging Markets and Developing Countries
2.8
7.3
6.4
6.1
World Trade Volume (goods and services) -10.7 12.8 7.5 5.8 Import
Advance Economies -12.4 11.7 5.9 4.0Other Emerging Markets and Developing Countries
-8.0
14.9
11.1
8.1
Export Advance Economies -11.9 12.3 6.2 5.2Other Emerging Markets and Developing Countries
-7.7
13.6
9.4
7.8
Commodity Prices Oil -36.3 27.9 30.6 -3.1Non-Oil -15.7 26.3 21.2 -4.7
Consumer Price Advance Economies 0.1 1.6 2.6 1.4Other Emerging Markets and Developing Countries
5.2
6.1
7.5
5.9
Source: IMF, World Economic Outlook, September, 2011.
Following the sharp contraction experienced
in 2008-09, euro area economic growth
turned positive again at the end of 2009 and
continued to grow in 2010. Quarterly real
GDP growth rates in the first half of 2010
were better than expected, reflecting in part
considerable support from fiscal stimuli and
the accommodative monetary policy stance,
as well as the rebound in global economic
activity. In line with expectations, economic
growth moderated somewhat in the second
half of the year, while the underlying
momentum of the euro area recovery
remained positive. Overall, euro area real
GDP increased by around 1.8% in 2010 after
having contracted by 4.3% in 2009.
In Japan, the economic recovery continued
during the first three quarters of 2010,
supported by the implementation of
accommodative monetary policy and a
substantial fiscal stimulus. The improvement
in the economic situation in Japan was also

National Bank of Ethiopia
2010/11 annual report 7
aided by strong global demand, in particular
from the Asian emerging economies,
especially in the first half of 2010. In the
second half of the year, the contribution
from the external sector declined, owing to
the moderation of world trade growth, while
domestic spending remained firm. However,
towards the end of the year, as a result of
volatility in domestic spending following the
withdrawal of the government stimulus, the
economic recovery in Japan hit a soft patch,
resulting in a deterioration in business
sentiment. Labor market conditions
improved somewhat over 2010, although the
unemployment rate remained rather high by
historical standards.
Emerging Asia’s resilience to the global
economic and financial crisis was
demonstrated by very strong economic
performance across the region in 2010, with
an area-wide GDP growth rate of 9.1%.
While supportive fiscal and monetary
policies were gradually withdrawn and the
contribution of net exports declined in the
second half of the year, domestic private
demand and, notably, gross fixed investment
took over as the main drivers of economic
growth, especially in India and Indonesia.
Overall economic performance remained
robust in the second half of 2010, although
the pace of expansion slowed down
somewhat compared with the previous six
months.
Real GDP growth in China accelerated to
10.3% in 2010, from 9.2% in 2009. The
vigorous economic performance reflected
increasing contributions from private
investment and net exports, which
counterbalanced the negative impact of the
gradual withdrawal of policy stimuli.
However, the relative contribution of
consumption to growth decreased and the
current account surplus widened in nominal
terms in 2010, evidence of the persistence of
internal and external imbalances.
Latin America’s economic activity continued
to recover rapidly in 2010. GDP growth was
particularly robust in the first half of the
year, mainly owing to buoyant domestic
demand which more than offset the
outstanding negative contribution of external
demand (about 3 percentage points in the
third quarter) to GDP growth. Thereafter, the
growth momentum slowed down somewhat
as policy stimulus measures were withdrawn
and foreign demand weakened. In year-on-
year terms, real GDP for the region as a
whole increased by 6.0% on average in the
first three quarters of 2010. Gross capital
formation, including inventory accumulation
and private consumption were the main

National Bank of Ethiopia
2010/11 annual report 8
drivers of regional growth. Investment was
spurred on by the improved growth outlook,
the rise in commodity prices, the decline in
real interest rates and the greater availability
of financing, which, in some countries, was
enhanced by lending by public banks.
Private consumption growth was sustained
by a rapid recovery in confidence as well as
employment and real wages.
The SSA region is showing solid
macroeconomic performance, with many
economies already growing at rates close to
their pre-crisis averages. The global
slowdown has not significantly affected the
region thus far, but downside risks have
risen. Real activity in the region expanded
strongly in 2010 and so far in 2011. Robust
private and public consumption underpinned
this strength, as many countries used
available macroeconomic policy room to
help speed the recovery from the crisis-
induced slowdown.
A further deterioration of the global
economic environment could have
substantial spillovers to the SSA region. A
faltering U.S. or European recovery could
undermine prospects for exports,
remittances, official aid, and private capital
flows. The region is poised for continued
economic expansion in the near term,
provided the recent rise in financial and
economic instability in major advanced
economies remains contained. Real GDP
growth in the SSA region is projected to
average 5.3 to 5.8 percent during 2011–12,
with considerable differences across the
region.
8.1.2 World Trade
Trade has been an important driver of the
global economic recovery in 2010 as the
performance of global volume of trade in
goods and services depicted 12.8 percent
growth from a 10.7 percent decline in 2009.
The pace of growth in global volume of
trade in goods and service is, however,
expected to slow down to 7.5 percent in
2011 and further to 5.8 percent in the
subsequent year. Imports in advanced
economies also went up by 11.7 percent in
2010 in contrast to a 12.4 percent fall in the
preceding year. Import growth in these
countries are anticipated to grow by 6 and 4
percent in the following two years
respectively. Likewise, exports in advanced
nations recorded a 12.3 percent growth in
2010 following a 12 percent decline in 2009.
Growth in exports of these economies are
forecasted to slow down to 6.2 and 5.2
percent in the next two years respectively.

National Bank of Ethiopia
2010/11 annual report 9
The volume of export of goods and services
in other emerging markets and developing
countries expanded by 13.6 percent while
imports increased by 15 percent in 2010
against a 7.7 and 8 percent contraction
respectively in the previous year. Growth in
exports and imports of these countries are
anticipated to slow down moderately to 9.4
and 11.1 percent respectively in 2011.
Having contracted sharply during the
recession, the US current account deficit
widened modestly with the onset of the
recovery and averaged 3.3% of GDP in the
first three quarters of 2010, up from 2.7% in
2009.
In 2010, the current account of the euro area
recorded a deficit of €56.4 billion (or 0.6%
of euro area GDP), compared with a deficit
of €51.4 billion in 2009. These
developments resulted from a decrease in the
deficit in the income balance of €18.6
billion, while the trade balance in services
remained somewhat stable. However, the
trade balance in goods worsened during
2010, counterbalancing the improvement in
the income balance. After the rebound in
trade in early 2009 and the improvement in
the trade balance over 2009, the goods
balance continued to register a surplus in
2010 that was €16.2 billion lower than the
surplus recorded in 2009. Finally, the deficit
in the current transfers balance deteriorated
by €8.2 billion in 2010.
8.1.3 Inflation and Commodity Prices
In spite of a gradual increase in commodity
prices, mostly in the second half of the year,
inflationary pressures in advanced
economies remained subdued in 2010 – with
some notable exceptions, such as the United
Kingdom – on account of well-anchored
inflation expectations and the prevailing
spare capacity. This contrasted with dynamic
emerging markets where inflationary
pressures were more pronounced, partly on
account of higher commodity prices as well
as rising capacity constraints. Amid
persisting concerns regarding inflation
resulting from overheating, several central
banks in emerging economies decided to
withdraw some of the exceptional liquidity
measures introduced in response to the crisis
and to tighten their monetary policy stances.
Headline annual consumer price inflation in
the OECD area declined gradually during
2010, from a peak of just above 2% in
January 2010 to 1.6% in August, before
edging up again to stand at 2.1% in
December. This is also consistent with
developments in the PMI for input prices,

National Bank of Ethiopia
2010/11 annual report 10
which also increased in the second half of
2010 and in January 2011 stood at the
highest level in almost two and a half years.
Higher food and energy prices contributed to
this increase. Excluding food and energy,
annual consumer price inflation in the
OECD area declined throughout the year,
from 1.6% at the beginning of 2010 to 1.2%
in December.
In the context of a modest economic
recovery, price developments in United
States remained subdued as upward cost
pressures were limited by the persistent slack
in product and labour markets. The annual
change in the CPI for 2010 rose to 1.6%
from -0.4% the year before, on account of
rising energy costs. Excluding food and
energy, CPI inflation continued to slow and
averaged 1.0% for the whole year, down
from 1.7% in 2009.
In Canada, headline and core CPI inflation
stayed within the central bank’s target
inflation range of 1% to 3%. Annual
headline CPI inflation trended upwards in
the second half of 2010 and stood at 2.4% in
December, reflecting the impact of higher
energy and food prices, while core inflation
was 1.5% in December, following a gentle
deceleration in the course of 2010.
Consumer prices in Japan fell throughout
most of 2010, on a year-on-year basis, owing
to substantial slack in the economy. In
October, however, annual CPI inflation
turned positive for the first time in almost
two years, driven partly by an increase in tax
on cigarettes and higher commodity prices,
while annual CPI inflation excluding food
and energy, although moderating, continued
its deflationary trend.
Inflationary pressures in the Euro area
remained moderate in 2010, with some
upward pressure emerging at the end of the
year and in early 2011. The average annual
inflation rate in 2010 stood at 1.6%. Month-
on-month developments in the inflation rate
were noteworthy, as annual HICP inflation
gradually increased in 2010, rising from a
low of 0.9% in February to 2.2% in
December. The gradual increase in HICP
inflation mainly reflected developments in
commodity prices, driven by the global
economic recovery and by base effects.
Market-based and survey-based measures of
long-term inflation expectations remained
broadly anchored at levels consistent with
the Governing Council’s aim of keeping
inflation rates below, but close to 2% in the
medium term.

National Bank of Ethiopia
2010/11 annual report 11
After recording very low consumer price
inflation rates in 2009, inflationary pressures
in emerging Asia increased markedly during
2010. Annual CPI inflation for the region
stood at 5% in December 2010, mainly on
account of rising food and commodity
prices. Most central banks in the region
started to tighten their monetary stances in
the second half of 2010, reducing the
monetary stimuli introduced in the previous
year.
Inflationary pressures in China increased
during the year, with CPI inflation reaching
4.6% in annual terms in December, mainly
on account of rising food prices. Property
price pressures emerged against the
background of ample liquidity, ongoing
loose credit conditions and negative real
interest rates on deposits.
In early 2010, notwithstanding sizeable
differences across Latin America countries,
inflation in most of the countries with
inflation-targeting arrangements moved
significantly closer to the respective target
value. However, in the context of strong
growth in economic activity and rising
commodity prices, inflationary pressures
started to rise later in the year and some
countries began to reverse part of the
monetary stimuli deployed during the crisis.
From April onwards several central banks in
the region initiated a cycle of official interest
rate rises.
Across the SSA region, there has been a
marked increase in inflation. The earlier
surge in commodity prices risks fueling
inflation further amid the limited economic
slack of the LICs (for example, Uganda),
especially in net staple importers (such as
Ethiopia) or where there is significant pass-
through from international to domestic food
prices (for example, Kenya). Among oil
exporters, inflation is projected to remain
high, dominated by price developments in
Nigeria and Angola, where rapid monetary
expansion before the crisis (Nigeria) and a
sharp increase in domestic fuel prices
(Angola) fed into price increases.
After having remained broadly stable amid
some volatility in the first half of 2010, oil
prices began to increase steadily in August,
with the Brent crude oil price standing at
USD 113 per barrel on 25 February 2011,
compared with USD 78 per barrel at the
beginning of 2010. In US dollar terms, the
level reached at the end of February 2011
was broadly similar to that recorded in May
2008. For the year 2010 as a whole, the
average price of Brent crude oil was USD 80

National Bank of Ethiopia
2010/11 annual report 12
per barrel, i.e. 29% above the average of the
previous year.
The oil price increases came against the
background of a recovery in global oil
demand, which strengthened throughout the
year, and was supported by the global
economic recovery, as well as by weather
conditions in the northern hemisphere in the
second part of the year. This growth in
demand also led to a reassessment of future
demand prospects, which looked much more
robust than one year earlier and suggested
that the market might tighten in the future.
One indication of this was the stream of
repeated upward revisions of demand
projections by the International Energy
Agency, both for emerging and developed
economies. On the supply side, the output in
North America and in former Soviet Union
countries proved to be higher than foreseen,
but on the other hand, OPEC decided not to
raise its production quotas in 2010, despite
its ample spare capacity. In the context of
buoyant demand, this led to a substantial
drawdown in OECD inventories, which
nevertheless remained at high levels by
historical standards. In the first two months
of 2011 geopolitical events in North Africa
and the Middle East further tightened the
supply side of the market, thereby
accelerating the increase in prices.
The prices of non-energy commodities also
increased in 2010, amid robust demand from
emerging economies and supply constraints.
Metal prices, in particular of copper, nickel
and tin – posted significant gains, which
were also sustained by buoyant imports by
emerging economies. On the back of supply
constraints, food prices also increased, led in
particular by maize, sugar and wheat. In
aggregate terms, non-energy commodity
prices (denominated in US dollars) were
about 36% higher towards the end of
February 2011 compared with the beginning
of 2010.
8.1.4 Exchange Rates
Exchange rate developments in 2010 were to
a large extent shaped by the economic
recovery, fiscal conditions and monetary
policy around the world. Developments were
somewhat volatile in many advanced
economies, as the economic recovery was
still vulnerable and dependent on the support
of fiscal and monetary policies. In the first
half of the year, the euro depreciated against
several major currencies, reflecting rising
concerns about the sovereign debt situation
in some euro area countries. This uncertainty
also resulted in an increase in the implied
volatility of the euro exchange rate against

National Bank of Ethiopia
2010/11 annual report 13
major currencies in May and June. In the
second half of 2010, the euro rebounded,
amid some volatility, owing mostly to the
alleviation of concerns about sovereign debt,
as well as more positive than expected
macroeconomic news for the euro area. The
overall appreciation was driven mainly by
developments in the USD/EUR exchange
rate.
In the course of 2010, the euro depreciated
by 8.2% in effective terms as measured
against the currencies of 20 of the euro
area’s important trading partners. As a
consequence, the average level of the
nominal effective exchange rate in 2010 was
6.3% lower compared with 2009. In 2010
the euro stood 5.5% higher than the
historical average since 1999.
The euro traded at USD 1.34 on 31
December 2010, about 7.3% lower than at
the beginning of 2010 and 4.2% weaker than
its average in 2009. The depreciation of the
euro vis-à-vis the US dollar in the first half
of 2010 was driven by a stronger
macroeconomic recovery in the United
States than in the euro area in early 2010. In
the second half of 2010, the euro
strengthened against the US dollar in
response to the approval by the US
authorities of an additional economic
stimulus.
In the first half of 2010 the euro also
continued to depreciate vis-à-vis the
Japanese yen, completely reversing its
appreciation in 2009. Throughout the
remainder of 2010, the bilateral JPY/EUR
exchange rate fluctuated within a rather
narrow range, with the euro trading between
JPY 105 and JPY 115. The euro traded at
JPY 108.65 on 31 December 2011, lower by
18.4% than at the beginning of the year and
16.7% below its average for 2009. Volatility
in the JPY/EUR exchange rate increased
sharply in May and June 2010, before
declining in the second half of 2010.
In 2010, the euro depreciated against the
Pound Sterling by 3.1% from GBP 0.89 to
GBP 0.86. The euro depreciated against the
Pound Sterling in the first half of 2010 amid
market concerns over fiscal sustainability in
some euro area countries. In the second half
of the year, the euro recovered some of the
earlier losses. By the end of 2010, the euro
bilateral exchange rate against the Pound
Sterling was still above its historical average
since 1999, owing to the appreciation that
occurred in 2008 and early 2009. In 2010,
the euro depreciated against the Swiss Franc
by 15.7%. Until June 2010, the depreciation

National Bank of Ethiopia
2010/11 annual report 14
was moderated as a result of interventions by
the Swiss National Bank. In the second half
of 2010, the euro further depreciated against
the Swiss Franc significantly, amid some
volatility.
8.1.5 Capital Flows
Given emerging Asia’s strong
macroeconomic performance and the
declining risk aversion of international
investors the region also experienced a major
rebound in capital inflows. A number of
countries intervened in currency markets to
stem the ensuing currency appreciation
pressures and also introduced capital
controls and macro-prudential measures.
A large capital inflows in to China,
particularly in the last quarter of 2010,
fuelled a rapid increase in foreign exchange
reserves, which reached USD 2.85 trillion by
the end of 2010. Private capital flows, which
had been gaining importance in Sub-Saharan
Africa region as a source of external
financing before the crisis, have resumed
only to a handful of emerging and frontier
economies (Ghana, Mauritius, South Africa).
8.2 Implication for Ethiopia The continuous recovery and expansion of
global economic activities in particular of
advanced nations and emerging Asia
economies and the rising global commodity
prices accounted largely for a robust
development of Ethiopia external sector in
2010/11.
The global developments in commodity
prices attributed importantly to the strong
growth of commodity exports while the
expansion of economic activities in
advanced countries has been the prime
driving factor for the significant inflows of
individual remittances and service receipts
mainly from travel and transport services
during the review fiscal year.
On the other hand, the increase in global
commodity prices had produced a notable
pass-through effect and contributed to rising
domestic food price. The surge in fuel
import bill during the review period was
primarily pushed up by the hike in
international oil price following the political
unrest in Middle East and North Africa since
the beginning of the second half of 2010/11.
Fertilizer import bill also poised a potential
burden on foreign exchange payments of the
nation largely driven by the increase in
international price of the product.