Embed Size (px)
Citation preview
International Journal of Management Studies ISSN(Print) 2249-0302 ISSN (Online)2231-2528 http://www.researchersworld.com/ijms/
_______________________________________________- 68 - Vol-III, Issue-1, June 2016
COMMERCIAL BANK LENDING IN ETHIOPIA
A. S. Kannan,
Associate Professor,
Department of Management Studies,
Sri Manakula Vinayagar Engineering
College, Puducherry, India
Research Scholar,
Banking Technology, School of
Management, Pondicherry University, India
Dr. S. Sudalaimuthu,
Research Supervisor & Associate Professor,
Department of Banking Technology, School
of Management, Pondicherry University,
Puducherry, India.
ABSTRACT
Ethiopia is a bank-dominated economy. Two public sector and sixteen private sector
commercial banks cater to the financial needs of the businessmen in the country, with a
branch network of 2,661 branches, and a capital of 1.45 billion US Dollars as of June
2015. This paper on commercial bank lending in Ethiopia tries to analyze the trends in
lending by public sector and private sector banks; evaluates the growth rates in advances as
well as gross domestic credit; and correlates the deposits mobilized with the advances
granted in the recent decade. This study is fully secondary data based, from the official
website and database of the central bank of the country. It uses, in addition to descriptive
statistical tools, trend analysis, compounded annual growth rates, as well as correlation
measures for data analysis. Findings are presented in the form of summary data tables,
charts and graphs with appropriate explanations. Major findings of the study include:
mixed trends are found in total advances by public and private sector commercial banks –
with public banks dominating the lending scenario in the recent years; lending by private
banks showed downward trend since 2010; very high positive correlation existing between
deposits mobilized and advances disbursed by the Ethiopian banking industry; and a
compounded annual growth rate of 22.7% is registered by all commercial banks in the
recent decade. The study is highly significant as it is a pioneer work on the commercial
bank lending in Ethiopia. It would be useful to the businessmen, banking industry as well
as to the policymakers. Since the industry is somewhat young and emerging, the study
suffered with the limitation of analyzing data only for a decade or more, and as such future
work with extended datasets could be a possibility.
Keywords: CAGR, Commercial Banks, comparative study, Ethiopia, Lending.
JEL Classification: G21, E51, N27, O16, O55

International Journal of Management Studies ISSN(Print) 2249-0302 ISSN (Online)2231-2528 http://www.researchersworld.com/ijms/
_______________________________________________- 69 - Vol-III, Issue-1, June 2016
Introduction:
Banks are public financial institutions with a mandate to use the deposits generated from the public for
the purpose of granting loans and advances to the public – especially to those business enterprises who
are in need of funds for their operations and expansion. They play more significant role in economic
growth of developing nations. In bank-dominated economies, the role of commercial banks are
paramount – in providing the much-needed funds to the business public, as being the major and
probably only source of funds for them in the absence of a well-developed capital market.
Ethiopia is a developing nation – one among the Next Eleven, after the BRICS. It would be interesting
to know that Ethiopia performed consistently well by registering sustained economic development in the
recent decade (as observed in Kannan & Sudalaimuthu, 2015). Ethiopia’s banking industry is fast
growing – as evidenced by the number of banks started up in the last two decades, since liberalization in
the country. Ethiopia opened the gates of banking to private natives only in 1994, and since then there
have been 16 private banks that have been in the fray now. As of June 2015, Ethiopia has two public
sector commercial banks with 1,097 branches and 16 private sector commercial banks with a branch
network of 1,564 branches all over the country. The industry garnered the capital of 550 Million US
Dollars (equivalent in the local currency, Ethiopian Birr) by the public sector commercial banks, and
around 850 Million US Dollars by the private sector commercial banks in the country. Table 1 given
below summarizes the banking industry in Ethiopia as it existed in June 2015:
Commercial Banks' Network in Ethiopia: as of June 2015
Sl. Name of the Bank Estt. Sector
Branch Network Paid in Capital
In
AA** Region* Total
%
Share
Million
Birr
%
Share
1 Commercial Bank of
Ethiopia 1964 Public 192 785 977 37% 10,716.4 37%
2 Construction & Business
Bank 1975 Public 51 69 120 5% 731.2 2%
State-owned Commercial Banks 243 854 1,097 41% 11,447.6 39%
3 Awash International Bank 1994 Private 112 95 207 8% 2,540.3 9%
4 Dashen Bank 1995 Private 88 76 164 6% 2,377.2 8%
5 Bank of Abysinia 1996 Private 72 64 136 5% 1,594.3 5%
6 Wegagen Bank 1997 Private 56 63 119 4% 2,061.9 7%
7 United Bank 1998 Private 66 62 128 5% 1,475.0 5%
8 Nib International Bank 1999 Private 65 50 115 4% 1,925.3 7%
9 Cooperative Bank of
Oromia 2004 Private 35 106 141 5% 1,058.7 4%
10 Lion International Bank 2006 Private 38 50 88 3% 601.6 2%
11 Oromia International
Bank 2008 Private 49 103 152 6% 771.7 3%
12 Zemen Bank 2008 Private 2 5 7 0% 650.0 2%
13 Bunna International Bank 2009 Private 35 47 82 3% 559.3 2%
14 Berhan International
Bank 2009 Private 39 32 71 3% 622.3 2%
15 Abay Bank 2010 Private 19 70 89 3% 591.0 2%
16 Addis International Bank 2011 Private 22 10 32 1% 399.6 1%
17 Debub Global Bank 2012 Private 9 13 22 1% 202.6 1%
18 Enat Bank 2012 Private 6 5 11 0% 392.1 1%
Private-owned Commercial Banks 713 851 1,564 59% 17,822.9 61%
GRAND TOTAL (Public + Private) 956 1,705 2,661 100% 29,270.5 100%
** In AA: In Addis Ababa, the capital city.
* Region: In rest of Ethiopia, other than Addis Ababa.
Source: National Bank of Ethiopia, Quarterly Bulletin, Vol.32 (4)
International Journal of Management Studies ISSN(Print) 2249-0302 ISSN (Online)2231-2528 http://www.researchersworld.com/ijms/
_______________________________________________- 70 - Vol-III, Issue-1, June 2016
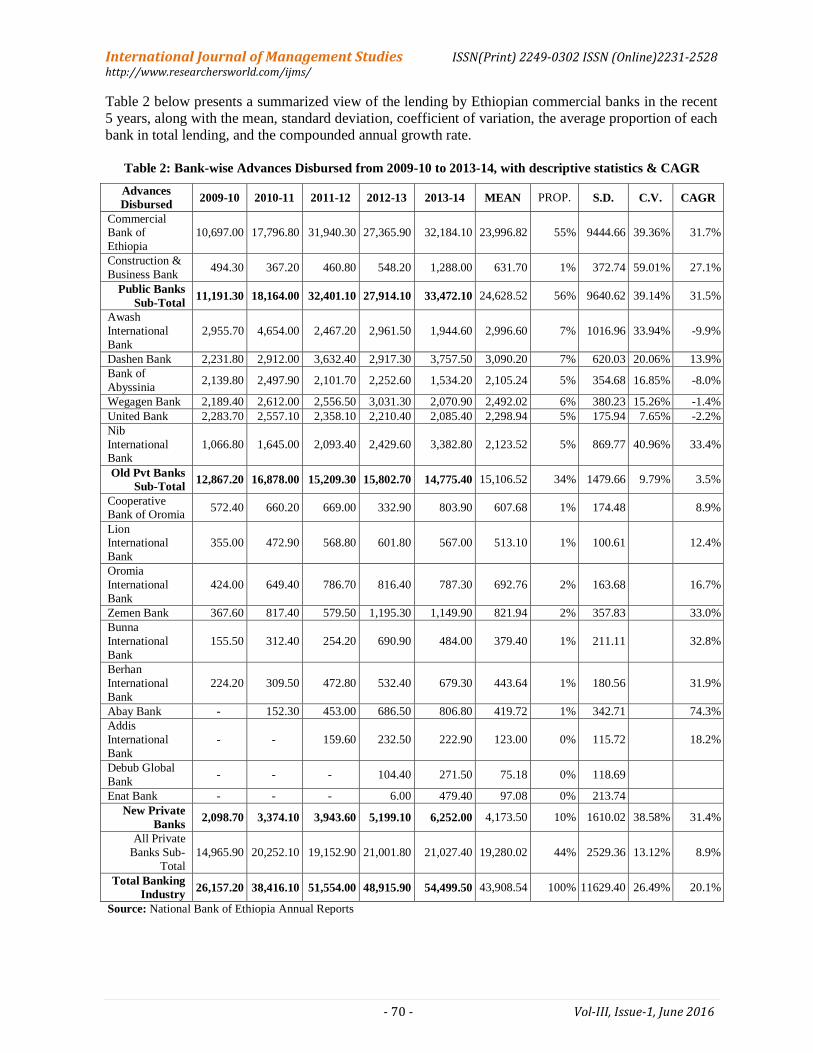
Table 2 below presents a summarized view of the lending by Ethiopian commercial banks in the recent
5 years, along with the mean, standard deviation, coefficient of variation, the average proportion of each
bank in total lending, and the compounded annual growth rate.
Table 2: Bank-wise Advances Disbursed from 2009-10 to 2013-14, with descriptive statistics & CAGR
Advances
Disbursed 2009-10 2010-11 2011-12 2012-13 2013-14 MEAN PROP. S.D. C.V. CAGR
Commercial Bank of
Ethiopia
10,697.00 17,796.80 31,940.30 27,365.90 32,184.10 23,996.82 55% 9444.66 39.36% 31.7%
Construction &
Business Bank 494.30 367.20 460.80 548.20 1,288.00 631.70 1% 372.74 59.01% 27.1%
Public Banks
Sub-Total 11,191.30 18,164.00 32,401.10 27,914.10 33,472.10 24,628.52 56% 9640.62 39.14% 31.5%
Awash
International
Bank
2,955.70 4,654.00 2,467.20 2,961.50 1,944.60 2,996.60 7% 1016.96 33.94% -9.9%
Dashen Bank 2,231.80 2,912.00 3,632.40 2,917.30 3,757.50 3,090.20 7% 620.03 20.06% 13.9%
Bank of
Abyssinia 2,139.80 2,497.90 2,101.70 2,252.60 1,534.20 2,105.24 5% 354.68 16.85% -8.0%
Wegagen Bank 2,189.40 2,612.00 2,556.50 3,031.30 2,070.90 2,492.02 6% 380.23 15.26% -1.4%
United Bank 2,283.70 2,557.10 2,358.10 2,210.40 2,085.40 2,298.94 5% 175.94 7.65% -2.2%
Nib
International Bank
1,066.80 1,645.00 2,093.40 2,429.60 3,382.80 2,123.52 5% 869.77 40.96% 33.4%
Old Pvt Banks
Sub-Total 12,867.20 16,878.00 15,209.30 15,802.70 14,775.40 15,106.52 34% 1479.66 9.79% 3.5%
Cooperative Bank of Oromia
572.40 660.20 669.00 332.90 803.90 607.68 1% 174.48 8.9%
Lion International
Bank
355.00 472.90 568.80 601.80 567.00 513.10 1% 100.61 12.4%
Oromia
International
Bank
424.00 649.40 786.70 816.40 787.30 692.76 2% 163.68 16.7%
Zemen Bank 367.60 817.40 579.50 1,195.30 1,149.90 821.94 2% 357.83 33.0%
Bunna
International
Bank
155.50 312.40 254.20 690.90 484.00 379.40 1% 211.11 32.8%
Berhan
International
Bank
224.20 309.50 472.80 532.40 679.30 443.64 1% 180.56 31.9%
Abay Bank - 152.30 453.00 686.50 806.80 419.72 1% 342.71 74.3%
Addis
International
Bank
- - 159.60 232.50 222.90 123.00 0% 115.72 18.2%
Debub Global
Bank - - - 104.40 271.50 75.18 0% 118.69
Enat Bank - - - 6.00 479.40 97.08 0% 213.74
New Private
Banks 2,098.70 3,374.10 3,943.60 5,199.10 6,252.00 4,173.50 10% 1610.02 38.58% 31.4%
All Private
Banks Sub-
Total
14,965.90 20,252.10 19,152.90 21,001.80 21,027.40 19,280.02 44% 2529.36 13.12% 8.9%
Total Banking
Industry 26,157.20 38,416.10 51,554.00 48,915.90 54,499.50 43,908.54 100% 11629.40 26.49% 20.1%
Source: National Bank of Ethiopia Annual Reports

International Journal of Management Studies ISSN(Print) 2249-0302 ISSN (Online)2231-2528 http://www.researchersworld.com/ijms/
_______________________________________________- 71 - Vol-III, Issue-1, June 2016
Purpose & Scope of the Study:
The purposes of the study are: (i) to analyze the trends in lending by public sector and private sector
commercial banks in Ethiopia, (ii) to evaluate growth rates in commercial bank lending, and compare it
with that of gross domestic credit in the country; and (iii) to correlate the advances by commercial banks
in Ethiopia with the deposits mobilized. The study is confined to data availability from official sources,
viz., the National Bank of Ethiopia. Accordingly it studies the data pertaining to lending for the decade
from 2005 to 2014, and gross domestic credit for 35 years from 1979 to 2014.
Brief Review of Literature:
The study by Paul Ojeaga et al. (2013) investigates the effect of bank lending on growth in Nigeria
using a sample of data from 1989 to 2012; 23 years the method of estimation used in the study is the
quantile regression estimation method. It was found that commercial bank lending was having a
negative effect on growth while institutions were not sufficiently protecting customers from the negative
effect that often arise when banks liquidate. Central bank policies were found to be minimizing bank
losses and helping to drive economic growth in general. The policy implication of the finding is that
lower interest rates and less stringent conditions are likely to increase bank lending in general and this
could have far reaching effect in driving growth in Nigeria.
William F. Bassett and Egon Zakrajsek reviewed recent developments in business lending by
commercial banks in 2003, and concluded that despite the appreciable deterioration in asset quality and
the reduced demand for credit by business borrowers over the past several years, commercial banks
have remained highly profitable and well capitalized. In contrast to the 1990-91 period, when large
losses held down banks' earnings and eroded their capital, during the recent recession banks were well
positioned to lend to creditworthy business customers willing to pay the higher loan fees and lending
spreads that banks have increasingly demanded as part of their improved risk management. The
economic slowdown and the tightening of credit standards, however, sharply reduced the number of
creditworthy firms. Meanwhile, the customers that remained creditworthy generally had less need for
external funds.
Motivated by the frequently observed link between commercial property price volatility and banking
crises, Davis & Zhu (2004) in their paper entitled “Bank lending and commercial property cycles: sme
cross-country evidences” investigated at a macroeconomic level the determination of commercial
property prices and the interaction between commercial property prices and bank lending. The
researchers develop a reduced-form theoretical model which suggests bank lending is closely related to
commercial property prices and that commercial property can develop cycles given plausible
assumptions, where the cycles are largely driven by the dynamic linkage between the commercial
property sector, bank credit and the macro-economy. Cross-country empirical analysis based on a
sample of 17 developed economies, using a unique dataset collected by the BIS, confirms the model’s
predictions. An investigation of determinants of commercial property prices shows particularly strong
links of credit to commercial property in the countries that experienced banking crises linked to property
losses in 1985-95. Further studies of dynamic interaction suggest that commercial property prices are
rather “autonomous”, in that they tend to cause credit expansion, rather than excessive bank lending
boosting property prices. In addition, GDP has an important influence on both commercial property
prices and bank credit. The work has implications for risk management and prudential supervision.
The research study by Olusanya et al. (2012) takes a look at determinants of lending behaviour of
commercial banks in Nigeria: a Co-integration analysis between 1975 to 2010. However, the study
make use of secondary data and series of Econometrics techniques were adopted, to justify the long run
relationship between Commercial bank and its lending behaviour over the period of analysis. Moreover,
the study investigates the level of commercial banks loan advances in Nigeria and to also examine those
various determinants of commercial banks’ lending behavior in Nigerian. More so, the model used is
estimated using Nigerian commercial bank Loan and advances (LOA) and other determinants such as
Volume of deposits (Vd), annual average exchange rate of the naira to dollar (Fx) for the period of
thirty-seven (37) years, Investment Portfolio (Ip), Interest rate (lending rate) (Ir), Gross domestic

International Journal of Management Studies ISSN(Print) 2249-0302 ISSN (Online)2231-2528 http://www.researchersworld.com/ijms/
_______________________________________________- 72 - Vol-III, Issue-1, June 2016
product at current market price (Gdp) and Cash reserve requirement ratio (Rr). However, the model
result reveals that there is positive relationship between Loan and advances and Volume of deposits,
annual average exchange rate of the naira to dollar, Gross domestic product at current market price and
cash reserve requirement ratio except Investment portfolio and Interest rate (lending rate) that have a
negative relationship. It was also revealed from the result that there is a long run relationship between
Loan and advances and all the explanatory variables in the model and this shows that commercial bank
has a lot of impact of their lending behaviour. Finally the study recommend and conclude that
commercial bank should endeavour to create more deposit in other to improve their lending behaviour
and should enforce the most easily realizable policies and good credit management in every situation.
Betubiza and Leatham (1995) did, in their study entitled “Factors affecting Commercial Bank Lending
to Agriculture”, a tobit econometric procedure to examine the effect of selected demand and supply
factors on non-real estate agricultural lending by commercial banks in Texas. Their Results show that
banks have reduced their agricultural loan portfolios in response to increased use of interest sensitive
deposits after deregulation, Moreover, almost half of this decrease came from banks that stopped
making agricultural loans. Also, results show that banks affiliated with multi-bank holding companies
lend less money to agriculture relative to their assets than do independent banks.
Charles P. Himmelberg and Donald P. Morgan (n.d.) in their paper “Is Bank Lending Special?”
conclude that bank lending is still special, at least for some business borrowers. Smaller, lower-quality
borrowers still require intensive screening and monitoring by intermediaries. Some such firms can
borrow from insurance companies, but many do not. Only firms with easily secured assets seem able to
borrow from finance companies. For the remainder of firms, bank lending is still special. Of course, the
existence of a lending channel also requires that monetary or regulatory policy actually change the
supply of bank loans.
A Capgemini report on “Impact of Regulations on Bank Lending” (2014) found that the regulatory
pressure is imposing a negative cost on banks, which is hampering credit growth of the sector and is
preventing banks from taking part in a sustainable economic recovery.
The researchers identified the gap in literature as there is no significant study on the trends in
commercial bank lending in Ethiopia. Hence, they determined to carry out this wholly secondary data
based study.
Methodology:
The study is fully based on secondary data. Data for the study is obtained from the official website of
the National Bank of Ethiopia (the central bank of the country), and from the official databases
maintained by the bank. Appropriate computations, such as trend analysis, growth percentages,
compounded annual growth rate, mean, standard deviation, coefficient of variation, and correlation are
made by the researcher using Microsoft Excel 2010 package. For the purpose of data analysis,
presentation and interpretation, appropriate tables are drawn, as well as the charts and graphs as fit.
Results and Discussion:
This chapter in the paper presents the data analysis and discusses the details. It is sub-divided thus: (a)
Comparative analysis of public and private sector commercial bank lending; (b) growth trends in lending
by public and private sector commercial banks; (c) correlation analysis of lending by public and private
sector commercial banks; (d) borrower category-wise descriptive statistics and compounded annual
growth rate analysis; (e) Analysis on advances performance with reference to deposits mobilized and total
assets of commercial banks; and (f) Analysis of growth trends, compounded annual growth rate, and
correlation measure between Gross Domestic Credit and Commercial Bank Advances in Ethiopia.
Comparative analysis of public and private sector commercial banks’ lending:
For the purpose of this analysis, commercial banks in Ethiopia are taken under three categories, viz., (1)
Public sector commercial banks (two in number); (2) Old private sector commercial banks (six in
number) – this group refers to the private sector commercial banks which were operational prior to

International Journal of Management Studies ISSN(Print) 2249-0302 ISSN (Online)2231-2528 http://www.researchersworld.com/ijms/
_______________________________________________- 73 - Vol-III, Issue-1, June 2016
2000; and (3) New private sector commercial banks (ten in number) – this group refers to the private
sector commercial banks which commenced operations from 2004 one by one till 2012. (A cross-
reference with table given in page 2 will make this classification clear).
Source: National Bank of Ethiopia Annual Reports
As shown in figure 1 in the previous page, the lending by public sector and old private sector
commercial banks have undergone mixed trends in the reported period of 12 years from 2002-03 to
2013-14. The lending by public sector commercial banks registered a lesser proportion of lending in the
earlier years (from 2002-03 to 2006-07), thereafter it started showing market capture except for one
year, viz., 2009-10. The lending scenario got dominated by public sector banks in 2011-12 with a two-
third share (62.8%) and almost near that in 2013-14 (61.4%). Contrary to this, old private sector
commercial banks showed domination of the loans market in the early period but got succumbed in the
later years. The reasons that can be attributed to this paradigm shift in the lending trends could be: (a)
Private commercial banks were asked to invest 27% of their lending in NBE bills from April 2011, thus
curtailing their lending capacity to a great extent; (b) the rapid expansion of branch network by public
sector banks, especially by the Commercial Bank of Ethiopia led to a stiff competition for the private
sector banks in mobilizing the deposits from the general public and business enterprises, which also
constrained their lending capacity to a considerable extent; and (c) the introduction of 40:60 principle
(which required the borrowers to repay 40% of loan in the first year of borrowing, and the balance 60%
to be repaid in the remaining loan tenure) affected the morale of the borrowers heavily and thus created
a sort of liquidity crisis for them in the initial year of borrowing. The new private banks which started
operating in 2004, 2008, 2009, 2010 and 2012, have showed certain inroads in lending scenario of the
country, thus showing a marginally progressing trends in lending from 2005-06 to 2013-14.
Summary descriptive statistics and compounded annual growth rate on lending by public and private
sector commercial banks in Ethiopia for 12 years from 2002-03 to 2013-14 are presented in table 2
below.
42.2
%
40.3
%
49.4
%
38.4
%
37.6
%
56.3
%
49.4
%
42.8
%
47.3
%
62.8
%
57.1
%
61.4
%
57.8
%
59.7
%
50.6
%
59.8
%
59.4
%
38.0
% 45.2
%
49.2
%
43.9
%
29.5
%
32.3
%
27.1
%
0.0
%
0.0
%
0.0
%
1.8
%
3.0
%
5.7
%
5.4
%
8.0
%
8.8
%
7.6
%
10.6
%
11.5
%
0.0%
10.0%
20.0%
30.0%
40.0%
50.0%
60.0%
70.0%
Fig.1: Share in Total Lending by Public & Private CBs
Public CBs Old Private CBs New Private CBs
International Journal of Management Studies ISSN(Print) 2249-0302 ISSN (Online)2231-2528 http://www.researchersworld.com/ijms/
_______________________________________________- 74 - Vol-III, Issue-1, June 2016
Table 2: Summary Data on Commercial Bank Lending in Ethiopia (2002 to 2014)
Descriptive
Statistics
Public
Banks (2)
Old Private
Banks (6) *
New Private
Banks (10) **
All Private
Banks (16)
All Comm.
Banks (18)
MEAN 14,127.33 10,296.47 2,034.13 12,330.59 26,457.93
S.D. 11,583.39 5,036.70 2,178.89 6,996.97 18,182.14
C.V. 82.0% 48.9% 107.1% 56.7% 68.7%
CAGR 31.1% 18.3% 52.4% 22.1% 26.7%
Source: National Bank of Ethiopia Annual Reports
* operational prior to 2000; ** started functioning 2004 onwards
As presented in table 2 above, the mean value of the 2 public sector banks is 14,127.33, which is a shade
greater than the corresponding value for the 6 old private banks (10,296.47) and a lot larger than for the
10 new private banks (2,034.13). This indicates the dominance of the lending scenario by the public
sector commercial banks during the study period. The standard deviation values for public banks is
11,583.39 indicating higher variability compared to old private banks (5,036.70) and new private banks
(2,178.89). The co-efficient of variation points to greater variations in new private banks’ lending
(107.1%), compared with public sector banks’ lending (82%), and old private sector banks’ lending
commanded higher consistency among the groups with 48.9% coefficient of variation measure. The
compounded annual growth rate for the public sector banks is 31.1%, while that of old private banks is
18.3%, of new private banks is 52.4%. The CAGR for all private banks is 22.1% which is a shade
lower than that of public sector banks’ 31.1%, as well as the CAGR for all commercial banks (which is
at 26.7%). This analysis indicates: (a) greater lending power of public sector banks as substantiated by
mean values; (b) greater consistency in lending by old private sector banks as indicated by the
coefficient of variation values; and (c) higher compounded annual growth rate for new private sector
banks and for public sector banks as supported by CAGR measures.
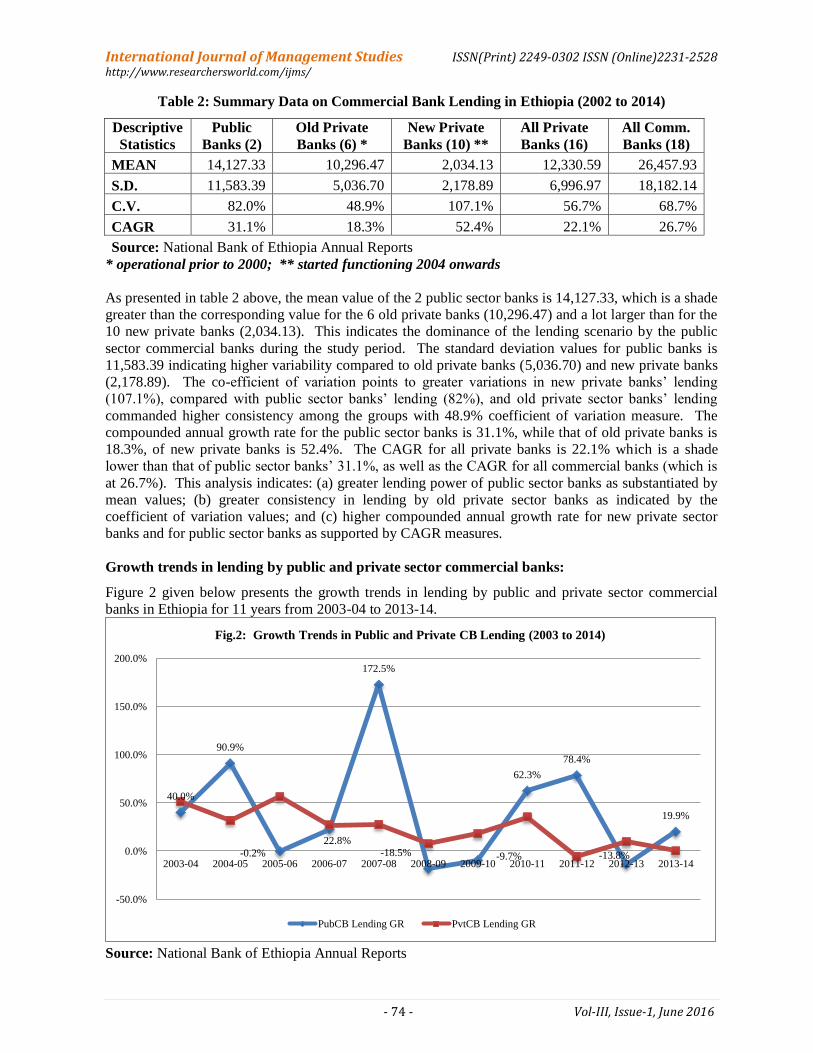
Growth trends in lending by public and private sector commercial banks:
Figure 2 given below presents the growth trends in lending by public and private sector commercial
banks in Ethiopia for 11 years from 2003-04 to 2013-14.
Source: National Bank of Ethiopia Annual Reports
40.0%
90.9%
-0.2%
22.8%
172.5%
-18.5% -9.7%
62.3%
78.4%
-13.8%
19.9%
-50.0%
0.0%
50.0%
100.0%
150.0%
200.0%
2003-04 2004-05 2005-06 2006-07 2007-08 2008-09 2009-10 2010-11 2011-12 2012-13 2013-14
Fig.2: Growth Trends in Public and Private CB Lending (2003 to 2014)
PubCB Lending GR PvtCB Lending GR

International Journal of Management Studies ISSN(Print) 2249-0302 ISSN (Online)2231-2528 http://www.researchersworld.com/ijms/
_______________________________________________- 75 - Vol-III, Issue-1, June 2016
Growth trends in lending by public and private sector commercial banks for 11 years from 2003-04 to
2013-14 are presented in figure 2 above. A careful look at the graphical presentation reveals that the
public sector banks had highly oscillating growth trends in lending in the reported period, as evidenced
by highs (172.5% in 2007-08 & 90.9% in 2004-05) and lows (-18.5% in 2008-09 and -13.8% in 2012-
13). As against this, the private sector commercial banks had a comparatively smoother growth trends
in the said 11-year period, of course showing a declining trend in general (from 56.4% in 2005-06 to -
5.4% in 2011-12).
Correlation analysis of lending by public and private sector commercial banks:
Table 3 below presents the summary of correlation analysis conducted on different variables.
Table 3: Correlation Analysis
Sl. Correlation between and Period of
Study
Correlation
Value Remarks
1
Advances disbursed
by all Commercial
Banks
Deposits mobilized
by all Commercial
Banks
1998 to
2014 0.9954
Very High
Positive
correlation
2
Growth rates in
Advances disbursed
by all commercial
banks
Growth rates in
Deposits mobilized
by all commercial
banks
1998 to
2014 0.6438
Positive
correlation
3
Total lending by
Public commercial
banks
Total lending by
Major Private
commercial banks
2002 to
2014 0.8498
Highly
positive
correlation
4
Total lending by
Public commercial
banks
Total lending by all
Private commercial
banks
2002 to
2014 0.9097
Highly
positive
correlation
5
Total lending by
Public commercial
banks
Total lending by all
commercial banks
2002 to
2014 0.9871
Very High
Positive
correlation
6
Total lending by
Private commercial
banks
Total lending by all
commercial banks
2002 to
2014 0.9644
Very High
Positive
correlation
7
Deposits mobilized
by all Commercial
Banks
Deposits mobilized
by Private
Commercial Banks
1992 to
2013 0.9930
Very High
Positive
correlation
Source: National Bank of Ethiopia Annual Reports
As can be observed from table 3 above, there is absolute positive correlation (0.9954) between advances
and deposits of all commercial banks in Ethiopia, as well as (i) between deposits mobilized by all
commercial banks and by private commercial banks (0.9930), (ii) between total advances of public
banks and of all commercial banks (0.9871), and (iii) between private banks’ advances and all
commercial banks’ advances (0.9644). Again there is very high positive correlation (0.9097) between
lending by public banks and by private banks, and highly positive correlation (0.8498) between lending
by public banks and by old private banks in Ethiopia. The correlation between growth rates of advances
and deposits of all commercial banks (0.6438) is also found to be significantly positive.
Borrower category-wise descriptive statistics and CAGR analysis:
Table 4 in the next page summarizes the descriptive statistics and compounded annual growth rate for
commercial bank advances disbursed during 2005 to 2014.

International Journal of Management Studies ISSN(Print) 2249-0302 ISSN (Online)2231-2528 http://www.researchersworld.com/ijms/
_______________________________________________- 76 - Vol-III, Issue-1, June 2016
Table 4: Descriptive Statistics & CAGR for Commercial Banks Advances Disbursed
(2005 to 2014)
Borrower category MEAN S.D. C.V. MIN MAX RANGE CAGR
Public Enterprises 6,273.70 5,755.25 92%
307.40 15,171.70 14,864.30 29.5%
Cooperatives 5,225.52 3,523.67 67%
1,231.40 12,116.30 10,884.90 25.0%
Private &
Individuals 21,561.35 10,400.79 48%
6,888.50 36,846.60 29,958.10 20.5%
Total 33,060.57 18,747.97 57% 9,433.00 59,519.20 50,086.20 22.7%
Source: National Bank of Ethiopia Annual Reports
Table 4 above presents the descriptive statistics and CAGR for Advances by all commercial banks from
2005 to 2014. As observed in the table, private & individual borrowers commanded high mean value
(21,561.35) and standard deviation (10,400.79) – way above the other borrower-categories. This
category (private & individual borrowers) showed higher consistency in borrowing (as evidenced by
lower coefficient of variation 48%), as against 92% for public enterprise borrowers. The compounded
annual growth rate is high for public enterprises (29.5%), while it is comparatively low for private &
individuals (20.5%). This analysis points to the domination of private and individual borrowers in the
commercial bank lending scenario in Ethiopia.
Analysis on Advances Performance w.r.t. Deposits and Total Assets:
Figure 3 below charts the proportion of advances in total assets, and in deposits mobilized by Ethiopian
commercial banks for 16 years from 1998-99 to 2013-14.
Source: National Bank of Ethiopia Annual Reports
Figure 3 in the previous page presents the proportion of advances in total assets, and in deposits
mobilized by Ethiopian commercial banks. Accordingly, the proportion of advances to deposits had
high (74%) in 1999-2000 and a low (46%) in 2011-12. It can be observed that the proportion of
advances to deposits showed a generally declining trend over the 16-year reporting period. As to the
proportion of advances in total assets of Ethiopian commercial banks showed similar pattern (almost
parallel to that of advances-deposits trend), with the high (56%) and the low (35%) falling exactly in the
same years. This parallel trend points to the dominance of deposits (as part of total assets, i.e. total
liabilities) in determining the level of advances in the country. Ethiopian commercial banks depended
52
%
56
%
55
%
53
%
48
%
42
%
38
%
38
%
40
%
38
%
43
%
40
%
37
%
35
%
41
%
39
%
68
%
74
%
71
%
67
%
58
%
52
%
48
%
49
%
51
%
50
% 58
%
53
%
49
%
46
% 55
%
51
%
0%
10%
20%
30%
40%
50%
60%
70%
80%
1 2 3 4 5 6 7 8 9 10 11 12 13 14 15 16
Fig.3: Advances Performance in Total Assets and Deposits mobilized by CBs
Prop. of Advances in Total Assets Prop. of Advances to Deposits
International Journal of Management Studies ISSN(Print) 2249-0302 ISSN (Online)2231-2528 http://www.researchersworld.com/ijms/
_______________________________________________- 77 - Vol-III, Issue-1, June 2016
mainly on deposits for creating their advances, which matches with the theory “loans create deposits;
deposits are children of loans”.
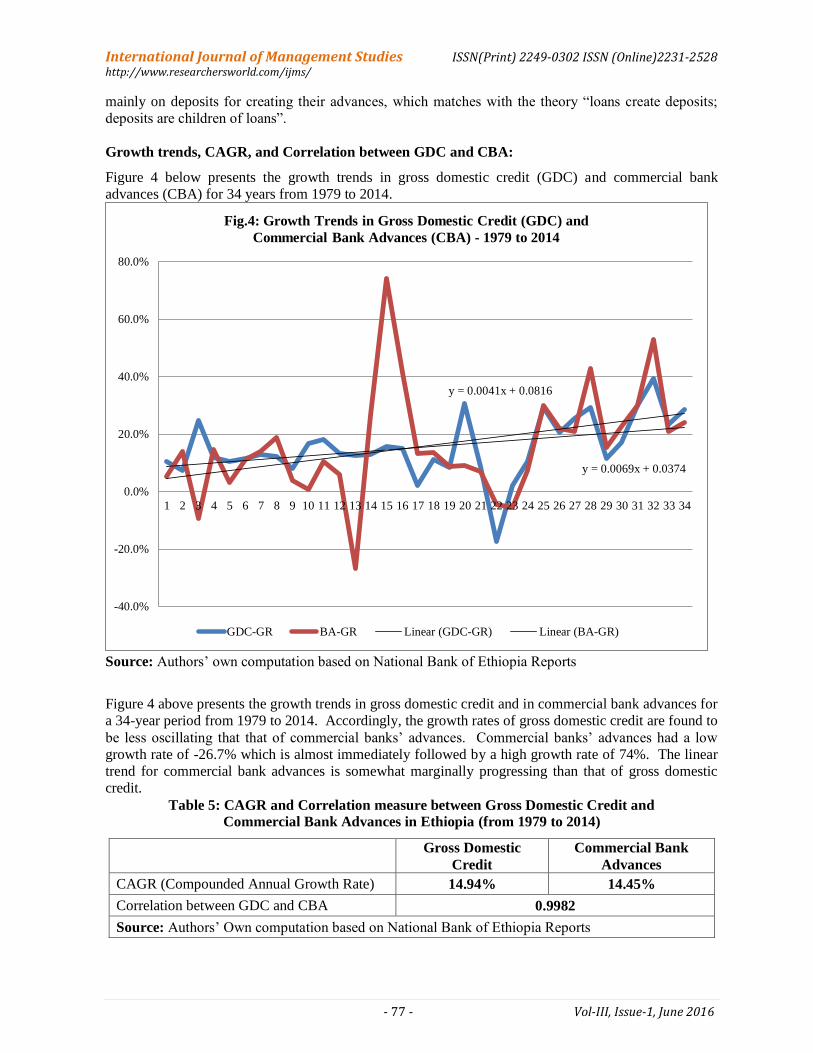
Growth trends, CAGR, and Correlation between GDC and CBA:
Figure 4 below presents the growth trends in gross domestic credit (GDC) and commercial bank
advances (CBA) for 34 years from 1979 to 2014.
Source: Authors’ own computation based on National Bank of Ethiopia Reports
Figure 4 above presents the growth trends in gross domestic credit and in commercial bank advances for
a 34-year period from 1979 to 2014. Accordingly, the growth rates of gross domestic credit are found to
be less oscillating that that of commercial banks’ advances. Commercial banks’ advances had a low
growth rate of -26.7% which is almost immediately followed by a high growth rate of 74%. The linear
trend for commercial bank advances is somewhat marginally progressing than that of gross domestic
credit.
Table 5: CAGR and Correlation measure between Gross Domestic Credit and
Commercial Bank Advances in Ethiopia (from 1979 to 2014)
Gross Domestic
Credit
Commercial Bank
Advances
CAGR (Compounded Annual Growth Rate) 14.94% 14.45%
Correlation between GDC and CBA 0.9982
Source: Authors’ Own computation based on National Bank of Ethiopia Reports
y = 0.0041x + 0.0816
y = 0.0069x + 0.0374
-40.0%
-20.0%
0.0%
20.0%
40.0%
60.0%
80.0%
1 2 3 4 5 6 7 8 9 10 11 12 13 14 15 16 17 18 19 20 21 22 23 24 25 26 27 28 29 30 31 32 33 34
Fig.4: Growth Trends in Gross Domestic Credit (GDC) and
Commercial Bank Advances (CBA) - 1979 to 2014
GDC-GR BA-GR Linear (GDC-GR) Linear (BA-GR)

International Journal of Management Studies ISSN(Print) 2249-0302 ISSN (Online)2231-2528 http://www.researchersworld.com/ijms/
_______________________________________________- 78 - Vol-III, Issue-1, June 2016
Table 5 above presented the compounded annual growth rate for gross domestic credit at 14.94%, and
for commercial bank advances at 14.45% - which have almost similar CAGR as such. This is further
supported by the correlation measure which stood at absolute positive value at 0.9982, thus indicating
perfect harmony between gross domestic credit and commercial bank advances. This analysis goes on
to substantiate that Ethiopian economy is in fact a bank-dominated economy.
Major Findings of the Study:
1. There is a paradigm shift in lending trends of public sector and of private sector commercial banks,
with the former garnering major share in lending in the recent years, while the latter had dominance
on the field in the earlier period. The lending trends are generally found to be somewhat oscillating
too.
2. In the 12-year period (from 2003 to 2014), public sector banks had highly oscillating growth trends
in lending as compared to that of private sector banks which was somewhat balanced though
gradually declining over time.
3. There is found to be high degree of positive correlation between advances and deposits of all
commercial banks, that of advances of public sector and of private sector banks, and that of deposits
of public and private sector commercial banks.
4. There is dominance of private and individual borrowers in the commercial bank lending scenario in
Ethiopia, with lending to public enterprises showing higher degree of variability.
5. The trend of proportion of advances in (i) total deposits, and (ii) total assets of commercial banks is
found be parallel, and indicates the supremacy of deposits in creating advances in the country.
6. The growth rates of gross domestic credit are found to be less oscillating that that of commercial
banks’ advances. Both gross domestic credit and commercial bank advances are found to be having
very similar (near) compounded annual growth rates, and absolute positive correlation between
them also points to the perfect harmony between the two.
Conclusion to the study:
This paper on commercial bank lending in Ethiopia attempted to analyze the trends in lending by public
sector and private sector banks; to evaluate the growth rates in advances as well as gross domestic
credit; and to correlate the deposits mobilized with the advances granted in the recent decade. This
study is fully secondary data based, from the official website and database of the central bank of the
country. It used, in addition to descriptive statistical tools, trend analysis, compounded annual growth
rates, as well as correlation measures for data analysis. Findings are presented in the form of summary
data tables, charts and graphs with appropriate explanations. Major findings of the study include:
mixed trends are found in total advances by public and private sector commercial banks – with public
banks dominating the lending scenario in the recent years; lending by private banks showed downward
trend since 2010; very high positive correlation existing between deposits mobilized and advances
disbursed by the Ethiopian banking industry, between public sector and private sector advances, and
between public sector and private sector deposits mobilized; a compounded annual growth rate of
22.7% is registered by all commercial banks in the recent decade; and there is perfect synchronization
between commercial bank advances and gross domestic credit in the country.
Significance of the Study:
This study is a kind of pioneer attempt, since there is no study of this magnitude on the lending scenario
of Ethiopian Banking industry. This study is believed to be highly significant for different stakeholders,
viz., the commercial banks in Ethiopia, the central bank (National Bank of Ethiopia), the business
public, as well as to the policymakers of the country. Based on the data available as of date, the study
tried to analyze the lending scenario of Ethiopia in multi-perspectives. This will be a useful effort for
the academics as well as banking and finance researchers.

International Journal of Management Studies ISSN(Print) 2249-0302 ISSN (Online)2231-2528 http://www.researchersworld.com/ijms/
_______________________________________________- 79 - Vol-III, Issue-1, June 2016
Limitations of the study and scope for further research:
The study had to consider limited datasets available, since the private banking started in Ethiopia only in
1994, and by 2000 only 6 private banks were in operation. As many as 10 private commercial banks
commenced their operations after 2004, till 2012. This restricted the extent of data availability for this
kind of research, especially this being highly secondary data based one. Future attempts may be made
by these and other researchers to elaborately analyze the lending scenario with larger datasets and in-
depth information. Currently there was some lacunae in databases maintained in the country – such as
non-availability of information on lending to various categories of borrowers like large, medium, small
and micro industries in the country.
References:
[1] Capgemini. (2014). Impact of Regulations on Bank Lending. Available at:
https://www.capgemini.com/resource-file-
access/resource/pdf/impact_of_regulations_on_bank_lending.pdf, accessed in Feb.2016.
[2] Charles P. Himmelberg and Donald P. Morgan. (n.d.) Is Bank Lending Special? Available at:
http://faculty.chicagobooth.edu/raghuram.rajan/research/papers/conf39b.pdf, accessed in
Feb.2016.
[3] E. Philip Davis and Haibin Zhu. (2004). Bank lending and commercial property cycles: some
cross-country evidence. BIS Working Papers No.150, Available at
http://www.bis.org/publ/work150.pdf, accessed in Feb.2016.
[4] Eustacius N. Betubiza and David J. Leatham. (1995). Factors affecting Commercial Bank Lending
to Agriculture. Journal of Agriculture and Applied Economics, Vol.27, Issue 1, July 1995, pp.112-
126. Available at: http://ageconsearch.umn.edu/bitstream/15326/1/27010112.pdf.
[5] Kannan Simhakutty & Dr.S.Sudalaimuthu. (2015). MSME Financing: Empirical comparison
between select emerging and developing economies, Empowering Micro, Small and Medium
Enterprises for Global Competitiveness, ISBN 9788182860285, T.R. Publications, Chennai,
pp.199-216
[6] Macro data available as annexures to Quarterly Bulletin. Available at www.nbe.gov.et.
[7] National Bank of Ethiopia Annual Reports. Available at www.nbe.gov.et.
[8] Olusanya, Samuel Olumuyiwa, Oyebo Afees Oluwatosin, and Ohadebere Emmanuel
Chukwuemeka. (2012). Determinants of Lending Behaviour of Commercial Banks: Evidence
from Nigeria, A co-integration analysis (1975-2010). ISOR Journal of Humanities and Social
Sciences, Vol.5, Issue 5, Nov-Dec.2012, pp.71-80. Available at: http://www.iosrjournals.org/iosr-
jhss/papers/Vol5-issue5/G0557180.pdf.
[9] Paul Ojeaga, Omosefe Odejimi, Joan Okhiku, and Daniel Ojeaga. (2013). Does Commercial Bank
Lending incite Growth? The impact of commercial bank lending on real sector growth in Nigeria.
Available at: http://emi.mvso.cz/EMI/2013-03/02%20Ojeaga/Ojeaga.pdf, accessed in Feb.2016.
[10] Proceedings of the National Conference on MSMEs (ICSSR sponsored), Pondicherry University,
ISBN , Feb. 2015.
[11] Quarterly bulletin of National Bank of Ethiopia, vol.32, Issue 4, available from Oct.2015 at
www.nbe.gov.et.
[12] William F. Bassett and Egon Zakrajsek. (2003). Recent Developments in Business Lending by
Commercial Banks. Federal Reserve Bulletin. Available at:
http://www.federalreserve.gov/pubs/bulletin/2003/1203lead.pdf, accessed in Feb.2016.
*****