Embed Size (px)
Citation preview

National and Texas Economic and Outlook
Dr. James P. GainesChief Economist
recenter.tamu.edu

THE CURRENT SITUATION
“The Future Just Ain’t What It Used to Be!”
Yogi Berra

National Economic Recovery still Going …
six years later!
Outlook still fairly bullish
3

Global• Europe, China, India, Russia and South America
all slowing or in recession
• Capital flight to U.S., especially U.S. government bond market, but also real estate, gold, other fixed assets
• Currency devaluations, officially or effectively, making dollar higher and our exports much lower
• Global energy market still unbalanced leading to sustained lower oil and gas prices 4
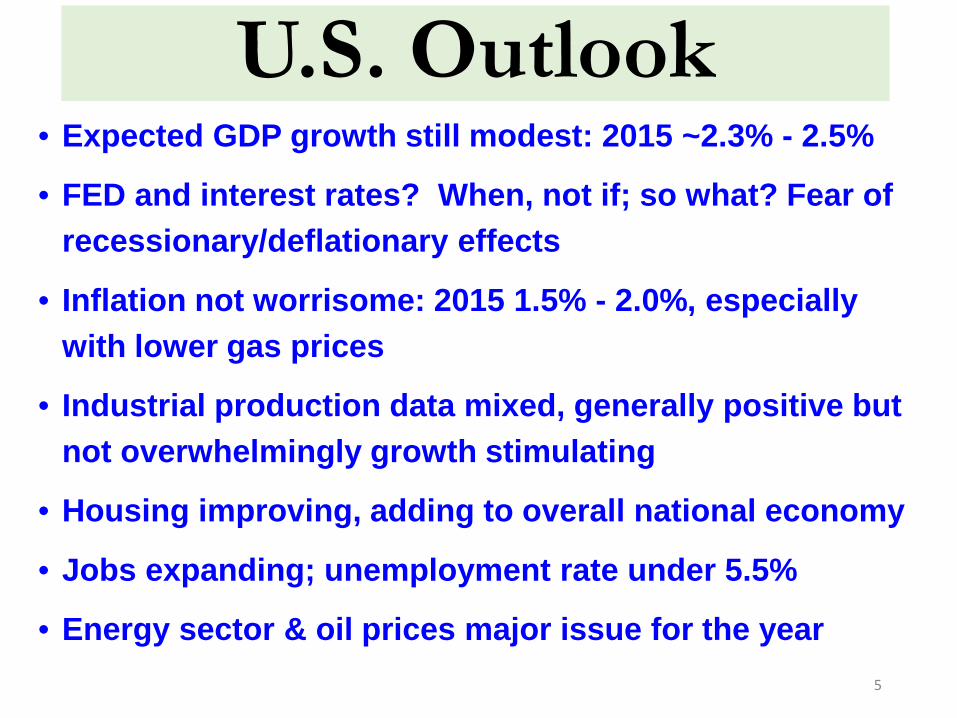
U.S. Outlook• Expected GDP growth still modest: 2015 ~2.3% - 2.5%
• FED and interest rates? When, not if; so what? Fear of recessionary/deflationary effects
• Inflation not worrisome: 2015 1.5% - 2.0%, especially with lower gas prices
• Industrial production data mixed, generally positive but not overwhelmingly growth stimulating
• Housing improving, adding to overall national economy
• Jobs expanding; unemployment rate under 5.5%
• Energy sector & oil prices major issue for the year5
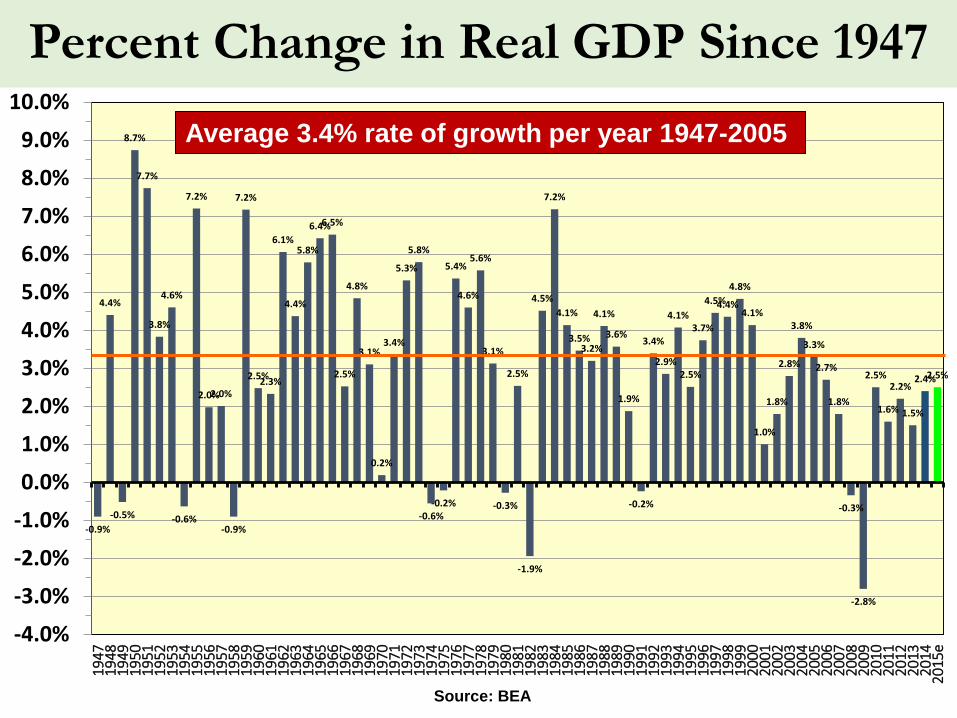
Percent Change in Real GDP Since 1947
-0.9%
4.4%
-0.5%
8.7%
7.7%
3.8%
4.6%
-0.6%
7.2%
2.0%2.0%
-0.9%
7.2%
2.5%2.3%
6.1%
4.4%
5.8%
6.4%6.5%
2.5%
4.8%
3.1%
0.2%
3.4%
5.3%
5.8%
-0.6%-0.2%
5.4%
4.6%
5.6%
3.1%
-0.3%
2.5%
-1.9%
4.5%
7.2%
4.1%
3.5%3.2%
4.1%
3.6%
1.9%
-0.2%
3.4%
2.9%
4.1%
2.5%
3.7%
4.5%4.4%
4.8%
4.1%
1.0%
1.8%
2.8%
3.8%
3.3%
2.7%
1.8%
-0.3%
-2.8%
2.5%
1.6%
2.2%
1.5%
2.4%2.5%
-4.0%
-3.0%
-2.0%
-1.0%
0.0%
1.0%
2.0%
3.0%
4.0%
5.0%
6.0%
7.0%
8.0%
9.0%
10.0%19
4719
4819
4919
5019
5119
5219
5319
5419
5519
5619
5719
5819
5919
6019
6119
6219
6319
6419
6519
6619
6719
6819
6919
7019
7119
7219
7319
7419
7519
7619
7719
7819
7919
8019
8119
8219
8319
8419
8519
8619
8719
8819
8919
9019
9119
9219
9319
9419
9519
9619
9719
9819
9920
0020
0120
0220
0320
0420
0520
0620
0720
0820
0920
1020
1120
1220
1320
1420
15e
Source: BEA
Average 3.4% rate of growth per year 1947-2005

U.S. Jobs Finally Recovered
109,527108,427108,802
110,935
114,398
117,407119,836
122,951
126,157
129,240
132,019132,074130,628130,318
131,749134,005
136,398137,936137,170
131,233130,275
131,842134,104
136,393
139,042
90,000
100,000
110,000
120,000
130,000
140,000
150,000
1990
1991
1992
1993
1994
1995
1996
1997
1998
1999
2000
2001
2002
2003
2004
2005
2006
2007
2008
2009
2010
2011
2012
2013
2014
Thou
sand
s of
Job
s
7Sources: BLS, Real Estate Center at Texas A&M University
2013 + 1.7%2014 +2.0%1999-2014 +7.6%!!
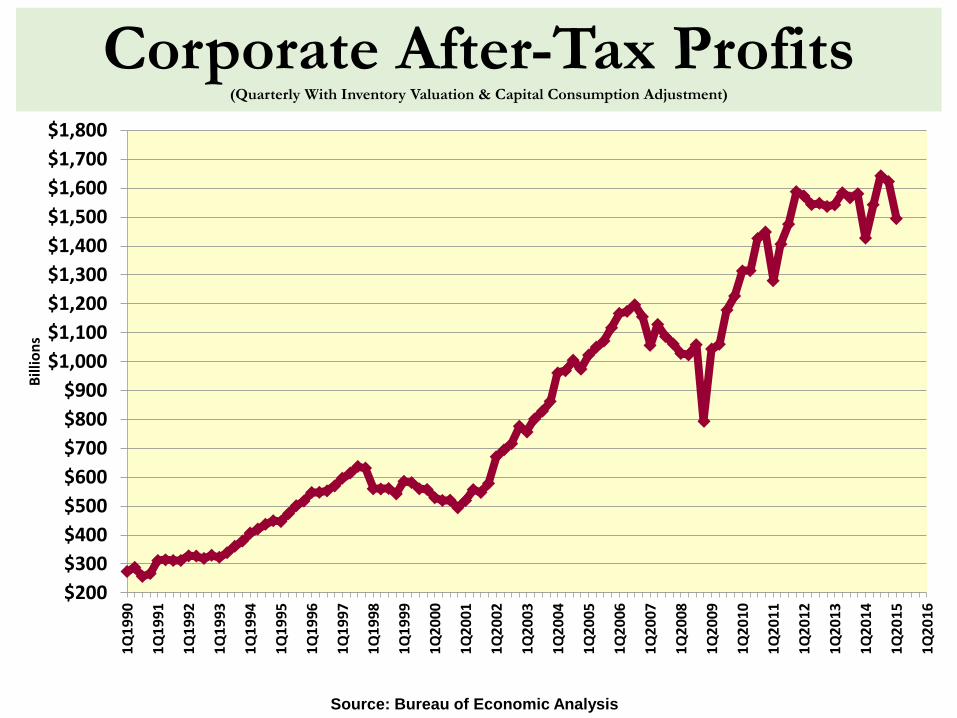
Corporate After-Tax Profits(Quarterly With Inventory Valuation & Capital Consumption Adjustment)
$200$300$400$500$600$700$800$900
$1,000$1,100$1,200$1,300$1,400$1,500$1,600$1,700$1,800
1Q19
90
1Q19
91
1Q19
92
1Q19
93
1Q19
94
1Q19
95
1Q19
96
1Q19
97
1Q19
98
1Q19
99
1Q20
00
1Q20
01
1Q20
02
1Q20
03
1Q20
04
1Q20
05
1Q20
06
1Q20
07
1Q20
08
1Q20
09
1Q20
10
1Q20
11
1Q20
12
1Q20
13
1Q20
14
1Q20
15
1Q20
16
Billi
ons
Source: Bureau of Economic Analysis

Inflation Remains Relatively Low
-4.0%
-2.0%
0.0%
2.0%
4.0%
6.0%
8.0%
10.0%
12.0%
14.0%
16.0%Ja
n-71
Jan-
72Ja
n-73
Jan-
74Ja
n-75
Jan-
76Ja
n-77
Jan-
78Ja
n-79
Jan-
80Ja
n-81
Jan-
82Ja
n-83
Jan-
84Ja
n-85
Jan-
86Ja
n-87
Jan-
88Ja
n-89
Jan-
90Ja
n-91
Jan-
92Ja
n-93
Jan-
94Ja
n-95
Jan-
96Ja
n-97
Jan-
98Ja
n-99
Jan-
00Ja
n-01
Jan-
02Ja
n-03
Jan-
04Ja
n-05
Jan-
06Ja
n-07
Jan-
08Ja
n-09
Jan-
10Ja
n-11
Jan-
12Ja
n-13
Jan-
14Ja
n-15
9Source: BLS, Y/Y % change in index
Consumer Price Index for All Urban Consumers: All Items

Source: The Conference Board (1985=100); Haver Analytics
Consumer Confidence Index
102030405060708090
100110120130140
Jan-
07
Jul-0
7
Jan-
08
Jul-0
8
Jan-
09
Jul-0
9
Jan-
10
Jul-1
0
Jan-
11
Jul-1
1
Jan-
12
Jul-1
2
Jan-
13
Jul-1
3
Jan-
14
Jul-1
4
Jan-
15
Jul-1
5
Jan-
16
Recession
10
U.S.
Expansion
Texas

Household Net Worth Has Rebounded Well
$0
$10,000
$20,000
$30,000
$40,000
$50,000
$60,000
$70,000
$80,000
$90,000
1Q19
801Q
1981
1Q19
821Q
1983
1Q19
841Q
1985
1Q19
861Q
1987
1Q19
881Q
1989
1Q19
901Q
1991
1Q19
921Q
1993
1Q19
941Q
1995
1Q19
961Q
1997
1Q19
981Q
1999
1Q20
001Q
2001
1Q20
021Q
2003
1Q20
041Q
2005
1Q20
061Q
2007
1Q20
081Q
2009
1Q20
101Q
2011
1Q20
121Q
2013
1Q20
14
Bill
ions
Source: Federal Reserve St. Louis

Source: Federal Reserve Board
Debt Service Payments as a Percent of Disposable Personal Income
Low
9.0
9.5
10.0
10.5
11.0
11.5
12.0
12.5
13.0
13.5
14.0
1Q19
801Q
1981
1Q19
821Q
1983
1Q19
841Q
1985
1Q19
861Q
1987
1Q19
881Q
1989
1Q19
901Q
1991
1Q19
921Q
1993
1Q19
941Q
1995
1Q19
961Q
1997
1Q19
981Q
1999
1Q20
001Q
2001
1Q20
021Q
2003
1Q20
041Q
2005
1Q20
061Q
2007
1Q20
081Q
2009
1Q20
101Q
2011
1Q20
121Q
2013
1Q20
141Q
2015
Perc
ent o
f Dis
posa
ble
Inco
me
12

Texas Has Been the “Bell weather” State for the Past Several Years, But
There Are Clouds on the Horizon
13

Texas Outlook
14
Energy, High tech and business services fueling job growth that is expected to stay relatively strong
Downside risks:o national (global) recession, even then Texas may
do better than most other states IF energy is strong
o Oil prices and energy sector Population expansion continues to fuel growth Local Growth Issues becoming more pressing,
causing greater strain on state and local infrastructure and resources

Source: The Conference Board (1985=100); Haver Analytics
Texas Leading Economic Index
80.0
90.0
100.0
110.0
120.0
130.0
140.0Ja
n-81
Jul-8
1Ja
n-82
Jul-8
2Ja
n-83
Jul-8
3Ja
n-84
Jul-8
4Ja
n-85
Jul-8
5Ja
n-86
Jul-8
6Ja
n-87
Jul-8
7Ja
n-88
Jul-8
8Ja
n-89
Jul-8
9Ja
n-90
Jul-9
0Ja
n-91
Jul-9
1Ja
n-92
Jul-9
2Ja
n-93
Jul-9
3Ja
n-94
Jul-9
4Ja
n-95
Jul-9
5Ja
n-96
Jul-9
6Ja
n-97
Jul-9
7Ja
n-98
Jul-9
8Ja
n-99
Jul-9
9Ja
n-00
Jul-0
0Ja
n-01
Jul-0
1Ja
n-02
Jul-0
2Ja
n-03
Jul-0
3Ja
n-04
Jul-0
4Ja
n-05
Jul-0
5Ja
n-06
Jul-0
6Ja
n-07
Jul-0
7Ja
n-08
Jul-0
8Ja
n-09
Jul-0
9Ja
n-10
Jul-1
0Ja
n-11
Jul-1
1Ja
n-12
Jul-1
2Ja
n-13
Jul-1
3Ja
n-14
Jul-1
4Ja
n-15
Jul-1
5
15

Texas Annual Jobs
7,098,9007,177,4007,272,9007,485,500
7,755,6008,027,300
8,260,200
8,610,9008,940,500
9,157,3009,428,9009,510,9009,412,7009,366,9009,494,100
9,737,50010,063,600
10,393,30010,607,300
10,305,60010,338,700
10,569,70010,880,300
11,206,90011,550,200
11,808,900
5,000,000
6,000,000
7,000,000
8,000,000
9,000,000
10,000,000
11,000,000
12,000,000
13,000,000
1990
1991
1992
1993
1994
1995
1996
1997
1998
1999
2000
2001
2002
2003
2004
2005
2006
2007
2008
2009
2010
2011
2012
2013
2014
Jul-1
5
Sources: Texas Workforce Commission, Real Estate Center at Texas A&M University
2013 +3.0%2014 +3.1%July 2015 +2.5% Y/Y, 284,000 jobs;+183,500 jobs since January
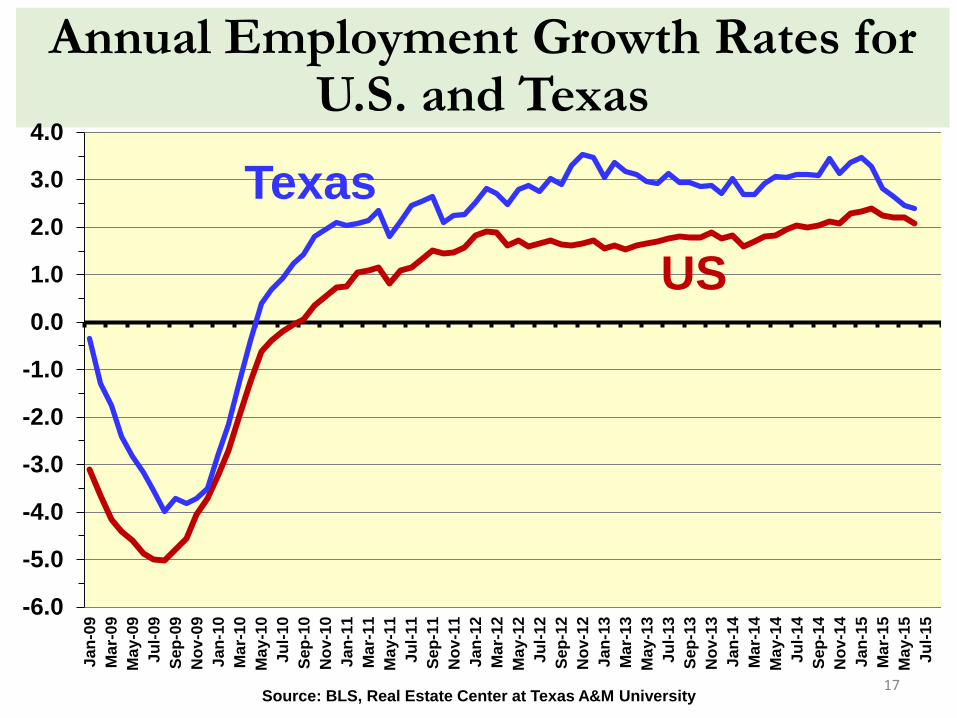
Annual Employment Growth Rates for U.S. and Texas
-6.0
-5.0
-4.0
-3.0
-2.0
-1.0
0.0
1.0
2.0
3.0
4.0
Jan-
09M
ar-0
9M
ay-0
9Ju
l-09
Sep-
09N
ov-0
9Ja
n-10
Mar
-10
May
-10
Jul-1
0Se
p-10
Nov
-10
Jan-
11M
ar-1
1M
ay-1
1Ju
l-11
Sep-
11N
ov-1
1Ja
n-12
Mar
-12
May
-12
Jul-1
2Se
p-12
Nov
-12
Jan-
13M
ar-1
3M
ay-1
3Ju
l-13
Sep-
13N
ov-1
3Ja
n-14
Mar
-14
May
-14
Jul-1
4Se
p-14
Nov
-14
Jan-
15M
ar-1
5M
ay-1
5Ju
l-15
17Source: BLS, Real Estate Center at Texas A&M University
Texas
US
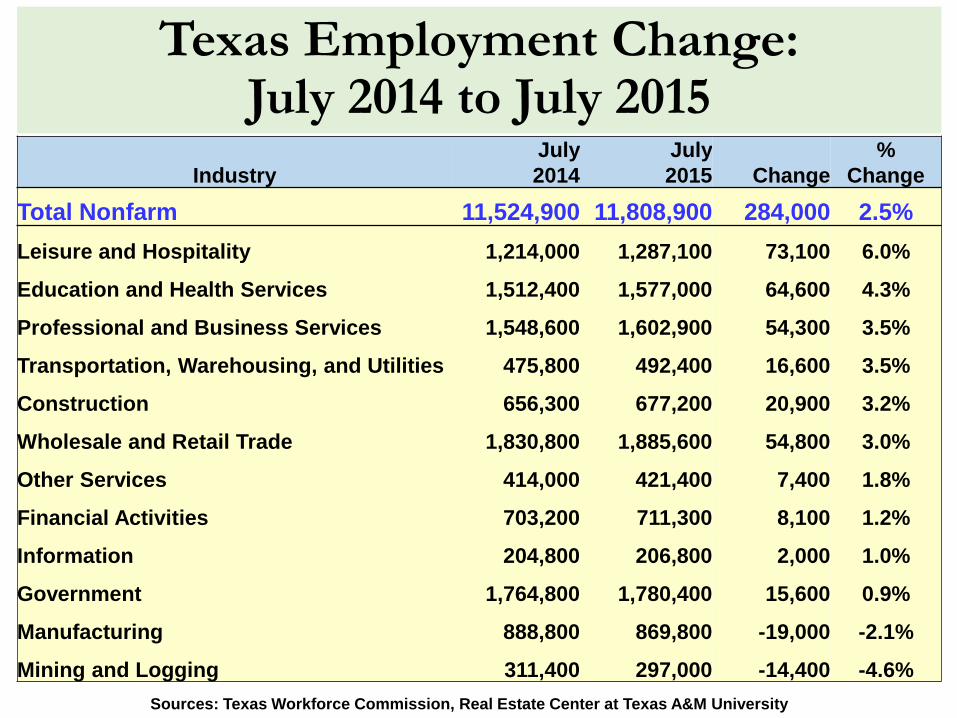
Texas Employment Change: July 2014 to July 2015
IndustryJuly 2014
July 2015 Change
% Change
Total Nonfarm 11,524,900 11,808,900 284,000 2.5%Leisure and Hospitality 1,214,000 1,287,100 73,100 6.0%
Education and Health Services 1,512,400 1,577,000 64,600 4.3%
Professional and Business Services 1,548,600 1,602,900 54,300 3.5%
Transportation, Warehousing, and Utilities 475,800 492,400 16,600 3.5%
Construction 656,300 677,200 20,900 3.2%
Wholesale and Retail Trade 1,830,800 1,885,600 54,800 3.0%
Other Services 414,000 421,400 7,400 1.8%
Financial Activities 703,200 711,300 8,100 1.2%
Information 204,800 206,800 2,000 1.0%
Government 1,764,800 1,780,400 15,600 0.9%
Manufacturing 888,800 869,800 -19,000 -2.1%
Mining and Logging 311,400 297,000 -14,400 -4.6%Sources: Texas Workforce Commission, Real Estate Center at Texas A&M University

Energy Summary• Oil Prices may not have bottomed yet:
• Global oil production increased
• Global oil demand not rapidly increasing even with rapidly-falling prices
• Significant cut back in upstream capital spending on E&P, i.e., fewer wells drilled, but production increases
• Cuts in energy employment probably not over
• Hedges run out this Fall for 2015; futures prices converging to current price
• Growing number of “DUCs” bode ill for future production shortages, e.g., if 4,000 @ 300bls/day = 1.2 million bls/day
• Increased geo-political-military volatility among oil producing nations that need (require) $95-$100+ oil price
19

Active Texas Rig Count & Price of WTI
20Source: Baker Hughes; EIA; Haver Analytics
WTI $/bl (right)
$10$20$30$40$50$60$70$80$90$100$110$120$130$140$150$160
0
100
200
300
400
500
600
700
800
900
1,000
1,100
1/7/
2000
3/31
/200
06/
23/2
000
9/15
/200
012
/8/2
000
3/2/
2001
5/25
/200
18/
17/2
001
11/9
/200
12/
1/20
024/
26/2
002
7/19
/200
210
/11/
2002
1/3/
2003
3/28
/200
36/
20/2
003
9/12
/200
312
/5/2
003
2/27
/200
45/
21/2
004
8/13
/200
411
/5/2
004
1/28
/200
54/
22/2
005
7/15
/200
510
/7/2
005
12/3
0/20
053/
24/2
006
6/16
/200
69/
8/20
0612
/1/2
006
2/23
/200
75/
18/2
007
8/10
/200
711
/2/2
007
1/25
/200
84/
18/2
008
7/11
/200
810
/3/2
008
12/2
6/20
083/
20/2
009
6/12
/200
99/
4/20
0911
/25/
2009
2/19
/201
05/
14/2
010
8/6/
2010
10/2
9/20
101/
21/2
011
4/15
/201
17/
8/20
119/
30/2
011
12/2
2/20
113/
16/2
012
6/8/
2012
8/31
/201
211
/21/
2012
2/15
/201
35/
10/2
013
8/2/
2013
10/2
5/20
131/
17/2
014
4/11
/201
47/
3/20
149/
26/2
014
12/1
9/20
143/
13/2
015
6/5/
2015
Rigs (left)
WTI $/bl (right)
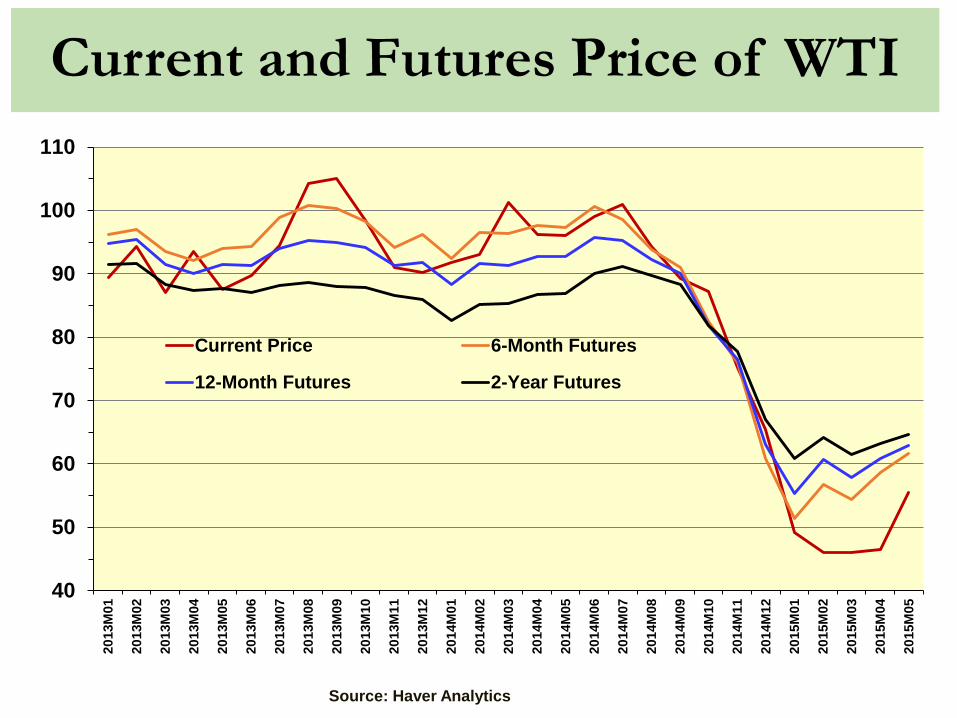
Current and Futures Price of WTI
40
50
60
70
80
90
100
110
2013
M01
2013
M02
2013
M03
2013
M04
2013
M05
2013
M06
2013
M07
2013
M08
2013
M09
2013
M10
2013
M11
2013
M12
2014
M01
2014
M02
2014
M03
2014
M04
2014
M05
2014
M06
2014
M07
2014
M08
2014
M09
2014
M10
2014
M11
2014
M12
2015
M01
2015
M02
2015
M03
2015
M04
2015
M05
Current Price 6-Month Futures
12-Month Futures 2-Year Futures
Source: Haver Analytics

Macro Housing Issues• Demographics: growing, shifting• Affordability: workforce priced out of
ownership• Capital: more equity• Infrastructure: transportation, education,
utilities• Development: Design, Density, Resources and
Processes• Regulatory: lending; environmental; land use
• Federal• State• Local Growth Controls/Initiatives
23
62.0
63.0
64.0
65.0
66.0
67.0
68.0
69.0
70.02Q
1971
2Q19
722Q
1973
2Q19
742Q
1975
2Q19
762Q
1977
2Q19
782Q
1979
2Q19
802Q
1981
2Q19
822Q
1983
2Q19
842Q
1985
2Q19
862Q
1987
2Q19
882Q
1989
2Q19
902Q
1991
2Q19
922Q
1993
2Q19
942Q
1995
2Q19
962Q
1997
2Q19
982Q
1999
2Q20
002Q
2001
2Q20
022Q
2003
2Q20
042Q
2005
2Q20
062Q
2007
2Q20
082Q
2009
2Q20
102Q
2011
2Q20
122Q
2013
2Q20
14
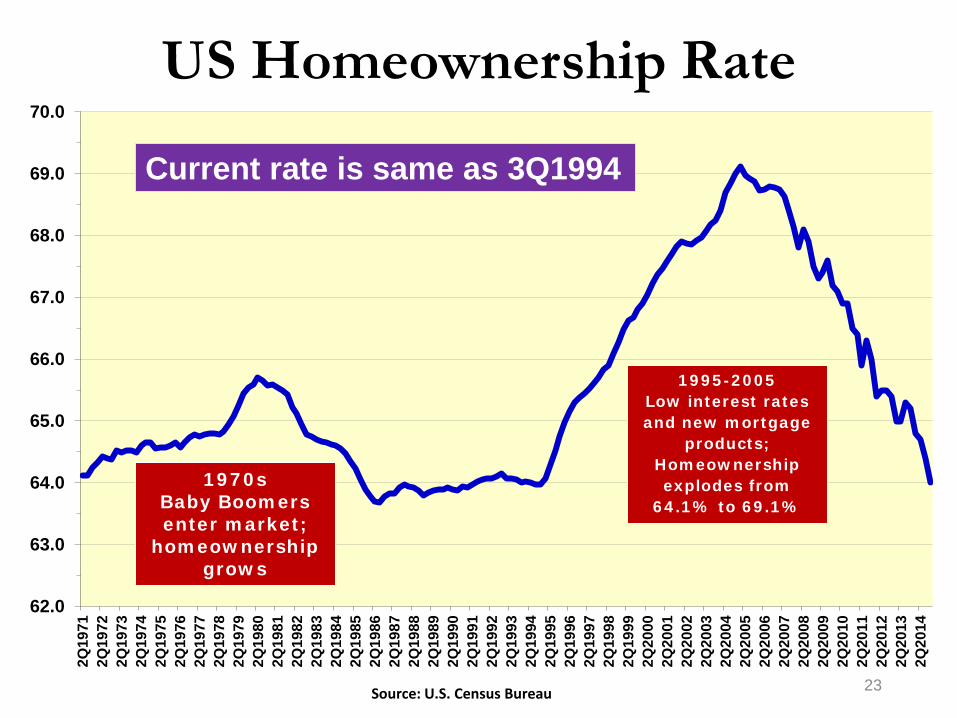
US Homeownership Rate
Source: U.S. Census Bureau
1970sBaby Boomers enter market;
homeownership grows
1995-2005Low interest rates and new mortgage
products; Homeownership explodes from
64.1% to 69.1%
(Percent)
Current rate is same as 3Q1994

Major Demographic Trends & Changing Housing Preferences
Aging population• Generational changes• Lifestyle & life cycle: Gen Y vs. Boomers
Increasing racial/ethnic diversity & cultural shifts
Economic Shift: income & wealth gap • Educated and less well educated• Age• Race & Ethnicity
Urban Concentration - urban areas24

Average Age of Major Life Events
25Source: U.S. Department of Labor, U.S. Department of Commerce and Wells Fargo Securities, LLC
First Marriage, Males: 28.6 YearsFirst Marriage, Females: 26.6 YearsFirst Child: 26.0 Years
~26
~23.5
~23
28.6
26.626.0

Projected Population Change, Texas Counties, 2010-2050
26Source: Texas State Data Center 2012 Population Projections . 2000-2010 Migration Scenario
-6,200 - 0
1 - 2,000
2,001 - 10,000
10,001 - 100,000
100,001 - 1,000,000
1,000,001 -3,480,000

Texas Population 1910-2050
3,896,542
11,196,730
25,145,56127,695,284
37,155,084
54,369,297
0
10,000,000
20,000,000
30,000,000
40,000,000
50,000,000
60,000,000
1910 1920 1930 1940 1950 1960 1970 1980 1990 2000 2010 2015 2020 2025 2030 2035 2040 2045 2050
27
From 1970 to 2010 (40 years), Texas added 13.9 million people –an average rate of 349,000 per year
From 2010 to 2050 (40 years), Texas will add another 30 million people – an average rate of about 750,000 per year
Sources: U.S. Census Bureau, Texas State Demographer 2014 Projections (2000-2010 Scenario)

Overall Growth and Change in State Population 2010-2050
Texas D-FW Houston Austin San Antonio
Population Population% of
State Total Population
% of State Total Population
% of State Total Population
% of State Total
2010 25,145,561 6,426,214 25.3% 5,920,416 23.5% 1,716,289 6.8% 2,142,508 8.5%
2020 30,541,978 7,920,671 25.8% 7,413,214 24.3% 2,306,857 7.6% 2,635,183 8.6%
2030 37,155,084 9,970,678 26.8% 9,278,789 25.0% 3,035,547 8.2% 3,182,644 8.6%
2040 44,955,896 12,728,992 28.4% 11,519,566 25.6% 3,960,317 8.9% 3,735,981 8.3%
2050 54,369,297 16,367,293 30.4% 14,221,267 26.1% 5,176,940 9.7% 4,013,515 7.7%Number Increase 29,223,736 9,941,079 34.6% 8,300,851 28.2% 3,460,651 12.0% 2,151,724 7.0%Percent Increase 116.2% 154.7% 140.2% 201.6% 100.4%
28Sources: U. S. Census; Texas State Demographer 2014 Projections (2000-2010 Scenario)
82% of total increase will go to the Major MSAs

Biggest Obstacles to Homeownership
All adults 18-34 year-olds only
Saving enough for a down payment 55% 58%
Not having a stable job 36% 43%
Having a poor credit history 35% 33%
Qualifying for a mortgage 32% 29%
Unable to pay off existing debt 26% 30%
Rising home prices 22% 23%
Rising mortgage rates 15% 18%
Limited inventory 5% 5%
Among renters who wish to buy a home right now. Respondents could choose multiple options. Survey conducted November 2013. Trulia Trends, December 2013.

Gen Y Housing OutlookGen Y
• Emerging Adults• Plugged in• Social• Educated• Outspoken• More liberal• Multicultural• High performance• High expectations• Marry later – buy later• Fewer children, later
30
Gen Y Housing• Seen the housing collapse• Currently 51% rent• 80+% eventually want to buy• First-time buyers mostly with
financial constraints to buying• Jobs and student debt = less
savings for down payment• First-time buyers <30% vs.
historic 40%• “Gen Rent”
Sources: M. Leanne Lachman and Deborah L. Brett, “Generation Y: America's New Housing Wave,” Urban Land, February 2011, FNMA National Housing Survey; Pew Research Group; Real Estate Center at Texas A&M University

Number of HHs by Age Group
8,000
8,500
9,000
9,500
10,000
10,500
11,000
11,50019
95
1996
1997
1998
1999
2000
2001
2002
2003
2004
2005
2006
2007
2008
2009
2010
2011
2012
2013
2014
Thou
sand
s
30-34 25-29
Source: US Census HVS/Haver Analytics; Real Estate Center at Texas A&M University

Number of HHs: Head of HH 35-44
20,000
20,500
21,000
21,500
22,000
22,500
23,000
23,500
24,000
24,50019
95
1996
1997
1998
1999
2000
2001
2002
2003
2004
2005
2006
2007
2008
2009
2010
2011
2012
2013
2014
Thou
sand
s
Source: US Census HVS/Haver Analytics; Real Estate Center at Texas A&M University

Household Formations and SF Starts
0
200
400
600
800
1,000
1,200
1,400
1,600
1,800
2,000
2000 2001 2002 2003 2004 2005 2006 2007 2008 2009 2010 2011 2012 2013 2014 2015
Thou
sand
s
HH Formations^ SF Starts*
^ March-to-March Change CPS *NAHB projected 2015Source: US Census Bureau; NAHB; Real Estate Center at Texas A&M University

New SF Home Starts
1,012970964
779844
899
811813
1,151
1,309
1,132
888892
1,162
1,4511,433
1,194
852
705663
1,0671,0841,072
1,1791,146
1,081
1,003
895840
1,030
1,126
1,198
1,076
1,1611,134
1,2711,303
1,2311,273
1,359
1,499
1,610
1,716
1,465
1,046
622
445471431
535
618648
726
935
200300400500600700800900
1,0001,1001,2001,3001,4001,5001,6001,7001,800
1963
1964
1965
1966
1967
1968
1969
1970
1971
1972
1973
1974
1975
1976
1977
1978
1979
1980
1981
1982
1983
1984
1985
1986
1987
1988
1989
1990
1991
1992
1993
1994
1995
1996
1997
1998
1999
2000
2001
2002
2003
2004
2005
2006
2007
2008
2009
2010
2011
2012
2013
2014
2015
2016
*2015 & 2016 NAHB projections Apr 2015Source: US Census Bureau; NAHB; Real Estate Center at Texas A&M University
1963-2002 average per year (1.06 million)
(000s SAAR)

Texas Household Formations and SF Starts
0
50,000
100,000
150,000
200,000
250,000
1990
1991
1992
1993
1994
1995
1996
1997
1998
1999
2000
2001
2002
2003
2004
2005
2006
2007
2008
2009
2010
2011
2012
2013
2014
HH Formations SF Starts
Source: Federal Reserve Bank St. Louis; US Census Bureau; NAHB; Real Estate Center at Texas A&M University

Number of Texas Households Added Annually
209,633
196,204
139,779131,160
117,262112,024
32,833
52,105
105,718
44,952
116,063
137,000
108,00098,000
162,000
142,000139,000140,000145,886
134,468
93,985
79,27868,150
156,086
187,242
131,293134,634
178,227
105,689
210,726
111,706120,589
139,894
171,438
0
50,000
100,000
150,000
200,000
250,00019
8119
8219
8319
8419
8519
8619
8719
8819
8919
9019
9119
9219
9319
9419
9519
9619
9719
9819
9920
0020
0120
0220
0320
0420
0520
0620
0720
0820
0920
1020
1120
1220
1320
14
36Sources: U.S. Census Bureau; Real Estate Center at Texas A&M
Average number of households added annually = 126,500
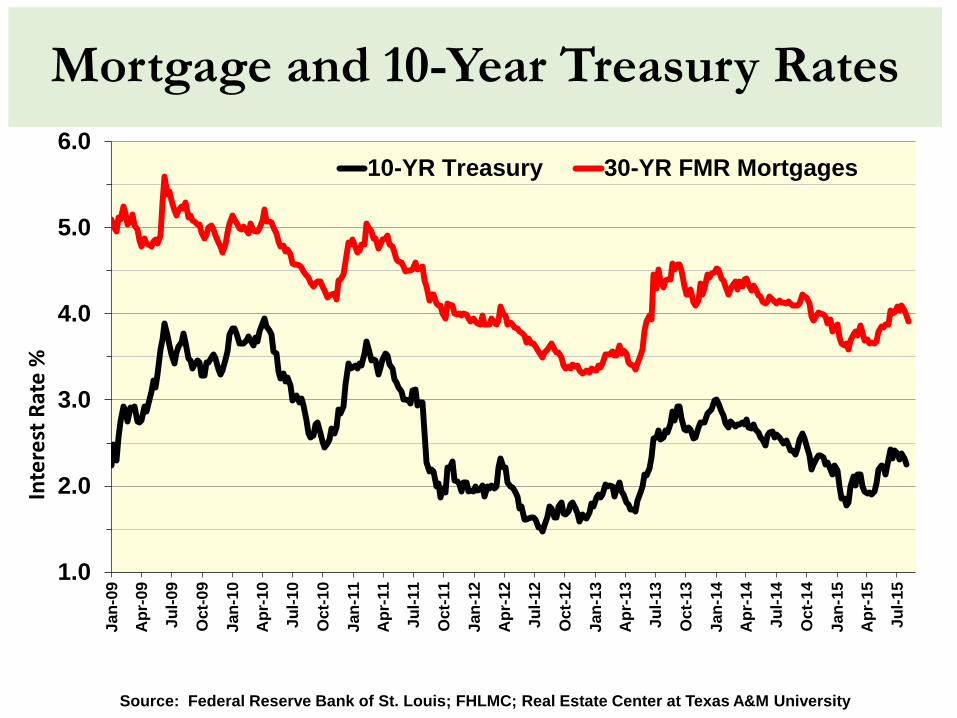
Mortgage and 10-Year Treasury Rates
1.0
2.0
3.0
4.0
5.0
6.0Ja
n-09
Apr
-09
Jul-0
9
Oct
-09
Jan-
10
Apr
-10
Jul-1
0
Oct
-10
Jan-
11
Apr
-11
Jul-1
1
Oct
-11
Jan-
12
Apr
-12
Jul-1
2
Oct
-12
Jan-
13
Apr
-13
Jul-1
3
Oct
-13
Jan-
14
Apr
-14
Jul-1
4
Oct
-14
Jan-
15
Apr
-15
Jul-1
5
Inte
rest
Rat
e %
10-YR Treasury 30-YR FMR Mortgages
Source: Federal Reserve Bank of St. Louis; FHLMC; Real Estate Center at Texas A&M University

38
0
200
400
600
800
1,000
1,200
1,400
1,600
0
1,000
2,000
3,000
4,000
5,000
6,000
7,000
8,000Ja
n-00
Jul-0
0Ja
n-01
Jul-0
1Ja
n-02
Jul-0
2Ja
n-03
Jul-0
3Ja
n-04
Jul-0
4Ja
n-05
Jul-0
5Ja
n-06
Jul-0
6Ja
n-07
Jul-0
7Ja
n-08
Jul-0
8Ja
n-09
Jul-0
9Ja
n-10
Jul-1
0Ja
n-11
Jul-1
1Ja
n-12
Jul-1
2Ja
n-13
Jul-1
3Ja
n-14
Jul-1
4Ja
n-15
Jul-1
5
Sources: US Census Bureau , NAR, SAAR
New and Existing SF Home Sales U.S.
Existing SF Home Sales(left axis)
New Home Sales(right axis)
New Home Sales 000sExisting Home Sales 000s

Source: Real Estate Center at Texas A&M University
Annual Texas Home Sales
109,755
90,79881,105
69,279
86,28791,340
89,40582,86787,218
92,37089,848
100,04799,619107,107
116,604122,134121,823
138,123146,395
170,638
184,056188,738
196,401201,528
216,147
241,020
266,842
292,805
275,584
232,381
213,334203,637205,786
238,060
276,361284,479
151,904
50,000
70,000
90,000
110,000
130,000
150,000
170,000
190,000
210,000
230,000
250,000
270,000
290,000
310,00019
7919
8019
8119
8219
8319
8419
8519
8619
8719
8819
8919
9019
9119
9219
9319
9419
9519
9619
9719
9819
9920
0020
0120
0220
0320
0420
0520
0620
0720
0820
0920
1020
1120
1220
1320
141H
2015
39
2014 up 5%Second best year ever!
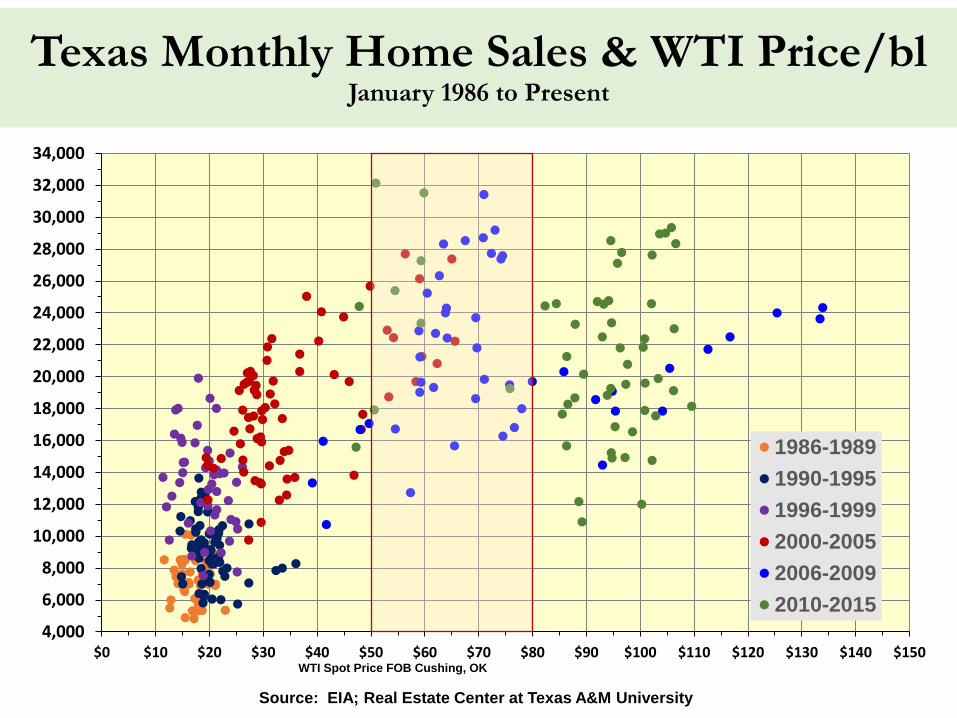
Texas Monthly Home Sales & WTI Price/blJanuary 1986 to Present
4,000
6,000
8,000
10,000
12,000
14,000
16,000
18,000
20,000
22,000
24,000
26,000
28,000
30,000
32,000
34,000
$0 $10 $20 $30 $40 $50 $60 $70 $80 $90 $100 $110 $120 $130 $140 $150
1986-19891990-19951996-19992000-20052006-20092010-2015
Source: EIA; Real Estate Center at Texas A&M University
WTI Spot Price FOB Cushing, OK

Texas Median Home Prices
68,50068,10071,200
75,20078,20080,00081,60086,400
90,60096,200
100,900
112,100119,400
124,500127,700130,100
136,800143,100
147,300146,900145,800147,600148,800
158,000
172,300
183,700
194,000
$50,000$60,000$70,000$80,000$90,000
$100,000$110,000$120,000$130,000$140,000$150,000$160,000$170,000$180,000$190,000$200,000$210,000
1989
1990
1991
1992
1993
1994
1995
1996
1997
1998
1999
2000
2001
2002
2003
2004
2005
2006
2007
2008
2009
2010
2011
2012
2013
2014
1H20
15
Source: Real Estate Center at Texas A&M University 41

Texas Median Price & WTI Price/bl. Monthly January 1990 to Current
$50,000
$70,000
$90,000
$110,000
$130,000
$150,000
$170,000
$190,000
$210,000
$230,000
$0 $10 $20 $30 $40 $50 $60 $70 $80 $90 $100 $110 $120 $130 $140 $150
90-9495-9900-0405-0910-1415-19
Source: Avg. Monthly WTI Spot Price FOB Cushing, OK; Real Estate Center at Texas A&M University
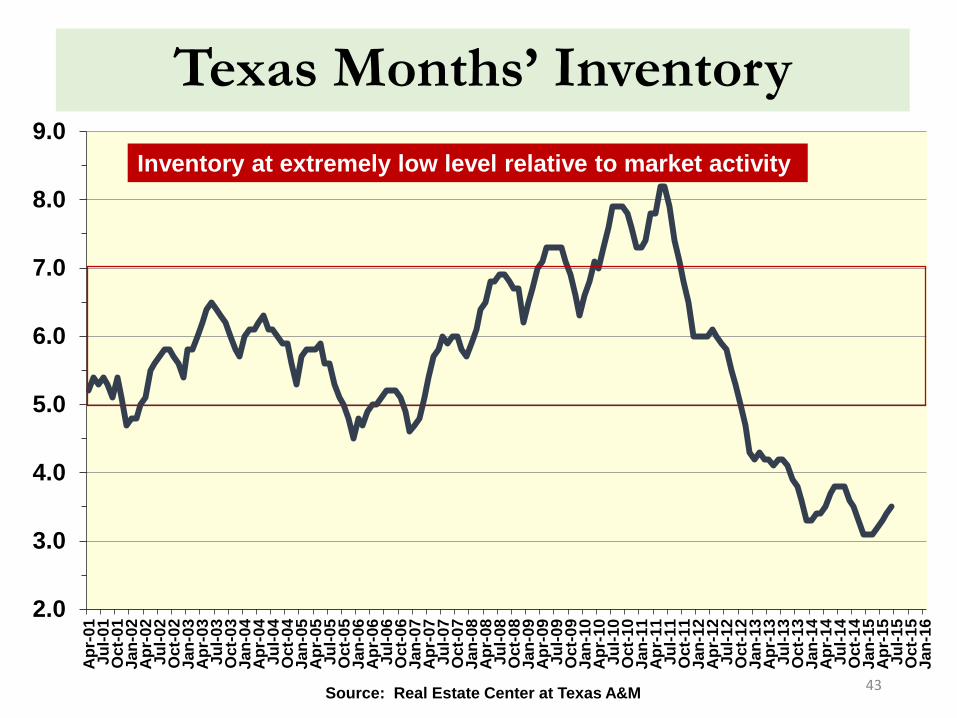
Texas Months’ Inventory
2.0
3.0
4.0
5.0
6.0
7.0
8.0
9.0
Apr
-01
Jul-0
1O
ct-0
1Ja
n-02
Apr
-02
Jul-0
2O
ct-0
2Ja
n-03
Apr
-03
Jul-0
3O
ct-0
3Ja
n-04
Apr
-04
Jul-0
4O
ct-0
4Ja
n-05
Apr
-05
Jul-0
5O
ct-0
5Ja
n-06
Apr
-06
Jul-0
6O
ct-0
6Ja
n-07
Apr
-07
Jul-0
7O
ct-0
7Ja
n-08
Apr
-08
Jul-0
8O
ct-0
8Ja
n-09
Apr
-09
Jul-0
9O
ct-0
9Ja
n-10
Apr
-10
Jul-1
0O
ct-1
0Ja
n-11
Apr
-11
Jul-1
1O
ct-1
1Ja
n-12
Apr
-12
Jul-1
2O
ct-1
2Ja
n-13
Apr
-13
Jul-1
3O
ct-1
3Ja
n-14
Apr
-14
Jul-1
4O
ct-1
4Ja
n-15
Apr
-15
Jul-1
5O
ct-1
5Ja
n-16
43Source: Real Estate Center at Texas A&M
Inventory at extremely low level relative to market activity

Texas SF Building Permits
67,87066,161
78,714
103,252
84,565
67,96459,143
43,97535,90836,65838,233
46,209
59,543
69,96470,45270,421
83,13282,228
99,912101,928108,782111,915
122,913
137,493
151,384
166,203163,032
120,366
81,107
68,23068,170
67,254
81,926
93,478
103,045
53,139
0
20,000
40,000
60,000
80,000
100,000
120,000
140,000
160,000
180,00019
8019
8119
8219
8319
8419
8519
8619
8719
8819
8919
9019
9119
9219
9319
9419
9519
9619
9719
9819
9920
0020
0120
0220
0320
0420
0520
0620
0720
0820
0920
1020
1120
1220
1320
141H
2…
Source: US Census Bureau, Real Estate Center at Texas A&M
2014 +10%
1990-2014 average 94,693/year
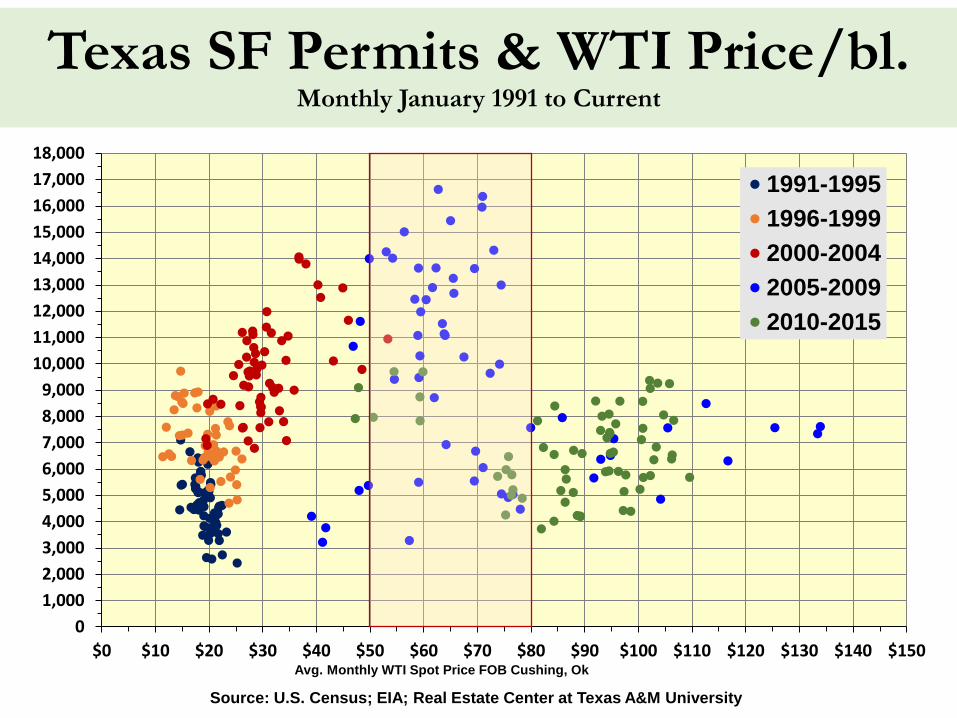
Texas SF Permits & WTI Price/bl. Monthly January 1991 to Current
01,0002,0003,0004,0005,0006,0007,0008,0009,000
10,00011,00012,00013,00014,00015,00016,00017,00018,000
$0 $10 $20 $30 $40 $50 $60 $70 $80 $90 $100 $110 $120 $130 $140 $150
1991-19951996-19992000-20042005-20092010-2015
Source: U.S. Census; EIA; Real Estate Center at Texas A&M University
Avg. Monthly WTI Spot Price FOB Cushing, Ok

Real Estate:Location, Location, Location!

National and Texas Economic and Outlook
Dr. James P. GainesChief Economist
recenter.tamu.edu