Embed Size (px)
Citation preview

0
Economic Outlook:A New Year But Risks Remain
February 2021
Lindsey M. Piegza, Ph.D.Chief Economist
Refer to the last page of this report for Stifel Fixed Income Capital Markets disclosures and analyst certifications.Stifel, Nicolaus & Company, Incorporated Member NYSE / SIPC.

1
Objectives
1. Macro-economic trends including the health of the consumer, and manufacturing sector
2. Fed policy effects and initiatives
3. U.S. growth and rate outlook

2
Payrolls Rise 49k in January
Nonfarm payrolls fell 1.4M in March and 20.8M in
April, the largest monthly decline on record
Nonfarm payrolls rose 49kin January, the seventh consecutive month of waning momentum in
terms of the pace of hiring
For the full year, payrolls dropped by 9.3M in 2020,
the largest decline on record, and more than the combined decline in 2008
and 2009
3
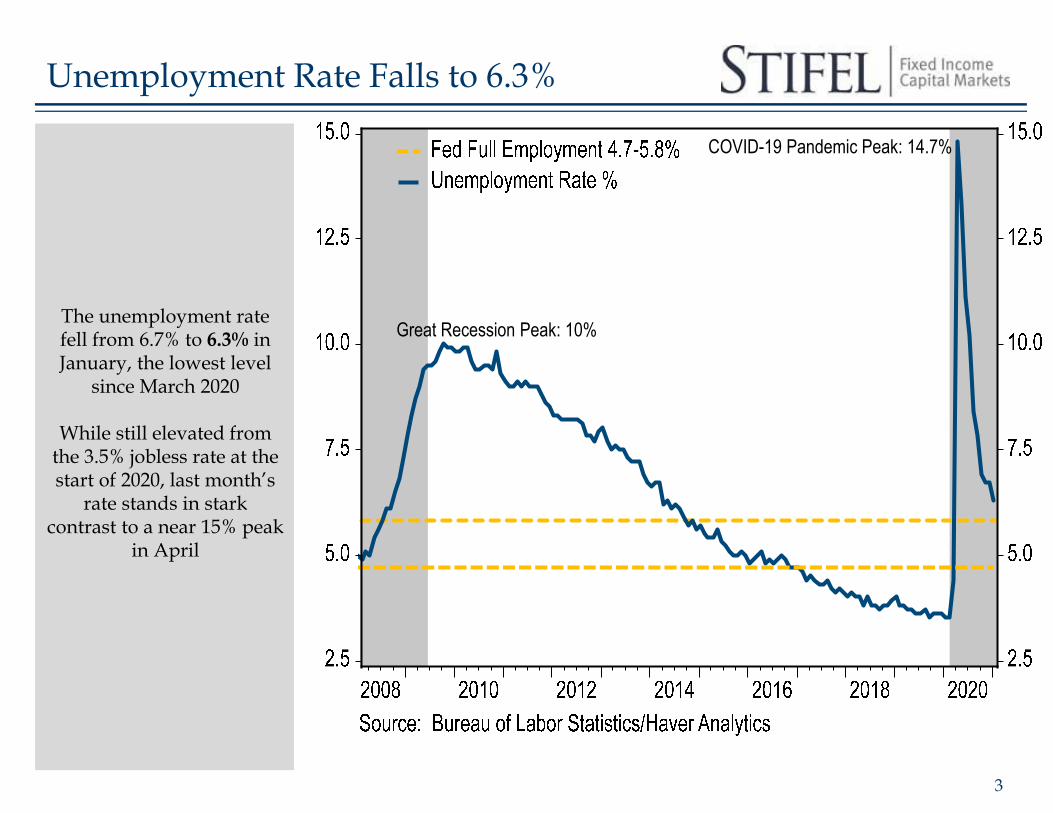
Unemployment Rate Falls to 6.3%
The unemployment rate fell from 6.7% to 6.3% in January, the lowest level
since March 2020
While still elevated from the 3.5% jobless rate at the start of 2020, last month’s
rate stands in stark contrast to a near 15% peak
in April
Great Recession Peak: 10%
COVID-19 Pandemic Peak: 14.7%

4
Continuing Claims Remain Elevated
More than 78M applications for
unemployment insurance have been filed over the
past twelve months
Continuing claims, or the total number of Americans
receiving ongoing unemployment benefits, remains elevated at 4.5M with 334k eligible under
the PUA program

5
Hardest Hit Industries
While many jobs have been created since May, the
recent gain is around half of the total jobs lost since
the onset of the COVID-19 pandemic
With around 10M Americans still out of
work, job destruction has been widespread across a
variety of sectors
The leisure and hospitality industry has lost nearly 4M
jobs in eleven months

6
Permanent Layoffs On the Rise
*The U.S. Census Bureau conducts the household survey for BLS. Census Bureau interviewers contact households by telephone and in person and ask questions regarding the labor market activity of household members during the previous calendar week. Reasons for unemployment include: on temporary leave, job leavers, reentrants, and new entrants
According to the Bureau of Labor Statistics, the
number of permanent job losses rose by 133k to 3.5M
in January, near the highest level in more than
seven years
Temporary layoffs, however, declined by 293k
to 2.7M in January

7
Unemployment by Gender and Race
Women have faced a relatively higher
unemployment rate throughout the pandemic
compared to men, an average of 0.6% higher
The black unemployment rate (11.3%) is nearly
double the white unemployment rate (7.2%)
as of January, down, however, from a recent peak of 16.8% in May

8
Average Hourly Earnings Slowing
*Does not include government assistance
Average hourly earnings increased 0.2% in January,
a three-month low
Year-over-year, wages rose 5.4% in January for the
second consecutive month, down from a recent peak
of 8.0% in April
Average earnings increased early on during
the pandemic as lower-wage workers dropped out
of the workforce
9
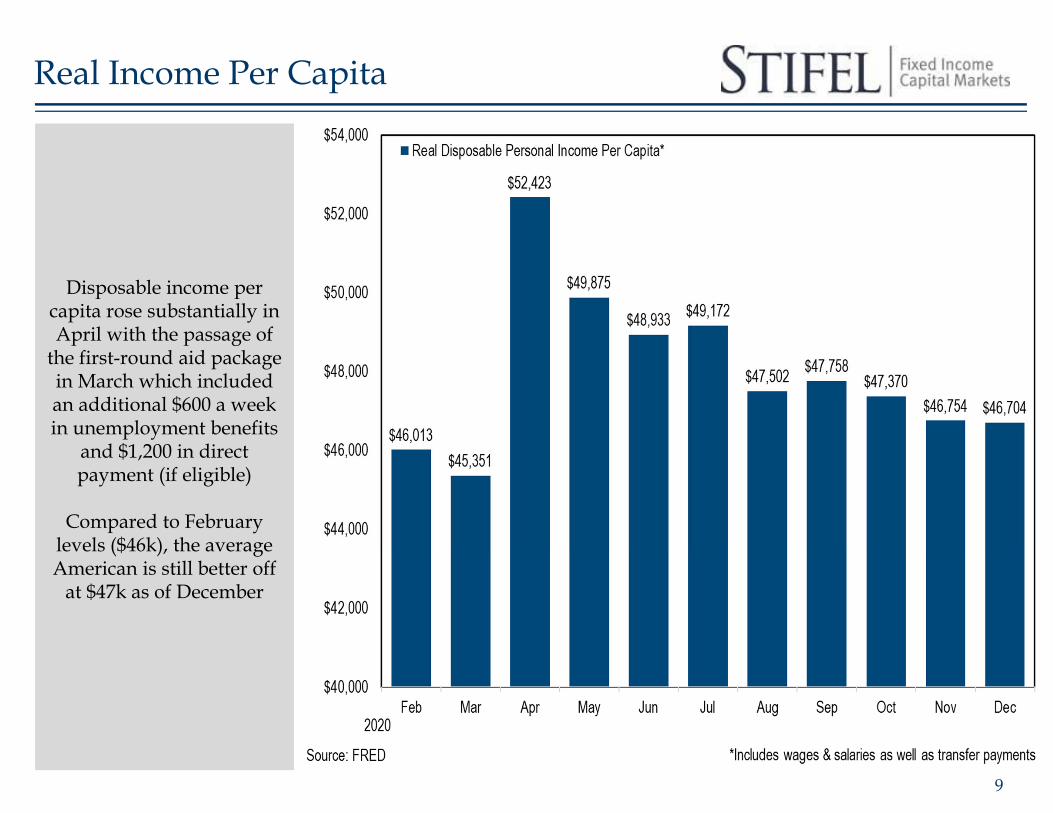
Real Income Per Capita
Disposable income per capita rose substantially in April with the passage of
the first-round aid package in March which included an additional $600 a week in unemployment benefits
and $1,200 in direct payment (if eligible)
Compared to February levels ($46k), the average American is still better off
at $47k as of December

10
Consumer Remains Fragile
Retail sales fell 8.2% in March and 14.7% in April
Sales rose 5.3% in January
The 5.3% rise marked a seven-month high, but still below a more rapid pace in
May (18.3%) and June (8.6%)
Over the past six months, sales have averaged 1.0%
Year-over-year, retail sales rose 7.4% in January, up
from the 2.5% gain in December

11
Consumption by Category
Consumers spent more than $7B dollars on eating and drinking at home over
the past eleven months, and nearly $1.5B on
sporting goods
Also, nearly $19B has been spent on non-store or
internet purchases

12
Increased Demand for Housing
Existing home sales rose 0.7% in December to a 6.8M unit pace, a two-
month high
The inventory of existing homes declined from 2.3 to 1.9 months, an all-time low
New home sales rose 1.6% in December to a 842K unit
pace, a two-month high
The inventory of new homes rose from 4.2 to 4.3 months, a six-month high

13
Vacancy Rates on the Rise Amid Closures
The commercial vacancy rate rose to 17.4% in Q3, a
nine-year high
Amid further bankruptcies and business closures, the
office vacancy rate is expected to climb to a
historic high of 20% by 2021

14
Business Closures on the Rise
According to the U.S. Chamber, 23% of small businesses have already
closed their doors at least temporarily since the
pandemic
Nearly two-thirds of small businesses report they are
worried or at risk of permanent closure by year-
end
According to Yelp, more than 60% of restaurants temporarily shut down
because of the pandemic have since permanently
closed
15
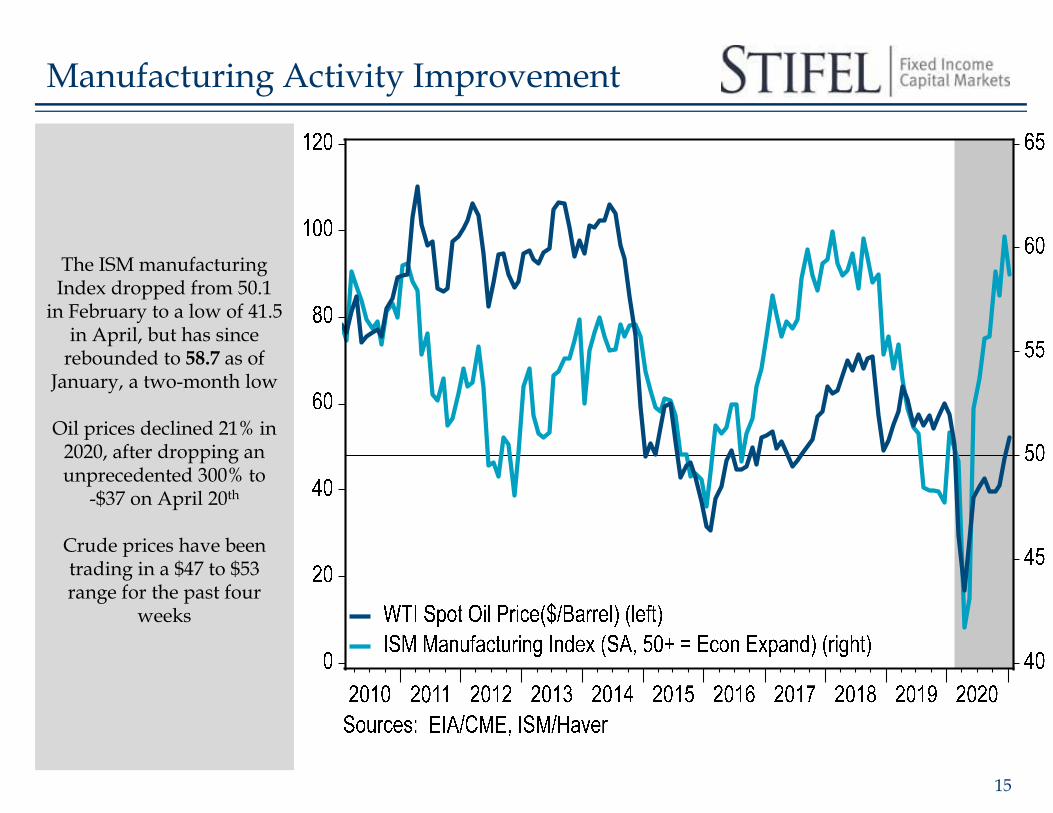
Manufacturing Activity Improvement
The ISM manufacturing Index dropped from 50.1
in February to a low of 41.5 in April, but has since
rebounded to 58.7 as of January, a two-month low
Oil prices declined 21% in 2020, after dropping an unprecedented 300% to
-$37 on April 20th
Crude prices have been trading in a $47 to $53 range for the past four
weeks

16
International Response
The U.S. has spent around $4.0T to combat the
economic fallout from the COVID-19 pandemic,
while Japan has deployed $2.2T
The EU agreed on a €750B stimulus package ($889B)
and the U.K. unveiled $38B in stimulus measures

17
U.S. Fiscal Response
Roughly $3.9T total in U.S. government aid
Round 1 (Mar 6): $8.3B for health agencies and testing, and for small-business loan subsidies
Round 2 (Mar 18): $104B that included tax credits for employers
offering paid sick leave, and increases to unemployment benefits and food assistance
Round 3 (Mar 27): $2.3T CARES Act included checks to
households, bailouts for airlines and other distressed industries, and $349B loans and grants for
small business under the Paycheck Protection Program (PPP)
Round 4 (Apr 24): $484B for additional funding for PPP, as well
as more funds for hospitals and testing
Round 5 (Dec 27): $900B for another-round stimulus checks to
individuals, additional unemployment benefits, as well as
funding for small businesses, vaccine distribution, food
assistance, education and child care

18
U.S. Deficit On the Rise
According to the Congressional Budget
Office, the deficit for FY 2020 rose to $3.1T, or 16% of projected GDP, more
than triple the shortfall in 2019
Deficits over the last 50 years have averaged 3% of
GDP
During the Great Recession, the largest deficit recorded (in FY
2009) was under 10% of GDP
The unprecedented increase in expenditures in
2020, as expected, was dominated by the COVID-19 pandemic, the economic
shutdown, and the legislative response in
terms of fiscal relief aid and stimulus

19
U.S. Government Debt Rapidly Rising
Debt held by the public rose sharply to 100.1% of GDP in 2020, compared
with 79% at the end of 2019 and 35% in 2007, before the
start of the previous recession
Debt to GDP is again expected to exceed 100% in 2021 and increase to 107% in 2023, the highest in the
nation’s history
The previous peak (106%) occurred in 1946 following the large deficits incurred
during World War II
By 2030, debt to GDP is projected to rise to 109%

20
Global Debt to GDP
Much of the developed world has debt to GDP ratios exceeding 100%
The U.S. has the third highest gross federal debt to GDP ratio in the world
at 141.4%, behind only Japan (268%) and Italy
(166.1%)
21
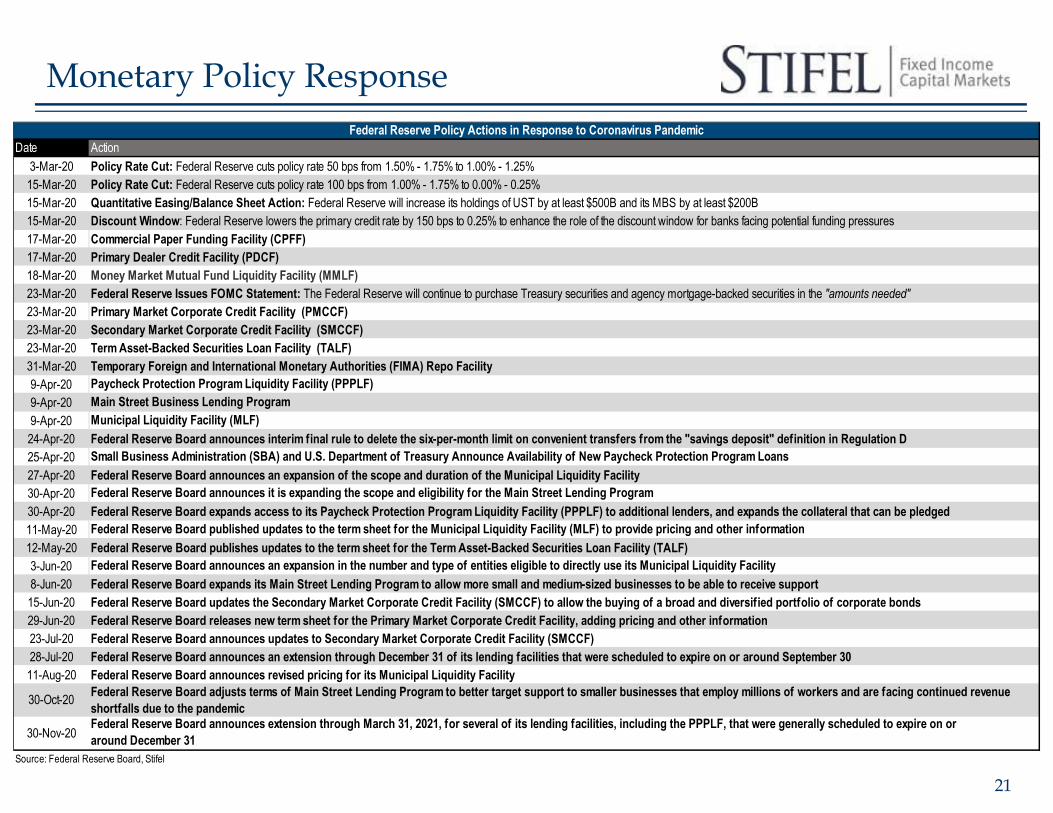
Monetary Policy Response
Date Action3-Mar-20 Policy Rate Cut: Federal Reserve cuts policy rate 50 bps from 1.50% - 1.75% to 1.00% - 1.25%15-Mar-20 Policy Rate Cut: Federal Reserve cuts policy rate 100 bps from 1.00% - 1.75% to 0.00% - 0.25%15-Mar-20 Quantitative Easing/Balance Sheet Action: Federal Reserve will increase its holdings of UST by at least $500B and its MBS by at least $200B15-Mar-20 Discount Window: Federal Reserve lowers the primary credit rate by 150 bps to 0.25% to enhance the role of the discount window for banks facing potential funding pressures17-Mar-20 Commercial Paper Funding Facility (CPFF) 17-Mar-20 Primary Dealer Credit Facility (PDCF) 18-Mar-20 Money Market Mutual Fund Liquidity Facility (MMLF) 23-Mar-20 Federal Reserve Issues FOMC Statement: The Federal Reserve will continue to purchase Treasury securities and agency mortgage-backed securities in the "amounts needed"23-Mar-20 Primary Market Corporate Credit Facility (PMCCF)23-Mar-20 Secondary Market Corporate Credit Facility (SMCCF)23-Mar-20 Term Asset-Backed Securities Loan Facility (TALF)31-Mar-20 Temporary Foreign and International Monetary Authorities (FIMA) Repo Facility9-Apr-20 Paycheck Protection Program Liquidity Facility (PPPLF)9-Apr-20 Main Street Business Lending Program9-Apr-20 Municipal Liquidity Facility (MLF)24-Apr-20 Federal Reserve Board announces interim final rule to delete the six-per-month limit on convenient transfers from the "savings deposit" definition in Regulation D25-Apr-20 Small Business Administration (SBA) and U.S. Department of Treasury Announce Availability of New Paycheck Protection Program Loans27-Apr-20 Federal Reserve Board announces an expansion of the scope and duration of the Municipal Liquidity Facility30-Apr-20 Federal Reserve Board announces it is expanding the scope and eligibility for the Main Street Lending Program30-Apr-20 Federal Reserve Board expands access to its Paycheck Protection Program Liquidity Facility (PPPLF) to additional lenders, and expands the collateral that can be pledged11-May-20 Federal Reserve Board published updates to the term sheet for the Municipal Liquidity Facility (MLF) to provide pricing and other information12-May-20 Federal Reserve Board publishes updates to the term sheet for the Term Asset-Backed Securities Loan Facility (TALF) 3-Jun-20 Federal Reserve Board announces an expansion in the number and type of entities eligible to directly use its Municipal Liquidity Facility8-Jun-20 Federal Reserve Board expands its Main Street Lending Program to allow more small and medium-sized businesses to be able to receive support15-Jun-20 Federal Reserve Board updates the Secondary Market Corporate Credit Facility (SMCCF) to allow the buying of a broad and diversified portfolio of corporate bonds29-Jun-20 Federal Reserve Board releases new term sheet for the Primary Market Corporate Credit Facility, adding pricing and other information23-Jul-20 Federal Reserve Board announces updates to Secondary Market Corporate Credit Facility (SMCCF)28-Jul-20 Federal Reserve Board announces an extension through December 31 of its lending facilities that were scheduled to expire on or around September 3011-Aug-20 Federal Reserve Board announces revised pricing for its Municipal Liquidity Facility
30-Oct-20 Federal Reserve Board adjusts terms of Main Street Lending Program to better target support to smaller businesses that employ millions of workers and are facing continued revenue shortfalls due to the pandemic
30-Nov-20Federal Reserve Board announces extension through March 31, 2021, for several of its lending facilities, including the PPPLF, that were generally scheduled to expire on oraround December 31
Federal Reserve Policy Actions in Response to Coronavirus Pandemic
Source: Federal Reserve Board, Stifel

22
Fed Balance Sheet Reaches $7T
During the 2007-2008 Financial Crisis and
subsequent recession, the Federal Reserve's balance
sheet increased significantly from $870B in
August 2007 to $4.5T in early 2015, including $1.7T in MBS and $1.7T in UST
purchases
Since the start of the coronavirus pandemic, the
Fed’s balance sheet has increased from $4.2T in February to $7.4T as of January, with $698B in MBS and $2.3T in UST
purchases

23
Equities Recapture Pandemic Losses
The equity market – despite a recession and ongoing
pandemic – has recouped early pandemic losses
Down more than 20% after the first quarter of 2020,
U.S. equities moved back into the black – by May for the Nasdaq and late July
for the S&P 500
YoY the Nasdaq is up 45% and the S&P 500 is up 17%
as of February 10th
The Dow is up 9% since the start of 2020
Dow Jones Industrial Average
24
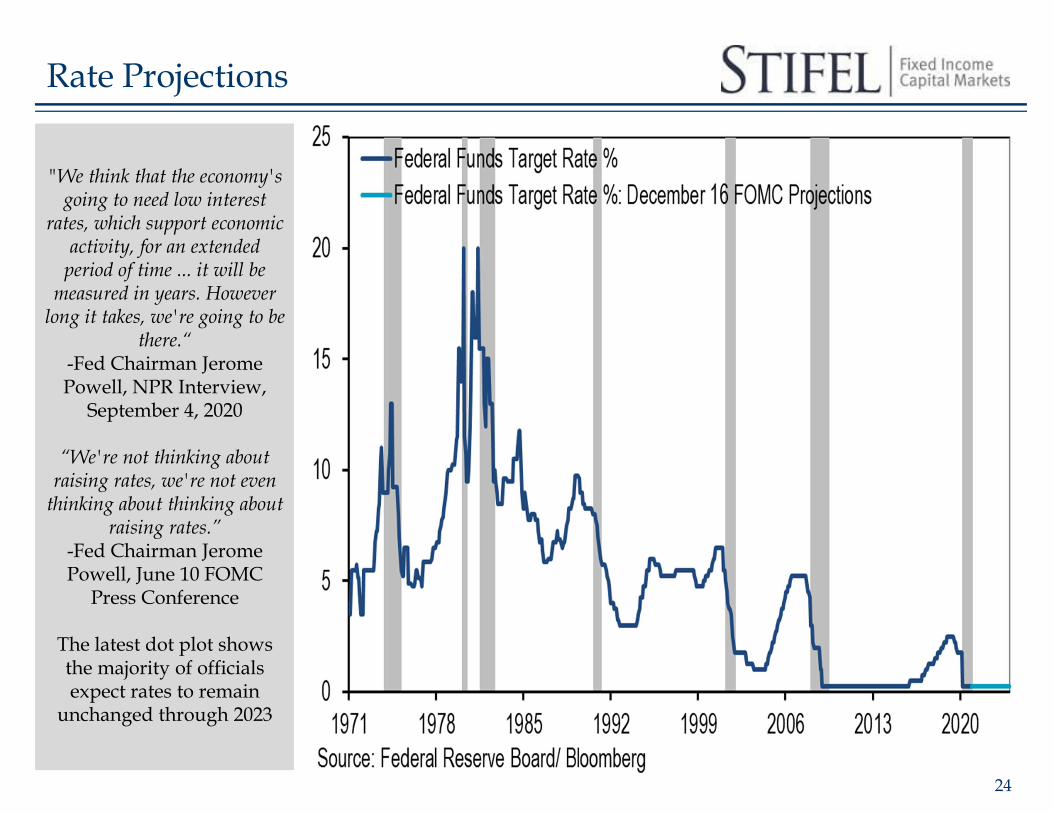
Rate Projections
"We think that the economy's going to need low interest
rates, which support economic activity, for an extended
period of time ... it will be measured in years. However
long it takes, we're going to be there.“
-Fed Chairman Jerome Powell, NPR Interview,
September 4, 2020
“We're not thinking about raising rates, we're not even
thinking about thinking about raising rates.”
-Fed Chairman Jerome Powell, June 10 FOMC
Press Conference
The latest dot plot shows the majority of officials expect rates to remain
unchanged through 2023

25
Subdued Inflation
“With inflation running persistently below this longer-run goal, the Committee will
aim to achieve inflation moderately above 2% forsome time so that inflation
averages 2%...”-January 27th FOMC
Statement
The PCE rose 0.4% in December and rose 1.5%
YoY The core PCE rose 0.3% in December and rose 1.5%
YoY
Inflation has fallen short of the Fed’s 2% target for
nearly a decade
Inflation has been averaging 1.3% over the past five
years, allowing a potential for inflation to run near 3%
for the next five without exceeding a longer-tem
average of 2%

26
GDP to Remain Restrained
After a 31.4% drop in Q2, growth rebounded 33.4% in Q3 and rose 4.0% in Q4
Growth is likely to slow, potentially falling back
into negative territory and remain minimal throughout 2021

27
Vaccination Timeline Falling Short
28
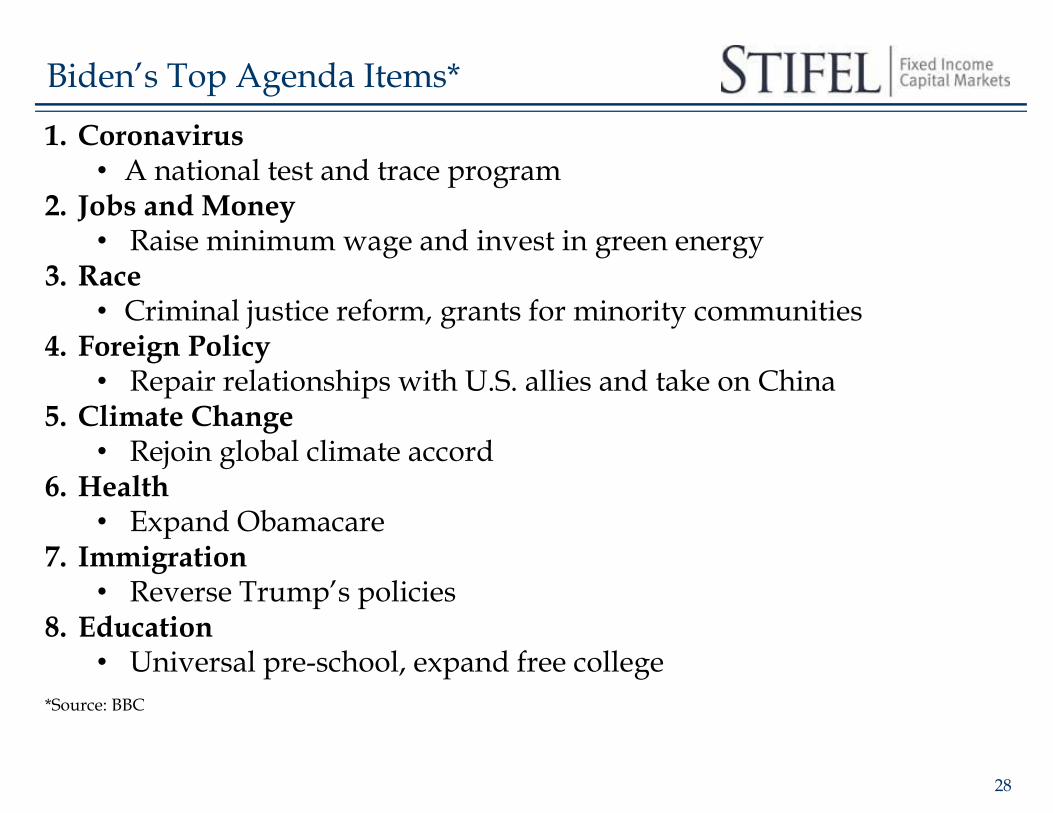
Biden’s Top Agenda Items*
1. Coronavirus• A national test and trace program
2. Jobs and Money• Raise minimum wage and invest in green energy
3. Race• Criminal justice reform, grants for minority communities
4. Foreign Policy• Repair relationships with U.S. allies and take on China
5. Climate Change• Rejoin global climate accord
6. Health• Expand Obamacare
7. Immigration• Reverse Trump’s policies
8. Education• Universal pre-school, expand free college
*Source: BBC

29
Global GDP to Remain Restrained
According to the latest October IMF forecast,
global GDP is expected to decline 3.5% in 2020
following a 2.8% gain in 2019
In 2021, GDP is expected to rebound to 5.5%,
compared with 2.8% in 2019
In the five years preceding the pandemic, global
growth averaged 2.9%

30
Disclosures
Disclosures and Disclaimers
The Fixed Income Capital Markets trading area of Stifel, Nicolaus & Company, Incorporated may own debt securities of the borrower or borrowers mentioned in this report and may make a market in the aforementioned securities as of the date of issuance of this research report.
Please visit the Research Page at www.stifel.com for the current research disclosures applicable to the companies mentioned in this publication that are within Stifel’s coverage universe.
The information contained herein has been prepared from sources believed reliable but is not guaranteed by Stifel and is not a complete summary or statement of all available data, nor is it to be construed as an offer to buy or sell any securities referred to herein. Opinions expressed are subject to change without notice and do not take into account the particular investment objectives, financial situation or needs of investors. Employees of Stifel or its affiliates may, at times, release written or oral commentary, technical analysis or trading strategies that differ from the opinions expressed within. No investments or services mentioned are available to “private customers” in the European Economic Area or to anyone in Canada other than a “Designated Institution”. The employees involved in the preparation or the issuance of this communication may have positions in the securities or options of the issuer/s discussed or recommended herein.Stifel is a multi-disciplined financial services firm that regularly seeks investment banking assignments and compensation from issuers for services including, but not limited to, acting as an underwriter in an offering or financial advisor in a merger or acquisition, or serving as a placement agent in private transactions. Moreover, Stifel and its affiliates and their respective shareholders, directors, officers and/or employees, may from time to time have long or short positions in such securities or in options or other derivative instruments based thereon.Stifel Fixed Income Capital Markets research and strategy analysts (“FICM Analysts”) are not compensated directly or indirectly based on specific investment banking services transactions with the borrower or borrowers mentioned in this report or on FICM Analyst specific recommendations or views (whether or not contained in this or any other Stifel report), nor are FICM Analysts supervised by Stifel investment banking personnel; FICM Analysts receive compensation, however, based on the profitability of both Stifel (which includes investment banking) and Stifel FICM. The views, if any, expressed by FICM Analysts herein accurately reflect their personal professional views about subject securities and borrowers. For additional information on investment risks (including, but not limited to, market risks, credit ratings and specific securities provisions), contact your Stifel financial advisor or salesperson.
Our investment rating system is three‐tiered, defined as follows:Outperform ‐ For credit specific recommendations we expect the identified credit to outperform its sectorspecific peers over the next six months.Market perform ‐ For credit specific recommendations we expect the identified credit to perform approximatelyin line with its sector specific peers over the next six months.Underperform ‐ For credit specific recommendations we expect the identified credit to underperform its sectorspecific peers over the next six months.
Additional Information Is Available Upon Request
I, Lindsey Piegza, certify that the views expressed in this research report accurately reflect my personal views about the subject securities or issuers; and I certify that no part of my compensation was, is, or will be directly or indirectly related to the specific recommendations or views contained in this research report.
© 2021 Stifel, Nicolaus & Company, Incorporated, One South Street, Baltimore, MD 21202. All rights reserved.
.