Embed Size (px)
Citation preview

National and International Poverty in Eastern Europe and Central Asia
Victor SullaEconomistThe World Bank

Outline
• The World Bank’s global poverty measures and MDGs
• Main issues poverty definition in ECA region
• International poverty measurement
• . National poverty measurement
• . Conclusions
9/20/2011 2

Main issues related to poverty definition in Europe and Central Asia (ECA)
region

Module 3: Measuring (step 2)
4
Alternative poverty lines: General
There are many different types of poverty lines. One of the main distinction in ECA is between:
– Relative poverty line: when the line is defined relative to some measure of welfare for the entire population.
– Absolute poverty line: when the line is defined in absolute terms, as the minimum cost of a reference living standard.

5
Alternative poverty lines: Relative
A. Relative poverty lineDefinition: A relative line is set in relation to the overall distribution of income or consumption in a country/region of reference. The most common examples are to set the poverty line at 50 percent of the mean consumption in the country, or at 50 percent of the median consumption. Relative lines are typically used in rich countries.

Module 3: Measuring (step 2)
6
Alternative poverty lines : Relative
Advantages and disadvantages:(+) In rich countries, absolute poverty or
destitution is very small, and a relative line is typically used.
(-) In low or middle income countries, where absolute poverty is more prevalent, it is better to use an absolute measure.

7
Alternative poverty lines: Relative
(-) Relative poverty lines do not allow for comparisons across countries or over time since they don’t represent the same welfare level: For instance, the official poverty rate in the early 1990s was close to 15% in the United States and also close to 15% in (much poorer) Indonesia. Many of those counted as poor in the U.S. would be considered to be comfortably well off by Indonesian standards.
8
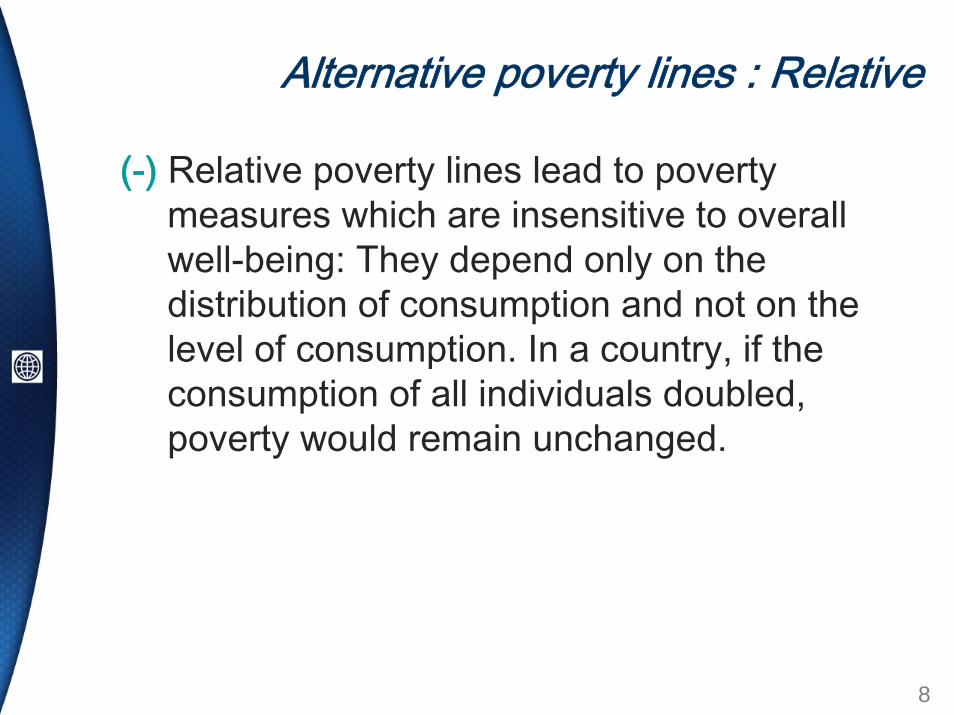
Alternative poverty lines : Relative
(-) Relative poverty lines lead to poverty measures which are insensitive to overall well-being: They depend only on the distribution of consumption and not on the level of consumption. In a country, if the consumption of all individuals doubled, poverty would remain unchanged.

9
Alternative poverty lines : Relative
(-) Dependence on distribution also means that: • if the poor are getting poorer (all things
equal for the others), the mean or median consumption decreases, the poverty line decreases, and poverty measures decrease.
• If the rich are getting richer (all things equal for the others), the mean or median consumption increases, the poverty line increases, and poverty measures increase.

10
Absolute poverty lines
B. Absolute poverty lineDefinition: An absolute poverty line is set as an absolutelevel below which consumption is considered to be too low to meet the minimum welfare level acceptable.
Absolute poverty lines are typically used in low or middle income countries.
11
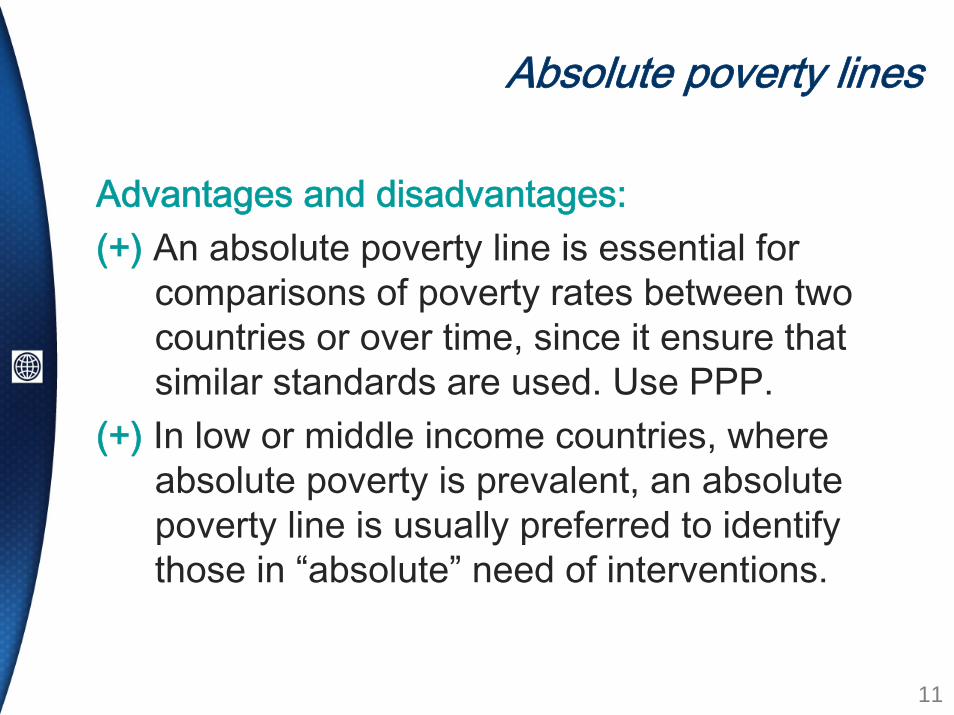
Absolute poverty lines
Advantages and disadvantages:(+) An absolute poverty line is essential for
comparisons of poverty rates between two countries or over time, since it ensure that similar standards are used. Use PPP.
(+) In low or middle income countries, where absolute poverty is prevalent, an absolute poverty line is usually preferred to identify those in “absolute” need of interventions.

Module 3: Measuring (step 2)
12
Absolute poverty lines
(-) In rich countries, an absolute poverty line would probably not provide relevant information: The $1 per day poverty line might be useful in Vietnam (where 27% of the population is poor by this standard in 1998), but would be of little relevance in the UK.
(-) It is difficult to define what constitutes “basic needs”, which vary across individuals according to their metabolism and their activity level.

13
Poverty lines. ECA summary
• EU countries have already moved to a common definition based on reiterative principle, however they come back to material deprivation as and absolute measure. Ukraine example
• Other countries use absolute poverty lines but methodologies of lines as well as consumption aggregates differ across countries.
• The World Bank uses both national and international poverty lines

International poverty measureNew “dollar a day” line

“Poor” by whose definition?
• In assessing poverty in a given country, and how best to reduce poverty, one naturally focuses on a poverty line that is considered appropriate for that country.
• But how do we talk meaningfully about “global poverty”?– Poverty lines across countries vary in terms of their
purchasing power, – and they have a strong economic gradient, such that
richer countries tend to adopt higher standards of living in defining poverty =>
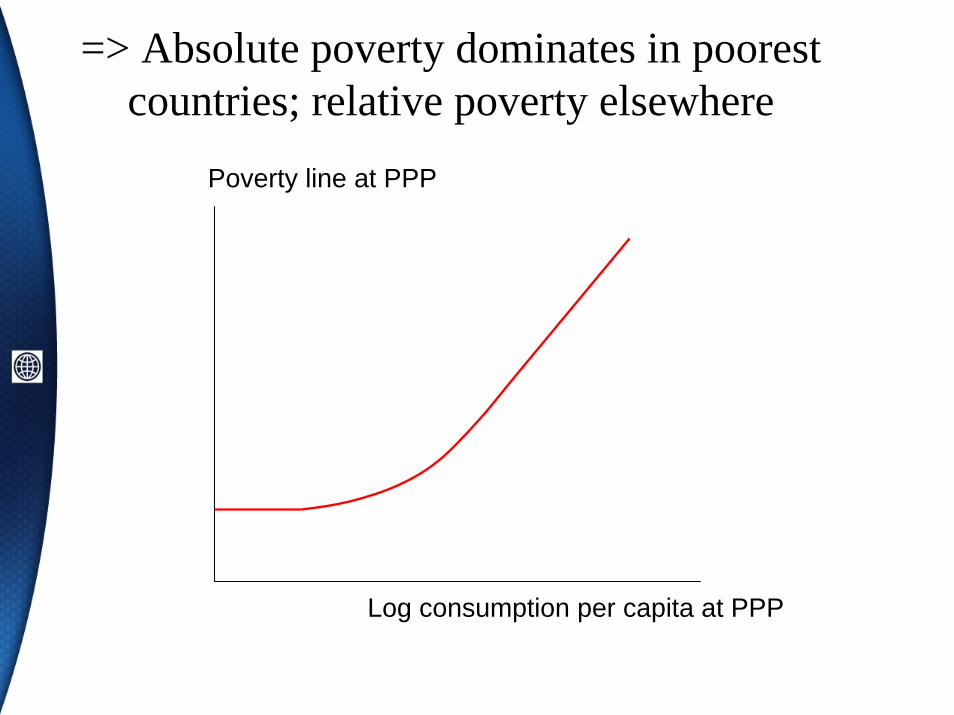
Poverty line at PPP
Log consumption per capita at PPP
=> Absolute poverty dominates in poorest countries; relative poverty elsewhere

“$2 a day” is more representative of developing world as a whole
• Focusing on the poorest is justified. • Nonetheless, a higher line—more typical of
developing countries as a whole—is also of interest.
• A line set at double that found in the poorest countries has been widely used for this purpose.

Steps in measuring global poverty
1. The international poverty line is converted to local currencies in the ICP benchmark year (2005)
2. and is then converted to the prices prevailing at the time of the relevant household survey using the best available CPI for that country.
3. Then the poverty rate is calculated from that survey. 4. Interpolation/extrapolation methods are used to line up
the survey-based estimates with these reference years, including 2005.

New compilation of national poverty lines
• Original compilation for WDR 1990 is now rather old.• New compilation of national poverty lines from the
Bank’s country-level Poverty Assessments/PRSPs. – Poverty lines considered appropriate to living
standards in each country,– Consultation with Government, or Government’s
own line.• Converted to common currency using 2005 PPP for
individual consumption• Data set for 75 countries

0
100
200
300
Nat
iona
l pov
erty
line
($/m
onth
at 2
005
PPP
)
3 4 5 6 7Log consumption per person at 2005 PPP
Note: Fitted values use a lowess smoother with bandwidth=0.8
National poverty lines for developing countries plotted against mean consumption using consumption PPPs for 2005
OLS elasticity=0.66

International poverty lines of $PPP 2.5 (poverty) and $PPP 5.0 (vulnerability) per capita per day used with 2005 ICP
National poverty lines expressed in ICP Kirgiz Republic (2005), Georgia (2006), Moldova (2005), Armenia (2004), Tajikistan (2003), Azerbaijan (2002). The un-weighted average of national poverty lines for all 6 countries is $2.73 a day and $2.50 dollars for the poorest 4 countries.

Alternative lines for testing robustness
• $1.00: India’s official poverty line• $1.25• $1.45: 2005 value in the US of our old
(1993) line of $1.08/day• $2.00: Median of all developing/transition
countries in our data• $2.50: More typical of middle income
countries in ECA and LAC• Relative poverty lines:

International poverty in ECA: 2008
International poverty Conclusions
• Socio-economic data from the developing world are improving over time, so revisions to our knowledge can be expected.
• The original “$1 a day” poverty line aimed to assess poverty in the world as a whole by the standards of what poverty means in the poorest countries.
• Based on our new compilation of national poverty lines and 2005 ICP we propose a new international line of $1.25 a day. Relevant poverty in ECA is $2.5 a-day
• Diversity in ECA region with a clear downwards trends towards improvement.
National poverty measures

Common issues in PracticeCommon issues in Practice
• Identification of consumer’s cost function from demand behavior
• Are there goods that should be included in the consumption aggregate but not the poverty line
• Identification of external effects (interdependence). Utility depends on own consumption and relative position
• “Absolute” versus “relative” poverty? Is there really a difference? “Absolute” in the space of welfare can mean “relative” in the commodity space (Ravallion and Chen, 2009)

National Poverty rates for different countriesNational Poverty rates for different countries

Practice: Objective Poverty LinesPractice: Objective Poverty Lines
• Cost of Basic Needs (CBN) method:– Poverty line is a cost of a bundle of goods deemed
sufficient for basic needs.– Food-share version of CBN : Poverty line is a cost of the
food-energy requirement
• Food-Energy Intake (FEI) method– Find expenditure or income at which food-energy
requirements are met on average for each region/socio-economic group

Problems to be aware ofProblems to be aware of• Defining “basic consumption needs”
– Setting food energy requirements: problems with variability of activity levels; multiple equilibrium
– Setting basic non-food consumption needs
• Consistency in terms of welfare:– Is the same standards of living being treated the same way in
different subgroups of the poverty profile?
– Is the definition of welfare consistent with the definition of poverty? Should some goods purchased by the poor be included into the poverty bundle?
• How sensitive are the rankings in a poverty profile to these choices?
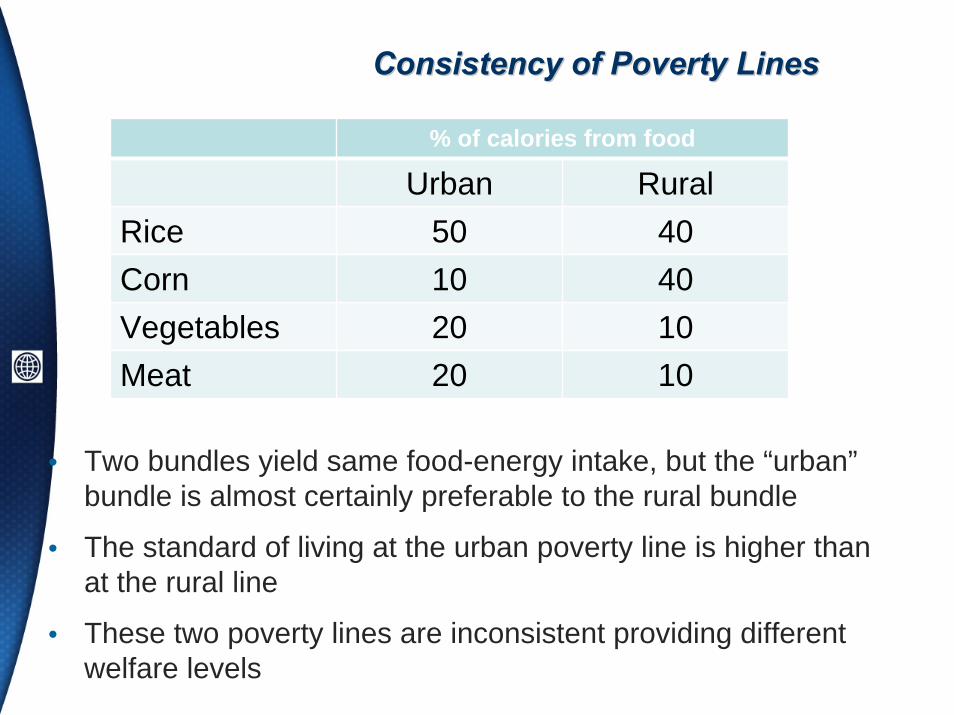
Consistency of Poverty LinesConsistency of Poverty Lines
• Two bundles yield same food-energy intake, but the “urban”bundle is almost certainly preferable to the rural bundle
• The standard of living at the urban poverty line is higher than at the rural line
• These two poverty lines are inconsistent providing different welfare levels
% of calories from food
Urban RuralRice 50 40Corn 10 40Vegetables 20 10Meat 20 10

Difference in the cost per capita Difference in the cost per capita
• Food Consumption and Cost of a calorie by quintile
Expenditure Quintile
Percentage of expenditure on
food
Calories per capita, per day
Cost per calorie
Lowest 70 1,591 0.68
2 65 1,855 0.79
3 60 2,020 0.87
4 54 2,160 1.00
Highest 47 2,751 1.38

Example 2: FoodExample 2: Food--energy intake Methodenergy intake Method
Different sub-groups attain food energy requirements at different standards of living, in terms of real consumption expenditures

Allowing for differences in relative pricesAllowing for differences in relative prices
• Ideally we only want to adjust the poverty bundle for differences in relative prices
• The problem is how to implement this ideal in practice
• The identification problem remains
• Key thing: To control for welfare differences

Allowing for differences in relative pricesAllowing for differences in relative prices
• Parametric demand models: If we know the parametric utility function then or we can figure it out from demand behavior then use this to determine the cost of the reference welfare level in each region
• Numerical methods:– Look at consumption behavior of poorest x% nationally in
each region of the country– Cost the consumption bundle of that group in each region– Calculate the poverty rate nationally and iterate if the
answer differs too far from x

Methods of Setting Poverty Lines Do MatterMethods of Setting Poverty Lines Do Matter!!
Poverty Headcount %Urban Rural
Indonesia
FEI method 16.8 14.3
CBN method 10.7 23.6
Tunisia
FEI method 7.3 5.7
CBN method 3.5 13.1
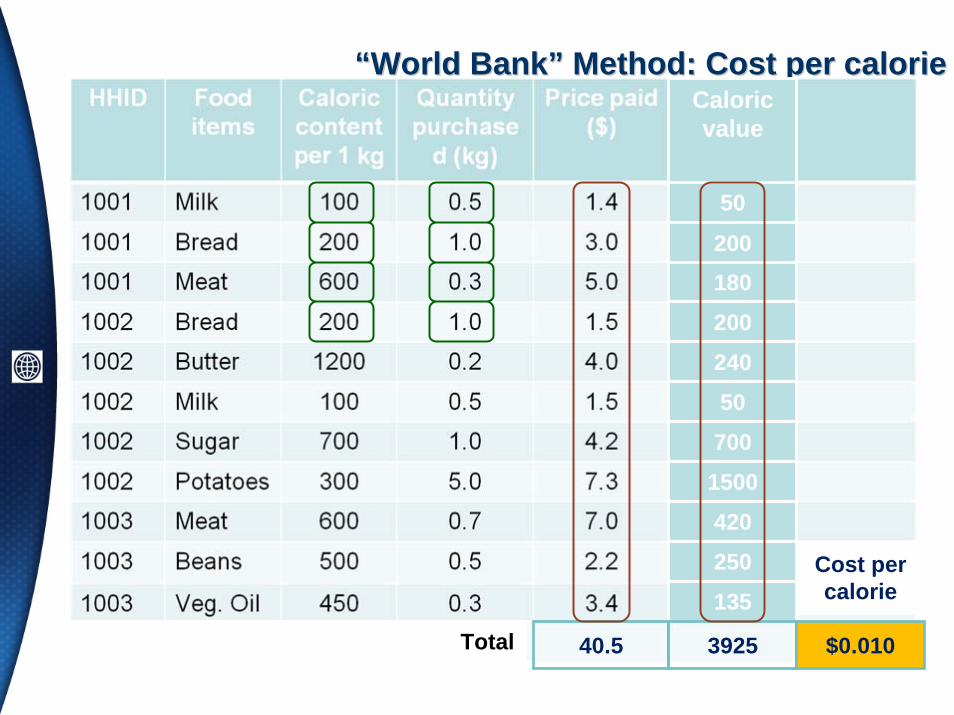
““World BankWorld Bank”” Method: Cost per calorie Method: Cost per calorie Caloric value
50
200
180
200
240
50
700
1500
420
250
135
40.5 3925 $0.010Total
Cost per calorie

“World Bank” Method: Cost per calorie Caloric value
50
200
180
200
240
50
700
1500
420
250
135
$0.015Mean cost per calorie
0.022
Cost per calorie
0.007
0.016

““World BankWorld Bank”” Method: Cost of a calorie Method: Cost of a calorie
• Pick a nutrition requirement: – 2100 Kcal per day (NR)
• Select a group of households around the poverty line– Usually take 2nd to 5th deciles of expenditure distribution
• Calculate the total spending of these households on food (FS)
• Calculate the total caloric content of these purchases (TC)
• Calculate the cost of a calorie for this group: CC=FS/TC
• Calculate the cost of food poverty line as: FPL = NR·CC=NR·FS/TC

Estimating Cost per CalorieEstimating Cost per Calorie
Expected location of povery line
Fourth decile
Second decile

Is the width of the band important? Case of dual prices
IncomeZ1
2
5
Price(mean)
2.453.25
5
2.012.0
Market
Supermarket
Price of a calorie/ goods

Is the width of the band important? Case of multiple prices
IncomeZ1
2
5
Price(mean)
3.503.45
3.65
3.75
Market
Supermarket
Price of a calorie/ goods
Street vendor
Local store

““World BankWorld Bank”” Method: Lower poverty line Method: Lower poverty line
• Adjust Food Poverty Line for non-food expenditures
• LPL: Select a group of households whose total expenditure is equal (close) to Food Poverty Line
• Estimate average share of non-food consumption SL in their total consumption expenditure
• Calculate: LPL = FPL/(1- SL)
• Example: FPL = $50, SL=0.2 → LPL = $50/(1-0.2)=62.5

““World BankWorld Bank”” Method: Upper poverty lineMethod: Upper poverty line
• UPL: Select a group of households whose food expenditure is equal to Food Poverty Line
• Estimate average share of non-food consumption in their total consumption expenditure SU
• Calculate: UPL = FPL/(1- SU)• Example:
FPL = $50, Su=0.35 → UPL = $50/(1-0.35)=76.9

NonNon--food adjustment diagramfood adjustment diagram

Updating poverty lines over timeUpdating poverty lines over time
• Once poverty line is established, it is important to update it correctly for the new time period
• It is incorrect to recalculate poverty lines every year: by doing that we would use relative poverty lines (similar to urban/rural example)
• Two ways to go: – update old poverty line using new prices. That would
answer the question: How many people can afford the old basket now?
– update new poverty line using old prices. That would answer the question: How many people could afford the new basket in the past?
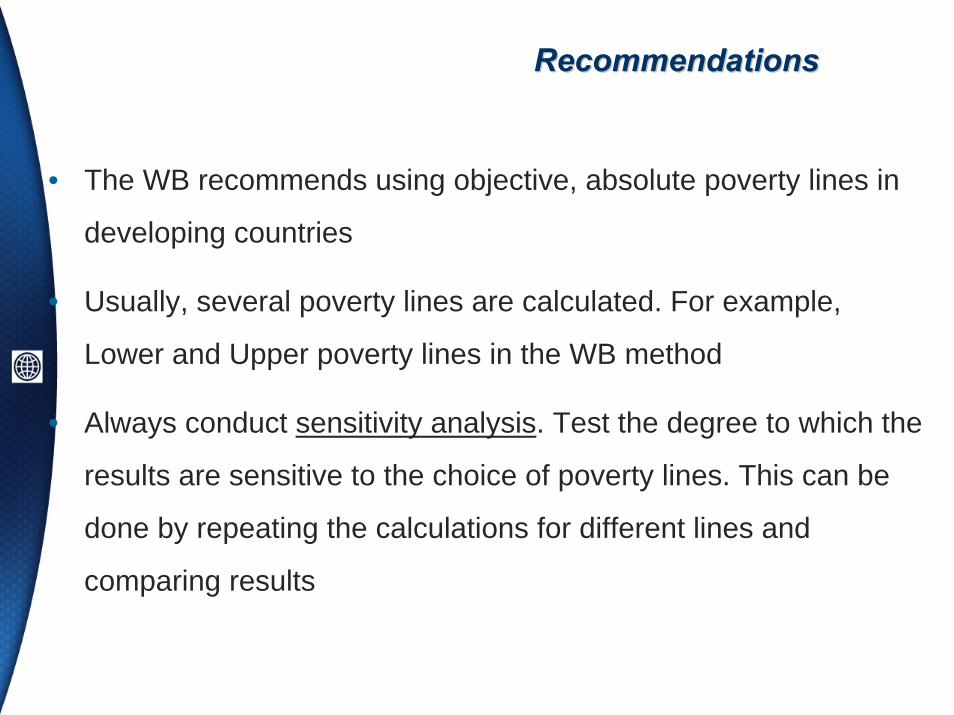
RecommendationsRecommendations
• The WB recommends using objective, absolute poverty lines in
developing countries
• Usually, several poverty lines are calculated. For example,
Lower and Upper poverty lines in the WB method
• Always conduct sensitivity analysis. Test the degree to which the
results are sensitive to the choice of poverty lines. This can be
done by repeating the calculations for different lines and
comparing results