Embed Size (px)
Citation preview
Poverty and inequality:
Unequal challenges ahead
Martin Ravallion
Georgetown University
Presentation at UNU-WIDER Conference, September 2018
Unequal challenges
• Two aspects of distribution: poverty and inequality.
– Falling absolute poverty measures in developing world.
– Rising inequality in many developing countries.
• Inequality is the greater challenge today for two reasons:
1. Growth in market economies tends to come with lower (absolute) poverty, but can be inequality increasing.
2. There is broad agreement that poverty should and can be eliminated, but no such consensus about inequality.
• The question for this talk:
Should, and can, this change?
2
• The motivational challenge: Why should we also care about inequality?
– The (intrinsic and instrumental) arguments for why we need to worry about inequality + counter arguments.
• The policy challenge: How might we have similar success against inequality?
– Poor performance of current policies; objectives and constraints on better policies; policy options.
3
Why do we care about inequality?
4
Zero income inequality is not the goal
• Straw-man arguments about “class warfare,” “socialism.”
• It can be agreed that there is (inter alia)
– heterogeneity in turning income into welfare +
– negative incentive effects of very low earnings inequality.
• The concern is with high inequality.
Is this concern justified?
5
Ethical objections to inequality
• Utilitarianism (sum of concave utility functions).
• Rights-based:
– fairness of processes, such as unfair trades
– unequal opportunities, esp. from circumstances of birth
– unequal outcomes today, to the extent that they create unequal opportunities for the next generation
– specific inequities (ethnic, gender, geographic) especially when due to discrimination
6
Costs of inequality
• High inequality threatens prospects for future economic growth and dampens the impact of growth on poverty.
– Credit constraints facing the poor and middle class.
– Political impediments to reform and public good provision (both left and right-wing populism).
– Social costs of higher crime, weaker social cohesion.
• Countries starting out with high inequality have a harder time growing their economy, and a harder time assuring that their growth is pro-poor.
• In short: Extreme, un-redressed, disparities threaten progress against poverty.
7
Some inequalities are stronger motivators for public action
• Between-group inequalities often have political salience
– Salience is far greater than the between-group component in standard inequality decompositions (Kanbur).
– Broad consensus today that certain “between-group inequalities” should be zero (gender, race, ethnicity).
• Inequality of opportunity has often motivated action.
• “Distributive justice” (Aristotle)
• “Égalité” in Declaration of Rights of Man and Citizen (1789).
• Lost output probably higher for INOP (WDR, 2006).
• Life in a new gilded age; high returns to rentiers (Piketty).
8
Counter arguments
9
“Development must be inegalitarian because it does not start in every part of the economy at
the same time.” (Arthur Lewis, 1976)
• However, the distribution of gains from growth depends on:
– The initial distribution of endowments (incl., human capital), and
– The nature of the growth process; sectoral/geographic pattern of growth; degree of competition in labor and output markets
• Both entail policy choices => “pro-poor growth” as the goal, not growth per se.
– Some growing developing economies see falling inequality.
• And feedback effect: high inequality can impede sustained (long-run) growth.
10
“Rising inequality is acceptable as long as the poorest are making progress”
(paraphrasing John Rawls, 1971)
• However:
– Dynamics: high inequality can stall future poverty reduction, even when poverty is falling now.
– Measurement: if we don’t agree on who are the poorest then a broader distributional perspective is needed.
11
“Everyone but an idiot knows that the lower classes must be kept poor or they will never be
industrious.” ( Arthur Young, 1771)
• Incentive defenses of inequality back to C18th.
– David Ricardo (1830s): “..it is in the natural order of things that the fund for the maintenance of the poor should progressively increase until it has absorbed all the net revenue of the country.”
• Accumulated evidence since has questioned these views.
– No sign that falling poverty tends to come with rising inequality (Ravallion).
– Incentive effects at the moderate MTRs from targeted transfers
are not a serious concern (Moffitt, Kanbur et al., Banerjee et al.).
• Of course, 100% MTR (“perfect targeting”) is clearly a bad idea.
12
How can we do better? 1. Better evidence (data + theory)
2. Better policies
13
Measures that better inform public debate
• “Inequality of what?” (Sen): We need to demonstrate welfare-relevance of our measures: money-metric utility/equivalent income is the most promising way forward, normative reference values (Fleurbaey and Maniquet).
• Better distributional data (weights; admin. data)
• Popular axioms of measurement are disconnected from public perceptions.
– Scale independence axiom (absolute vs relative inequality)
– Decomposability (as noted)
– Lack of attention to the floor (“nobody left behind”)
• Better evidence on performance of existing policies
14
Evidence on existing direct interventions in developing countries
Measurement concerns
• How much is “poor targeting” really “poor measurement?”
• Better evidence on fiscal incidence requires more serious attention to behavioral responses.– Past policy discussions have been polarized between those who
emphasize incentive effects and those who ignore them.
What does the evidence suggest about social protection (SP)?
• Only about one third of those in the poorest quintile are receiving help from SP policies.
• And worse performance in poorer countries. Cruel irony: poorer countries are less effective in reaching their poor.
15
Martin Ravallion, Interventions Against Poverty in Poor Places, WIDER Annual
Lecture 20, WIDER, 2017
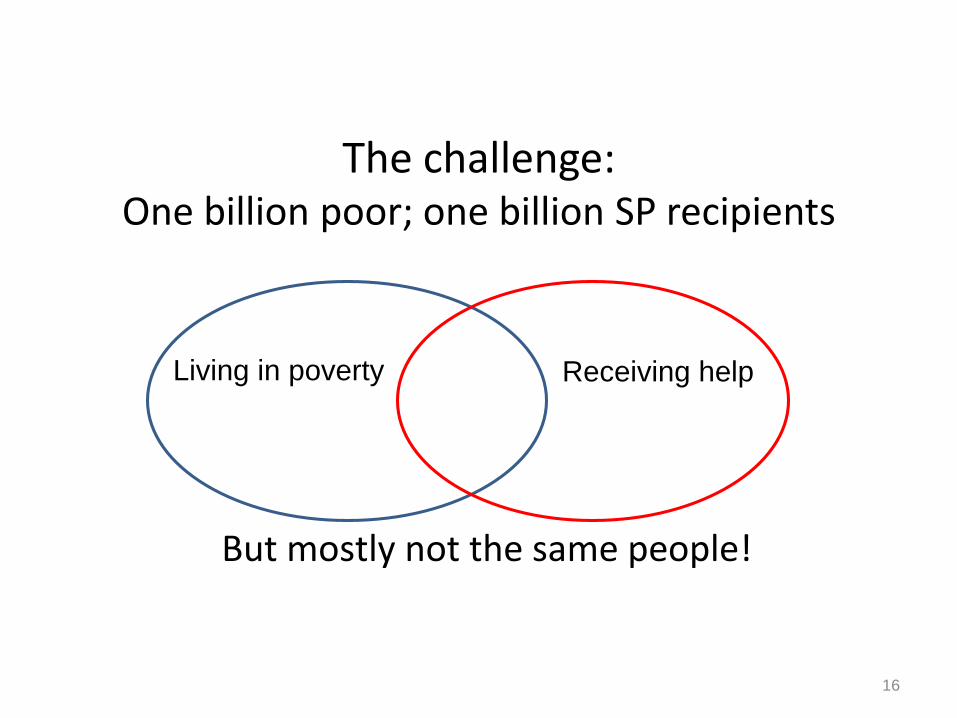
The challenge:One billion poor; one billion SP recipients
Living in poverty Receiving help
16
But mostly not the same people!
Current SP policies lift the floor by $0.50 a day, but almost all is social insurance
• Social spending lifted the floor by $0.48 per person per day on average, well below the mean spending per capita of $0.88 a day.
• The bulk of this impact is due to social insurance; social assistance on its own only lifts the floor by 1.5 cents per dayon average!
• The poorest would do far better from a (budget-neutral) universal basic income!
• The bulk of the variance in the effectiveness of social spending in reaching the poorest is due to the variance in levels of social spending rather than the efficiency of that spending in reaching the poorest.
17
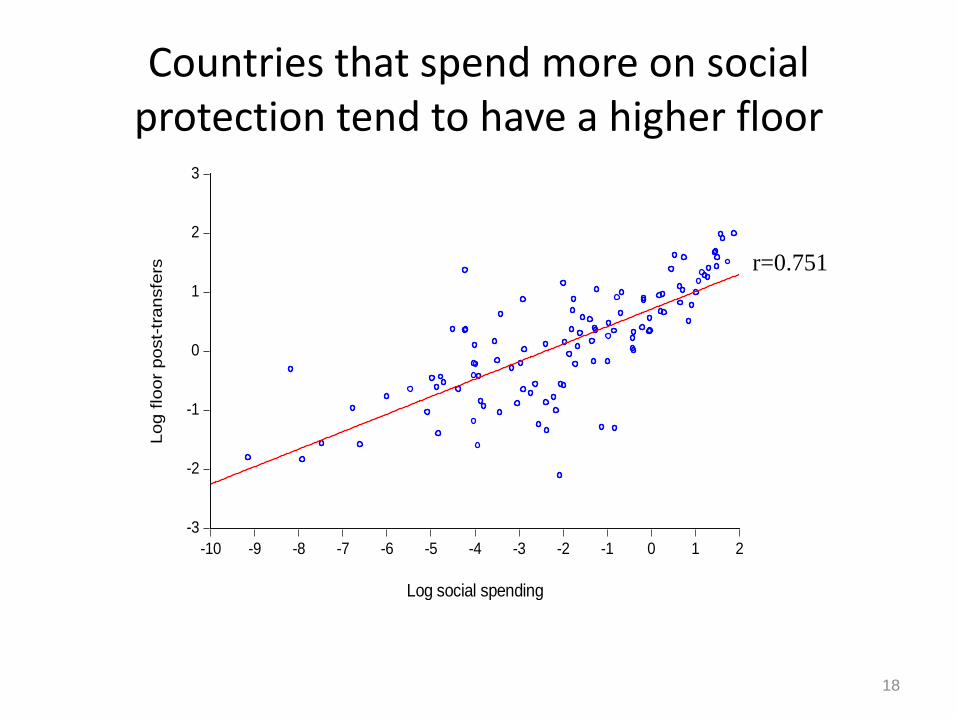
Countries that spend more on social protection tend to have a higher floor
18
-3
-2
-1
0
1
2
3
-10 -9 -8 -7 -6 -5 -4 -3 -2 -1 0 1 2
Log social spending
Log f
loor
post-
transfe
rs r=0.751
How can we do better? 1. Better evidence (data + theory)
2. Better policies
19
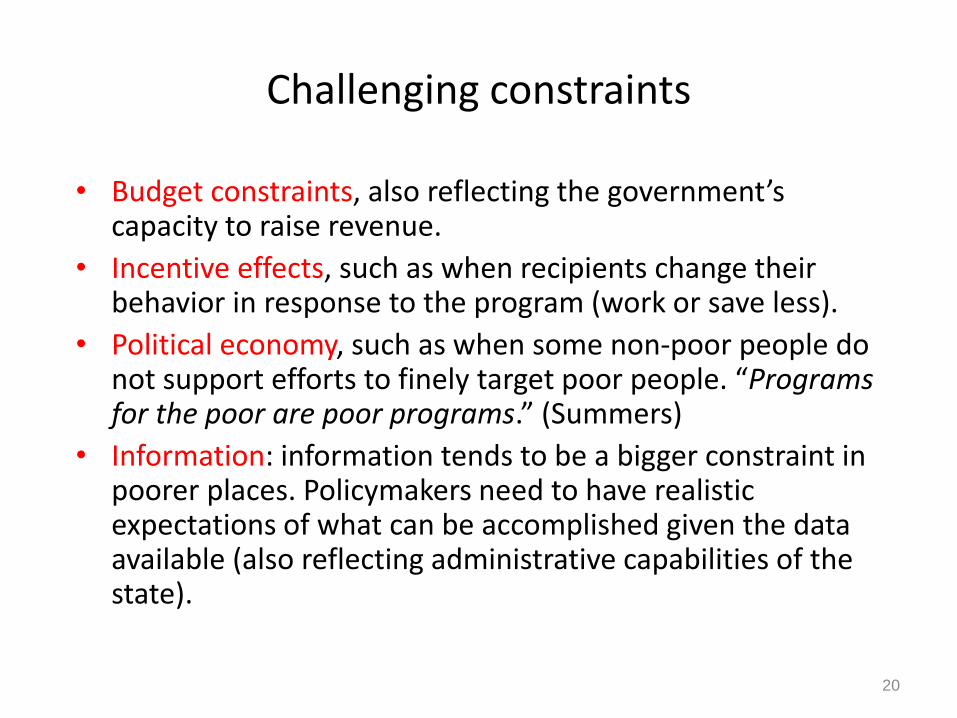
Challenging constraints
• Budget constraints, also reflecting the government’s capacity to raise revenue.
• Incentive effects, such as when recipients change their behavior in response to the program (work or save less).
• Political economy, such as when some non-poor people do not support efforts to finely target poor people. “Programs for the poor are poor programs.” (Summers)
• Information: information tends to be a bigger constraint in poorer places. Policymakers need to have realistic expectations of what can be accomplished given the data available (also reflecting administrative capabilities of the state).
20
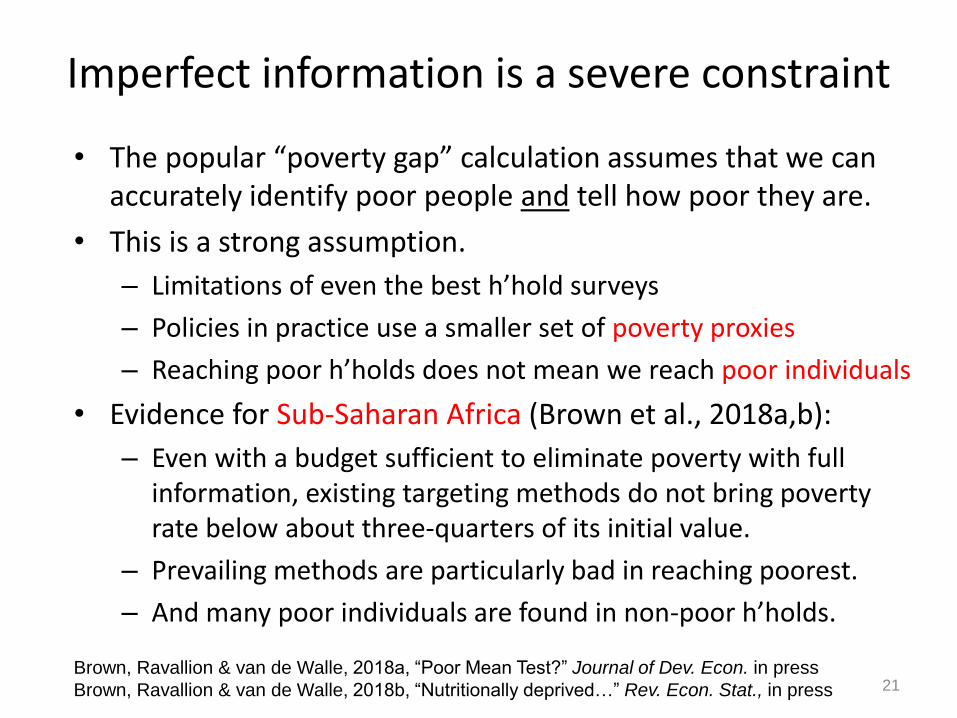
Imperfect information is a severe constraint
• The popular “poverty gap” calculation assumes that we can accurately identify poor people and tell how poor they are.
• This is a strong assumption.
– Limitations of even the best h’hold surveys
– Policies in practice use a smaller set of poverty proxies
– Reaching poor h’holds does not mean we reach poor individuals
• Evidence for Sub-Saharan Africa (Brown et al., 2018a,b):
– Even with a budget sufficient to eliminate poverty with full information, existing targeting methods do not bring poverty rate below about three-quarters of its initial value.
– Prevailing methods are particularly bad in reaching poorest.
– And many poor individuals are found in non-poor h’holds.
Brown, Ravallion & van de Walle, 2018a, “Poor Mean Test?” Journal of Dev. Econ. in press
Brown, Ravallion & van de Walle, 2018b, “Nutritionally deprived…” Rev. Econ. Stat., in press 21
A new role for redistributive interventions, but many challenges ahead
• Success against relative poverty and in raising the floor will almost certainly require more effective redistributive policies.
• No magic bullets. But some guiding principles.
– Don’t ignore incentive effects/behavioral responses, but don’t exaggerate them.
– Information and administrative constraints are key in practice:reliable fine targeting is rarely feasible in practice in developing economies.
– Method of financing is key to overall impact.
– The best option will vary with the setting/context.
22
A policy option to keep on the menu
• Basic full income – Universal basic income (UBI); all citizens (“poor” or not)– Cash plus imputed values of key in-kind services (health,
education)– Cash accumulates in an account for children until age 18 (say)
• Financed by cutting other subsidies and programs that bring little benefit to the poor + progressive income tax when feasible
• Supportive ID system (e.g., Aadhaar in India, but privacy concerns).
• UBI benchmark: we should do at least as well as a UBI• Key point: more inclusive, less finely targeted, policies can
have advantages in poor places; better incentive effects, more feasible informationally, more politically acceptable.
23
Conclusions
1. We need well-informed debates on both intrinsic and instrumental case + relevant measures
2. We need sensible policy proposals for both pro-poor growth and direct redistribution, tailored to the realities of the setting
3. We need to focus on distributional impact not finer “targeting” per se
4. We need policy-relevant monitoring and evaluation + learning from our mistakes
24
Thank you for your attention!