Embed Size (px)
Citation preview

DOT HS 811 807 July 2013
NASS-CDS: Sample Design and Weights

DISCLAIMER
This publication is distributed by the U.S. Department of Transportation, National Highway Traffic Safety Administration, in the interest of information exchange. The opinions, findings, and conclusions expressed in this publication are those of the authors and not necessarily those of the Department of Transportation or the National Highway Traffic Safety Administration. The United States Government assumes no liability for its contents or use thereof. If trade names, manufacturers’ names, or specific products are mentioned, it is because they are considered essential to the object of the publication and should not be construed as an endorsement. The United States Government does not endorse products or manufacturers.
Suggested APA Citation:
Zhang, F., & Chen, C-L. (2013, July). NASS-CDS: Sample Design and Weights. (Report No. DOT HS 811 807). Washington, DC: National Highway Traffic Safety Administration.
i
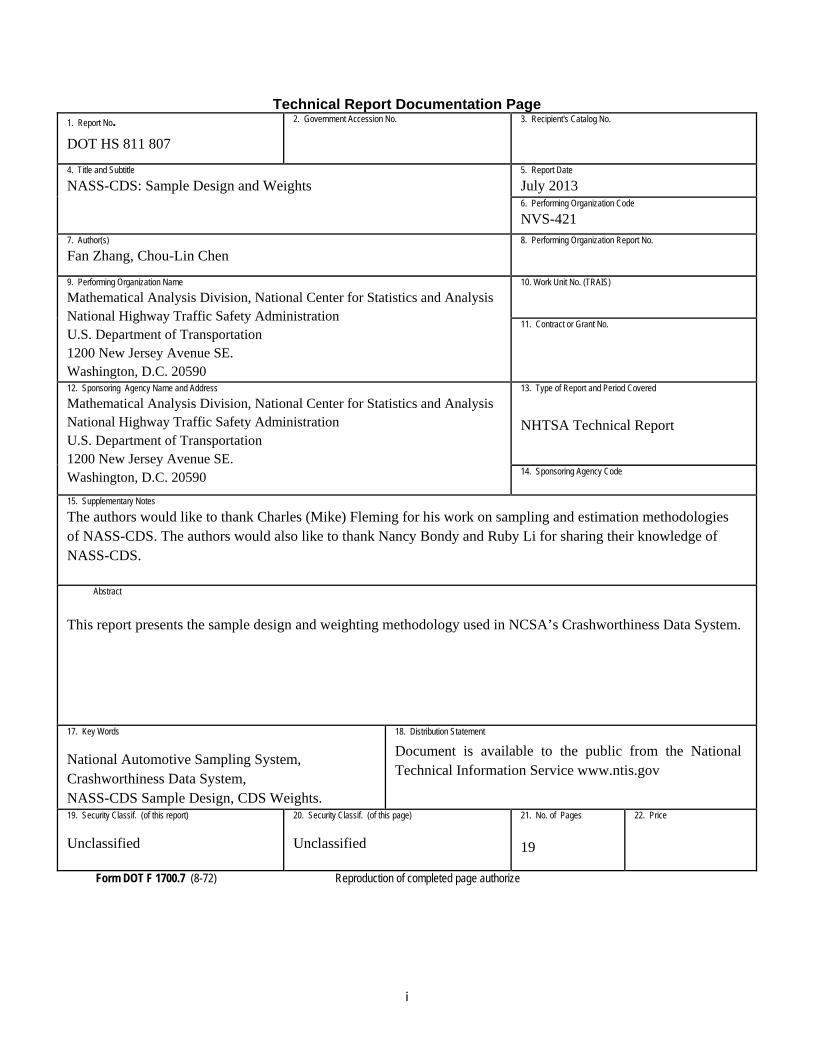
Technical Report Documentation Page 1. Report No. DOT HS 811 807
2. Government Accession No.
3. Recipient's Catalog No.
4. Title and Subtitle
NASS-CDS: Sample Design and Weights 5. Report Date
July 2013 6. Performing Organization Code
NVS-421 7. Author(s)
Fan Zhang, Chou-Lin Chen 8. Performing Organization Report No.
9. Performing Organization Name
Mathematical Analysis Division, National Center for Statistics and Analysis National Highway Traffic Safety Administration U.S. Department of Transportation 1200 New Jersey Avenue SE. Washington, D.C. 20590
10. Work Unit No. (TRAIS)
11. Contract or Grant No.
12. Sponsoring Agency Name and Address
Mathematical Analysis Division, National Center for Statistics and Analysis National Highway Traffic Safety Administration U.S. Department of Transportation 1200 New Jersey Avenue SE. Washington, D.C. 20590
13. Type of Report and Period Covered
NHTSA Technical Report
14. Sponsoring Agency Code
15. Supplementary Notes
The authors would like to thank Charles (Mike) Fleming for his work on sampling and estimation methodologies of NASS-CDS. The authors would also like to thank Nancy Bondy and Ruby Li for sharing their knowledge of NASS-CDS.
Abstract
This report presents the sample design and weighting methodology used in NCSA’s Crashworthiness Data System.
17. Key Words
National Automotive Sampling System, Crashworthiness Data System, NASS-CDS Sample Design, CDS Weights.
18. Distribution Statement
Document is available to the public from the National Technical Information Service www.ntis.gov
19. Security Classif. (of this report)
Unclassified
20. Security Classif. (of this page)
Unclassified
21. No. of Pages
19
22. Price
Form DOT F 1700.7 (8-72) Reproduction of completed page authorize

1
I. Introduction
The National Automotive Sampling System (NASS) is a nationwide motor vehicle crash data collection program operated by the National Center for Statistics and Analysis (NCSA) at the National Highway Traffic Safety Administration. The purpose of NASS is to produce statistics on national motor vehicle crashes and to provide a database for the development and the evaluation of motor vehicle and highway safety standards. See Web page www.nhtsa.gov/NASS for an overview of NASS.
NASS consists of two subsystems: the General Estimates System (GES) and the Crashworthiness Data System (CDS) – both probability sample surveys of police-reported motor vehicle traffic crashes across the country providing national estimates on crash, vehicle, and occupant characteristics. The GES collects information on motor vehicle traffic crashes from an annual sample of approximately 50,000 police crash reports (PARs). Shelton (1991) provided a detailed discussion of GES sampling and weighting procedures. The CDS, on the other hand, collects more detailed crash, vehicle, and occupant information, in addition to PARs, from a smaller annual sample of approximately 5,000 crashes by investigating motor vehicle crashes through interviews, medical records, vehicle inspection, and scene inspection. Fleming (2010) provided a detailed account of CDS sampling and weight calculation procedure as they were followed in CDS weighting production computer programs.
The purpose of this document is to explain how CDS weights are developed from its sample design. Section II is about CDS target population. Section III gives a description of CDS sample design. Section IV discusses the weight calculation procedure in CDS.

2
II. CDS Target Population
The NASS Crashworthiness Data System objectives are:
• Assess the overall state of traffic safety and identify the existing and potential traffic safety problems;
• Obtain detailed data on the crash performance of passenger cars, light trucks, vans, and sport utility vehicles with GVWRs less than 10,000 lbs.;
• Evaluate vehicle safety systems and designs; • Increase knowledge about the nature of crash injuries as well as the relationship between
the type and seriousness of a crash and the resultant injuries; and • Assess the effectiveness of motor vehicle and traffic safety program standards.
From these objectives, CDS target population is defined as police-reported motor vehicle traffic crashes involving at least one passenger car, pickup, van, or SUV (also called CDS applicable vehicles) that was towed from the scene due to damage.
A PAR is a report filled out by a police officer at the scene of a motor vehicle traffic crash. PARs make up the national sampling frame for NASS.
NASS CDS applicable vehicles are passenger cars, pickups, vans, or SUVs with gross vehicle weight ratings less than 10,000 lbs.
A NASS CDS-eligible crash must have at least one in-transport CDS-applicable vehicle involved in the crash that was towed away from the crash scene due to damage as indicated by the police report of the crash.
Damage is road vehicle damage that precludes departure of the vehicle from the scene of the accident in its usual operating manner by daylight after simple repairs (see ANSI D16.1, Section 2.3.11).
For more detailed discussion of CDS target population, see “Sampling Manual for the National Automotive Sampling System” (NHTSA, 2011).

3
∑
III. CDSSampleDesign
CDS sampling has a stratified, multiphase, unequal selection probability design. In this section, we give a brief description of the current CDS sample design.
Primary Sample Selection
The current CDS primary sampling unit (PSU) sample is related to the original NASS PSU sample first implemented in 1979. The original NASS was one system instead of two. In the original NASS, PSU was defined as a city, a county, or a group of counties with population size as close to 50,000 as possible. The PSU frame was stratified into 10 strata by urbanization and per capita service station sales. The PSU sample was selected by a stratified probability proportional to size (PPS) sampling method using estimated 1973 PSU population size as the measure of size (MOS). By 1986, NASS had 50 PSUs. See Kahane (1976) for more detail about the 1979 NASS PSU sample selection.
In 1988, NASS PSU sample was reselected as part of the effort to divide NASS into two components: the GES and the CDS. For the first stage of NASS sample selection, the United States was partitioned into 1,195 PSUs. A NASS PSU can be a county, a group of counties, a central city, or a portion of a large county excluding a central city. The PSUs were then stratified into 12 strata consisted of four geographic regions (Northeast, South, Central, and West) and three urbanization types (Large Central City, Large Suburban Area, and All Others). In 1988, a total of 36 PSUs were selected as both NASS-CDS and NASS-GES PSU sample from the 12 strata with at least two PSUs per stratum. The selection probabilities are proportional to the PSUs’ 1983 injury and fatal counts. No certainty PSUs were selected. To reduce the cost, a Keyfitz-based procedure (Keyfitz, 1951) was used to maximize the overlap of the 36 PSUs in the new CDS PSU sample with the 50 PSUs in the existing NASS PSU sample. As the result, among the 36 selected PSUs, 30 were from the existing NASS PSU sample, 6 were new PSUs. After the NASS-CDS PSU sample was selected, an additional 24 PSUs were selected to supplement NASS-GES PSU sample. The current GES has total 60 PSUs. See Bondy and Rhea (1997) for more detail about CDS and GES PSU sample selection.
In 1991, because of budget reduction, the 36 CDS PSU sample was reduced to 24 PSUs with 2 PSUs per stratum by a PPS sub-sampling from strata with more than 2 CDS PSUs using 1983 injury and fatality count. These 24 PSUs are the currently used CDS PSUs. Therefore, the current CDS PSU sample can be viewed as the result of a two-phase PPS sampling. Table 1 lists the 1991 CDS PSU frame and sample sizes by strata.
The selection probabilities for the 36 PSUs selected in 1988 can be expressed as:
.
Here refers to PSU in stratum , is the selection probability of the PSU for the 1988’s 36 PSU sample, is PSU sample size for stratum , is 1983 injury and fatal count for PSU .
4
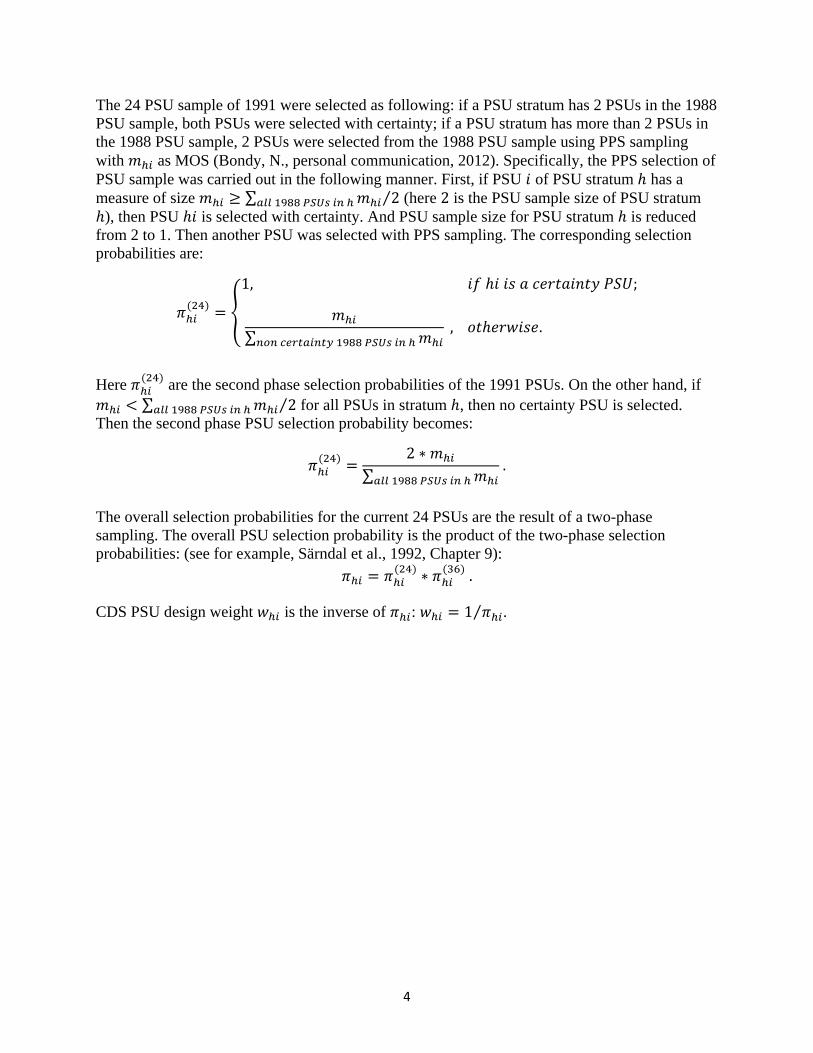
The 24 PSU sample of 1991 were selected as following: if a PSU stratum has 2 PSUs in the 1988 PSU sample, both PSUs were selected with certainty; if a PSU stratum has more than 2 PSUs in the 1988 PSU sample, 2 PSUs were selected from the 1988 PSU sample using PPS sampling with as MOS (Bondy, N., personal communication, 2012). Specifically, the PPS selection of PSU sa anner. First, if PSU m
mple was carried out in the following m of PSU stratum has a easure of size (here is the PSU sample size of
is selected with cer nd PSU sample size for PSU stratum PSU stratum
), then PSU tainty. A is reduced from 2 to 1. Then another PSU was selected
∑
with PPS sa
⁄2 2
mpling. The corresponding selection probabilities are:
, .
1, ;
∑
Here
Then the second phase PSU sel
are the second phase select
ion probabilities of the 1991 PSUs. On the other hand, if for all PSUs in stratum , then no certainty PSU is selected. ection probability becomes:
2 ∗.
∑
The overall selection probabilities for the current 24 PSUs are the result of a two-phase sampling. The overall PSU selection probability is the product of the two-phase selection probabilities: (see for example, Särndal et al., 1992, Chapter 9):
∗ .
CDS PSU design weight is the inverse of
: . 1⁄
∑ 2⁄

5
Table 1: 1991 CDS Frame and Sample Sizes by Strata
Strata PSU Frame Size PSU Sample Size
Northeast
Large Central City 19 2
Large Suburban 69 2
All Other 94 2
Midwest
Large Central City 15 2
Large Suburban 79 2
All Other 280 2
South
Large Central City 21 2
Large Suburban 87 2
All Other 368 2
West
Large Central City 12 2
Large Suburban 42 2
All Other 109 2
Total 1,195 24
Secondary Sample Selection
The secondary sample selection in CDS is the selection of police jurisdictions (PJs). Within each selected PSU, PARs were assembled and stored by police jurisdictions. Therefore, it is operationally more efficient to treat PJs as the next stage sampling units. All PJs within the selected PSU constitute the sampling frame of the secondary sampling. For each PJ, the number of instances in which at least one death, or at least one incapacitating injury, or at least one non-incapacitating injury had occurred (abbreviated by KAB) was calculated using 1992 data for each PJ. Table 2 lists NASS defined injury types. PJs were then sorted by KAB in a descending order. A probability sample of PJs within each selected PSU was selected using PPS sampling with PJ’s 1992 KAB as measure of size. An average of 7 PJs were selected within each PSU. Total about 170 PJs were selected. The current PJ sample was selected in 1995 using 1992 KAB data. PJ sample selection was conducted independently for each selected PSU. Therefore, CDS secondary sample selection resembles a one stage PPS sample selection of PJs. Specifically, the PPS selection of PJ sameasure of size
), then PJ
anner. First, if PJ is the origina
mple was carried out in the following m (here
is selected with certaint∑
1
y. And PJ sa⁄
mple size for PSU
of PSU has a l PJ sample size in PSU is reduced from the
original size to . This process is perform til thPJ. Assuming the total number of certainty PJs is , a sample of non-certainty PJs of size
was then selected from the remaining non-certainty PJs using PPS with MOS=The PJ selection probability can be expressed as:
ed repeatedly un ere is no more certainty
.

6
|
∑
The inverse of is the PJ design weight: . | ||
,
1⁄
1, ;
.
Table 2: NASS-Defined Injury Types
NASS Injury Type Description
K Fatal Injury
A Incapacitating Injury
B Non‐incapacitating Injury
C Possible Injury
O No Injury
U Injured but Severity Unknown
Source: National Automotive Sampling System – NASS Sampling, Part One, 2000. Transportation Safety Institute, Highway Safety Division, NASS Training Branch DTI-71. Tertiary Sample Selection CDS tertiary sample selection is the selection of PARs. In addition to the information on PARs, CDS also collects more detailed crash, vehicle and occupant information. Researchers conduct vehicle and scene inspections and interview people involved in the crashes. CDS PAR selection is performed weekly so that the evidence is still intact and the memory of the people involved in the crash is still fresh. Once a week, researchers visit all the selected PJs to obtain all new PARs accumulated since last visit. In this sense, the PARs in the selected PJs are first stratified by the weeks of the year.
Within each week stratum , all PARs accumulated since last visit are then reviewed and classified into 14 “PAR strata”: A, B, C, D, E, F, G, H, J, K, X, Y, Z, N (see Appendix A for a narrative definition). Among them, ten PAR strata are CDS applicable PARs (A, B, C, D, E, F, G, H, J, K). See Table 3 for detailed definitions. This process is called PAR listing. The CDS sample is selected from the CDS applicable PARs. The classified PARs are entered into a computer system for further sub-sampling.
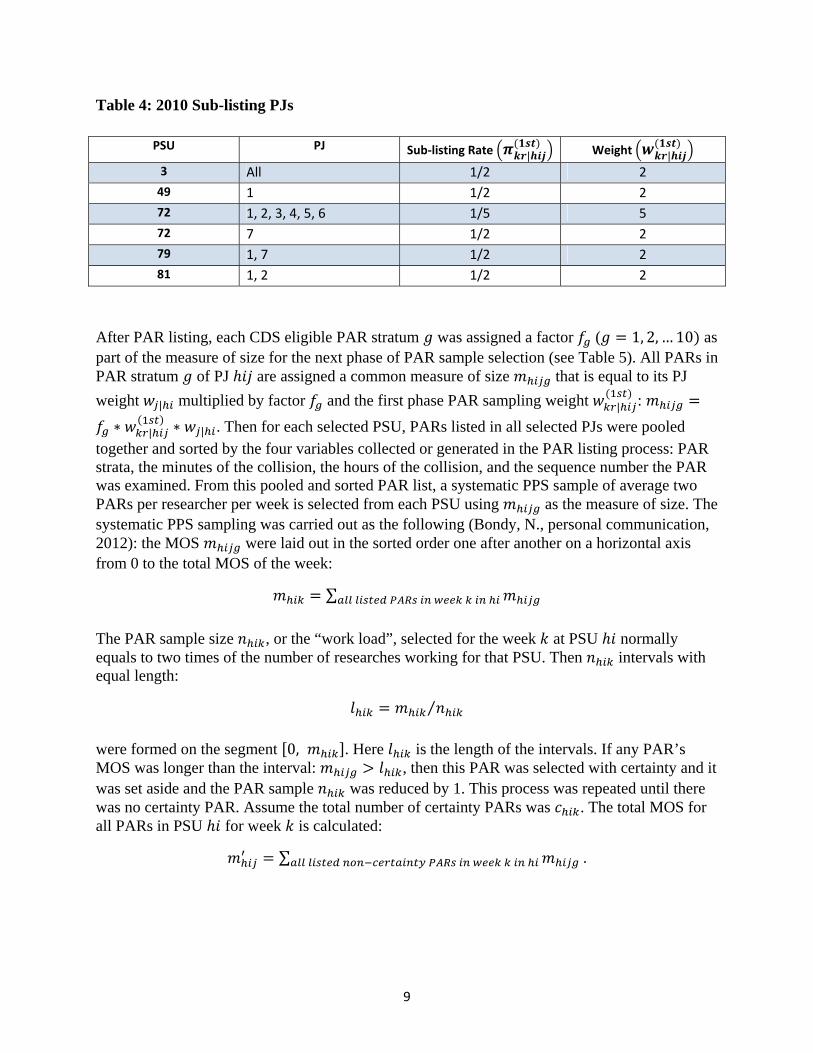
In some large PJs there are too many PARs to be examined and listed by the researchers working at the PSU. For these PJs, only 1 of every 2, or 1 of every 5 PARs are examined and listed. These PJs are called “sub-listing PJs.” Sub-listing PJs may vary from year to year. See Table 4 for a list of sub-listing PJs in 2010.

7
In the PAR listing process, only the information about the time of the collision and the PAR strata identification information are recorded for classification in order to select subsample of PARs. Therefore, PAR listing can be viewed as one phase of PAR selection. For the sub-listing PJs, the listed PARs are a systematic sample of all PARs (Li, R., personal communication, 2011). For the non-sub-listing PJs, the listed PARs are selected with certainty. Therefore, each listed PAR is selected with probability 1, 0.5 or 0.2. The inclusion probability of PAR in PJ for this first phase of PAR sampling is:
| 0.2, 72, 1 6;1, ;
0.5, .
The corresponding weight for the first phase of PAR sampling is: | |
1
.
Every quarter, researchers visit the non-sampled PJs in the selected PSU (PJs that are not included in the weekly visits schedule) to collect PAR counts by PAR strata. All new PARs since last visit will be listed by PAR strata. The total PAR counts by PAR strata will be used later in post-stratification.

8
Table 3: NASS-CDS PAR Strata (NASS 2011)
Late Model
Year
(LMY)
Motor
Vehicle
Involvement
MOST SEVERE POLICE REPORTED INJURY
IN A TOWED CDS-APPLICABLE MOTOR VEHICLE
FATA
L IN
JURY
TRANSPORTED NOT TRANSPORTED
Serious Injury “A”
Injury
Or
Unknown
If
Injured
“B,” “C”
or “U”
Injured, Not Injured or Unknown, If Injured
“A,” “B,” “C,” “O” or “U”
Single
CDS
Applicable
Vehicle
Multiple
CDS
Applicable
Vehicles
TOWED AT LEAST
TWO TOWED
ONLY ONE
TOWED
At Least
One CDS
Applicable Motor Vehicle
Was Towed
No CDS-applicable
Motor Vehicles
Were Towed
Hosp
italiz
ed
Not
Hos
pita
lized
Hosp
italiz
ed
Not
Hos
pita
lized
Injury in Towed, LMY
CDS-applicable Motor Vehicle
A J C J C E G
NOT
IN
SCOPE
Injury in Towed, Non-
LMY CDS-applicable
Motor Vehicle
B K D K D F H
Source: National Automotive Sampling System – NASS Sampling, Part One, 2000. Transportation Safety Institute, Highway Safety Division, NASS Training Branch DTI-71.
9
Table 4: 2010 Sub-listing PJs
PSU PJ Sub‐listing Rate Weight
3 All 1/2 2
49 1 1/2 2
72 1, 2, 3, 4, 5, 6 1/5 5
72 7 1/2 2
79 1, 7 1/2 2
81 1, 2 1/2 2
| |
After PAR listing, each CDS eligible PAR stratum was assigned a factor ( as part of the measure of size for the next phase of PAR sample selection (see Table 5). All PARs in PAR stratum
∗
of PJ
∗|
are assigned a common measure of size that is equaweight multiplied by factor and the first phase PAR sampling weight
. Then for each selected PSU, PARs listed in all selected PJs were pooled|
l to its PJ :
together and sorted by the four
| |
variables collected or generated in the PAR listing process: PAR strata, the minutes of the collision, the hours of the collision, and the sequence number the PAR was examined. From this pooled and sorted PAR list, a systematic PPS sample of average two PARs per researcher per week is selected from each PSU using as the measure of size. The systematic PPS sam2012): the MOS from 0 to the total MOS of
pling was carried out as the following (Bondy, N., personal communication, were laid out in the sorted order one after another on a horizontal axis
the week:
1, 2, … 10
∑
The PAR sample size , or the “work load”, selected for the week at PSU normally equals to two times of the number of researches working for that PSU. Then intervals with equal length:
⁄
were formed on the segment . Here is the length of the intervals. If any PAR’s MOS was longer than the interval: , then this PAR was selected with certainty and it was set aside and the PAR sample was reduced by 1. This process was repeated until there was no certainty PAR. Assume the total number of certainty PARs was . The total MOS for all PARs in PSU for week is calculated:
0,
∑ .

10
And equal intervals with common length:
⁄
were formed on the segment 0, . Then a random number is generated in
s selected.
0, and a
systematic sample of size wa
Table 5: Measure of Size Factor by PAR Strata
PAR Strata A B C D E F G H J K
400 400 175 25 7 3 2 1 400 300
Source: Fleming, 2010.
The PAR strata created in the PAR listing process are actually used to ensure there will be enough severe crashes/injuries selected into the sample over the year by assigning a large measure of size factor to corresponding PAR strata. Let desired sample sizes for the PAR strata over the year, PARs for the PAR strata estimated from historical data, then
( ( =1, 2, …, 10) be the known
=1, 2, …, 10) be the total number of ( =1, 2, …, 10) can be
determined by solving the following linear equations:
∑ ∑
, 1, 2, … , 10 .
PAR stratum variable is also used as a sorting variable for PAR selection but it is not explicitly used as a stratification variable. And not all PAR strata have at least one PAR selected every week.
The above systematic sampling of PARs produces PPS selection probabilities. The second phase PAR selection probabilities are:
| 1, ;
⁄ , ..
The overall tertiary selection probability is the product of the selection probabilities of the two phases:
| | | .
And the tertiary sampling unit design weights are: | | .

11
IV. CDSWeights
CDS has a stratified multiphase sample design. The overall design weight (or base weight) is the product of the design weights at all phases/stages:
∗ | ∗ | .
Here |
is PAR, |
is PAR stratum, is PJ, is PSU, is PSU stratum, is week. are the primary, secondary, and tertiary sampling design weights.
The current CDS PSU sample has been selected and used since 1991. The current CDS PJ sample has been selected and used since 1995. The PAR sample is selected weekly. Unit non-response is rare in CDS.
To correct potential non-response and coverageperformed to the design weights strata and collapsed PAR strata. Here PSU strata aThe original 10 PAR strata ( =1, 2, …, 10) are collapsed in
bias, a post-stratification adjustment is . The post-strata are cross tabulate of two variables: PSU
re the 12 original PSU strata ( =1, 2, …, 12). to 7 larger PAR strata (
because the population counts for the non-sampled PJs are collected quarterly therefore variables such as hospitalization cannot be determined (Bondy, N., personal communication, 2012). The definition for the collapsed PAR strata can be found in Table 6. There are 84 (12*7) possible
=1, 2, …, 7)
post-strata.
, ,
Table 6: Collapsed PAR strata
Collapsed PAR Strata AB CJ DK E F G H
Original PAR Strata A & B C & J D & K E F G H
To calculate the post-stratum adjustment factor, two estimates of post-stratum population total are calculated. The first estimate is the summation of design weights of all selected PARs in each post-stratum :
∑ ∑ ∑ ∑ ∑ .
Here is collapsed PAR stratum. is a population total estimate of post-stratum using observed PARs therefore subject to non-response bias or coverage bias. The second post-stratum population total estimate uses PSU level listed PAR total estimates:
∑ ∑ .

12
Here is PSU weight. is the summall non-sampled PJs in PSU . sampled PJs in PSU over the year:
ation of four quarters of PARs in PAR stratum for is an estimate of total PARs in PAR stratum in all
∑ ∑ ∑ .
Here total listed and unlisted PARs estimate than
| is the first phase PAR sampling weight (Table 4) for the sampled PJs. is the from both sampled and non-sampled PJs and is considered a better
for the total number of PARs in post-stratum
The post-stratification adjustment factor for post-stratum is defined as:
.
|
.
And the CDS final weight is:
∗ .
corresponds to the case weight variable RATWGT in CDS files.

13
VIII. Reference
ANSI D16.1, Section 2.3.11: http://www-nrd.nhtsa.dot.gov/Pubs/07D16.pdf
Bondy, N., & Rhea, B. (1997, September). Reweighting of the Primary Sampling Units in the National Automotive Sampling System. (Research Note). Washington, DC: National Highway Traffic Safety Administration. Available at www-nrd.nhtsa.dot.gov/Pubs/97.845.pdf
Fleming, C. (2010, May). Sampling and Estimation Methodologies of CDS. (Report No. DOT HS 811 327). Washington, DC: National Highway Traffic Safety Administration. Available at www-nrd.nhtsa.dot.gov/Pubs/811327.pdf
Kahane, C. J. (1976). National Accident Sampling System Selection of Primary Sampling Units. (Report No. DOT HS 802 063). Washington, DC: National Highway Traffic Safety Administration.
Keyfitz, N. (1951). Sampling with Probabilities Proportionate to Size: Adjustment for Changes in Probabilities. Journal of the American Statistician Association, 46, pp. 105-109.
NHTSA. (2011). Sampling Manual for the National Automotive Sampling System. Washington, DC: National Highway Traffic Safety Administration.
Särndal, C-E., Swensson, B., & Wretman, J. (1992). Model Assisted Survey Sampling. New York: Springer-Verlag.
Shelton, T. S. T. (1991, December). National Accident Sampling System, General Estimates System Technical Note, 1988 to 1990. (Report No. DOT HS 807 796). Washington, DC: National Highway Traffic Safety Administration. . Available at www-nrd.nhtsa.dot.gov/Pubs/807796.pdf
14
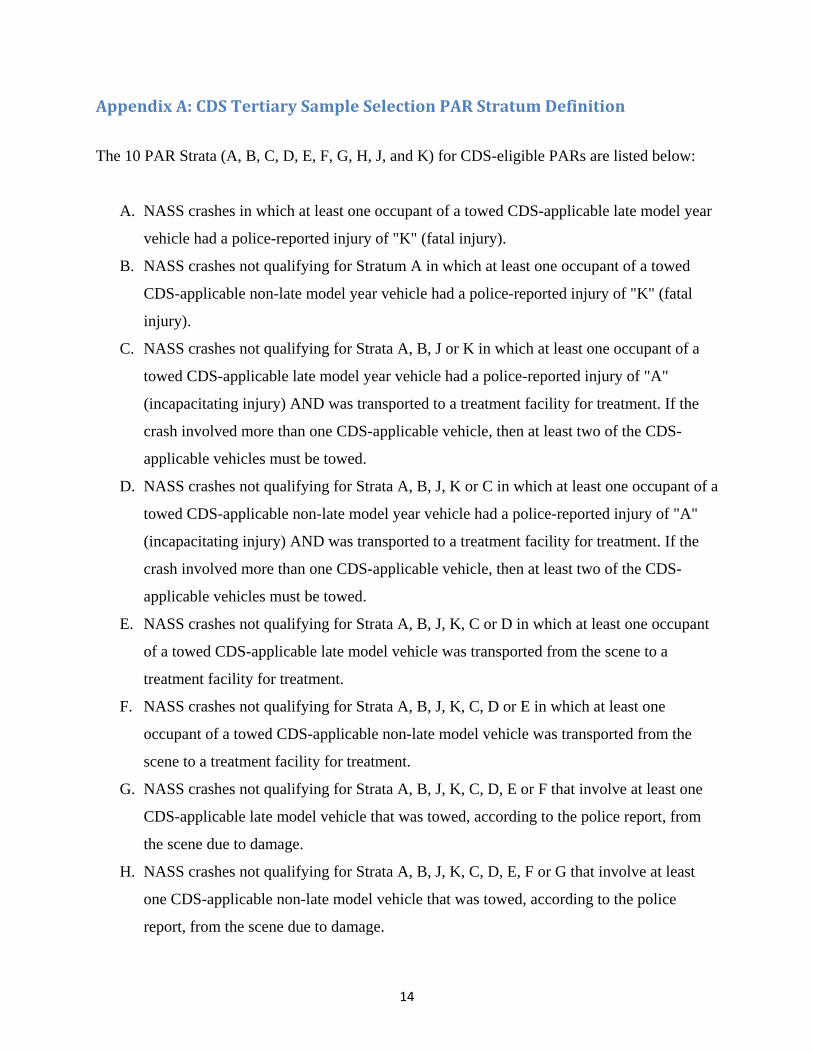
Appendix A: CDS Tertiary Sample Selection PAR Stratum Definition
The 10 PAR Strata (A, B, C, D, E, F, G, H, J, and K) for CDS-eligible PARs are listed below:
A. NASS crashes in which at least one occupant of a towed CDS-applicable late model year
vehicle had a police-reported injury of "K" (fatal injury).
B. NASS crashes not qualifying for Stratum A in which at least one occupant of a towed
CDS-applicable non-late model year vehicle had a police-reported injury of "K" (fatal
injury).
C. NASS crashes not qualifying for Strata A, B, J or K in which at least one occupant of a
towed CDS-applicable late model year vehicle had a police-reported injury of "A"
(incapacitating injury) AND was transported to a treatment facility for treatment. If the
crash involved more than one CDS-applicable vehicle, then at least two of the CDS-
applicable vehicles must be towed.
D. NASS crashes not qualifying for Strata A, B, J, K or C in which at least one occupant of a
towed CDS-applicable non-late model year vehicle had a police-reported injury of "A"
(incapacitating injury) AND was transported to a treatment facility for treatment. If the
crash involved more than one CDS-applicable vehicle, then at least two of the CDS-
applicable vehicles must be towed.
E. NASS crashes not qualifying for Strata A, B, J, K, C or D in which at least one occupant
of a towed CDS-applicable late model vehicle was transported from the scene to a
treatment facility for treatment.
F. NASS crashes not qualifying for Strata A, B, J, K, C, D or E in which at least one
occupant of a towed CDS-applicable non-late model vehicle was transported from the
scene to a treatment facility for treatment.
G. NASS crashes not qualifying for Strata A, B, J, K, C, D, E or F that involve at least one
CDS-applicable late model vehicle that was towed, according to the police report, from
the scene due to damage.
H. NASS crashes not qualifying for Strata A, B, J, K, C, D, E, F or G that involve at least
one CDS-applicable non-late model vehicle that was towed, according to the police
report, from the scene due to damage.

15
J. NASS crashes not qualifying for Strata A or B in which at least one occupant of a towed
CDS-applicable late model year vehicle had a police-reported injury of "A"
(incapacitating injury) AND was transported to a treatment facility for treatment AND
was admitted overnight to the hospital. If the crash involved more than one CDS-
applicable vehicle, at least two of the CDS-applicable vehicles must be towed.
K. NASS crashes not qualifying for Strata A, B or J in which at least one occupant of a
towed CDS-applicable non late model year vehicle had a police-reported injury of "A"
(incapacitating injury) AND was transported to a treatment facility for treatment AND
was admitted overnight to the hospital. If the crash involved more than one CDS-
applicable vehicle, at least two of the CDS-applicable vehicles must be towed.
All CDS-applicable crashes are also GES applicable crashes. GES applicable but not CDS-
applicable crashes are defined as strata X, Y, and Z:
X. NASS crashes not qualifying for the CDS strata, involving at least one medium or heavy
truck in which a non-CDS-applicable motor vehicle was towed due to damage, or at least
one involved person had a police-reported injury of “K” (fatal injury), “A”
(incapacitating injury), “B” (non-incapacitating injury), or “C” (possible injury).
Transported status is not a consideration.
Y. NASS crashes not qualifying for the CDS Strata or Stratum X in which none of the motor
vehicles involved in the crash was a medium or heavy truck and at least one person
involved in the crash had a police-reported injury of “K” (fatal injury), “A”
(incapacitating injury), or “B” (non-incapacitating injury). Transported status is not a
consideration.
Z. NASS crashes not qualifying for the CDS Strata, Stratum X or Stratum Y.
In 2008, NASS added a non-NASS (non-GES eligible and non-CDS eligible) stratum N:
N. Crashes not qualifying for NASS CDS or GES, involving motor vehicle crashes
occurring outside the trafficway (non traffic crashes) that result in injury or death.
Transport status is not a consideration. Cases in this stratum are NiTS cases.

DOT HS 811 807 July 2013
9550-071913-v3a