Embed Size (px)
Citation preview

NASAReferencePublication1277
1992
National Aeronautics and
Space Administration
Office of Management
Scientific and TechnicalInformation Program
NASA Wallops FlightAir-Sea Interaction
Facility
Steven R. Long
Wallops Flight Facility
Wallops Island, Virginia
FacilityResearch
https://ntrs.nasa.gov/search.jsp?R=19920016738 2018-05-30T08:43:41+00:00Z


-,Ot_lvatlmal Sdace Brach-- InteractionResearchFacility
iii
PR£CEDING PAGE BLANK NOT FILMED

TABLE OF CONTENTS
1. INTRODUCTION
2. RATIONALE
3. HISTORY 2
4. THE PHYSICAL DESCRIPTION OF NASIRF 3
5. INSTRUMENTATION 4
6. SPECIAL TEST CAPABILITY 9
7. EXAMPLES OF RESULTS 9
8. REFERENCES 17
9. LIST OF FIGURES 18
10. ACKNOWLEDGEMENTS 19
11. INVITATION 19
PI_C,E_t,,_ P'AG,E BLA,"_ NOT FILMED

1. INTRODUCTION
This publication serves as an introduction to the Air-Sea Interaction Research Facility at NASA's
Wallops Flight Facility, part of Goddard Space Flight Center, and located on Virginia's Eastern
Shore near Chincoteague, VA. The purpose of this publication is to provide background
information on the research facility itself, including capabilities, available instrumentation, the
types of experiments already done, those ongoing, and future plans. But first, let's consider why
this unique facility is there.
2. RATIONALE
Air-sea interaction processes are complicated phenomena. The difficulty lies in the fact that all
the motions are inter-related in a way that is highly nonlinear. As an example, take the
well-posed problem of wind wave generation that has been the goal for generations of
oceanographers and fluid dynamists: the solution is still elusive. To solve this problem, one must
know the nonlinear wave-wave interactions, the details of momentum and energy fluxes, and the
dissipation mechanisms of the waves. Thus the well-posed problem encompasses a host of subsets
of inter-related problems, each of which has its own impasse, and the sum of them makes the
total problem intractable. It is clear to all investigators that in order to make progress, one would
have to break up the problem into single dynamic components. It is perfectly possible that the
sum of the components can be different from the whole. However, we can gain a certain
understanding of the complicated processes involved, and this is our goal.
While much can be learned from field observations from ships, buoys, and aircraft, the many
processes that participate in air-sea interaction also need to be studied under controlled conditions
in the laboratory. While laboratory experiments can not simulate open ocean conditions,
participant processes can be modeled and better understood.
The well-posed component problems, once defined, can be solved either theoretically or
experimentally. The theoretical solutions invariably involve simplifying assumptions, and the
experimental solutions typically have unexpected complications. This is especially true for field
experiments, which are by definition the ultimate tests of the truth. But the uncontrollable
environmental conditions almost always make the results short of being complete ( not the
desired conditions, conditions too severe for safety, conditions not steady enough for a complete
test set, etc.). Limited by the prohibitive cost of a full field test, laboratory experiments offer
simple and inexpensive alternatives with the understood limitations on the dynamic variability.
It is fully appreciated that the laboratory conditions cannot simulate the natural environment in
total. It is, however, also realized that if a problem is clearly defined and its dynamic processes
identified, a laboratory experiment will be the most cost-effective way to produce a reasonable
answer as a guide for full field verification. The laboratory experiments are the intermediate steps
toward the full solution of the problem. It is with this understanding that the NASA Air-Sea
Interaction R._esearch Facility (NASIRF) was conceived and constructed.
3. HISTORY
The construction of the NASA Air-Sea Interaction Research Facility (NASIRF) was initiated in
1975 to provide basic scientific research and support for the GEOS-3 and SEASAT-1 satellite
remote sensing projects. Primary objectives are to use the laboratory to test theoretical results and
to collect empirical data for the development of remote sensing techniques, in support of
microwave remote sensor technique development for air-sea interaction studies. With this goalin mind, the
most important surface phenomena needing research are the variations of the short gravity or the
gravity-capillary waves under the actions of wind and ambient currents. These short waves are
the most amenable ones to laboratory studies. Therefore, the interactions of wind, waves, and
currents are central processes to be studied.
The main wind-wave-current research tank was designed by John van Overeem together with
Norden E. Huang and Steven R. Long. The construction started at Wallops in early 1975 under
the direction of Ken Calvert, assisted by Cris Lankford, Ed White, and others from the Wallops
machine shop. It was finished by the beginning of 1977, when the first experiments were done.
The initial instrumentation and data processing systems were designed around the
Hewlett-Packard 9825 desktop calculators then available, and was developed and interfaced by
Steven R. Long with the assistance of Bob Snyder. The first test result based on data from the
new facility on the probability structure of the wind wave surface was published in 1980, using
a capacitance-type wave probe of a new self-zeroing design developed and constructed at Wallops
by Bob Snyder. The first hydraulic wave generator from Chant Engineering was designed and
installed by Dave Moltedo. The second identical unit for waves in the opposite direction was
installed by Granville Taylor. The next step in instrumentation expansion was built around the
4 channel HP spectrum analyzer, the 5451C, based on the early HP1000E mini-computers, and
developed by Steven R. Long with the assistance of Larry F. Bliven. With the development of
the mini-computer, we were able to expand to 16 data input channels, and a vastly more flexible
software environment by moving to the HP1000F mini-computer system, developed by Larry F.
Bliven with the assistance of Steven R. Long. The final step to our current capability came full
circle back to the desktop with the rise of the personal computer and its associated hardware and
software. Using multiple PC's, the present automated capability for A/D data acquisition, control,
timing, archiving, computing, and graphical output was developed by Steven R. Long.
A second square tank was constructed in 1989 by Empire Fiberglass Co., based on a design by
Norden E. Huang, for directional wave-current interaction studies. It was installed by the Wallops
machine shop crew led by Bill Herz, and fully plumbed by Brett Mariner and Eddie Procaccio.
Limited by the facility funds, the tank has not yet been fully instrumented, but is being added
to and gradually developed in annual increments.
2
4. THE PHYSICAL DESCRIPTION OF NASIRF
The main wind-wave-current interaction tank is shown in figure 1. The main test section is 60
ft (18.29 m) in length, 4 ft (1.22 m) in height, and 3 ft (0.91 m) in width. Its operational water
depth is 2.5 ft (0.76m) with 1.5 ft (0.45 m) remaining for air flow.
The wind is generated by a Trane suction fan located at one end of the tank and driven by a 25
HP motor. An electronic control board ( U. S. Varidyne 2000 Inverter ) has been installed in
1991 to control on/off, the speed, and the direction of the fan blades digitally through a personal
computer (PC), so that any steady wind velocity or variation between 0 and 20 m/s at a reference
height of 0.1 m above the mean water surface can be programmed.
Water current can be generated within the tank by a pump driven by a 15 HP motor. The
maximum current of 6000 gal/min (378.1 1/sec) can be recirculated through a 16 in (0.41 m)
diameter pipe connecting the two surge tanks at either end of the tank. The pump is controlled
by an identical electronic control board as is used for the fan. Steady current or any variation up
to 0.5 m/s can be generated in either direction in the test section by PC control. Spatial current
gradients in the tank over selected parts of the test section can be generated by installing a falsebottom.
Waves can be generated by a hydraulically driven paddle at either end of the tank. The hydraulic
drive system was fabricated by Chant Engineering, Inc. This wave paddle can be fully
programmed through a personal computer (PC) to generate waves of any frequency and amplitude
compatible to the test section and generating machinery. Since the shallow water limitation of
the tank is for waves of 1.5 m in length, the frequency is limited to the corresponding wave
frequency of about 1.0 Hz. The amplitude is limited by the power rating of the hydraulic driving
system, which in turn limits the high frequency for the paddle motion to 10 Hz with small
amplitude, with amplitude increasing as frequency decreases, giving an amplitude of about 0.05m at 2Hz.
A smaller tank just being completed consists of a test section of 8 ft x 8 ft ( 2.44 m) with an
operational water depth of 1 ft (0.3048 m). It is equipted for variable currents running diagonally
within the test section between two large reservoirs, as shown in figure 2. This smaller tank will
permit the study of wave-current interactions that occur at an angle.
3
uniqueadvantagesis theMercuryComputerMC-3200ATadd-incardusingM-Shell softwarebyApplied CoherentTechnologyfor complete,programmableimageprocessing.Additionally, anHitachi andPanasonicVCRcanrecordanexperimentcontinuouslyfor laterframegrabbingandprocessing.Theseitemsarediscussedin moredetail in a following section.
B. RCA ProWonderCamCorder:This is availableto makeanoverall visualandvoicerecordof any experimentin thefacility or in the field.
8. Analog to Digital and Digital to Analog Conversion:
Data Translation and Keithley cards are used within the personal computers to digitize incoming
data and to provide the outgoing control for the various equipment used by the facility. Each card
has 16 analog to digital conversion channels, 2 digital to analog conversion channels ( each with
a maximum of +/- 10 v DC ), and 2 16-bit digital I/O ports. The facility's maximum input data
channel capacity is limited only by the number of A/D cards and computers available.
5.2 Recording Devices
1. Analog (FM) Data Recorders:
A. Honeywell 14 Ch.: Using 1 inch magnetic Tape, this recorder can take up to 14 channels
of data, or 13 channels of data while using the 14th for a sync signal to guarantee the maximum
accuracy in speed control on playback.
B. Hewlett-Packard 4 Ch.: Using 1/4 inch magnetic tape, this recorder can take up to 4 data
channels.
C. TEAC 7 Ch.: Using instrumentation-grade cassette tapes, this recorder can take up to 7
channels of data, and operates off a dc voltage supply for in-lab use, or off a battery supply forfield use.
2. Video Recorders:
A. Hitachi: A Hitachi model HS-423UR S-VHS 4 head VCR is available to record video
images and/or sound in standard or S-mode.
B. Panasonic: A Panasonic model 7600 professional editing VCR is available to record or edit
video images and/or sound in standard mode. Additionally, a BCD video controller is available
to control all functions of this VCR through the imagine processing PC, allowing fully automated
image processing to be developed in the Pascal language, or in real time from the PC keyboard
using the BCD command set.
3. Digital Data Recording and Archiving: A Digi-Data model 2010 9-track digital magnetic tape
recorder is used to archive raw data, programs, images, and results that have been previously
6
acquiredby the personalcomputers(PC) asdigitized dataor processedresults. It canalso beusedto exchangelargeamountsof databetweenthelaboratory'spersonalcomputers,or usingthe Tape View softwaredescribedin a following section,read or write data in any standardmagnetictapeformat, to allow datato beexchangedbetweenthe facility andothercomputers.
5.3 Data Processing
A variety of data processing is already available, and other specialized approaches can be easily
developed within the following environments.
1. ASYST: A threaded subroutine language for the PC, allowing words to be defined in terms
of ASYST library words, while these new words can then be used within further new words until
the final program is a single word. With this concept, A/D and D/A can be easily controlled and
timed, various statistics and analysis can be done, as well as graphical output or data output to
other software packages.
2. Easyest: A non-programming approach shell around the ASYST
environment, using a windowed display.
3. MatLab 386: A language environment making use of the complete capabilities of the 386 and
486 processors, in matrix notation, including a large capability in digital filtering and
transformations, with complete graphical output or data output to other software packages.
4. DADiSP: A window-oriented, non-programming approach using a lab book concept where the
data is input at the first window (or page), and the processing steps occur in subsequent windows.
Results can be output as graphs, printouts, or output to other software packages.
5. Global Lab: A Data Translation product featuring complete control of Data Translation A/D
and other I/O cards, as well as spectral analysis and other statistics.
6. ViewDAC: A multi-task managing environment specific to the 386 and 486 processor family
that provides simultaneous control over multiple A/D, D/A, and digital I/O cards, as well as
display of results or ongoing process development in a windowed display.
7. Lotus 123: Latest version of the popular spreadsheet product for analyzing experimental
results. Includes graphical output capability.
8. SlideWrite Plus: Latest version incorporating mouse and windowed displays for graphing the
results of the experiment in final, camera-ready format.
9. Golden Graphics: Latest version of Grapher (Complete 2D) and Surfer (Contours and
Topographical Surfaces), for graphing the results of the experiment in final, camera-ready format.
10. Image Processing:
A. DT-Iris: An image processing environment furnishing a complete callable library for image
enhancement, edge detection, filtering, false coloring, etc., and callable from C, Pascal, and
Fortran.
B. Image Pro: An image processing environment using pull-down menus with mouse
selection, and macro-script capability for doing repetetive operations, with edge detection,
filtering, false coloring, etc.
C. M-Shell: A C-like programming environment for complete image processing using a
Mercury Computer model MC-32-AT-IO-6 dedicated image processing card which uses the PC
as a front end. The unique features of this package are its speed and ability to do 2D FFTs of
the image.
11. Programming Languages: In addition to those already listed, the following are also available
for use in the facility's PC's:
A. Microsoft C
B. Microsoft Pascal
C. Borland TurboPascal
D. GWBasic
12. Network Links: The facility PC's are linked via EtherNet to the Observational Science
Branch Local Area Network to allow further data exchange and processing both locally and
remotely.
5.4 Other Processing
In support of direct data processing, other processing is available as follows.
1. Word Processing: Two major packages are available to support the reporting of results in
scientific journals.
A. WordPerfect: Latest version. All major functions of general word processing packages.
B. MASS- 11: Latest version. All major functions of word processors with the added capability
of easily including equations of every complexity within the text and viewed directly within the
text on the processing screen.
2. Data Base: The latest version of Borland Paradox 386 is available for use.
3. Workstation: A Silicon Graphics IRIS Indigo workstation linked to the local network and
gateway is available for more complicated image processing and wavelet analysis.
8
5.5 Utilities
Several utilities are available to support the operation of the facility personal computers.
1. Brief: Latest version of the popular full-featured programmer's editor.
2. Norton Utilities: Latest version of the popular disk support
utilities.
3. XT Pro Gold: Latest version of the disk support utility, with new archiving features.
4. Communication Support: Latest versions of the popular communication packages:
A. CrossTalk XVI
B. ProComm Plus
C. Kermit
D. Network Links
E. Carbon Copy Remote PC Control
6. SPECIAL TEST CAPABILITY
Because of the full control of conditions, timing, and repeatability that is possible with the
present facility, transient phenomena can be studied by repeating the process until an adequate
amount of data is obtained for an ensemble average. Additionally, the fully automated
experiments can be conducted overnight, during the normal work day, over the weekends, or
whatever schedule is necessary to acquire the data in a timely fashion. With several PC's
available, data processing can procede as soon as the data is obtained, even though further data
collection is progressing.
7. EXAMPLES OF RESULTS
A number of studies have been conducted in the facility since its construction. Some salient
results will be summarized as follows:
The Probability Structure of the Wind Wave Surface
The elevation of a given point in the ocean is the resultant of many wave components.
Dynamically, since the interactions among the different components are weak (see, for example,
9
Phillips, 1977), their motions are largely regardedas independent.Consequently,under thecentral-limit theorem,the probability distributionof the surfaceelevationhasbeenassumedtobe Gaussian.But nonlinearity(though small) is not zero,and its influence in the probabilitystructurehasbeenshownby Phillips (1961)andLonguet-Higgins(1963) to beproportionaltothe wave slope, which requires the surface elevation probability to be non-Gaussian.Noconclusivedatawere availableto supportthetheoreticalresultuntil our laboratorydatabecameavailable in Huang and Long (1980). Not only was the influence of nonlinearity proved
quantitatively, but the relationship found to be
skewness = 8n §
was later confirmed by field data (McClain et al. 1982). This simple relationship provides the
possibility for determining the mean wave length of the ocean waves from altimeter data, as
demonstrated by Walsh (1979).
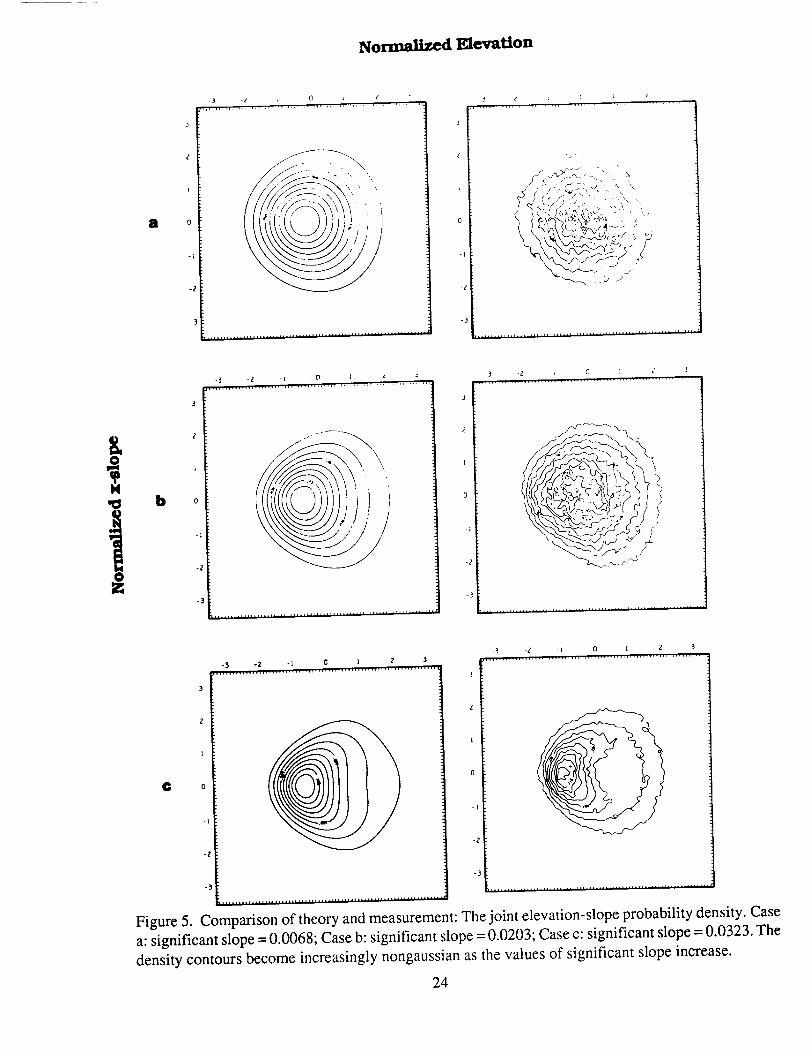
In addition to the elevation probability, the joint elevation-slope probability is of great importance
for remote sensing applications, particularly for altimeter data reduction, and electromagnetic bias
correction. In a later study by Huang et al. (1984), a closed form non-Gaussian joint
elevation-slope density function was proposed and verified by laboratory data. Comparisons
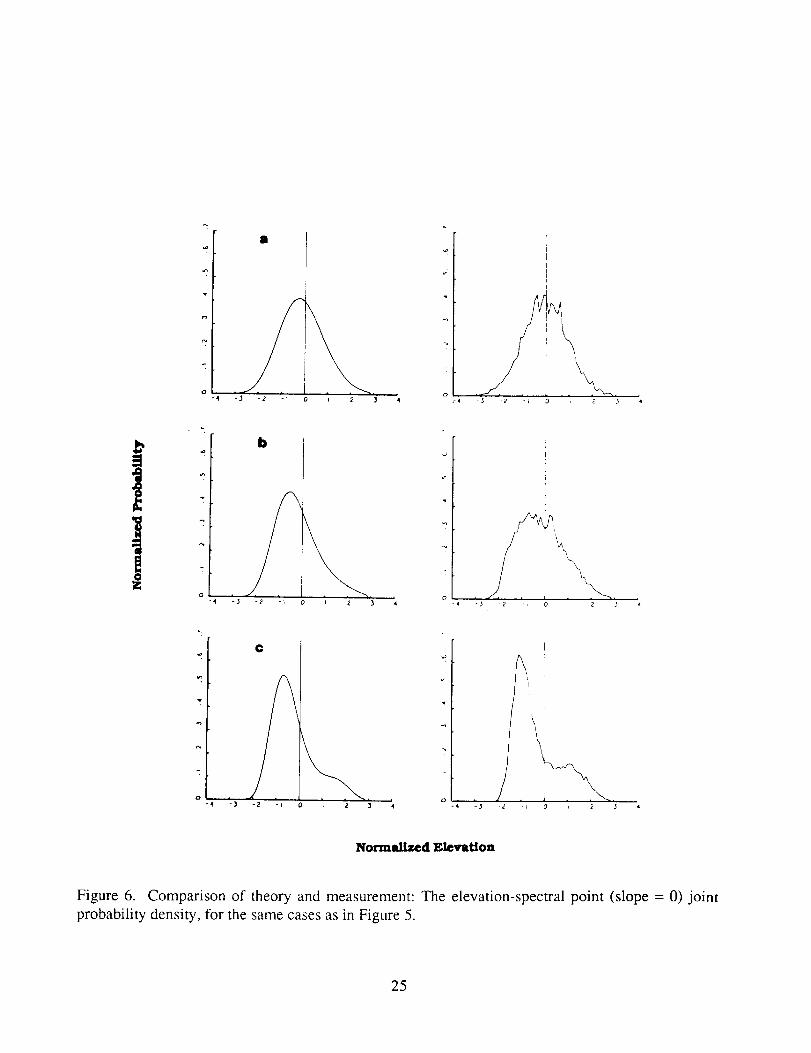
between theoretical and experimental results are presented in Figure 5. A .special case of this joint
density function is the joint specular point-elevation density, which is the basis for altimeter
height determination. The result can be seen in Figure 6. With these studies, the performance of
an altimeter can be thoroughly evaluated.
The Sea State Effects:
Air-Sea Momentum Flux
Scatterometer Algorithm
As the wind blows over the ocean, energy and momentum from the wind are transmitted to the
ocean across the interface. Waves are inevitably generated, which represent the most energetic
motions at the surface layer of the ocean. In fact, a large portion of the energy is first transferred
to the waves, which in turn then transfers it further into the ocean through wave breaking (Huang
1986). Waves of different scales constitute the surface roughness structure which actually controls
the energy and momentum fluxes (Geemeart and Plant, 1990). Up until very recently, the role
of waves in the air-sea interaction has totally been neglected.
Back in the early 1980's, we conducted a series of experiments to investigate the role of waves
in determining the fluxes across the air-sea interface. Such studies are important not only for the
fluxes, but also crucial for the scatterometer algorithm. In our studies, we reached the followingconclusions:
(1) The drag coefficient is a function of the sea state. The drag coefficient relates the wind
speed to the wind stress, which is also the flux of momentum. It can be shown that the drag
coefficient is a function of a roughness length scale.
10
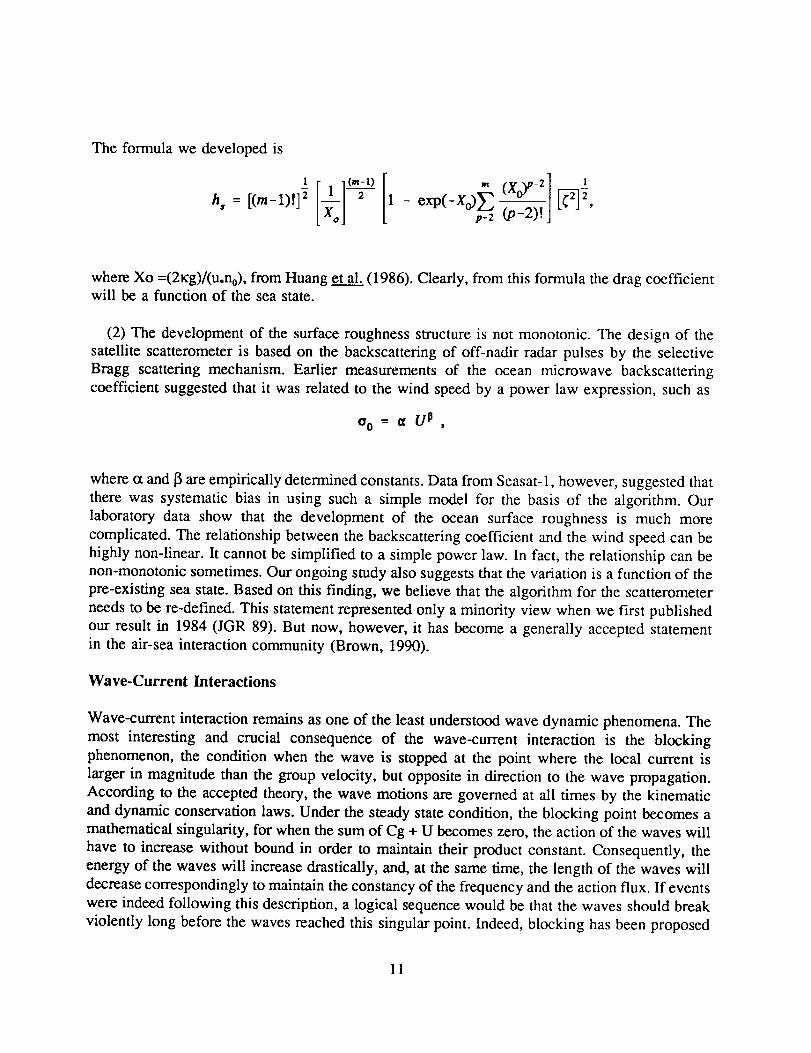
The formula we developedis
m I
= (p-2)!J _'
where Xo =(2_g)/(u.n0), from Huang et al. (1986). Clearly, from this formula the drag coefficientwill be a function of the sea state.
(2) The development of the surface roughness structure is not monotonic. The design of the
satellite scatterometer is based on the backscattering of off-nadir radar pulses by the selective
Bragg scattering mechanism. Earlier measurements of the ocean microwave backscattering
coefficient suggested that it was related to the wind speed by a power law expression, such as
0 0 = a U p ,
where tx and ]3 are empirically determined constants. Data from Seasat-1, however, suggested that
there was systematic bias in using such a simple model for the basis of the algorithm. Our
laboratory data show that the development of the ocean surface roughness is much more
complicated. The relationship between the backscattering coefficient and the wind speed can be
highly non-linear. It cannot be simplified to a simple power law. In fact, the relationship can be
non-monotonic sometimes. Our ongoing study also suggests that the variation is a function of the
pre-existing sea state. Based on this finding, we believe that the algorithm for the scatterometer
needs to be re-defined. This statement represented only a minority view when we first published
our result in 1984 (JGR 89). But now, however, it has become a generally accepted statementin the air-sea interaction community (Brown, 1990).
Wave-Current Interactions
Wave-current interaction remains as one of the least understood wave dynamic phenomena. The
most interesting and crucial consequence of the wave-current interaction is the blocking
phenomenon, the condition when the wave is stopped at the point where the local current is
larger in magnitude than the group velocity, but opposite in direction to the wave propagation.
According to the accepted theory, the wave motions are governed at all times by the kinematic
and dynamic conservation laws. Under the steady state condition, the blocking point becomes a
mathematical singularity, for when the sum of Cg + U becomes zero, the action of the waves will
have to increase without bound in order to maintain their product constant. Consequently, the
energy of the waves will increase drastically, and, at the same time, the length of the waves will
decrease correspondingly to maintain the constancy of the frequency and the action flux. If events
were indeed following this description, a logical sequence would be that the waves should break
violently long before the waves reached this singular point. Indeed, blocking has been proposed
11

asa principle to constructartificial breakwaters(Taylor, 1955).
Basedon a recentstudy,we haveestablishedthat it is possibleto havenon-breakingblockingwhenwavesarepropagatingagainststrongcurrents.Our resultsoffer qualitativeproof that thewave action is indeed reflected as predictedby the theory of Shyu and Phillips (1990);quantitativeproof, however,is still wanting.
The consequenceof the reflection causedby non-breakingblocking could have importantapplicationsin remotesensingdata interpretations.The classicwave-currentinteractiontheorystipulatesthat at blocking the wavenumbercanonly becompressedby a factorof four. In thenewreflectiontheory,however,thewavenumbercanchangefrom theoriginal valueall thewayinto thecapillaryrange,thecompressionratio thusbeingalmostopenended.Furthermore,in theclassictheory, the wavenumbercompressionoccursonly nearthe immediateneighborhoodofthecritical point; while in thenewreflectiontheory,thewavenumbercompressioncould occurover a large region spanningthe initial blocking point and the secondaryblocking point, andbeyond.For example,a 1 m/s currentcancausea 2.5m long wave to reflect and be trapped.According to theclassictheory,though,the minimumwavelengthat the blocking will only be64 cm,which is still too longfor mostmicrowaveradarsto sense.But thenewtheorywill allowwavesto exist ranging from the original wavelengthdown to capillary wavesover the currentgradientregion,andthusoffers a muchbetterchancefor microwaveradardetection.This is, inall probability, the real mechanismfor the imageformation for the SyntheticApertureRadar(SAR) overmanygeographiclocationsasreportedby Fu andHolt (1984).
Otherthanits effectson SAR, this surfaceroughnessgeneratingmechanismcanalsoinfluencethe performanceof the scatterometer,which relies on the generatedroughnesssatisfying theBraggcondition to infer oceansurfacewind. Over theglobal ocean,the currentsin the strongboundarycurrentsystemscancertainlychangethe wavefield asdiscussedearlier.This changecan causeerrors in the presentlyusedscatterometeralgorithms.To excludethe current in thewind measurementis a possibleway to avoidtheerror,asis thepresentpractice.But themajorcurrentsystemsometimescoincideswith theexplosivegrowthof thenearcostalstorms.Forthatreason,monitoringthe wind stressover thecurrentsystembecomesan importanttask.In orderto beableto do sooveranycurrentsystem,theunderstandingof theprocessesof wave-currentinteractionis indispensable.Therefore,themechanismof wave-currentinteractionreallydeservesmorestudyfrom a remotesensingpoint of view.
Spectral Properties
Based on laboratory study and published field data, we have proposed a unified two-parameter
wave spectral model for a generalized sea state, known as the Wallops Spectrum. The inputs for
the spectrum are the peak frequency and the rms wave elevation. With these two parameters, one
can compute the significant slope, §, defined as
§ = (rms elevation)/(wave length at spectral peak).
12
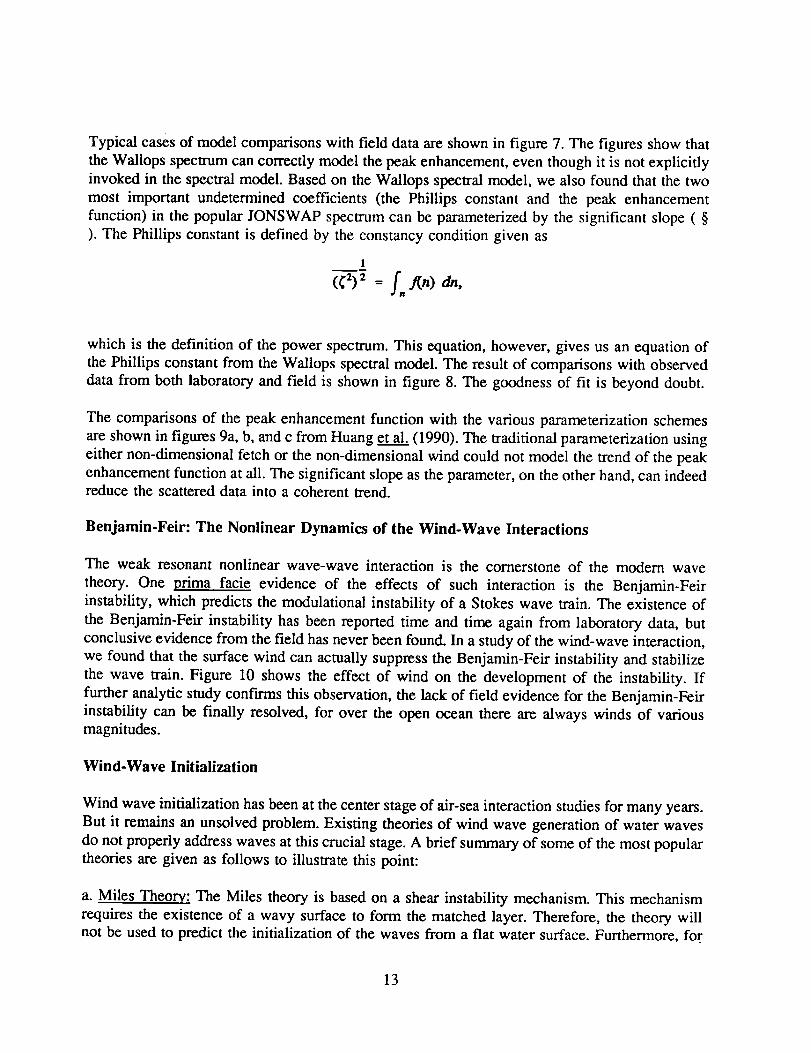
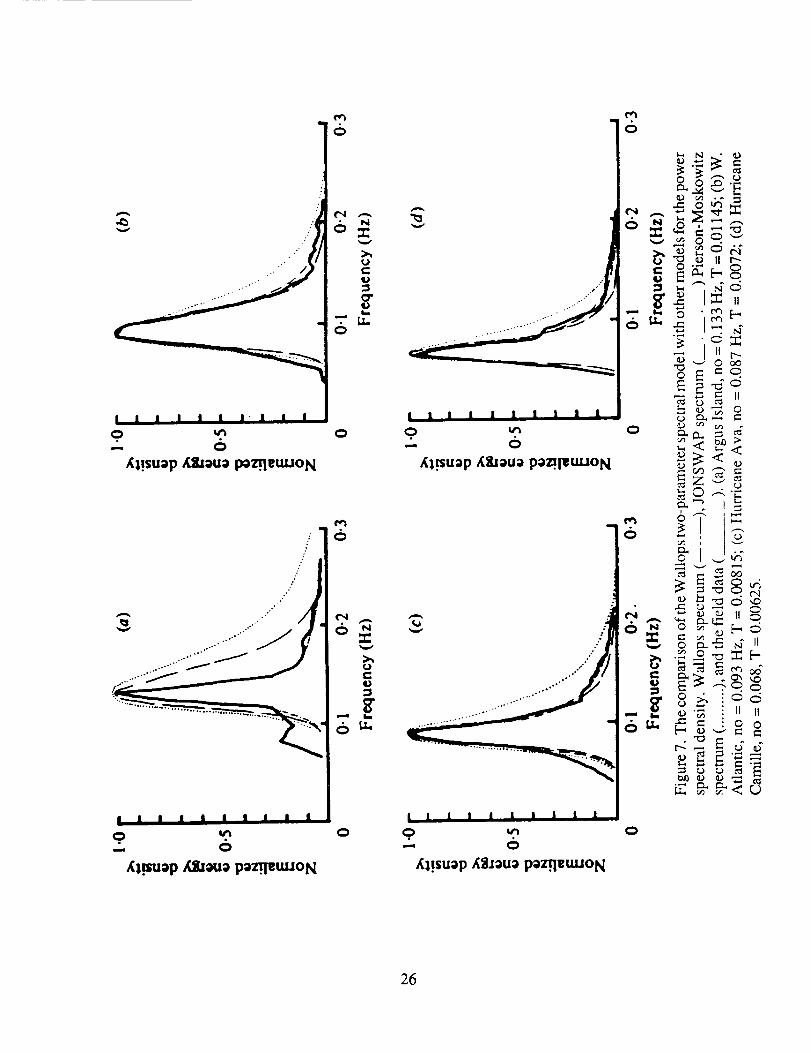
Typical casesof modelcomparisonswith field dataareshownin figure7. ThefiguresshowthattheWallopsspectrumcancorrectlymodelthepeakenhancement,eventhoughit is notexplicitlyinvokedin thespectralmodel.Basedon theWallopsspectralmodel,we alsofound thatthe twomost important undeterminedcoefficients (the Phillips constantand the peak enhancementfunction) in thepopularJONSWAPspectrumcanbe parameterizedby the significantslope( §). The Phillips constantis definedby theconstancyconditiongiven as
(-_ = f,, An) tin,
which is the definition of the power spectrum. This equation, however, gives us an equation of
the Phillips constant from the Wallops spectral model. The result of comparisons with observed
data from both laboratory and field is shown in figure 8. The goodness of fit is beyond doubt.
The comparisons of the peak enhancement function with the various parameterization schemes
are shown in figures 9a, b, and c from Huang et al. (1990). The traditional parameterization using
either non-dimensional fetch or the non-dimensional wind could not model the trend of the peak
enhancement function at all. The significant slope as the parameter, on the other hand, can indeedreduce the scattered data into a coherent trend.
Benjamin-Feir: The Nonlinear Dynamics of the Wind-Wave Interactions
The weak resonant nonlinear wave-wave interaction is the cornerstone of the modern wave
theory. One prima facie evidence of the effects of such interaction is the Benjamin-Feir
instability, which predicts the modulational instability of a Stokes wave train. The existence of
the Benjamin-Feir instability has been reported time and time again from laboratory data, but
conclusive evidence from the field has never been found. In a study of the wind-wave interaction,
we found that the surface wind can actually suppress the Benjamin-Feir instability and stabilize
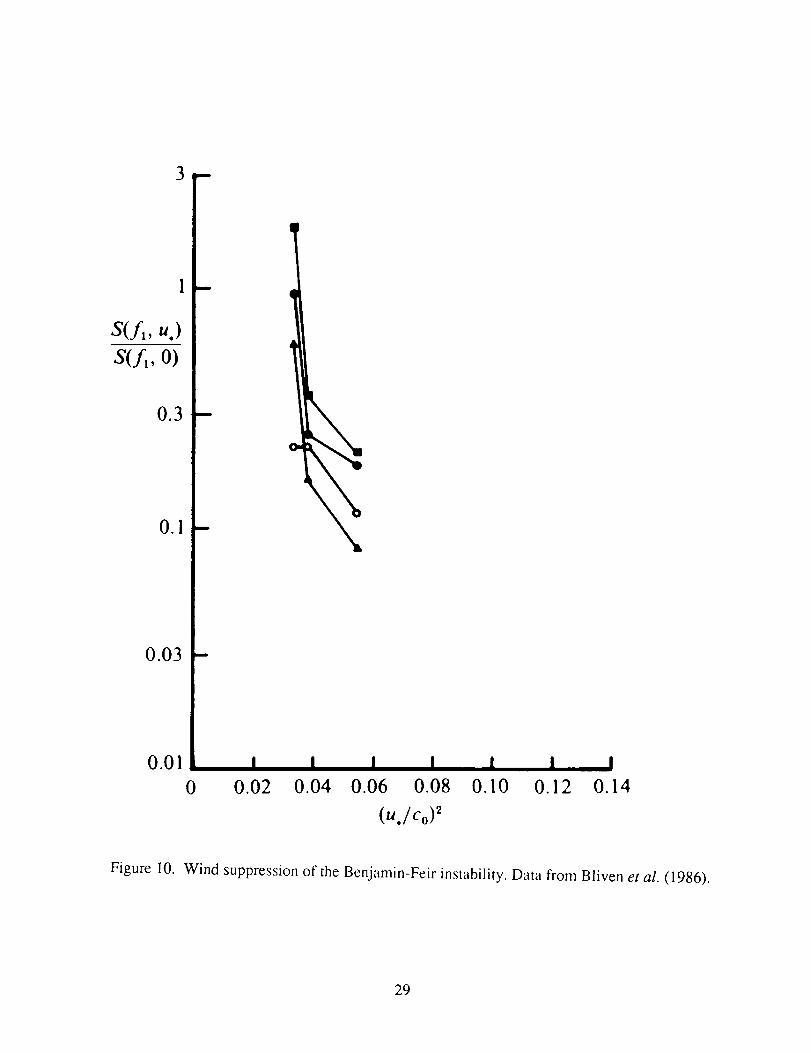
the wave train. Figure 10 shows the effect of wind on the development of the instability. If
further analytic study conf'Lrrns this observation, the lack of field evidence for the Benjamin-Feir
instability can be finally resolved, for over the open ocean there are always winds of variousmagnitudes.
Wind-Wave Initialization
Wind wave initialization has been at the center stage of air-sea interaction studies for many years.
But it remains an unsolved problem. Existing theories of wind wave generation of water waves
do not properly address waves at this crucial stage. A brief summary of some of the most popular
theories are given as follows to illustrate this point:
a. Miles Theory: The Miles theory is based on a shear instability mechanism. This mechanism
requires the existence of a wavy surface to form the matched layer. Therefore, the theory willnot be used to predict the initialization of the waves from a fiat water surface. Furthermore, for
13
the Miles instability to work effectively, the matchedlayer thicknesshas to coincidewith thewind profile atits maximumcurvature.Consequently,theMiles theoryis themosteffectivewhenthe ratio of the wind speedto that of the dominantphasevelocity is around10.Both of theserestrictionsrendersthe Miles mechanismto bea wind waveinteractionratherthanagenerationmechanism.
b. Phillips Theory: The Phillips theory is based on a resonant mechanism between the pressure
pulsation in the wind with that of the underlying waves. The theory proposes an initial value
problem of no waves on the water surface. Thus theoretically, it can indeed be applied to theinitialization of the waves. But the resonant condition requires the matching of the phase velocity
and the wind component in the direction of the wave propagation. A requirement like this
essentially excludes the small scale waves in the centimeter range that are observed as the first
roughness elements on the wind-blown water surface.
c. Kelvin-Helmholtz Theory: The Kelvin-Helmholtz instability is based on the inviscid shear
current instability. It correctly predicts the wave length of the most unstable wave on the water
surface. But the shear waves have a phase velocity too low to match the free wave propagation.
In our laboratory study, we have established that the initial stage of the waves are indeed in the
capillary-gravity range as predicted by the Kelvin-Helmholtz theory. But the phase velocity is
much higher than their predicted value. The growth rate of the wave energy is also too high to
be accounted for by any of the existing theories.
In the initial stage, the waves successively go through several stages starting from a regular
waves to chaotic, and then returning to regular. Such behavior strongly suggests highly nonlinear
transitions of modes. This problem is still under active investigation.
In addition to joint research projects with Harvard University, Columbia University, the
University of Delaware and the Johns Hopkins University where the facility supported graduate
research in the various Ph.D programs, the following articles in refereed journals resulted.
1976
1. On the variation and growth of wave-slope spectra in the capillary-gravity range with
increasing wind. S. R. Long and N. E. Huang, J.Fluid Mech., 77, 209-228.
2. Observations of wind-generated waves on variable current. S. R. Long and N. E. Huang, J.
Phys. Oceanogr., 6, 962-968.
1980
1. An experimental study of the surface elevation probability distribution and statistics of
wind-generated waves. N. E. Huang and S. R. Long, J. Fluid Mech., 101, 179-200.
14
1981
1.A unified two-parameterwavespectralmodelfor a generalseastate.N. E. Huang,S.R. Long,C. C. Tung, Y. Yuen,andL. F. Bliven, J. Fluid Mech., 112, 203-224.
2. On the importance of the significant slope in empirical wind-wave studies. N. E. Huang, S.
R. Long, and L. F. Bliven, J. Phys. Oceanogr., 10, 569-573.
1983
1. A non-Gaussian statistical model for surface elevation of nonlinear random wave fields. N. E.
Huang, S. R. Long, C. C. Tung, Y. Yuan, and L. F. Bliven, J. Geophys. Res., 88, 7597-7606.
2. A study on the spectral models for waves in finite water depth. N. E. Huang, P. A. Hwang,
H. Wang, S. R. Long, and L. F. Bliven, J. Geophys. Res., 88, 9579-9587.
1984
1. A new type of overshoot phenomenon in wind wave development and its implication in remote
sensing of the ocean. N. E. Huang, C. L. Parsons, S. R. Long, L. F. Bliven, and Q. Zheng, J.
Geophys. Res., 89, 3679-3687.
2. The non-Gaussian joint probability density function of slope and elevation for a nonlinear
gravity wave field. N. E. Huang, S. R. Long, L. F. Bliven, and C. C. Tung, J. Geophys. Res., 89,1961-1972.
3. The harp probe: an in situ Bragg scattering sensor. E. Mollo-Christensen, N. E. Huang, L. F.
Bliven, and S. R. Long, J. Atmos. Oceanic Tech., 1,358-371.
1986
1. Experimental study of the influence of wind on Benjamin-Feir sideband instability. L. F.
Bliven, N. E. Huang, and S. R. Long, J. Fluid Mech., 162, 237-260.
2. An experimental study of the statistical properties of wind-generated gravity waves. N. E.
Huang, S. R. Long, and L. F. Bliven, Wave Dynamics and Radio Probing of the Ocean Surface,
edited by O. M. Phillips and Klaus Hasselmann, Plenum Publishing Co., New York, Chapt.7,
129-144.
3. An estimate of the influence of breaking waves on the dynamics of the upper ocean. N. E.
Huang, Wave Dynamics and Radio Probing of the Ocean Surface, edited by O. M. Phillips and
Klaus Hasselmann, Plenum Publishing Co., New York, Chapt.20, 295-313.
15
4. An analyticalmodel for oceanicwhitecapcoverage.N. E. Huang,L. F. Bliven, S. R. Long,andC. C. Tung, J. Phys. Oceanogr., 10, 1597-1604.
5. A study of the relationship among wind speed, sea state, and the drag coefficient for a
developing wave field. N. E. Huang, L. F. Bliven, S. R. Long, and P. S. DeLeonibus, .J. Geophys.
Res_______.,91, 7733-7742.
1987
1. Spectrum of breaking waves in deep water. C. C. Tung and N. E. Huang, J. Enginr. Mech.,
113, 293-302.
2. The effect of wave breaking on wave spectrum in water of finite depth. C. C. Tung and N. E.
Huang, J. Geophys. Res., 92, 5125-5130.
3. The effect of wave breaking on the wave energy spectrum. C. C. Tung and N. E. Huang, J_
Phys. Oceanogr., 17, 1156-1162.
1988
1. An estimate of wave breaking probability for deep water waves. Y. A. Papadimitrakis, N. E.
Huang, L. F. Bliven, and S. R. Long, Sea Surface Sound, edited by B. R. Kerman, Kluwer
Academic Publishers, New York, 71-83.
1989
1. Probability function of breaking-limited surface elevation. C. C. Tung, N. E. Huang, Y. Yuan,
and S. R. Long, J. Geophys. Res., 94, 967-972.
2. Laboratory studies of wave-current interaction: kinematics of the strong interaction. R. J. Lai,
S. R. Long, and N. E. Huang, J. Geophys. Res., 94, 16201-16214.
199.___.O0
1. Wave spectra. N. E. Huang, C. C. Tung, and S. R. Long, The Sea, Vol. 9, edited by B.
LeMehaute and D. M. Hanes, John Wiley & Sons, New York, 197-237.
2. The probability structure of the ocean surface. N. E. Huang, C. C. Tung, and S. R. Long, The
Sea, Vol. 9, edited by B. LeMehaute and D. M. Hanes, John Wiley & Sons, New York, 335-366.
16

8. REFERENCES
Bliven, L. F., N. E. Huang, and S. R. Long (1986). Experimental study of the influence of windon Benjamin-Feir sideband instability. J. Fluid Mech., 162, 237-260.
Brown, R. A. (1990). Surface fluxes and remote sensing of air-sea interactions. Surface Waves
and Fluxes, Kluwer Academic Publishers, Dortrecht, 7-28.
Fu, L. L., and B. Holt (1982). SEASAT Views Oceans and Sea Ice with Synthetic ApertureRADAR. JPL Publication No.81-120, 200pp.
Geemeart, G. L., and W. J. Plant, eds. (1990). Surface Waves and Fluxes, Kluwer AcademicPublishers, Dortrecht.
Huang, N. E., and S. R. Long (1980). An experimental study of the surface elevation probability
distribution and statistics of wind-generated waves. J. Fluid Mech., 101, 179-200.
Huang, N. E., S. R. Long, L. F. Bliven, and C. C. Tung (1984). The non-Gaussian joint
probability density function of slope and elevation for a nonlinear gravity wave field. J. Geophys.Res__.._.,89, 1961-1972.
Huang, N. E. (1986). An estimate of the influence of breaking waves on the dynamics of the
upper ocean. Wave Dynamics and Radio Probing of the Ocean Surface, O. M. Phillips and KlausHasselmann, eds., Plenum Publishing, New York.
Huang, N. E., C.-C. Tung, and S. R. Long (1990). Wave Spectra. In The Sea, 9,Wiley-Interscience, New York, 197-237.
Longuet-Higgins, M. S. (1963). The generation of capillary waves by steep gravity waves., J_Fluid Mech., 16, 138-159.
McClain, C. R., D. T. Chen, and W. D. Hart (1982). On the use of laser profilometry for oceanwave studies. J. Geophys. Res., 87, 9509-9515.
Mollo-Christensen, E., N. E. Huang, L. F. Bliven, and S. R. Long (1984). The harp probe: an insitu Bragg scattering sensor. J. Atmos. Oceanic Tech., 1,358-371.
Phillips, O. M. (1961). On the dynamics of unsteady gravity waves of finite amplitude. Part2. J_Fluid Mech., 11, 143-155.
Phillips, O. M. (1977). The Dynamics of the Upper Ocean. 2nd ed., Cambridge University Press,New York.
17
Shyu,J.-H.,and O. M. Phillips (1990).The blockageof gravity andcapillary wavesby longerwavesand currents.J. Fluid Mech., 217, 115-141.
Taylor, G. I. (1955). The action of a surface current used as a breakwater. Proc. Roy. Soc. A,
231,466-478.
Walsh, E. J. (1979). Extraction of ocean wave height and dominant wavelength from GEOS-3
altimeter data. J. Geophvs. Res., 84, 4003-4010.
9. LIST OF FIGURES
Figure 1. The main research tank at the NASA Wallops Flight Facility.
Figure 2. The specialized wave-shear current interaction research tank at NASA Wallops Flight
Facility.
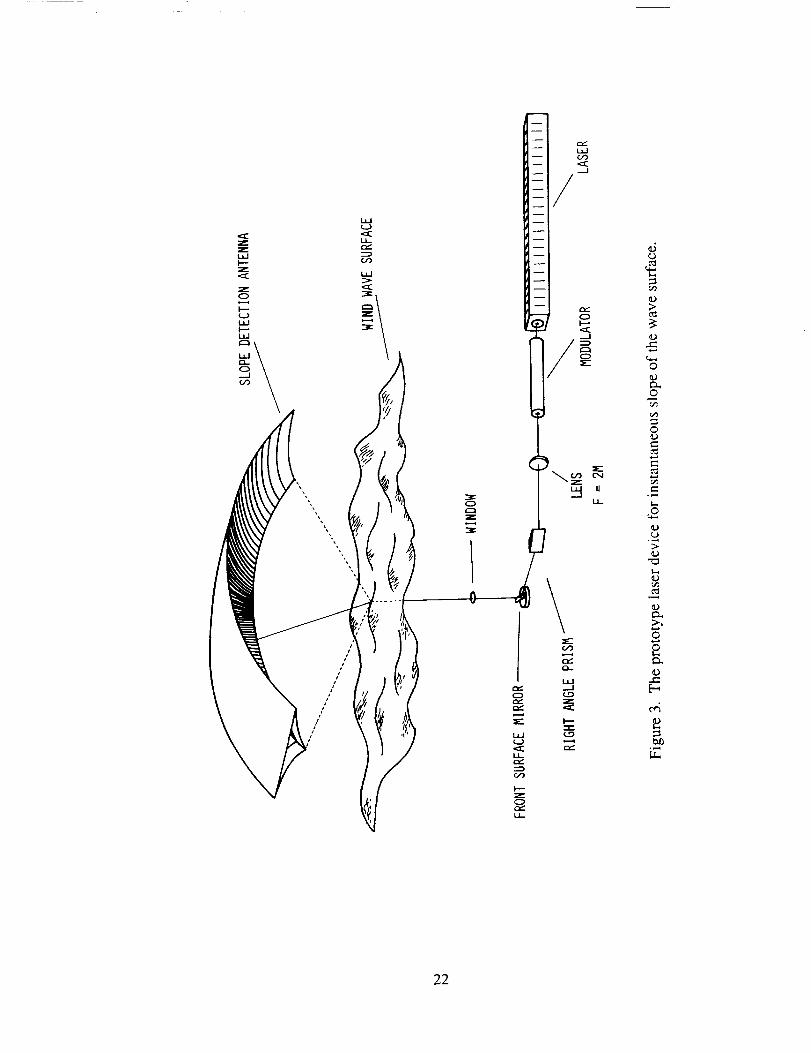
Figure 3. The proto-type laser device for instantaneous slope of the wave surface.
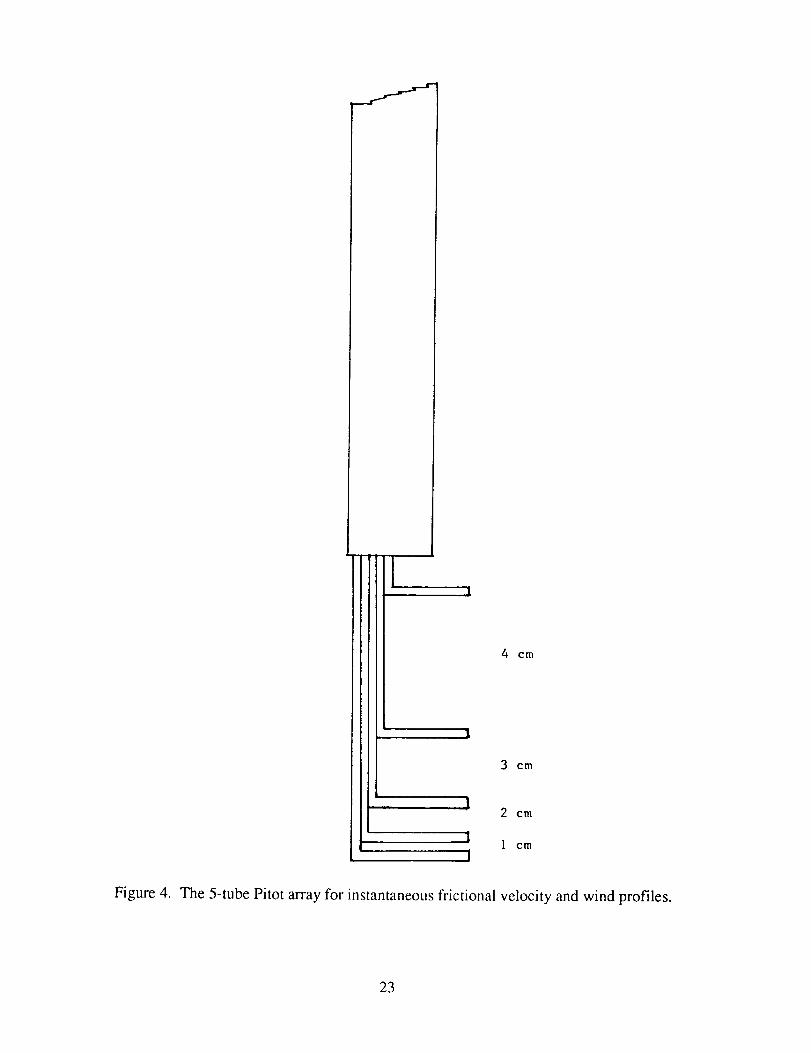
Figure 4. The 5 tube Pitot array for instantaneous frictional velocity and wind profiles.
Figure 5. Comparison of theory and measurement: The joint elevation-slope probability density.
Case a: significant slope = 0.0068 ; Case b: significant slope = 0.0203; Case c: significant slope
= 0.0323. The density contours become increasingly nongaussian as the values of significant
slope increase.
Figure 6. Comparison of theory and measurement: The elevation-spectral point (slope=0) joint
probability density, for the same cases as in figure 5.
Figure 7. The comparison of the Wallops two-parameter spectral model with other models for
the power spectral density. Wallops spectrum (- ), JONSWAP spectrum (--.--.--,),
Pierson-Moskowitz spectrum ( ....... ), and the field data ( __ ). (a) Argus Island, no=0.133 Hz,
T = 0.01145; (b) W.Atlantic, no = 0.093 Hz, T = 0.00815; (c) Hurricane Ava, no = 0.087 Hz,
T = 0.0072; (d) Hurricane Camille, no = 0.068, T = 0.00625.
Figure 8. (a) The variation of the equilibrium range coefficient, b, with the significant slope, T.
(b) The variation of the equilibrium range coefficient, b, with the non-dimensional fetch, gx/u*2.
Data references given in Huang et al. (1981).
Figure 9. Comparison of peak enhancement function, g, of various parameterization schemes with
the Wallops model: (a)g vs. the external variable, nondimensional fetch (b) g vs. the coupling
variable, nondimensional frequency (c) g vs. the internal variable, the significant slope, T.
Figure 10. Wind suppression of the Benjamin-Feir instability. Data from Bliven et al. (1986).
18
10. ACKNOWLEDGEMENTS
Norden E. Huang and Steven R. Long wish to acknowledge all those who had a part in
constructing and assembling the facility. The helpful and positive attitude of the Wallopsemployees in developing and supporting the needed work has been and continues to be our
biggest asset.
11. INVITATION
Those interested in co-operative research and/or wishing to receive the facility's schedule of
research as it is published periodically are invited to contact us at the address below:
Norden E. HuangNASA GSFC
Code 971
Greenbelt, MD 20771
(301) 286-8879 Office
286-6662 Secretary286-2717 FAX
Steven R. Long
NASA GSFC / WFF
Code 972
Wallops Island, VA 23337(804) 824-1034 Office
824-2526 Secretary824-1036 FAX
824-1471 NASIRF
19
//
//
0r-_Z
0
- U-I
--J
--i--t--i--i--i--i--i--i
|1
I..I-
L,LI
U,_
I.--
@
@
,..o©
r-
22
it
4 cm
Figure 4.
12 cm
!I
I cm
The 5-tube Pitot array for instantaneous frictional velocity and wind profiles.
23
Normalized Elevation
a 0I _ k.. 7f = .- . ' - . _ _,
_ .2, /
i .1
-}
-2
-3 -2 -i 0 1 _
............................................ ,..................... 4
2
1
-1
-2
-3
-S -Z -i Q ! Z $
3 -Z -I 0 I 2 3
Figure 5. Comparison of theory and measurement: The joint elevation-slope probability density. Case
a: significant slope = 0.0068; Case b: significant slope = 0.0203; Case c: significant slope = 0.0323. The
density contours become increasingly nongaussian as the values of significant slope increase.
24
8,,o
o *-4 -3 -2 -I I 2 3 4
bLo
r
o ,-4 -3 -2 -I h 2 3
C
c_
o ..-4 3 -2 -I Z 3 4
Q_-4 -_ 2 -L 0 _ 2 3 4
4 -_ "2 0 2 3
I
\'I
Norm_d Elevation
Figure 6. Comparison of theory and measurement: The elevation-spectral point (slope = 0) joint
probability density, for the same cases as in Figure 5.
25
0- 6
i l | | | i | I | |
0 v_6
0
I9- 6
X;!suap X_Jauap_z_1,lUUON
6
==
0
26

?
7
6
5
4
3
2
1
0 i
8
i
8.4 8.8
O
0
9,2 9.6
^
log •
CI
0 0
0 00
10 10,,I
a
L
_0.8
8
7
6-
5
4
3
2
1
00
0
00
0
o
0 0 00
0
o o_ o°8 _
%,o_ oo q.
0 ÷ 4" ÷
I 1
0.02 0.04
u_/_
b
0
0 0
0
0
0.06
8
7 o/ C6 o
oo�4 - o o_ o
0
3 - o o _o ° o
÷ +.,o o O _q_ 0
2- . ..o_ _ROo1 _ ,___,l_;_-.o---- -- -
0 1 I I I I I0 0.002 0.004 0.006 0.008 0.010 0.012 0.014
SFigure 9. Comparison of peak enhancement function, g, of various parameterization schemes with the
Wallops model: (a) g vs. the external variable, nondimensional fetch; (b) g vs. the co,lpling variable,
nondimensional frequency; and (c) g vs. the internal variable, the significant slope T.
28

P
o
o •
0
I I I I I
0 0.05
§
10 °
10 -1
10 .2
q
70
_' 0 o
4|
"b
oo
_° °o oo 9_ o o o
o _, °_ o
o o _ uG.o ¢o o °o
•o g o__Oo_o ._ oo _Oo :;e _ 0%
ii! • _0
10 -3 k ' ,JJIrl[ I I tltlJll 1 I IOrtlllJ J ' l_Jl_sl i _ ,,,IrlJ i I I_l,,,J J J al_,J,I
10 10 2 10 3 : 10 4 10 5 10 6 10 7 10 8
gX/u 2
Figure 8. (a) The variation of the equilibrium range coefficient, b, with the significant slope, T. (b) The
variation of the equilibrium range coefficient, b, with the nondimensional fetch gX/u .2. Data referencesgiven in Huang et al. (1981).
27
m
S(f,, u.)S(f,, O)
0.3
0.1
0.03
O.Ol I I l I ! I I
0 0.02 0.04 0.06 0.08 0.10 0.12 0.14
(u./co)_
Figure 10. Wind suppression of the Benjamin-Feir instability. Data from Bliven et al. (1986).
29
Form Approved
REPORT DOCUMENTATION PAGE OMBNo. 0704-0188
Pubic reporting burden for this collect*on of irdorrna|bon IS e6tirna;ed to average 1 flour J3ef response, intruding Ihe time lot reviewing instructions, Imarching existtn 9 daa sources, galher_,_
and rnaintam:,ng the data needed, and compiati_g and revw4vtng the co_lectbon of inforrnatlon_ Send comr'r_n_$ reg_ding this burden estimate or any other asl0ect 04 the colk¢1io¢= of
information, including suggestions lot reducing this bur0en. 1o Washinglon Headquarters ServiCes, Directorate for In(otmalion Operations and Reports. 1215 Je_twson Davis Highway. Sulle
1204, Arlin_[on, VA 222024302, and to the OffK:e of Mana_emarR and Bud<jet, Paperwork Raduct=on pro_ecl (0704-0188), Washincjlon. De 20503.
1. AGENCY USE ONLY (Leave blank) 2. REPORT DATE 3. REPORT TYPE AND DATES COVEREDJune 1992 Reference Publication
4. TITLE AND SUBTITLE
NASA Wallops Flight Facility Air-Sea Interaction
Research Facility
6. AUTHOR(S)
Steven R. Long
7. PERFORMING ORGANIZATION NAME(S) AND ADDRESS(ES)
NASA Wallops Flight Facility
Wallops Island, Virginia 23337
9. SPONSORING/MONITORING AGENCY NAME(S) AND ADDRESS(ES)
National Aeronautics and Space Administration
Washington, D.C. 20546-0001
5. FUNDING NUMBERS
970
8. PERFORMING ORGANIZA_ON
REPORT NUMBER
92B00059
10. SPONSORING/MONITORING
AGENCY REPORT NUMBER
NASA RP-1277
11. SUPPLEMENTARY NOTES
Steven R. Long, Code 972, NASA WFF, Wallops Island, Virginia 23337.
12a. DISTRIBUTION/AVAILABILITY STATEMENT
Unclassified - Unlimited
Subject Category 48
12b. DISTRIBUTION CODE
13. ABSTRACT (Maximum 200 words)
This publication serves as an introduction to the Air-Sea Interaction Research Facility at NASA/GSFC/WalIops Flight
Facility. The purpose of this publication is to provide background information on the research facility itself, including
capabilities, available instrumentation, the types of experiments already done, ongoing experiments, and future plans.
14. SUBJECT TERMS
Air-Sea Interactions, Wave Statistics, Ocean Surface Microscale
17. SECURITY CLASSIFICATIONOF REPORT
Unclassified
NSN 7540-01-280-5500
18. SECURITY CLASSIFICATIONOF THIS PAGE
Unclassified
9. SECURITY CLASSIFICATIONOF ABSTRACT
Unclassified
15. NUMBER OF PAGES
36
16. PRICE CODE
A03
20. LIMITATION OF AB-STRACT
Standard Form 298 (Rev. 2-89)Prescribed by ANSI SNL 239-18, 294-102
NA_;A L_nKley, I992