Embed Size (px)
Citation preview
(NASA-CR-200003) THE GALACTIC N96-16915DISTRIBUTION OF ALIPHATICHYDROCARBONS IN THE DIFFUSEINTERSTELLAR MEDIUM (NASA. Anr.es UnclasResearch Center) 9 p
G3/90 0091299
https://ntrs.nasa.gov/search.jsp?R=19960009749 2018-07-11T03:54:09+00:00Z
NASA-CR-200003
THE ASTROPHYSICAL JOURNAL, 440:697-705,1995 February 20© 1995. The American Astronomical Society. All rights reserved. Printed in U.S.A.
THE GALACTIC DISTRIBUTION OF ALIPHATIC HYDROCARBONS IN THE DIFFUSEINTERSTELLAR MEDIUM
SCOTT A. SANDFORD, YVONNE J. PENDLETON, AND Louis J. ALLAMANDOLANASA/Ames Research Center, Mai! Stop 245-6, Moffett Field, CA 94035
Received 1994 May 23; accepted 1994 September 2
ABSTRACTThe infrared absorption feature near 2950 cm"1 (3.4 /jm), characteristic of dust in the diffuse interstellar
medium (ISM), is attributed to C—H stretching vibrations of aliphatic hydrocarbons. We show here that thestrength of the band does not scale linearly with visual extinction everywhere, but instead increases morerapidly for objects near the center of the Galaxy, a behavior that parallels that of the Si—O stretching banddue to silicate materials in the diffuse ISM. This implies that the grains responsible for the diffuse mediumaliphatic C—H and silicate Si—O stretching bands are different from those responsible for much of theobserved visual extinction. It also suggests that the distribution of the carbonaceous component of the diffuseISM is not uniform throughout the Galaxy, but instead may increase in density toward the center of theGalaxy. The similar behavior of the C—H and Si—O stretching bands suggests that these two componentsmay be coupled, perhaps in the form of silicate-core, organic-mantle grains. Several possible models of thedistribution of this material are presented and it is demonstrated that the inner parts of the Galaxy has acarrier density that is 5 to 35 times higher than in the local ISM. Depending on the model used, the density ofaliphatic material in the local ISM is found to be about 1 to 2 — CH3 groups m"3 and about 2 to 5 —CH2—groups m~3. These densities are consistent with the strengths of the 2955 and 2925 cm"1 (3.38 and 3.42 /im)subfeatures (due to —CH3 and —CH2— groups, respectively) within the overall 2950 cm"1 (3.4 //m) bandbeing described by the relations AJt(2955cm-i} = 270 ± 40 and Aa/T(2925cm-i} = 250 + 40 in the local diffuseISM.Subject headings: infrared: ISM: lines and bands — ISM: molecules
1. INTRODUCTION
The nature of dust in the diffuse interstellar medium (ISM)has recently been the subject of a great deal of study. Generalparameters such as particle size and shape have been con-strained using the UV-visual portion of the excitation curveand polarization measurements. These, in conjunction withcosmic abundance constraints and the optical properties ofrelevant materials, have been used to place constraints on thedust composition. In general, the dust is believed to consist ofmixtures of silicate and carbonaceous materials (see Greenberg& Hong 1974; Mathis, Rumpl, & Nordsieck 1977; Greenberg1978; Greenberg & Chlewicki 1983; Jones, Duley, & Williams1987; Mathis & Whiffen 1989). Recent reviews of interstellardust models, and pertinent references can be found in Green-berg (1989), Mathis (1989), and Williams (1989).
The detection of absorption bands near 3300 and 2950 cm "l
(3.0 and 3.4 /im; due to O—H and C—H stretching vibrations,respectively) in the spectra of Galactic center infrared sources(Soifer, Russell, & Merrill 1976; Willner et al. 1979; Wick-ramasinghe & Allen 1980) led to many follow-up observationsand analyses because the features along this line of sight werethought to be due to dust in the diffuse ISM (Allen & Wick-ramasinghe 1981; Willner & Pipher 1982; Jones, Hyland, &Allen 1983; Wickramasinghe & Allen 1983; Allamandola1984; Butchart et al. 1986; Tielens & Allamandola 1987;McFadzean et al. 1989). However, these Galactic center studiesdid not confirm the dust responsible for the features is in thediffuse medium, since the features could have potentially beenproduced by materials local to the Galactic center itself.Indeed, the work of McFadzean et al. (1989) showed that thebroad O—H feature near 3300 cm "l (3.0 ̂ m) varies in strengthfrom source to source in the Galactic center, and they sug-
gested that it is due, at least in part, to local materials. Withoutadditional studies along different lines-of-sight it was difficultto ascertain how much of the 3300 and 2950 cm"1 (3.0 and 3.4fan) absorption bands arise from material local to the Galacticcenter and how much (if any) arises from the intervening ISM.
Until recently, the only other object toward which the 2950cm'1 (3.4 fan) feature had been detected was VI Cygni 12(Adamson, Whittet, & Duley 1990). However, recent studies ofthe 3600-2600 cm"1 (2.78-3.85 fan) spectral region of objectsalong many different lines of sight suffering from a wide rangeof visual extinctions (Av), have clarified this issue considerably(Sandford et al. 1991; Pendleton 1994; Pendleton et al. 1994).These papers demonstrated that the 3300 cm "1 (3.0 urn) O—Hstretching band does not correlate with Av along differentlines-of-sight and therefore is not due primarily to dust in thediffuse ISM, confirming the conclusions of McFadzean et al.(1989). In contrast, the studies of the 2950 cm"1 (3.4 /zm) C—Hstretching band by Sandford et al. (1991) and Pendleton et al.(1994) show there is remarkable similarity in position andprofile of this feature over extinctions ranging from as low as3.9 to as high as 31 (see Fig. la). In addition, the strength of thisfeature increases with increasing Av, suggesting that it is largelydue to dust in the diffuse ISM.
The profile and subpeak positions of the overall C—Hstretching feature provide specific clues to the nature of thecarbonaceous material in the diffuse interstellar medium. Thehydrocarbon feature extends from about 3000 cm"1 (3.33 pm)to 2800 cm"1 (3.57 /an) with subfeatures near 2955, 2925, and2870 cm"1 (3.38, 3.42, and 3.48 /an) (Fig. 1). The positions ofthe first two of these subfeatures are characteristic of the sym-metric C—H stretching frequencies of —CH3 (methyl) and—CH2— (methylene) groups in saturated aliphatic hydrocar-
697
PRECEDING PAGE BUW NOT FILMED
698 SANDFORD, PENDLETON, & ALLAMANDOLA Vol.440
3.3
Wavelength (urn)3.4 3.5 3.6
o.oo
0.05
0.10
0.15
0.20
0.00
(a) GCIRS6&VICygni#12
* * V
(b) GC IRS6 & a Lab Residue Produced by Photolysis
(c) GC IRS6 & the Murchison Meteonte
3100 3050 3000 2950 2900 2850 2800 2750Frequency (cm-1)
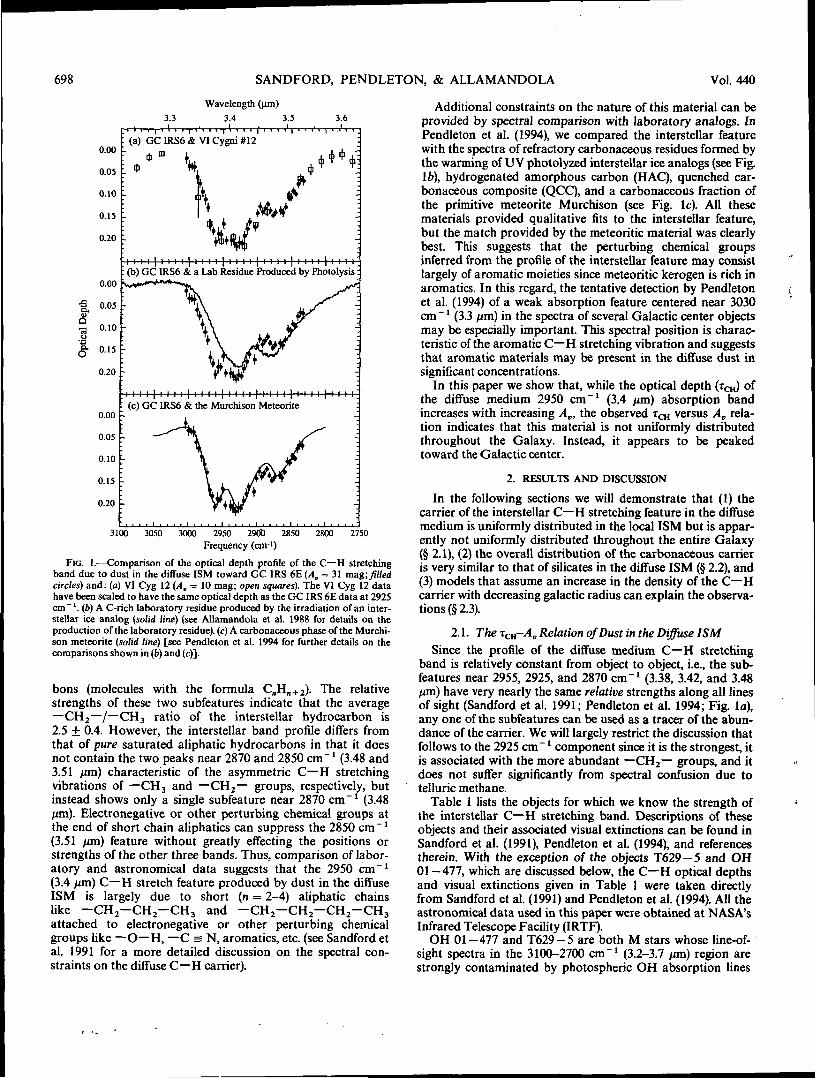
FIG. 1.—Comparison of the optical depth profile of the C—H stretchingband due to dust in the diffuse ISM toward GC IRS 6E (A, = 31 mag; filledcircles) and: (a) VI Cyg 12 (/!„ = 10 mag; open squares). The VI Cyg 12 datahave been scaled to have the same optical depth as the GC IRS 6E data at 2925cm"1. (6) A C-rich laboratory residue produced by the irradiation of an inter-stellar ice analog (solid fine) (see Allamandola et al. 1988 for details on theproduction of the laboratory residue), (c) A carbonaceous phase of the Murchi-son meteorite (solid line) [see Pendleton et al. 1994 for further details on thecomparisons shown in (b) and (c)].
bons (molecules with the formula CnHB+2). The relativestrengths of these two subfeatures indicate that the average—CH2—/—CH3 ratio of the interstellar hydrocarbon is2.5 ± 0.4. However, the interstellar band profile differs fromthat of pure saturated aliphatic hydrocarbons in that it doesnot contain the two peaks near 2870 and 2850 cm"1 (3.48 and3.51 um) characteristic of the asymmetric C—H stretchingvibrations of — CH3 and —CH2— groups, respectively, butinstead shows only a single subfeature near 2870 cm"1 (3.48/mi). Electronegative or other perturbing chemical groups atthe end of short chain aliphatics can suppress the 2850 cm"1
(3.51 um) feature without greatly effecting the positions orstrengths of the other three bands. Thus, comparison of labor-atory and astronomical data suggests that the 2950 cm"1
(3.4 um) C—H stretch feature produced by dust in the diffuseISM is largely due to short (n = 2-4) aliphatic chainslike -CH2-CH2-CH3 and -CH2-CH2-CH2-CH3attached to electronegative or other perturbing chemicalgroups like —O—H, —C = N, aromatics, etc. (see Sandford etal. 1991 for a more detailed discussion on the spectral con-straints on the diffuse C—H carrier).
Additional constraints on the nature of this material can beprovided by spectral comparison with laboratory analogs. InPendleton et al. (1994), we compared the interstellar featurewith the spectra of refractory carbonaceous residues formed bythe warming of UV photolyzed interstellar ice analogs (see Fig.Ife), hydrogenated amorphous carbon (HAC), quenched car-bonaceous composite (QCC), and a carbonaceous fraction ofthe primitive meteorite Murchison (see Fig. Ic). All thesematerials provided qualitative fits to the interstellar feature,but the match provided by the meteoritic material was clearlybest. This suggests that the perturbing chemical groupsinferred from the profile of the interstellar feature may consistlargely of aromatic moieties since meteoritic kerogen is rich inaromatics. In this regard, the tentative detection by Pendletonet al. (1994) of a weak absorption feature centered near 3030cm"1 (3.3 /on) in the spectra of several Galactic center objectsmay be especially important. This spectral position is charac-teristic of the aromatic C—H stretching vibration and suggeststhat aromatic materials may be present in the diffuse dust insignificant concentrations.
In this paper we show that, while the optical depth (TCH) ofthe diffuse medium 2950 cm"1 (3.4 um) absorption bandincreases with increasing Av, the observed TQ, versus Av rela-tion indicates that this material is not uniformly distributedthroughout the Galaxy. Instead, it appears to be peakedtoward the Galactic center.
2. RESULTS AND DISCUSSION
In the following sections we will demonstrate that (1) thecarrier of the interstellar C—H stretching feature in the diffusemedium is uniformly distributed in the local ISM but is appar-ently not uniformly distributed throughout the entire Galaxy(§ 2.1), (2) the overall distribution of the carbonaceous carrieris very similar to that of silicates in the diffuse ISM (§ 2.2), and(3) models that assume an increase in the density of the C—Hcarrier with decreasing galactic radius can explain the observa-tions (§2.3).
2.1. The TCH-AV Relation of Dust in the Diffuse ISMSince the profile of the diffuse medium C—H stretching
band is relatively constant from object to object, i.e., the sub-features near 2955, 2925, and 2870 cm"1 (3.38, 3.42, and 3.48um) have very nearly the same relative strengths along all linesof sight (Sandford et al. 1991; Pendleton et al. 1994; Fig. la),any one of the subfeatures can be used as a tracer of the abun-dance of the carrier. We will largely restrict the discussion thatfollows to the 2925 cm"l component since it is the strongest, itis associated with the more abundant —CH2— groups, and itdoes not suffer significantly from spectral confusion due totelluric methane.
Table 1 lists the objects for which we know the strength ofthe interstellar C—H stretching band. Descriptions of theseobjects and their associated visual extinctions can be found inSandford et al. (1991), Pendleton et al. (1994), and referencestherein. With the exception of the objects T629-5 and OH01 —477, which are discussed below, the C—H optical depthsand visual extinctions given in Table 1 were taken directlyfrom Sandford et al. (1991) and Pendleton et al. (1994). All theastronomical data used in this paper were obtained at NASA'sInfrared Telescope Facility (IRTF).
OH 01-477 and T629-5 are both M stars whose line-of-sight spectra in the 3100-2700 cm"1 (3.2-3.7 um) region arestrongly contaminated by photospheric OH absorption lines
No. 2, 1995 GALACTIC ALIPHATIC C—H DISTRIBUTION 699
TABLE 1
SUMMARY OF OBJECTS CONSIDERED IN THIS STUDY"
Object
GC IRS 7GC IRS 6E ....GC IRS 3T629-5OH 01-477AFGL 2179AFGL 2104VI Cygni 12Ve 2-45BD +404220....HD 229059AS 320HD 194279
Object R.A.(1950)
17"42m29!317 42 28 917 42 29 118 30 23.017 46 12 518 28 56 818 13 37.020 30 53.417 59 00.920 30 34 820 19 23.018 41 34.020 21 33.0
Object Dec!.(1950)
-28°59'13':i-28 5904-28 5914.9-08 4416.6
27 40 49 6-10 01 23.3-18 5949.0+41 0351.6-23 3735.2+ 41 0804+ 37 1435.0-03 5104
40 3548.0
ExtinctionW
313131221912.812.010.06.56.25.35.23.9
^silicate
3.6 + 0.4
3 6 + 0.43.6 + 0.4
0.58 + 0.1
0.26
ICH(2955cm-1)
0.190205023
00500370.0430.02002700230.0180.015
*CH(2925cm-1)
0.190210.240.07°005C
0.0520.0440.0460.020.0250.0280.020.017
• Unless otherwise noted, all values are taken from the best available data in Sandford et al. 1991 and Pendleton et al.1994. TO, uncertainties are on the order of 20% and are generally dominated by uncertainties in the baselines underlyingthe features, ^-values represent best estimates of the extinction due to the diffuse interstellar material only. All extinc-tions are in units of magnitudes.
b Taken from Roche & Aitken 1985.° Values determined after removal of OH photospheric lines.
which partially obscure the diffuse C—H stretch band towardthese objects (Sandford et al. 1991). OH 01 -477 is an infraredsource whose line of sight is very similar to that of the Galacticcenter. This object is coincident with an OH source andappears to be a heavily obscured (Av = 19 mag) M4 III star(Wickramasinghe & Allen 1980; Jones et al. 1982). T269-5 isa very late Mira-type, M8 III star reddened by A, x 22 mag(Tapia 1981; Tapia et al. 1989).
The C—H band optical depths given in Table 1 for these twoobjects were derived by taking the spectra of Sandford et al.(1991) and removing the photospheric OH absorption contri-bution by subtracting the spectra of unobscured M stars. Forunobscured M stars we used ST Ceph and V842 Aql, whosespectra were measured by Pendleton et al. (1994). For severalreasons, this process did not result in optical depths or bandprofiles as precise as those for the other objects listed in Table1. First, the data for the obscured and unobscured stars weretaken during different observing runs and the two sets of datado not agree precisely in resolution and detector positioning.Second, the absolute and relative strengths of the OH lines inM star photospheres are quite sensitive to spectral type, so inpractice it is difficult to use the spectrum of one M star toexactly cancel the OH lines in the spectrum of another M star.However, none of the stronger OH lines fall near 2925 cm"1
(Beer et al. 1972; Sandford et al. 1991; Pendleton et al. 1994)and the derived optical depth of the diffuse C—H stretchingabsorption feature at this position is relatively insensitive tothe interference by photospheric OH. Thus, while it was notpossible to perfectly remove the photospheric lines and therebydetermine the profile of the C—H stretching features towardT629-5 and OH 01 -477, it was possible to use this subtrac-tion technique to obtain reasonable estimates of the opticaldepths of the 2925 cm"1 subfeature toward these objects(Table 1).
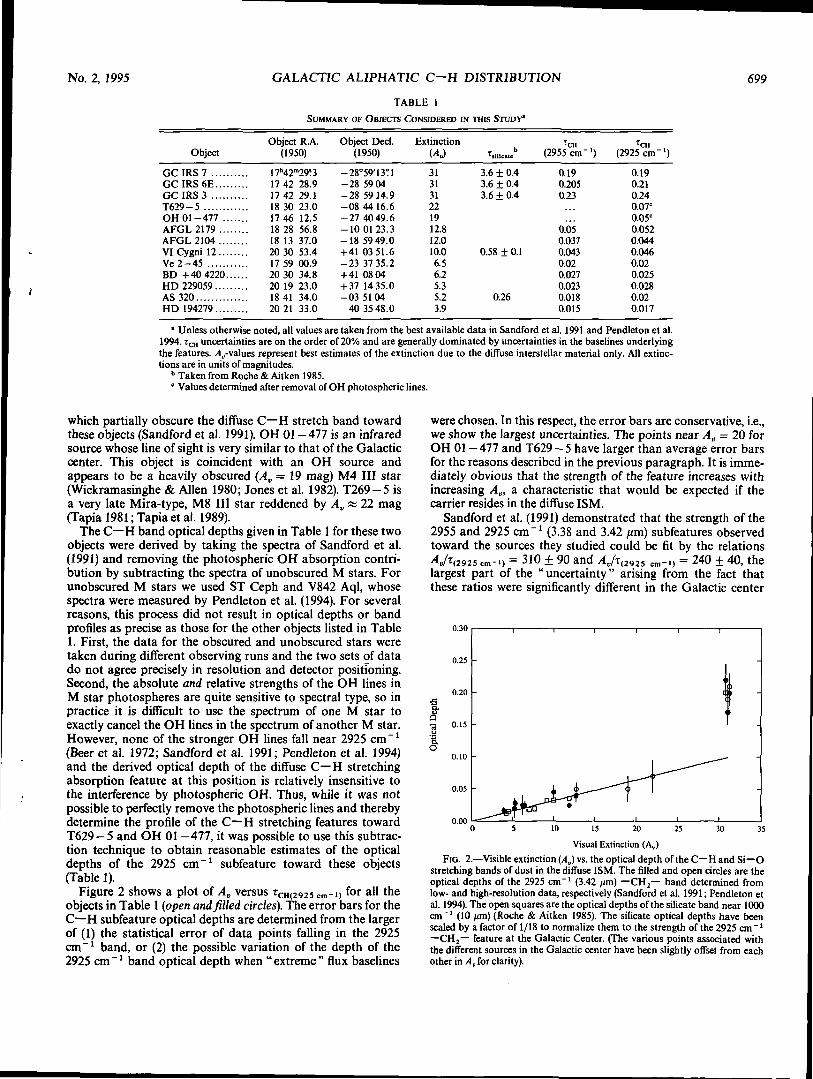
Figure 2 shows a plot of Av versus TCH(2925 cm-i) for all theobjects in Table 1 (open and filled circles). The error bars for theC—H subfeature optical depths are determined from the largerof (1) the statistical error of data points falling in the 2925cm"1 band, or (2) the possible variation of the depth of the2925 cm"1 band optical depth when "extreme" flux baselines
were chosen. In this respect, the error bars are conservative, i.e.,we show the largest uncertainties. The points near Av = 20 forOH 01 —477 and T629 —5 have larger than average error barsfor the reasons described in the previous paragraph. It is imme-diately obvious that the strength of the feature increases withincreasing A,, a characteristic that would be expected if thecarrier resides in the diffuse ISM.
Sandford et al. (1991) demonstrated that the strength of the2955 and 2925 cm"1 (3.38 and 3.42 /zm) subfeatures observedtoward the sources they studied could be fit by the relations4A(292s ««-i) = 310 ± 90 and Av/r(292? „,_,, = 240 ± 40, thelargest part of the " uncertainty" arising from the fact thatthese ratios were significantly different in the Galactic center
0.30
0.25
0.20
O.IO
0.05
0.0020 25 30 35
Visual Extinction (A»)FIG. 2.—Visible extinction (Av) vs. the optical depth of the C—H and Si—O
stretching bands of dust in the diffuse ISM. The filled and open circles are theoptical depths of the 2925 cm"1 (3.42 pm) —CH2— band determined fromlow- and high-resolution data, respectively (Sandford et al. 1991; Pendleton etal. 1994). The open squares are the optical depths of the silicate band near 1000cm"' (10 fan) (Roche & Aitken 1985). The silicate optical depths have beenscaled by a factor of 1/18 to normalize them to the strength of the 2925 cm ~ *—CH2— feature at the Galactic Center. (The various points associated withthe different sources in the Galactic center have been slightly offset from eachother in A, for clarity).
700 SANDFORD, PENDLETON, & ALLAMANDOLA Vol.440
sources studied. These values were subsequently verified byPendleton et al. (1994), who studied additional lines of sight,including sources having lower extinctions. They found4A<2935 cm-) = 270 ± 40 and AJil292i cm-,) = 250 ± 40 forthe local ISM. However, it became clear that the bandstrengths do not increase linearly over the entire Av range, butinstead rise significantly faster at the higher ,4,,-values associ-ated with the Galactic center sources (see Fig. 2 and Pendletonet al. 1994). The A Jf-values for the Galactic center sourcesalone are AJi:(2925cm-,)= 150 ± 15 and AJr(292iem.l} =150 ± 20. Thus, the definition of the diffuse C—H subfea-ture strengths by single Aji ratios, i.e., the assumption of auniform distribution of the carrier with Av, may be an oversimplification.
At this point it is appropriate to briefly consider whether theanomalous AJt ratios for the Galactic center might be due toan inaccurate estimate of the visual extinction of these objects.For example, if the visual extinction to the Galactic center wereactually 60 magnitudes instead of 31 magnitudes, the apparentanomaly would essentially cease to exist. However, there are anumber of arguments that suggest that this is not the case.Numerous previous studies have addressed the issue of thevisual extinction towards the Galactic center and the publishedresults typically fall in the range of Av = 30-35 magnitudes (seeBecklin et al. 1978; Henry, DePoy, & Becklin 1984; Sellgren etal. 1987; Wade et al. 1987; Rieke, Rieke, & Paul 1989). Thisagreement would seem to be reasonably robust given thatthese values have been obtained from several different types ofobjects requiring different assumed intrinsic colors. In addi-tion, using wide field J, H, and K images of the regions sur-rounding the Galactic center, Glass, Catchpole, & Whitelock(1987) demonstrated that the extinction towards the Galacticcenter is " patchy " on large spatial scales due to the distribu-tion of foreground interstellar clouds. Examination of themaps shows that all three of our Galactic center sources lie atthe edge of one of these clouds in the H and K maps. Glass etal. estimate that the extinction associated with the " edges " ofthe clouds seen on their H map correspond to extinctions ofAv ~ 37 magnitudes. The visibility of the region containing ourobjects on their H maps is therefore in good agreement withthe published values of Av of 30-35 magnitudes for the Galac-tic center sources discussed here. Thus, the anomalous AJ-iratios associated with the Galactic center appear to be real andthe assumption of a uniform distribution of the aliphatic C—Hcarrier with Av is not valid. As will be discussed in more detailin § 2.3, a more complicated distribution of material seems tobe implied.
2.2. A Comparison of the Distribution of CarbonaceousMaterials and Silicates in the Diffuse ISM
Included with the rclf-Av relation plotted in Figure 2 (openedand filled circles) is a similar plot of the depth of the 1000 cm ~ *(10 (an) Si—O stretching band of silicates in the diffuse ISM(open squares). The optical depths for the silicate features weretaken from Roche & Aitken (1985), and have been scaled by afactor of 1/18 to match the optical depth of the 2925 cm"1
band at the Galactic center. The two sets of data are remark-ably similar.
Roche & Aitken (1985) demonstrated that the overall ratioof silicate to visual extinction in the Galactic center is abouttwice that of the interstellar medium in the solar neighbor-hood. This implies that the grains responsible for the silicateband are different from those responsible for the observed
visual extinction (or at least they are not solely responsible forthe visual extinction). It also implies that the dust along thetotal line of sight to the Galactic center contains a relativelyhigher proportion of silicates than does the dust in the localsolar neighborhood (or, alternatively, the Galactic center con-tains a lower relative proportion of the material responsible forvisual extinction).
The same relative difference between the Galactic center andthe local ISM is found for the diffuse C—H stretching band(Fig. 2). This suggests that the silicate and carbonaceous com-ponents of the diffuse interstellar medium may be spatiallywell-correlated and leads to similar conclusions, namely thatthe grains responsible for the diffuse medium C—H aliphaticstretching band are different from those responsible for much orall of the observed visual extinction and appear to be concen-trated toward the Galactic center. In the following section wewill present three simple models that further quantify thesepoints.
2.3. Models of the Galactic Distribution of CarbonaceousMaterial in the Diffuse ISM
It is immediately apparent that a simple line cannot fit allthe data in Figure 2. A good linear fit can be made to all thepoints below Av = 22 mag (solid line in Fig. 2), but the Galacticcenter points at A* =31 mag clearly fall well above theextrapolation of this line. As mentioned in the previous section,the nonlinearity of the TQ, versus A, and Tsilicale versus Avrelations indicate that the carriers responsible for the diffusemedium C—H and Si—O stretching bands are different fromthose responsible for much of the observed visual extinction.Thus, there are two different, simple means of explaining ther-Av relations in Figure 2. These are (1) the source of theobserved visual excitation is distributed throughout theGalaxy and the relative abundance of carbonaceous and sili-cate materials in the diffuse ISM increases in the inner parts ofthe Galaxy, and (2) the carriers of the C—H and Si—O stretch-ing bands are distributed throughout the Galaxy and the rela-tive abundance of the source of the visual extinction decreasesin the inner parts of the Galaxy. Of course, some combinationof these two, or a more complex distribution, is also a possi-bility. In the interest of simplicity, the discussion that followswill explore the implications that result if case (1) is true, i.e.,that the relative abundance of the carriers of the C—H andSi—O stretching bands are larger in the Galactic center. Thereader should keep in mind, however, that nothing in our dataset preclude the alternative case. We will return briefly to thispoint later.
Assuming the nonlinearity of the t-Av relations in Figure 2results from an increased relative abundance of the C—H andSi—O carriers toward the Galactic center, several carrier dis-tributions suggest themselves: (1) the distribution of aliphaticcarbonaceous materials is more-or-less uniform in the " local"diffuse medium (solar neighborhood) and a smaller volumearound the Galactic center contains an unusually high concen-tration of this material; (2) there is a uniform gradient in thedensity of aliphatic material in the diffuse medium, with thedensity increasing linearly toward the Galactic center; or (3)the density distribution of the aliphatic material mimics thestellar mass density distribution, i.e., increases exponentiallytoward the Galactic center. These possibilities are explored inthe following paragraphs using some simple models.
In all the models we assume the density of —CH2—absorber responsible for the 2925 cm"1 band (pcH2) is in units
No. 2, 1995 GALACTIC ALIPHATIC C—H DISTRIBUTION 701
of — CH2— groups per cm2 per unit Av, and we chose M to bea variable of extinction running over the range 0 < M < 3 1mag. The column density (NJ of any absorbing species, i, canbe determined from
JV, = ^v^dVi/A, » ^ma,i
where J ij(v,)dv, is the integrated area of a band associated withthe absorber (in cm"1), Tmaxi is the maximum optical depth ofthe band, Av,/2, is the full width at half-maximum (FWHM) ofthe band (in cm ~ l), and A, is the intrinsic strength of that band(in cm molecule"1). Thus, for the specific case of the 2925 cm" l
(3.42 /an) interstellar — CH2— subfeature, we can write
TCH2 Pclt2(M)dM , (1)
where ACH2 is the integrated absorption strength of the 2925cm"1 subfeature due to C—H stretching vibrations in—CH2— groups, TCH2 is the subfeature's maximum opticaldepth, Av1/2CH2 is its full width at half-maximum, and Pcn2(^)is the spatial density of the —CH2— carrier in groups cm"2
mag"1.2.3.1. Model I—A Uniform — CH2— Density with a Higher Value
near the Galactic Center
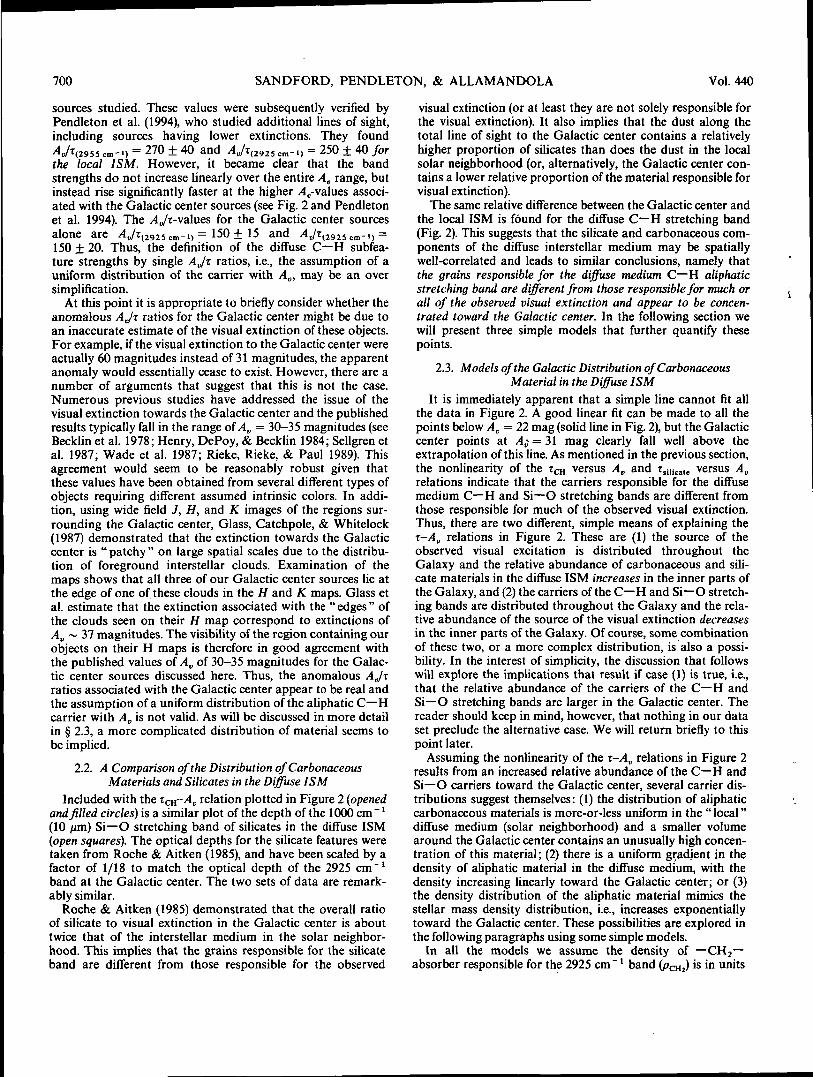
In this model it is assumed that the density (p0) of —CH2—absorber is constant everywhere in the Galaxy except in alimited region around the Galactic center, where the material ispresent at a higher density (PQC). The crossover to the higherdensity domain is assumed to occur at an Av of A1 where 22mag < AI < 31 mag (see Figs. 2 and 3a and Table 2). Thus, wehave
(2))p0 for 0 s M < Al
[PGC for /4t < M < 31 mag .
Substituting this form of the density into equation (1) yields
{(/!CH2/Av1/2CH2)(p0 A,) for 0 mag < A, < Al
(4cH2/Avi/2CH2)[(Po AJ + po^Av - AJ] (3)
for /4j < Av < 31 mag ,
which produces an optical depth function (and therefore
PI
(a) Assumed Garner Density Function for Model I
Visual Extinction (Av)31
0.30
0.25
g 0.20
8
0.05
0.00
(b) Model I Fit to Optical Depth Data(A, = 25 mag)
10 15 20 25Visual Extinction (Av)
30 35
FIG. 3.—(a) Density distribution of the carbonaceous carrier assumed inModel I, i.e., the density (p0) of —CH2— absorber is constant everywhereexcept in a limited region around the Galactic center, where the material ispresent at a higher density (poc). (b) Comparison between the optical depthfunction of the 2925 cm"' band and Model I using the parameter values givenin Table 2, Al = 25 mag, and pac = 0.02 —CH2— cm"2 mag"1 (see text fordetails). The points have the same meanings as given in Fig. 1.
column density function) of the form shown by the solid line inFigure 3b.
It is possible to fit the data in Figure 2 with a function of thisform by making a least squares linear fit to all the TCH databelow Av = 25 mag (first segment of solid line in Fig. 3b). Thisfit essentially passes through the T629 — 5 point at TCH2 = 0.07
TABLE 2
SUMMARY OF THE DENSITY MODELS DESCRIBED IN THE TEXT AND THEIR PARAMETERS"
Functional Form Best-Fit Parameters
MODEL I:
-I > A„) for 0 <, A, < Al p0 = 0.0032 (^iII1CHJAm^ mag"'
,('WAv1/2CH2)[(p0,41) + P*AA» ~ AM for Ai ^ A» < 31 ma8 Poc = 0.014-0.104 (Av,,^//!^) mag"1
>0A,) for 05 A , < A t
MODEL II:
MODEL HI:
N = [-C2
^afcJT.-Cj + (p0- C2)A, C2eAJ
22 rnag^/4, < 31 mag
p0 = 0.0012 (AV^CH^XC,,,) mag"C = 0.00032 (Av.^cn^cHj mag"
Po = 0.0027 (Av^cH/do,,) mag"1
C, = 7.16 x 10"' (Av.^Xc,,,) mag"2
C2 = 2.52 x 10"15 (Av^oJXc,,,) mag-
1 For the diffuse medium 2925 cm ' C—H stretching subfeature due to —CH2— groups, use ACHl = 8 x 10 '8 cm/CH2
group and Av,/2CHj = 20 cm"' (Sandford et al. 1991). All extinctions are in units of magnitudes.
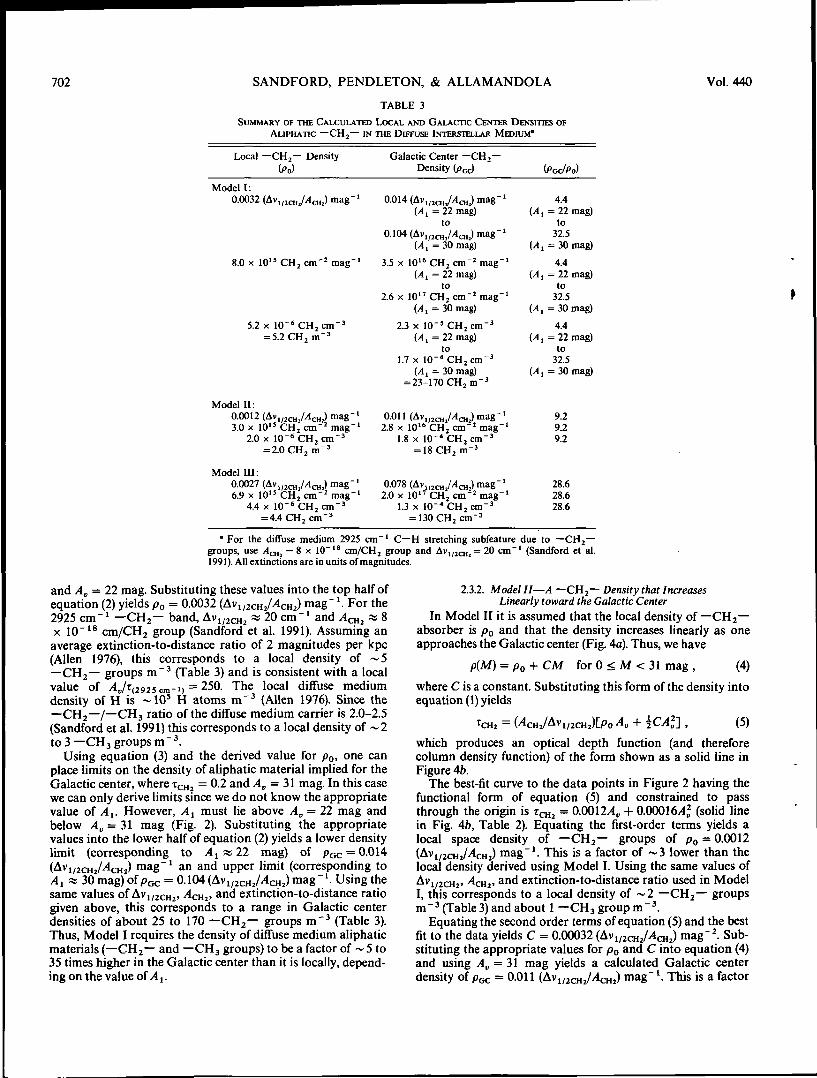
702 SANDFORD, PENDLETON, & ALLAMANDOLA Vol.440
TABLE 3
SUMMARY OF THE CALCULATED LOCAL AND GALACTIC CENTER DENSITIES OFALIPHATIC —CH2— IN THE DIFFUSE INTERSTELLAR MEDIUM*
Local — CH2— Density(Po)
Galactic Center —CH2—Density (PGC) (Poc/Po)
Model I:0.0032 (towcaJAa,,) mag'1
8.0 x 10¹⁵CH2cm"2mag-'
5.2 x 1(T6 CH2cm'3= 5.2CH2m-3
0.014 (Av,,^/^) mag-'(Al = 22 mag)
to0.104 (Av^cH^c,,,) mag'1
(X, = 30mag)
3.5 x 10¹⁶CH2cm-2mag-'(Al = 22 mag)
to2.6 x 1017 CH2 cm'2 mag'1
(Al = 30 mag)
2.3 x IQ- 'CHjCm- 3
(A, = 22 mag)to
1.7 x 10-*CH2cm-3
(/I, = 30 mag)= 23-170 CH2m-3
M,
M,
M,
Mi
Mi
M,
4.4= 22 mag)
to32.5
= 30 mag)
4.4= 22 mag)
to32.5
= 30 mag)
4.4= 22 mag)
to32.5
= 30 mag)
Model II:0.0012 (AV^JCH^O,,) mag-3.0 x 10¹⁵ CH2 cm'2 mag-
2.0 x 10⁻⁶CH2cm-3
= 2.0 CH, m~
Model III:0.0027 (Av6.9 x 10'
4.4 x 10⁻⁶ CH2 cm'4.4 CH, cm'
I mag' mag"
0.011 (ton^JAcHJ mag~2.8 x 10¹⁶ CH2 cm-2 mag-
1.8 x 10-*CH2cm-3
= 18 CH, m-3
0.078 (Avi^c^/AcH,) mag"2.0 x 10¹⁷ CH2 cm"2 mag"
1.3 x 10⁻⁴CH2cm-3
= 130CH, cm"3
9.29.29.2
28.628.628.6
• For the diffuse medium 2925 cm l C—H stretching subfeature due to —CH2—groups, use A = 8 x 10~18 cm/CH2 group and Av1/2CHl = 20 cm"1 (Sandford et al.1991). All extinctions are in units of magnitudes.
and Av = 22 mag. Substituting these values into the top half ofequation (2) yields p0 = 0.0032 (Av1/2CH2MCH2) mag"1. For the2925 cm"1 —CH2— band, Av1/2CH2 « 20 cm"1 and /1CH2 » 8x 10"18 cm/CH2 group (Sandford et al. 1991). Assuming anaverage extinction-to-distance ratio of 2 magnitudes per kpc(Allen 1976), this corresponds to a local density of ~5—CH2— groups m"3 (Table 3) and is consistent with a localvalue of AV/T(2925 cm-') = 25°- The local diffuse mediumdensity of H is ~105 H atoms m"3 (Allen 1976). Since the—CH2—/—CH3 ratio of the diffuse medium carrier is 2.0-2.5(Sandford et al. 1991) this corresponds to a local density of ~2to 3 —CH3 groups m"3.
Using equation (3) and the derived value for p0, one canplace limits on the density of aliphatic material implied for theGalactic center, where TCH2 = 0.2 and Av = 31 mag. In this casewe can only derive limits since we do not know the appropriatevalue of /4t. However, At must lie above Att = 22 mag andbelow Av = 31 mag (Fig. 2). Substituting the appropriatevalues into the lower half of equation (2) yields a lower densitylimit (corresponding to At «22 mag) of PGC = 0.014(Avi/2CH2McHj) maB ~l an and upper limit (corresponding toAl w 30 mag) of p^ = 0.104 (Av1/2CH2//4cH2) mag"l. Using thesame values of Av1/2CH2, /4cn2> and extinction-to-distance ratiogiven above, this corresponds to a range in Galactic centerdensities of about 25 to 170 — CH2— groups m"3 (Table 3).Thus, Model I requires the density of diffuse medium aliphaticmaterials (—CH2— and —CH3 groups) to be a factor of ~ 5 to35 times higher in the Galactic center than it is locally, depend-ing on the value of A,.
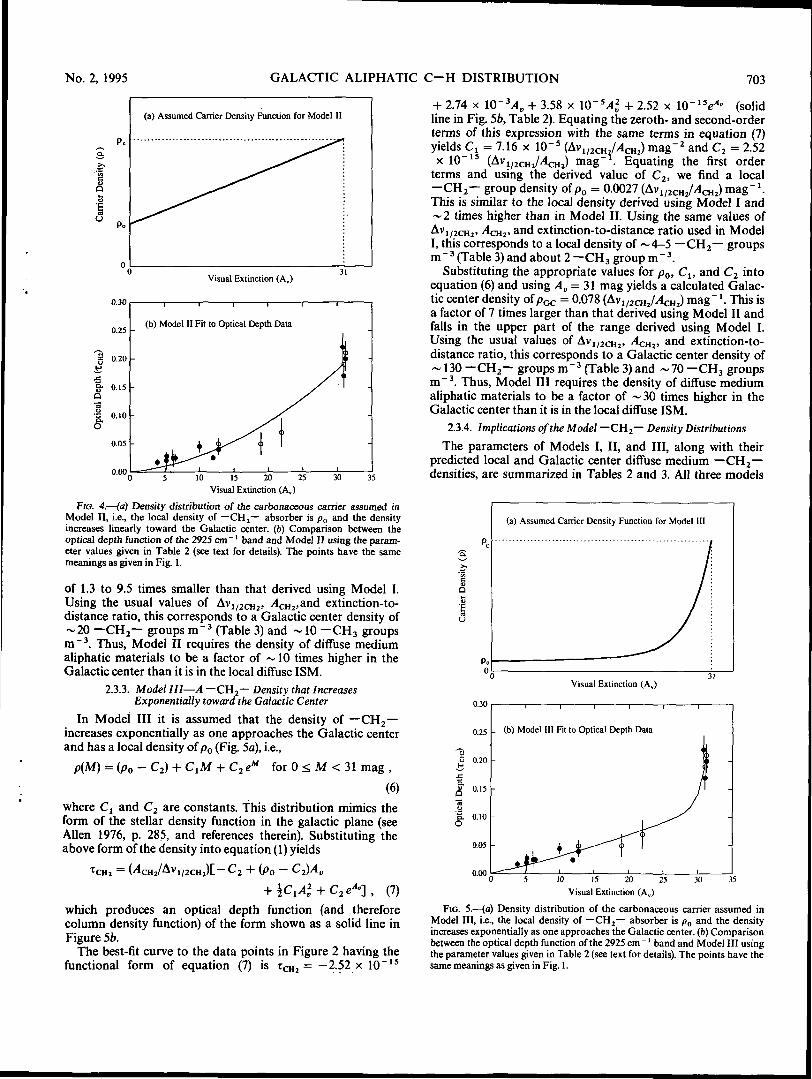
2.3.2. Model II—A —CH2— Density that IncreasesLinearly toward the Galactic Center
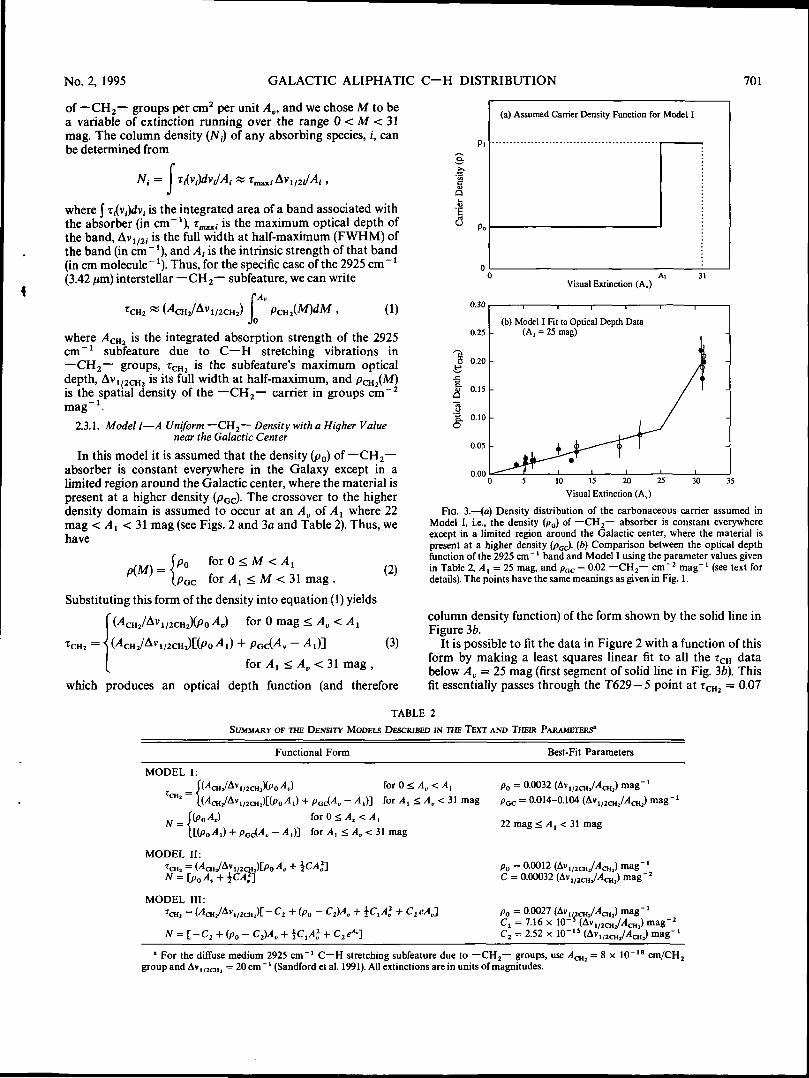
In Model II it is assumed that the local density of —CH2—absorber is p0 and that the density increases linearly as oneapproaches the Galactic center (Fig. 4a). Thus, we have
p(M) = PO + CM for 0 < M < 31 mag , (4)
where C is a constant. Substituting this form of the density intoequation (1) yields
which produces an optical depth function (and thereforecolumn density function) of the form shown as a solid line inFigure 4b.
The best-fit curve to the data points in Figure 2 having thefunctional form of equation (5) and constrained to passthrough the origin is Tm2 = 0.0012/1,, + 0.00016/12 (solid linein Fig. 4b, Table 2). Equating the first-order terms yields alocal space density of —CH2— groups of p0 = 0.0012(Av1/2CH2McHj) mag"1. This is a factor of ~3 lower than thelocal density derived using Model I. Using the same values ofAv1/2CH2, Ami, and extinction-to-distance ratio used in ModelI, this corresponds to a local density of ~2 —CH2— groupsm "3 (Table 3) and about 1 —CH3 group m "3.
Equating the second order terms of equation (5) and the bestfit to the data yields C = 0.00032 (f^ll2CHJA^ mag"2. Sub-stituting the appropriate values for p0 and C into equation (4)and using Av = 31 mag yields a calculated Galactic centerdensity of p^ = 0.011 (Av1/2CH2//lCH2) mag" *. This is a factor
No. 2, 1995 GALACTIC ALIPHATIC C~H DISTRIBUTION 703
(a) Assumed Carrier Density Function for Model II
Visual Extinction (Ay)
0.30
0.25
0.20
0.15
•| 0.10o
0.05
0.00
(b) Model II Fit to Optical Depth Data
10 15 20 25
Visual Extinction (Av)30
FZG. 4 — (a) Density distribution of the carbonaceous carrier assumed inModel II, i.e., the local density of — CH2— absorber is pa and the densityincreases linearly toward the Galactic center, (b) Comparison between theoptical depth function of the 2925 cm ~ ' band and Model II using the param-eter values given in Table 2 (see text for details). The points have the samemeanings as given in Fig. 1.
of 1.3 to 9.5 times smaller than that derived using Model I.Using the usual values of Avi/2CH2, <4CH2,and extinction-to-distance ratio, this corresponds to a Galactic center density of~20 — CH2— groups m~3 (Table 3) and ~ 10 — CH3 groupsm"3. Thus, Model II requires the density of diffuse mediumaliphatic materials to be a factor of ~ 10 times higher in theGalactic center than it is in the local diffuse ISM.
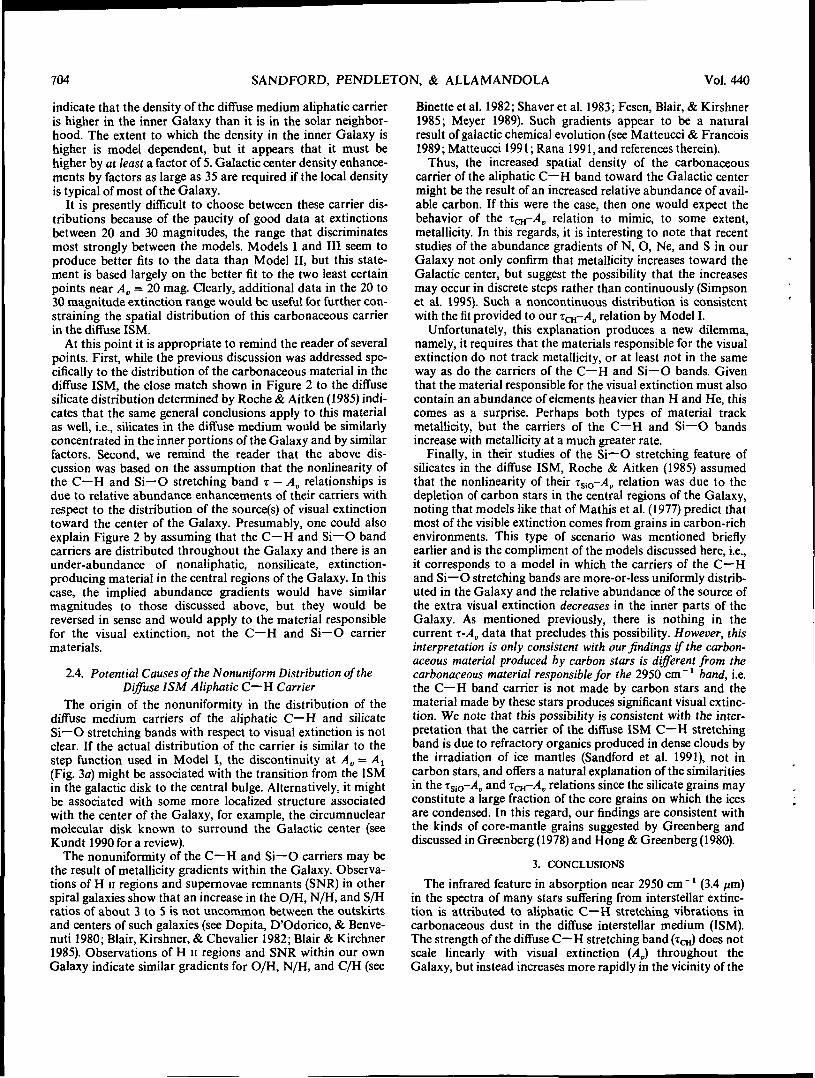
2.3.3. Model III — A — CH2— Density that IncreasesExponentially toward the Galactic Center
In Model HI it is assumed that the density of — CH2—increases exponentially as one approaches the Galactic centerand has a local density of p0 (Fig. 5a), i.e.,
p(M) = (po - C2) + CjM + C2 eM for 0 <, M < 31 mag ,
(6)where C, and C2 are constants. This distribution mimics theform of the stellar density function in the galactic plane (seeAllen 1976, p. 285, and references therein). Substituting theabove form of the density into equation (1) yields
+ IdA* + C2eA°-] , (7)
which produces an optical depth function (and thereforecolumn density function) of the form shown as a solid line inFigure 5b.
The best-fit curve to the data points in Figure 2 having thefunctional form of equation (7) is TCH2 = —2.52 x 10~15
yields^, = 7.16 x HT5 (Av1x 10 15
+ 2.74 x 1(T X + 3.58 x 10 ~5A2V + 2.52 x 10 ~lse*' (solid
line in Fig. 56, Table 2). Equating the zeroth- and second-orderterms of this expression with the same terms in equation (7)
1/2CH JAmi) mag'2 and C2 = 2.52mag . Equating the first order
terms and using the derived value of C2, we find a local-CH2- group density of p0 = 0.0027 (to i,1CnJ AmJ mag' l.This is similar to the local density derived using Model I and~ 2 times higher than in Model II. Using the same values ofAviy2CH2> ^CHJ. and extinction-to-distance ratio used in ModelI, this corresponds to a local density of ~4-5 — CH2— groupsm~3 (Table 3) and about 2 — CH3 group m~3.
Substituting the appropriate values for p0, Ct, and C2 intoequation (6) and using Av = 31 mag yields a calculated Galac-tic center density of pac = 0.078 (Av1/2cH2/MCH2) mag~ '. This isa factor of 7 times larger than that derived using Model II andfalls in the upper part of the range derived using Model I.Using the usual values of Av1/2CH2, ACHl, and extinction-to-distance ratio, this corresponds to a Galactic center density of~ 130 — CH2— groups m"3 (Table 3) and ~ 70 — CH3 groupsm"3. Thus, Model III requires the density of diffuse mediumaliphatic materials to be a factor of ~ 30 times higher in theGalactic center than it is in the local diffuse ISM.
2.3.4. Implications of the Model — CH2— Density Distributions
The parameters of Models I, II, and III, along with theirpredicted local and Galactic center diffuse medium — CH2—densities, are summarized in Tables 2 and 3. All three models
Q
I
0.30
(a) Assumed Carrier Density Function for Model HI
Visual Extinction (Av)
_ (b) Model III Fit to Optical Depth Data
0.0010 15 20 25
Visual Extinction (Av)
30
FIG. 5.—(a) Density distribution of the carbonaceous carrier assumed inModel III, i.e., the local density of —CH2— absorber is p0 and the densityincreases exponentially as one approaches the Galactic center, (b) Comparisonbetween the optical depth function of the 2925 cm"' band and Model III usingthe parameter values given in Table 2 (see text for details). The points have thesame meanings as given in Fig. 1.
704 SANDFORD, PENDLETON, & ALLAMANDOLA Vol.440
indicate that the density of the diffuse medium aliphatic carrieris higher in the inner Galaxy than it is in the solar neighbor-hood. The extent to which the density in the inner Galaxy ishigher is model dependent, but it appears that it must behigher by at least a factor of 5. Galactic center density enhance-ments by factors as large as 35 are required if the local densityis typical of most of the Galaxy.
It is presently difficult to choose between these carrier dis-tributions because of the paucity of good data at extinctionsbetween 20 and 30 magnitudes, the range that discriminatesmost strongly between the models. Models I and III seem toproduce better fits to the data than Model II, but this state-ment is based largely on the better fit to the two least certainpoints near Av = 20 mag. Clearly, additional data in the 20 to30 magnitude extinction range would be useful for further con-straining the spatial distribution of this carbonaceous carrierin the diffuse ISM.
At this point it is appropriate to remind the reader of severalpoints. First, while the previous discussion was addressed spe-cifically to the distribution of the carbonaceous material in thediffuse ISM, the close match shown in Figure 2 to the diffusesilicate distribution determined by Roche & Aitken (1985) indi-cates that the same general conclusions apply to this materialas well, i.e., silicates in the diffuse medium would be similarlyconcentrated in the inner portions of the Galaxy and by similarfactors. Second, we remind the reader that the above dis-cussion was based on the assumption that the nonlinearity ofthe C—H and Si—O stretching band T — Av relationships isdue to relative abundance enhancements of their carriers withrespect to the distribution of the source(s) of visual extinctiontoward the center of the Galaxy. Presumably, one could alsoexplain Figure 2 by assuming that the C—H and Si—O bandcarriers are distributed throughout the Galaxy and there is anunder-abundance of nonaliphatic, nonsilicate, extinction-producing material in the central regions of the Galaxy. In thiscase, the implied abundance gradients would have similarmagnitudes to those discussed above, but they would bereversed in sense and would apply to the material responsiblefor the visual extinction, not the C—H and Si—O carriermaterials.
2.4. Potential Causes of the Nonuniform Distribution of theDiffuse ISM Aliphatic C—H Carrier
The origin of the nonuniformity in the distribution of thediffuse medium carriers of the aliphatic C—H and silicateSi—O stretching bands with respect to visual extinction is notclear. If the actual distribution of the carrier is similar to thestep function used in Model I, the discontinuity at Av = A^(Fig. 3a) might be associated with the transition from the ISMin the galactic disk to the central bulge. Alternatively, it mightbe associated with some more localized structure associatedwith the center of the Galaxy, for example, the circumnuclearmolecular disk known to surround the Galactic center (seeKundt 1990 for a review).
The nonuniformity of the C—H and Si—O carriers may bethe result of metallicity gradients within the Galaxy. Observa-tions of H n regions and supernovae remnants (SNR) in otherspiral galaxies show that an increase in the O/H, N/H, and S/Hratios of about 3 to 5 is not uncommon between the outskirtsand centers of such galaxies (see Dopita, D'Odorico, & Benve-nuti 1980; Blair, Kirshner, & Chevalier 1982; Blair & Kirchner1985). Observations of H n regions and SNR within our ownGalaxy indicate similar gradients for O/H, N/H, and C/H (see
Binette et al. 1982; Shaver et al. 1983; Fesen, Blair, & Kirshner1985; Meyer 1989). Such gradients appear to be a naturalresult of galactic chemical evolution (see Matteucci & Francois1989; Matteucci 1991; Rana 1991, and references therein).
Thus, the increased spatial density of the carbonaceouscarrier of the aliphatic C—H band toward the Galactic centermight be the result of an increased relative abundance of avail-able carbon. If this were the case, then one would expect thebehavior of the icH~Aa relation to mimic, to some extent,metallicity. In this regards, it is interesting to note that recentstudies of the abundance gradients of N, O, Ne, and S in ourGalaxy not only confirm that metallicity increases toward theGalactic center, but suggest the possibility that the increasesmay occur in discrete steps rather than continuously (Simpsonet al. 1995). Such a noncontinuous distribution is consistentwith the fit provided to our rai-Av relation by Model I.
Unfortunately, this explanation produces a new dilemma,namely, it requires that the materials responsible for the visualextinction do not track metallicity, or at least not in the sameway as do the carriers of the C—H and Si—O bands. Giventhat the material responsible for the visual extinction must alsocontain an abundance of elements heavier than H and He, thiscomes as a surprise. Perhaps both types of material trackmetallicity, but the carriers of the C—H and Si—O bandsincrease with metallicity at a much greater rate.
Finally, in their studies of the Si—O stretching feature ofsilicates in the diffuse ISM, Roche & Aitken (1985) assumedthat the nonlinearity of their Tsi0-y4,, relation was due to thedepletion of carbon stars in the central regions of the Galaxy,noting that models like that of Mathis et al. (1977) predict thatmost of the visible extinction comes from grains in carbon-richenvironments. This type of scenario was mentioned brieflyearlier and is the compliment of the models discussed here, i.e.,it corresponds to a model in which the carriers of the C—Hand Si—O stretching bands are more-or-less uniformly distrib-uted in the Galaxy and the relative abundance of the source ofthe extra visual extinction decreases in the inner parts of theGalaxy. As mentioned previously, there is nothing in thecurrent i-Aa data that precludes this possibility. However, thisinterpretation is only consistent with our findings if the carbon-aceous material produced by carbon stars is different from thecarbonaceous material responsible for the 2950 cm"1 band, i.e.the C—H band carrier is not made by carbon stars and thematerial made by these stars produces significant visual extinc-tion. We note that this possibility is consistent with the inter-pretation that the carrier of the diffuse ISM C—H stretchingband is due to refractory organics produced in dense clouds bythe irradiation of ice mantles (Sandford et al. 1991), not incarbon stars, and offers a natural explanation of the similaritiesin the rSi0-Aa and fcn-^v relations since the silicate grains mayconstitute a large fraction of the core grains on which the icesare condensed. In this regard, our findings are consistent withthe kinds of core-mantle grains suggested by Greenberg anddiscussed in Greenberg (1978) and Hong & Greenberg (1980).
3. CONCLUSIONS
The infrared feature in absorption near 2950 cm"1 (3.4 urn)in the spectra of many stars suffering from interstellar extinc-tion is attributed to aliphatic C—H stretching vibrations incarbonaceous dust in the diffuse interstellar medium (ISM).The strength of the diffuse C—H stretching band (tea) does notscale linearly with visual extinction (/4P) throughout theGalaxy, but instead increases more rapidly in the vicinity of the
No. 2, 1995 GALACTIC ALIPHATIC C—H DISTRIBUTION 705
Galactic center. This implies that the grains responsible for thediffuse medium C—H aliphatic stretching band are differentfrom those responsible for much of the observed visual extinc-tion. This also suggests that the distribution of the carbon-aceous component of the diffuse ISM is not uniformthroughout the Galaxy.
Several simple models of the distribution of the materialwere presented. It was demonstrated that, while the inferredincrease in carrier density towards the Galactic center is modeldependent, the inner part of the Galaxy has a relative carrierdensity that is at least 5 times higher than the local ISM andwhich could be as much as 35 times higher. Depending on themodel used, the local space density of — CH2— groups in thecarrier can range from about 2 to 5 —CH2— groups m~3. Thedensity of —CH3 groups in this material are a factor of 2.0 to2.5 times smaller. These densities are consistent with thestrengths of the 2955 and 2925 cm"1 subfeatures (due to—CH3 and —CH2— groups, respectively) being described bythe relations AJ-c(29SSem- t) = 270 + 40 and /4U/T(2925cm- l} =250 ± 40 in the local diffuse ISM. Additional high quality mea-surements, especially of objects suffering extinctions in theAv = 20-30 mag range, will be needed to better constrain thecarrier density distribution.
The relationship between the strength of the 2950 cm'1 (3.4diffuse band (TCH) and visual extinction (Av] closely
matches that of silicate materials in the diffuse ISM, suggestingthat the silicate and organic components of the diffuse inter-stellar medium are spatially well-correlated. In this regard, ourfindings are consistent with the idea that the silicates and thecarbonaceous material responsible for the 2950 cm ~l band arein the form of core-mantle grains. The close correlation of thestrengths of the silicate Si—O and aliphatic C—H stretchingbands and their simultaneous lack of linear correlation with Aaindicates that a substantial portion of the visual extinction inthe diffuse interstellar medium is produced by an additional,spatially uncorrelated component or components.
We are grateful to M. Bernstein, M. Haas, J. Simpson, andespecially T. Roellig for useful discussions. The paper alsobenefitted for the remarks of an anonymous referee. This workwas supported in part by NASA grants 199-52-12-04 and185-52-12-09 (Exobiology), 452-33-93-03 (Origins of SolarSystems), and 188-44-21-04 (Astrophysics).
REFERENCES
Adamson, A. J., Whittet, D. C. B., & Duley, W. W. 1990, MNRAS, 243,400Allamandola, L. J. 1984, in Galactic and Extragalactic Infrared Spectroscopy,
ed. M. Kessler & P. Phillips (Dordrecht: Reidel), 5Allamandola, L. J., Sandford, S. A., & Valero, G. J. 1988, Icarus, 76, 225Allen, C. W. 1976, Astrophysical Quantities (London: Athlone)Allen, D. A., & Wickramasinghe, D. T. 1981, Nature, 294,239Becklin, E. E., Matthews, K., Neugebauer, G., & Willner, S. P. 1978, ApJ, 220,
831Beer, R., Hutchison, R. B., Norton, R. H, & Lambert, D. L. 1972, ApJ, 172,89Binette, L., Dopita, M. A., D'Odorico, S., & Benvenuti, P. 1982, A&A, 115,315Blair, W. P., & Kirshner, R. P. 1985, ApJ, 289, 582Blair, W. P., Kirshner, R. P., & Chevalier, R. A. 1982, ApJ, 254,50Butchart, I., McFadzean, A. D., Whittet, D. C. B., Geballe, T. R., & Greenberg,
J. M. 1986, A&A, 154, L5Dopita, M. A., D'Odorico, S., & Benvenuti, P. 1980, ApJ, 236,628Fesen, R. A., Blair, W. P., & Kirshner, R. P. 1985, ApJ, 292,29Glass, I. S., Catchpole, R. M., & Whitelock, P. A. 1987, MNRAS, 227, 373Greenberg, J. M. 1978, in Cosmic Dust, ed. J. A. M. McDonnell (New York:
Wiley), 187. 1989, in Interstellar Dust, ed. L. J. Allamandola & A. G. G. M. Tielens
(Dordrecht: Kluwer), 345Greenberg, J. M., & Chlewicki, G. 1983, ApJ, 272,563Greenberg, J. M., & Hong, S. S. 1974, in ESLAB Symp. 8, ed. A. F. M.
Moorwood(ESRO SP-105), 153Henry, J. P., DePoy, D. L., & Becklin, E. E. 1984, ApJ, 285, L27Hong, S., & Greenberg, J. M. 1980, A&A, 88,194Jones, A. P., Duley, W. W., & Williams, D. A. 1987, MNRAS, 229, 213Jones, T. J., Hyland, A. R., & Allen, D. A. 1983, MNRAS, 205,187Jones, T. J., Hyland, A. R., Caswell, J. L., & Galley, I. 1982, ApJ, 253, 208Kundt, W. 1990, A&SS, 172,109Mathis, J. S. 1989, in Interstellar Dust, ed. L. J. Allamandola & A. G. G. M.
Tielens (Dordrecht: Kluwer), 357Mathis, J. S., Rumpl, W., & Nordsieck, K. H. 1977, ApJ, 217,425Mathis, J. S., & Whiffen, G. 1989, ApJ, 341,808Matteucci, F. 1991, in ASP Conf. Ser. 20, Frontiers of Stellar Evolution, ed.
D. L. Lambert (San Francisco: ASP), 539
Matteucci, F., & Francois, P. 1989, MNRAS, 239, 885McFadzean, A. D., Whittet, D. C. B., Longmore, A. J., Bode, M. F., &
Adamson, A. J. 1989, MNRAS, 241,873Meyer, J.-P. 1989, in Cosmic Abundances of Matter, ed. C. J. Waddington
(New York :AIP), 245Pendleton, Y. 1994, in ASP Conf. Ser. 58, Infrared Cirrus and Diffuse Dust, ed.
R. Cutri & W. Latter (San Francisco: ASP), in pressPendleton, Y. J., Sandford, S. A., Allamandola, L. J., Tielens, A. G. G. M., &
Sellgren, K. 1994, ApJ, 437,683Rana, N. C. 1991, ARA&A, 29,129Rieke, G. H., Rieke, M. J., & Paul, A. E. 1989, ApJ, 336,752Roche, P. F., & Aitken, D. K. 1985, MNRAS, 215,425Sandford, S. A., Allamandola, L. J., Tielens, A. G. G. M., Sellgren, K., Tapia,
M., & Pendleton, Y. 1991, ApJ, 371,607Sellgren, K., Hall, D. N. B., Kleinmann, S. G., & Scoville, N. Z. 1987, ApJ, 317,
881Shaver, P. A., McGee, R. X., Newton, L. M., Danks, A. C., & Pottasch, S. R.
1983, MNRAS, 204, 53Simpson, J. P., Colgan, S. W. J., Rubin, R. H., Erickson, E. F., & Haas, M. R.
1995, ApJ, 444, in pressSoifer, B. T., Russell, R. W., & Merrill, R. M. 1976, ApJ, 207, L83Tapia, M. 1981, MNRAS, 197,949Tapia, M., Persi, P., Roth, M., & Ferrari-Toniolo, M. 1989, A&A, 225,488Tielens, A. G. G. M., & Allamandola, L. J. 1987, in Physical Processes in
Interstellar Clouds, ed. G. E. Morfill, & M. Scholer (Dordrecht: Reidel), 333Wade, R., Geballe, T. R., Krisciunas, K., Galley, I., & Bird, M. C. 1987, ApJ,
320,570Wickramasinghe, D. T., & Allen, D. A. 1980, Nature, 287,518
. 1983, A&SS, 97,369Williams, D. 1989, in Interstellar Dust, ed. L. J. Allamandola & A. G. G. M.
Tielens (Dordrecht: Kluwer), 367Willner, S. P., & Pipher, J. L. 1982, in AIP Conf. Proc. No. 83, The Galactic
Center, ed. G. R. Reigler & R. D. Blandford (New York: AIP), 77Willner, S. P., Russell, R. W., Puetter, R. C., Soifer, B. T., & Harvey, P. M. 1979,
ApJ, 229, L65