Embed Size (px)
Citation preview

Nat
iona
l Aer
onau
tics
and
Spa
ce A
dmin
istra
tion NASA Applications of Structural Health
Monitoring Technology
W. Lance Richards1, Eric Madaras2, William H. Prosser3, and George Studor 3
NASA Dryden Flight Research Center, Edwards, California NASA Langley Research Center, Hampton, Virginia
NASA Engineering and Safety Center, Hampton, Virginia NASA Johnson Space Center, Houston, Texas
September 2013
https://ntrs.nasa.gov/search.jsp?R=20140010525 2018-05-29T00:45:34+00:00Z

Nat
iona
l Aer
onau
tics
and
Spa
ce A
dmin
istra
tion
NASA Focused Structural Health Monitoring
Structures
Materials
SHM
NDE
Key Drivers Vehicle-focused
Real-time, decision-making
Online processing Onboard systems
Lightweight, Small size, Low power,
System solutions
Enabling Technologies
Advanced Sensing - Multi-parameter - Sensor arrays
Advanced Systems and Processing
- Solid state - Rugged - High Speed
Ultra-Efficient Algorithms
Nat
iona
l Aer
onau
tics
and
Spa
ce A
dmin
istra
tion
Reentryry ReentrryVehicles
yeses hicle
Vehicle e Vehiclee Pressure
e rere Pressur
Systemsrre
msmmss
Compositete Crew
esittew
Modulelele
ComposComposCrewCrew
osww
Internationalal ternationSpace
aaioncece Spacce
Stationenn
Vehiclee
Launchhh LaunchVehicles
heses
Space Vehicleses
CrewwCreww ModulModuulll
Uninhabitedd UninhabitedAerial Vehicleseses
Space Shuttlelele pace ShutthOrbiter
tltlhutthutterer
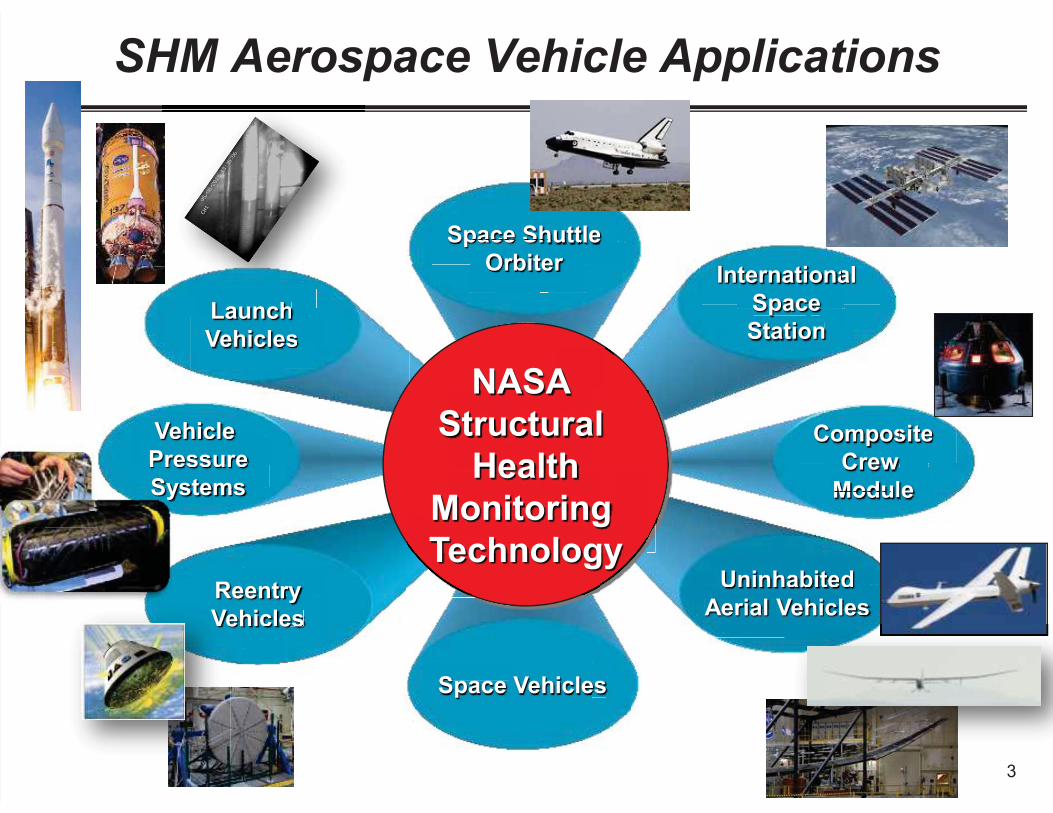
NASA Structural
Health Monitoring Technology
SHM Aerospace Vehicle Applications
3
Sy
VeVe
Nat
iona
l Aer
onau
tics
and
Spa
ce A
dmin
istra
tion
4
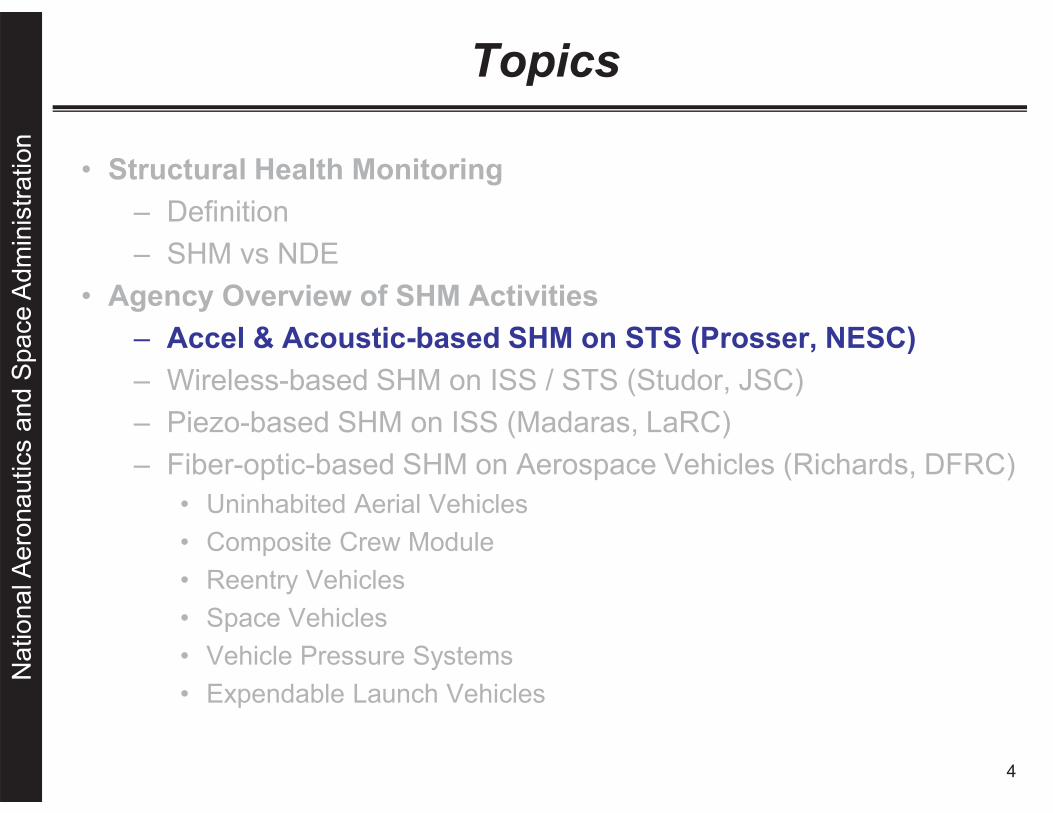
Topics
• Structural Health Monitoring – Definition – SHM vs NDE
• Agency Overview of SHM Activities – Accel & Acoustic-based SHM on STS (Prosser, NESC) – Wireless-based SHM on ISS / STS (Studor, JSC) – Piezo-based SHM on ISS (Madaras, LaRC) – Fiber-optic-based SHM on Aerospace Vehicles (Richards, DFRC)
• Uninhabited Aerial Vehicles • Composite Crew Module • Reentry Vehicles • Space Vehicles • Vehicle Pressure Systems • Expendable Launch Vehicles

Nat
iona
l Aer
onau
tics
and
Spa
ce A
dmin
istra
tion
Space Shuttle Orbiter Wing Leading Edge Impact Detection System (WLEIDS)

Wing Leading Edge Impact Detection System (WLEIDS) Development
• Columbia accident investigation testing - Recovery of DFI sensor data on MADS focused impact testing
on RCC • Additional impact testing
- Ascent impacts - MMOD impacts
• Vehicle testing • System development and implementation • Flight results
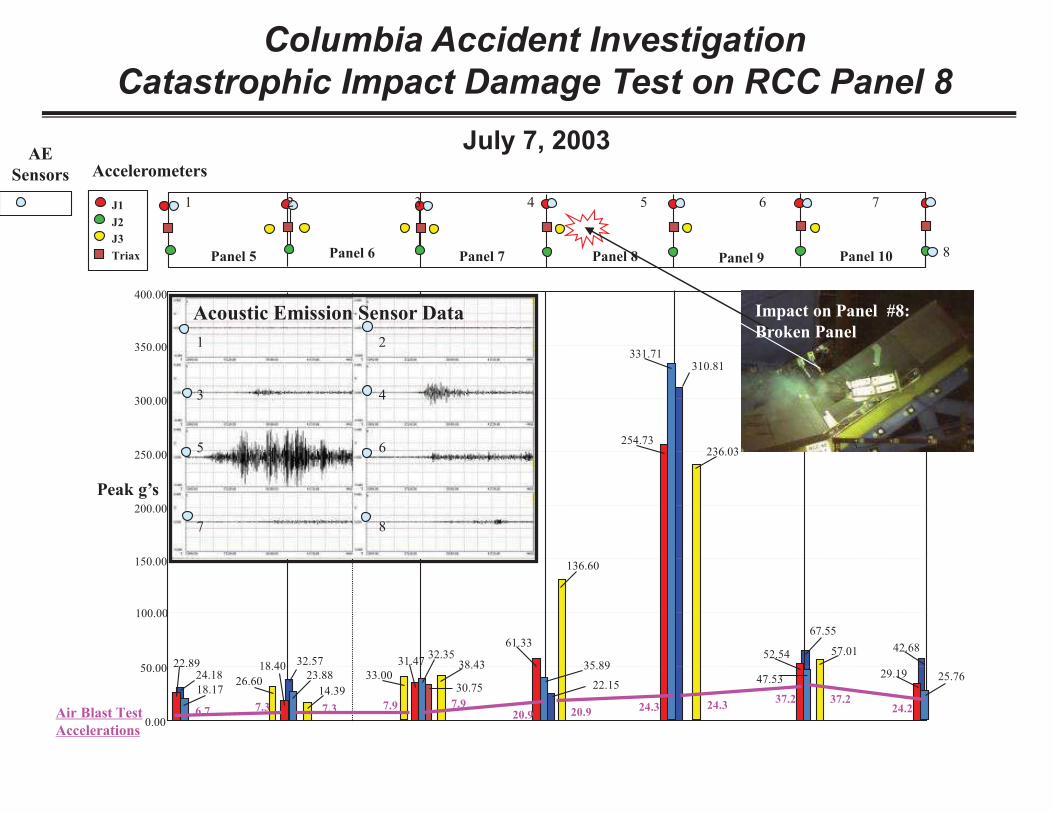
Columbia Accident Investigation Catastrophic Impact Damage Test on RCC Panel 8
Air Blast Test Accelerations
July 7, 2003
J3
J1
Triax
J2
Panel 5 Panel 6 Panel 7 Panel 8 Panel 9 Panel 10
400.00
350.00
0.00
50.00
100.00
150.00
200.00
250.00
300.00
Peak g’s
22.89
18.17 26.60 24.18
18.40 32.57 33.00
30.75 14.39
31.47 35.89 38.43
61.33
22.15
136.60
310.81
254.73
331.71
47.53
67.55
57.01
29.19
42.68
25.76
52.54 32.35
236.03
23.88
6.7 7.3 7.3 7.9 7.9 20.9 20.9 24.3 24.3 37.2 37.2
24.2
1 2
3 4
5 6
7 8
Acoustic Emission Sensor Data Impact on Panel #8: Broken Panel
8
Accelerometers AE
Sensors 1 2 3 4 5 6 7

Nat
iona
l Aer
onau
tics
and
Spa
ce A
dmin
istra
tion
WLEIDS Operations
• Installed on all Shuttles • Successfully flown on
all flights since Columbia • Detected small impacts
during ascent – Small amplitude,
nondamaging
– Likely popcorn foam
• Detected several small MMOD impacts
Sensors and Data Recorder in Wing
WLEIDS probable impact signal

Nat
iona
l Aer
onau
tics
and
Spa
ce A
dmin
istra
tion
9
Topics
• Structural Health Monitoring – Definition – SHM vs NDE
• Agency Overview of SHM Activities – Accel & Acoustic-based SHM on STS (Prosser, NESC) – Wireless-based SHM on ISS / STS (Studor, JSC) – Piezo-based SHM on ISS (Madaras, LaRC) – Fiber-optic-based SHM on Aerospace Vehicles (Richards, DFRC)
• Sensor Development • Strain-based Parameter Development
– Shape, Loads, Liquid Level, Magnetic Field • Sensor Attachment / Characterization • System Development • Ground / Flight Applications

Space Shuttle / ISS Evolution of Micro-WIS Systems
System MicroWIS (SBIR)
Extended Life MicroWIS
MicroSGU / MicroTAU
Wideband MicroTAU
Enhanced WB MicroTAU
Ultra-sonic WIS (new Ph2 SBIR)
Date Certified 1997 2001 2000/2001 2002
2005 2007
Purpose IVHM Thermal Models Cargo Loads Cert Life Extension
MPS Feedline Dynamics
Wing Leading Edge Impacts
ISS Impact/Leak Monitoring
Dimensions 1.7” dia. x 0.5” 2.7”x2.2”x1.2” 2.7”x 2.2” x 1.2” 3.0”x 2.5” x 1.5” 3.25”x2.75”x1.5 3.4” x2.5”x 1.1”
Sample Rate Up to 1Hz Up to 1Hz Up to 500Hz (3 channels)
Up to 20KHz (3 channels)
Up to 20KHz (3 channels)
Up to 100KHz (10 channels)
Data Storage None 2Mbytes 1Mbyte
256Mbytes 256Mbytes 1Gbyte
Battery Life 9 months 10+ years 2-3 missions 1 mission 1 mission 3 years
Sensor Types Temperature (Flight Cert) and Resistive sensors: Strain, Accelerometer, Pressure
Temperature (Flight Cert) and Resistive sensors: Strain, Accelerometer, Pressure
Acceleration & Strain (Flight Cert) or Resistive sensors. Includes Pressure as Trigger Channel.
Accelerometer & Temperature (Flight Cert) or Piezoelectric and Resistive Sensors
Accelerometer & Temperature (Flight Cert) or Piezoelectric and Resistive Sensors
Ultrasonic Microphone and Acoustic Emission
Columbia Shuttle fleet ISS assembly DIDS

Nat
iona
l Aer
onau
tics
and
Spa
ce A
dmin
istra
tion
Wireless Instrumentation Systems Unique Solutions To Real Shuttle Problems
• Temperature Monitoring - Validation of thermal models for design modifications and operations - Micro-WIS (first flown in non-RF configuration)
• Structural Loads and Dynamics - SSME support strain data needed for certification life predictions - Cargo to orbiter trunion dynamics and loads - Micro Strain Gauge Unit (Micro-SGU) and Micro Tri-Axial Accelerometer
Units (Micro-TAU) • SSME Feed-Line Crack Investigation
- Main propulsion system flow-liner dynamics - Wide-Band Micro-TAU
• Wing Leading Edge Impact Detection - Sense impact of ascent debris and MMOD on-orbit - Enhanced Wide-Band Micro-TAU (EWBMTAU)
• SRMS On-Orbit Loads - Increases needed to support contingency crew EVA repairs at end of
boom - Wireless Strain Gauge Instrumentation System (WSGIS) and EWBMTAU - Also used for monitoring Shuttle Forward Nose dynamics during roll-out

Nat
iona
l Aer
onau
tics
and
Spa
ce A
dmin
istra
tion
ISS Structural Dynamics Accelerometers
Current accelerometer count on ISS is 81 (SDMS: 33 EWIS: 30 IWIS: 18).
Internal Wireless Instr System Structural Dynamics Measurement System
External Wireless Instr System

Nat
iona
l Aer
onau
tics
and
Spa
ce A
dmin
istra
tion
13
Topics
• Structural Health Monitoring – Definition – SHM vs NDE
• Agency Overview of SHM Activities – Wireless-based SHM on ISS / STS (Studor, JSC) – Accel & Acoustic-based SHM on STS (Prosser, NESC) – Piezo-based SHM on ISS (Madaras, LaRC) – Fiber-optic-based SHM on Aerospace Vehicles (Richards, DFRC)
• Sensor Development • Strain-based Parameter Development
– Shape, Loads, Liquid Level, Magnetic Field • Sensor Attachment / Characterization • System Development • Ground / Flight Applications

Nat
iona
l Aer
onau
tics
and
Spa
ce A
dmin
istra
tion
Distributed Impact Detection System Concept
• Original DIDS concept is to detect and locate impacts via a wireless sensors system.
• Current DIDS system concept is to detect leak locations on
space vehicles.
MMOD strike example
Impact
Structural Waves
Piezoelectric Sensors
DIDS System Concept Module is asleep until event signal threshold is crossed. Sensor module can record four signals at 1MHz rate. Sensors can record and transmit ~6000 events. Batteries can last up to 5 years. Laptop computer can control multiple units.

09/12/07 15
Crew laptop on ISS Server
DIDS Wireless Sensor Units
DIDS Wireless Receiver tethered to crew laptop
Note: All Sensor hardware is Internal
DIDS Wireless Sensor Units

ISS Ultrasonic Background Noise Test (UBNT) System Overview
910Mhz
DIDS
Digital Wave - Piezoelectric AE Sensor: • Model B-225.5 • Frequency bandwidth: 50kHz - 400kHz • Temperature range: -50°C to +100°C • Dimensions: 0.625” diameter. x 0.8" H • Connector type: Microdot
Sensor Cable • Length: 2 Meters
Sensor Cable • Length: 2 Meters
DIDS Power Supply WLE L91 Battery Pack 2 – Energizer L91 AA batteries 3.0 VDC output (nominal)
Antenna/Data Cable • Length: 2 Meters • SMA connector• Teflon jacket • Kynar heat shrink
910Mhz SSC
DIDS Receiver connected to SSC
via USB
Power supply and DIDS sensor units attached to ISS Module pressure wall using velcro. AE sensors attached using pre-certified adhesives.
JSL File Server
OCA/Ground
Cer
tifie
d E
ther
net c
able
NOTE: Diagram illustrates system configuration by ISS Module. No more than 7 DIDS sensor units will used in any ISS Module.
Principal Investigator
(LaRC)
• In order to detect leaks, the amplitude of the ultrasonic background noise levels is required.
System is on orbit in the ISS awaiting astronaut time for installation

Example of installation behind ISS equipment ramp (Fit Check in B9 US Lab Mockup)
UBNT Extended Antenna in ISS hallway
DIDS unit installed in open rack in mockup

Nat
iona
l Aer
onau
tics
and
Spa
ce A
dmin
istra
tion
18
Topics
• Structural Health Monitoring – Definition – SHM vs NDE
• Agency Overview of SHM Activities – Accel & Acoustic-based SHM on STS (Prosser, NESC) – Wireless-based SHM on ISS / STS (Studor, JSC) – Piezo-based SHM on ISS (Madaras, LaRC) – Fiber-optic-based SHM on Aerospace Vehicles (Richards, DFRC)
• Uninhabited Aerial Vehicles • Composite Crew Module • Reentry Vehicles • Space Vehicles • Vehicle Pressure Systems • Expendable Launch Vehicles

Nat
iona
l Aer
onau
tics
and
Spa
ce A
dmin
istra
tion
Reentryry ReentrryVehicles
yeses hicle
Vehicle e Vehiclee Pressure
e rere Pressur
Systemsrre
msmsmsss
Compositete Crew
eositteww Creww
Module ee
CompoCompoCrewCrew
oww
Internationalal ternationSpace
aaioncece Spacce
Stationenn
Vehiclee
Launchhh LaunchVehicles
heses
Space Vehicleses
ModulModuulll
hi l
UAVsVs
Space Shuttlelle
NASA Structural
Health Monitoring Technology
SHM Aerospace Vehicle Applications
19
SSyyyyyyyyyyyyyyyyst
VeVe
Nat
iona
l Aer
onau
tics
and
Spa
ce A
dmin
istra
tion
20
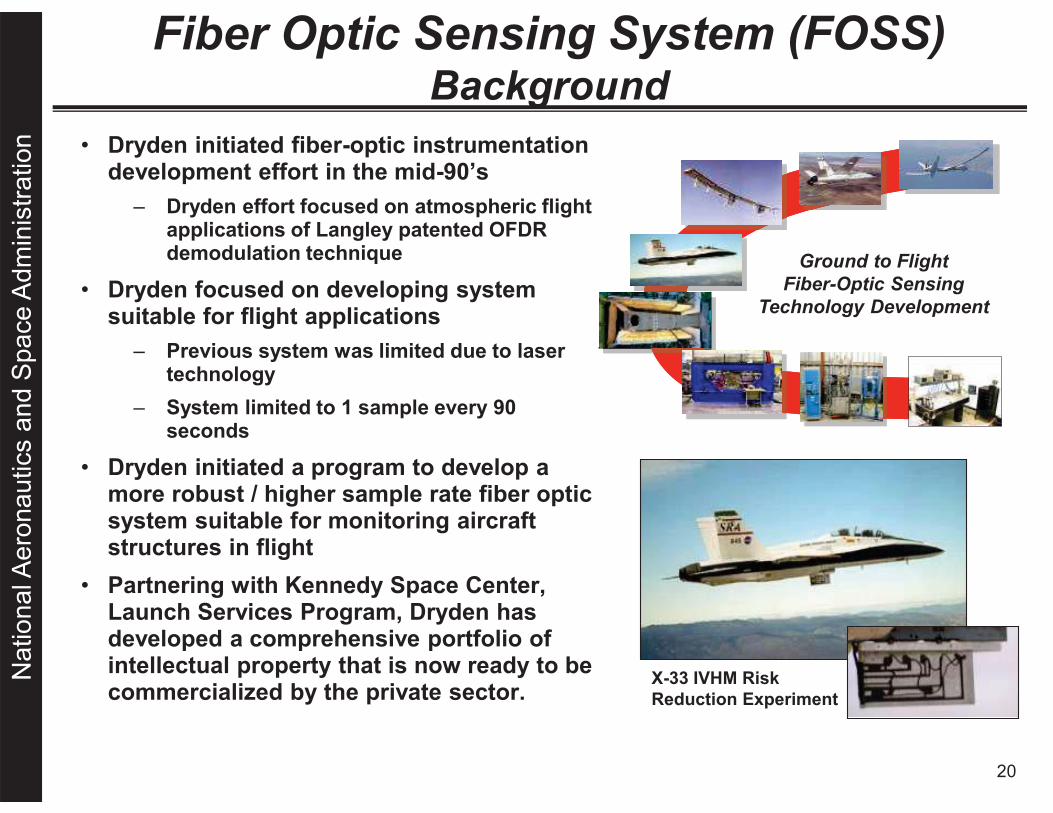
Fiber Optic Sensing System (FOSS) Background
• Dryden initiated fiber-optic instrumentation development effort in the mid-90’s
– Dryden effort focused on atmospheric flight applications of Langley patented OFDR demodulation technique
• Dryden focused on developing system suitable for flight applications
– Previous system was limited due to laser technology
– System limited to 1 sample every 90 seconds
• Dryden initiated a program to develop a more robust / higher sample rate fiber optic system suitable for monitoring aircraft structures in flight
• Partnering with Kennedy Space Center, Launch Services Program, Dryden has developed a comprehensive portfolio of intellectual property that is now ready to be commercialized by the private sector.
Ground to Flight Fiber-Optic Sensing
Technology Development
X-33 IVHM Risk Reduction Experiment
Nat
iona
l Aer
onau
tics
and
Spa
ce A
dmin
istra
tion
21
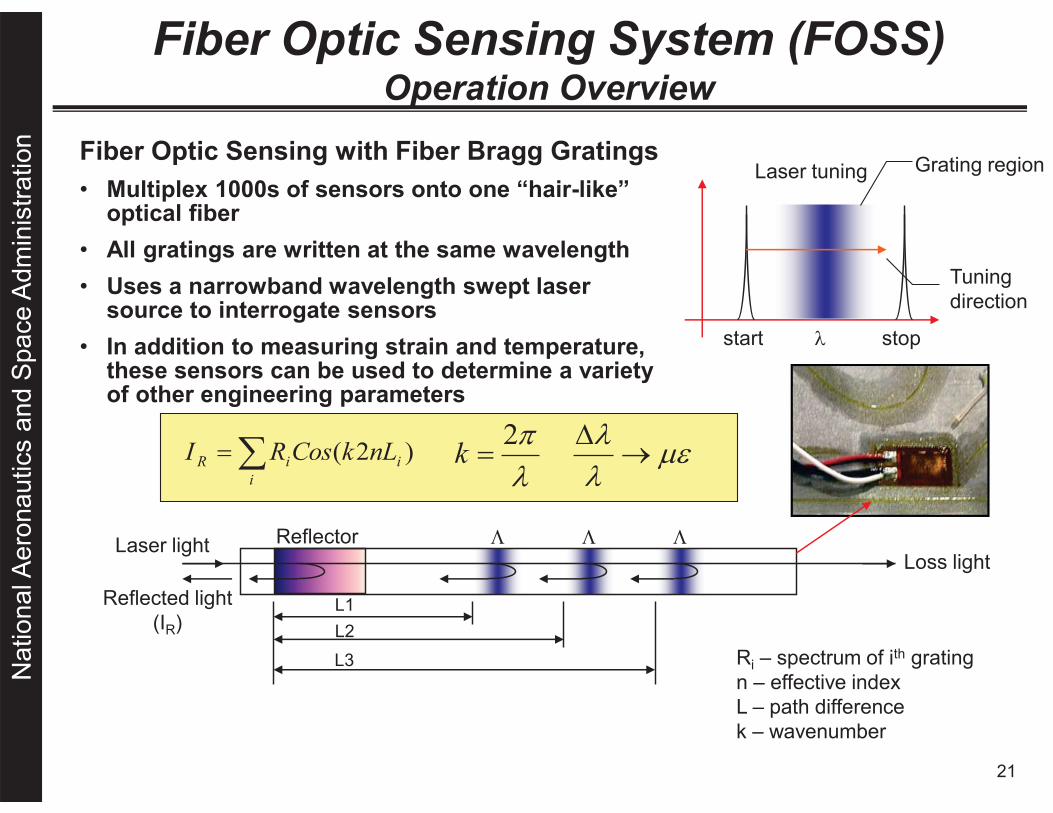
Fiber Optic Sensing System (FOSS) Operation Overview
Fiber Optic Sensing with Fiber Bragg Gratings • Multiplex 1000s of sensors onto one “hair-like”
optical fiber • All gratings are written at the same wavelength • Uses a narrowband wavelength swept laser
source to interrogate sensors • In addition to measuring strain and temperature,
these sensors can be used to determine a variety of other engineering parameters
Reflector �� �� ��
L1
L3 L2
Laser light Loss light
Reflected light (IR)
Laser tuning
start stop ��
��i
iiR nLkCosRI )2(
Ri – spectrum of ith grating n – effective index L – path difference k – wavenumber
��2
�k
Grating region
Tuning direction
���
�

Nat
iona
l Aer
onau
tics
and
Spa
ce A
dmin
istra
tion
22
Dryden’s FOSS Current Capabilities
Flight System
22Predator -B in Flight
Flight System
Current system specifications • Fiber count 8 • Max sensing length / fiber 40 ft • Max sensors / fiber 2000 • Total sensors / system 16000 • Max sample rate (flight) 100 sps • Max sample rate (ground) 60 sps • Power (flight) 28VDC @ 4.5 Amps • Power (ground) 110 VAC • User Interface Ethernet • Weight (flight, non-optimized) 27 lbs • Weight (ground, non-optimized) 20 lbs • Size (flight, non-optimized) 7.5 x 13 x 13 in • Size (ground, non-optimized) 7 x 12 x 11 in
Environmental qualification specifications for flight system
• Shock 8g • Vibration 1.1 g-peak sinusoidal curve • Altitude 60kft at -56C for 60 min • Temperature -56 < T < 40C
Ground System

Nat
iona
l Aer
onau
tics
and
Spa
ce A
dmin
istra
tion
Fiber Bragg Grating – Optical Frequency Domain Reflectometry
FBG-OFDR can dramatically improve structural and system efficiency for space vehicle applications by improving both
affordability and capability by … • Providing >100x the number measurements at
1/100 the total sensor weight
• Providing validated structural design data that enables future launch systems to be lighter and more structurally efficient
• Reducing data system integration time and cost by utilizing a single small system for space / launch vehicles
• Increasing capability of measuring multiple parameters in real time (strain, temperature, liquid level, shape, applied loads, stress, mode shapes, natural frequencies, buckling modes, etc.
• Providing an unprecedented understanding about system/structural performance throughout space craft and mission life cycle
y by …
Centaur Coupon shown at PPBE review on shown at PPBE rev
ISS COPV strain & temp monitoring
Liquid level sensing
d level gsing
ISS COPV strain & i &monitoring
Shape sensing for vehicle control
Centaur Coupoon show
Liquisens
Pressure monitoring

Nat
iona
l Aer
onau
tics
and
Spa
ce A
dmin
istra
tion
24
Composite Crew Module NASA NESC - Strain Sensing
• Four fibers were installed around the module’s three windows and one hatch
• 3300 real-time strain measurements were collected at 30Hz as the module underwent 200%DLL pressurization testing
• Measured strains were compared and matched well to predicted model results
• Project concluded: • “Fiber optics real-time
monitoring of test results against analytical predictions was essential in the success of the full-scale test program.”
• “In areas of high strain gradients these techniques were invaluable.”
Inner Hatch FBG Strains, Max Pressure
Mic
rost
rain
(�in
/in)
Predicted
-2000
FBG
0
2000
4000

Nat
iona
l Aer
onau
tics
and
Spa
ce A
dmin
istra
tion
25
Uninhabited Aerial Vehicles Global Observer UAS - Aerovironment
• Validate strain predictions along the wingspan • Measured strain distribution along the centerline top and
bottom as well as along the trailing edge top and bottom.
• FO Strain distribution measurements are being used to interpret shape using Dryden’s 2D shape algorithm
• A 24-fiber system was designed of which 18, 40ft fibers (~17,200 gratings) were used to instrument both left and right wings

Dryden Flight Research Center
Uninhabited Aerial Vehicles Global Observer UAS - Aerovironment
• Proof-load testing of components and large-scale structures
Wing Span: 175 ft Global Observer Wing Loads Test
26
Whiffletree Loading System

Nat
iona
l Aer
onau
tics
and
Spa
ce A
dmin
istra
tion
Uninhabited Aerial Vehicles Global Observer (AV) - 2D Shape Sensing Results
0 0.1 0.2 0.3 0.4 0.5 0.6 0.7 0.8 0.9 1-0.2
0
0.2
0.4
0.6
0.8
1
1.2Predicted vertical wing displacement (Fiber 3) vs. Actual displacement
Wing Span (normalized)
Dis
plac
emen
t (no
rmal
ized
)
Predicted vertical wing displacementActual: Photogrammetry in GRFActual: Photogrammetry in RRF
100% DLL
0% DLL
50% DLL
80% DLL
30% DLL
0 0 1 0 2 0 3 0 4 0 5 0 6 0 7 0 8 0 92
Over the entire wing span, the predicted displacements of fiber 3 closely match the actual for every load condition.
1 2
3 4 FWD AFT
27

Nat
iona
l Aer
onau
tics
and
Spa
ce A
dmin
istra
tion
28
UAVs - Global Observer UAS (AV) Flight Testing of Strain and 2D Shape Sensing
• Validate strain predictions along
the left wing in flight using 8, 40ft fibers (~8000 strain sensors)
• An aft fuselage surface fiber was installed to monitor fuselage and tail movement
• Strain distribution were measured along the left wing centerline top and bottom as well as along the trailing edge top and bottom.
• 8 of the 9 total fibers are attached to the system at any give time
• The system performed well and
rendered good results 28

Nat
iona
l Aer
onau
tics
and
Spa
ce A
dmin
istra
tion
29
Ikhana in Flight
• 18 flights tests conducted; 36 flight-hours logged • Conducted first flight validation testing April 28, 2008 • Believed to be the first flight validation test of FBG strain and wing
shape sensing • Multiple flight maneuvers performed • Total of 6 fibers (~3000 strain sensors) installed on left and right wings • Fiber optic and conventional strain gages show excellent agreement • FBG system performed well throughout entire flight program
Predator-B UAS - Flight Testing Strain and 2D Shape Sensing
Video clip of flight data superimposed on Ikhana photograph
IIIIkkkkhhhhaaaannnnaaaa iiiinnnn FFFFFFlllllliiiiigggggggggggggghhhht
y p g g p g
Video clip of flight data superimposed on Ikhana photograph
Nat
iona
l Aer
onau
tics
and
Spa
ce A
dmin
istra
tion
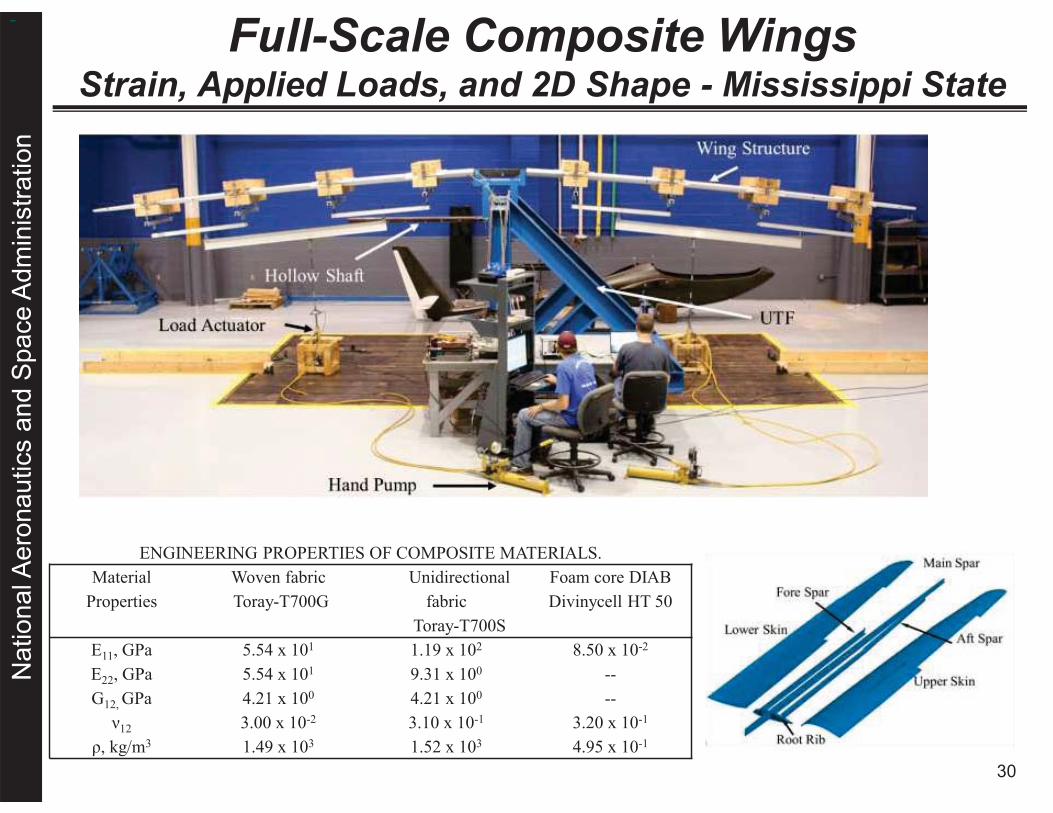
ENGINEERING PROPERTIES OF COMPOSITE MATERIALS. Material
Properties Woven fabric Toray-T700G
Unidirectional fabric
Toray-T700S
Foam core DIAB Divinycell HT 50
E11, GPa 5.54 x 101 1.19 x 10² 8.50 x 10⁻² E22, GPa 5.54 x 101 9.31 x 100 -- G12, GPa 4.21 x 100 4.21 x 100 --
ν12 3.00 x 10⁻² 3.10 x 10⁻¹ 3.20 x 10⁻¹ ρ, kg/m3 1.49 x 10³ 1.52 x 10³ 4.95 x 10⁻¹
Full-Scale Composite WingsStrain, Applied Loads, and 2D Shape - Mississippi State
30

Nat
iona
l Aer
onau
tics
and
Spa
ce A
dmin
istra
tion
F, N Measured δL, m Calculated δL, m Error, % 1373 -0.184 -0.178 3.02
1592 -0.209 -0.205 2.29 1837 -0.241 -0.231 4.08 2036 -0.265 -0.257 3.23 2269 -0.295 -0.284 3.75
MEASURED AND CALCULATED WING TIP DEFLECTIONS
Applied Load, N Calculated Load, N Error, % Difference, N -185.5 -178.8 3.60 6.7 -194.4 -210.0 7.98 15.5 -241.5 -252.0 4.35 10.5 -288.5 -291.5 1.05 3.0 -333.3 -332.9 0.12 0.4 -378.1 -381.1 0.80 3.0 -422.9 -435.9 3.07 13.0 -472.2 -486.4 3.01 14.2
Average EI=98728.2-N*m2
OUT-OF-PLANE APPLIED LOAD
Test Procedure for displacement • Collect FBG strain data • Use displacement Eq. and Strain
data to calculate deflection Test procedure for out-of-plane loads • Determine EI for the wing • Determine moment acting on wing • Determine Load applied
Full-Scale Composite Wings Strain, Applied Loads, and 2D Shape - Mississippi State
31

Nat
iona
l Aer
onau
tics
and
Spa
ce A
dmin
istra
tion
Next Generation Structural Health Monitoring on Reentry Vehicles
Personal Observations • The Shuttle never returned in the
same condition as when it launched • Flight operations always reveals the
unexpected and make known the unknowns
• NASAs SHM fiber optic sensors are much lighter than conventional strain gage sensors
• FOSS-OFDR provides massive amounts of quantitative structural performance information in real time and for post test analysis
• This quantitative information can overcome some of the unknown unknowns that may allow you to fly another day
Dream Chaser Re-entry (artist conception)
STS Landing at Edwards AFB
Post-flight Inspection

Nat
iona
l Aer
onau
tics
and
Spa
ce A
dmin
istra
tion
Monitoring of MMOD Impact Damage to TPS NASA Dryden / CSIRO Australia collaboration
33
Objective • Detect & evaluate Micrometeoroid and
Orbital Debris (MMOD) impact damage to Thermal Protection Systems (TPS) using embedded acoustic and thermal sensor networks
Principles • Detect and locate impacts using acoustic
emission sensor networks • Evaluate severity of damage with optical
fiber thermal sensor network • Utilize centralised or self-organising
operation with local network architecture on modular tiled structure
Novel aspects • Development of switched optical fiber
sensor network to enhance robustness • Capable of central control or autonomous
self-organising operation. • Functional damage evaluation – monitor
effect on thermal properties. 33
Vehicle Re-entry (artist conception)
TPS health monitoring system Heat shield with TPS
Heat shield Test Setup at Dryden Two TPS modules
Nat
iona
l Aer
onau
tics
and
Spa
ce A
dmin
istra
tion
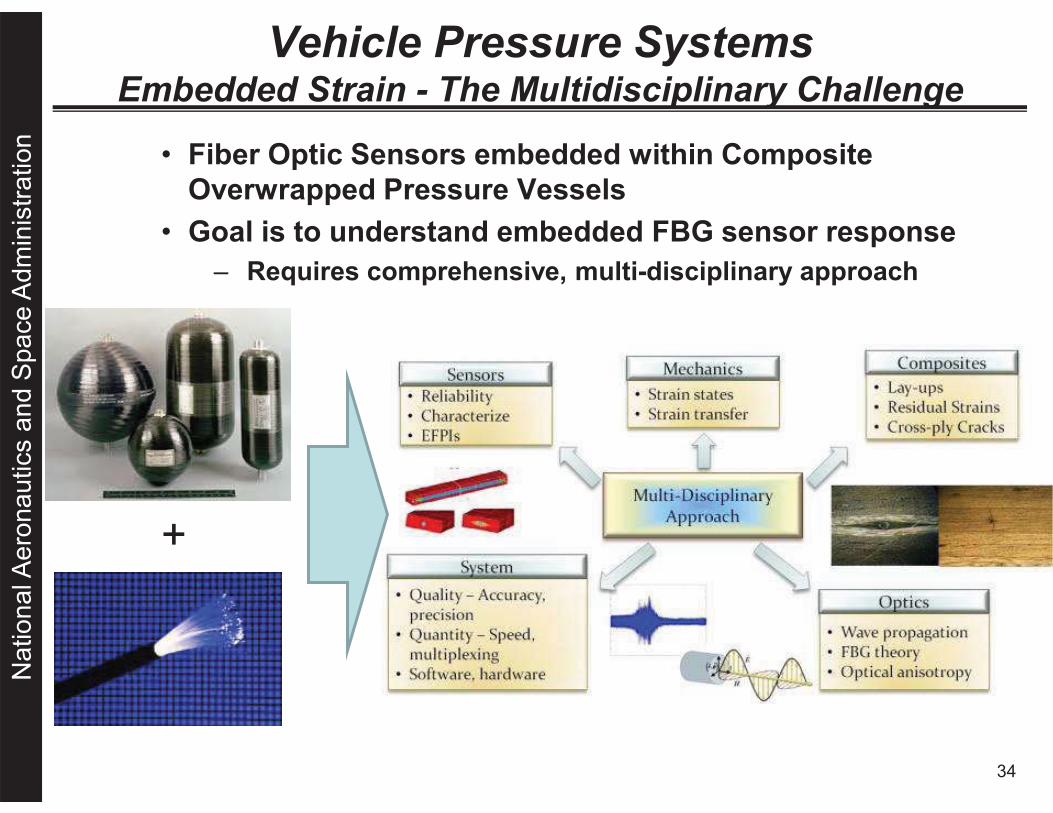
Vehicle Pressure Systems Embedded Strain - The Multidisciplinary Challenge
• Fiber Optic Sensors embedded within Composite Overwrapped Pressure Vessels
• Goal is to understand embedded FBG sensor response – Requires comprehensive, multi-disciplinary approach
+
34

Nat
iona
l Aer
onau
tics
and
Spa
ce A
dmin
istra
tion
Vehicle Pressure Systems Composite Overwrapped Pressure Vessels (COPVs)
Objectives • Perform real-time in-situ structural monitoring of COPVs with
embedded fiber Bragg grating sensor arrays • Develop analytical and experimental methods to reliably
interpret embedded strain sensor measurements • Develop a robust “early-warning” indicator of COPV
catastrophic failure • Provide finite-element-like experimental strains in real time for:
− Health Monitoring on International Space Station− Model validation to improve future designs
Approach • Develop and evaluate surface-attachment techniques • Install surface fiber optic sensors • Conduct test to 80% of burst pressure • Overwrap surface FBGs with composite layers • Install new surface FBGs over “embedded” FBGs • Conduct burst test • Develop data analysis and visualization techniques to reliably predict COPV failure
or:
h
NASA Dryden and WSTF test team 35
Nat
iona
l Aer
onau
tics
and
Spa
ce A
dmin
istra
tion
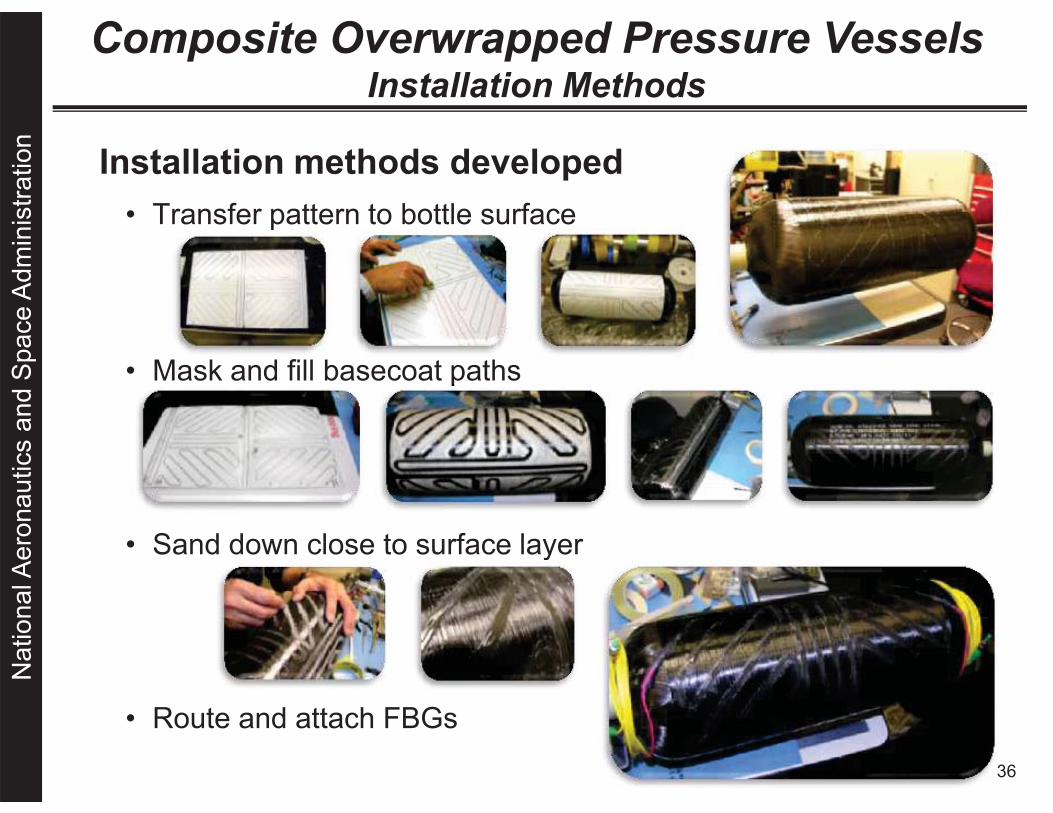
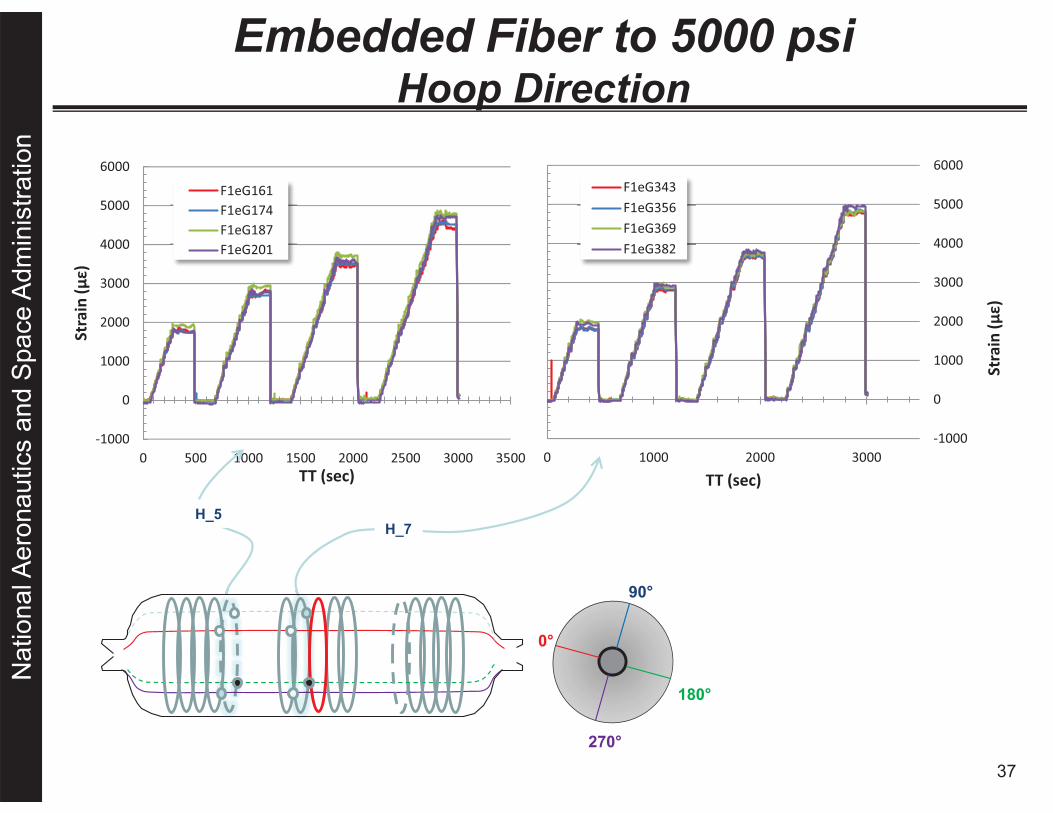
Composite Overwrapped Pressure Vessels Installation Methods
Installation methods developed • Transfer pattern to bottle surface
• Mask and fill basecoat paths
• Sand down close to surface layer
• Route and attach FBGs
p
y
36
Nat
iona
l Aer
onau
tics
and
Spa
ce A
dmin
istra
tion
37
Embedded Fiber to 5000 psi Hoop Direction
-1000
0
1000
2000
3000
4000
5000
6000
0 500 1000 1500 2000 2500 3000 3500
Stra
in (μ
ε)
TT (sec)
F1eG161F1eG174F1eG187F1eG201
-1000
0
1000
2000
3000
4000
5000
6000
0 1000 2000 3000
Stra
in (μ
ε)
TT (sec)
F1eG343F1eG356F1eG369F1eG382
0°
90°
180°
270°
H_5 H_7

Nat
iona
l Aer
onau
tics
and
Spa
ce A
dmin
istra
tion
FOSS Current and Future Work Flight Demonstration on a Launch Vehicle (KSC-Launch Services)
38
TPS S Healthth TPSS ealtHMonitoring
tthngngg
Embedded dmbeddedStrain
ddeddnn
Strainn
3D D Shapepe
Temperature and emperature anCryogenic
ancc Cryogenicc
Liquid Levelc elel
Applied Loadsds
Magnetic Fieldd 2D Shapepe
dd dd
Na Ap

Nat
iona
l Aer
onau
tics
and
Spa
ce A
dmin
istra
tion
Cryogenic Liquid Level-Sensing The Challenge
• The transitional phase between liquid and gas of cryogenics is difficult to discriminate while making liquid level measurements
• Using discrete cryogenic temperature diodes spaced along a rake yields course spatial resolution of liquid level along with high wire count
FOSS Approach • While using a uniquely developed
fiber optic structure (CryoFOSS), the transitional phase can be mapped more accurately
• Using a single continuous grating fiber, a high degree of spatial resolution can be achieved, as low as 1/16”
Cryo
geni
c Ra
ke w
/ sili
con
diod
es &
FO
SS fi
ber
Cryo
geni
ccRa
kew
/sen
ic
Liquid level
Silicon Diode
Cryogenic Container
/yy
gg
FOSS Fiber
CryogenicContainer located at MSFC (below deck)
CryogenicContainer located at MSFC (above deck)
1st Gen CryoFOSS
Test Results
39

Nat
iona
l Aer
onau
tics
and
Spa
ce A
dmin
istra
tion
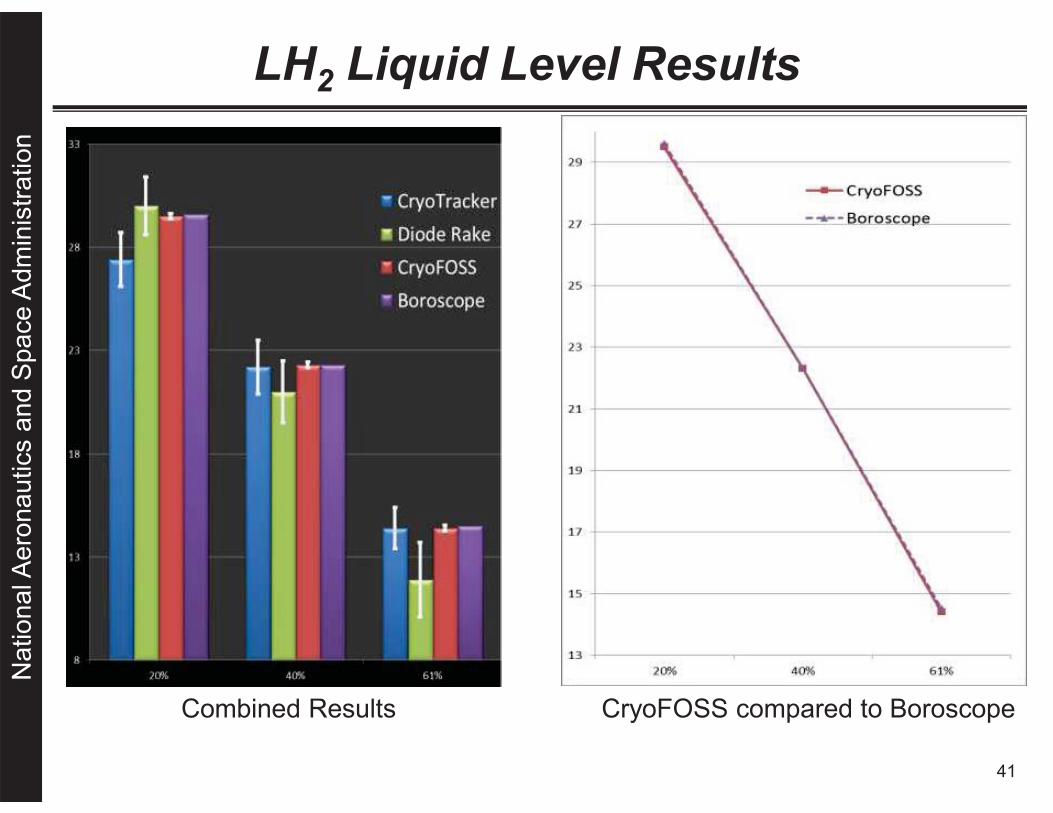
LH2 Testing of CryoFOSS at MSFC Objective
• Experimentally validate CryoFOSS using Dryden’s FOSS technology
Test Details • Dewar dimensions: 13-in ID x 37.25-in • Fill levels of 20%, 43%, and 60% were performed • Instrumentation systems
− Video boroscope with a ruler (validating standard) − Cyrotracker (ribbon of 1-in spaced silicon diodes) − MSFC Silicon diode rake − Fiber optic LH2 liquid level sensor(CryoFOSS)
Results • CryoFOSS sensor discerned LH2 level to ¼” in
every case • Excellent agreement achieved between
CryoFOSS, boroscope, and silicon diode Cryotracker
Bottom line • Validated concept for a lightweight, accurate,
spatially precise, and practical solution to a very challenging problem for ground and in-flight cryogenic fluid management systems 40 40
Cryo-FOSS
n’s
d)s)
Nat
iona
l Aer
onau
tics
and
Spa
ce A
dmin
istra
tion
LH2 Liquid Level Results
CryoFOSS compared to Boroscope Combined Results
41
Nat
iona
l Aer
onau
tics
and
Spa
ce A
dmin
istra
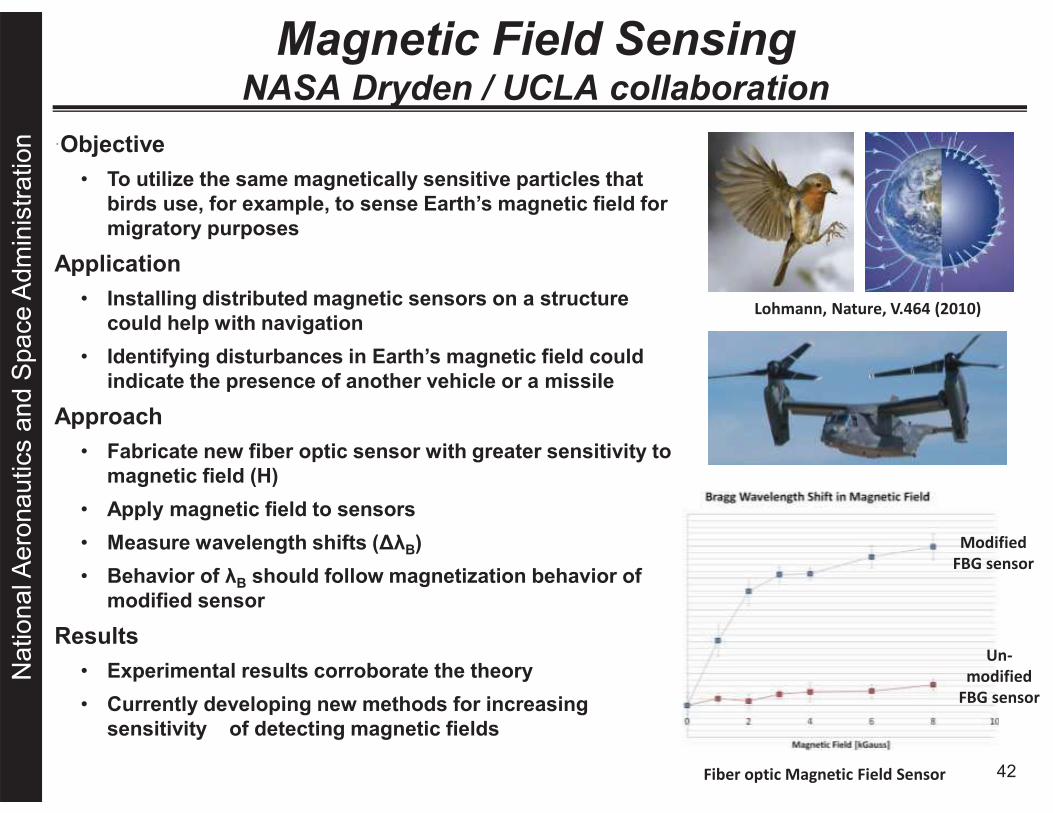
tion �Objective
• To utilize the same magnetically sensitive particles that birds use, for example, to sense Earth’s magnetic field for migratory purposes
Application • Installing distributed magnetic sensors on a structure
could help with navigation • Identifying disturbances in Earth’s magnetic field could
indicate the presence of another vehicle or a missile
Approach • Fabricate new fiber optic sensor with greater sensitivity to
magnetic field (H) • Apply magnetic field to sensors • Measure wavelength shifts (ΔλB) • Behavior of λB should follow magnetization behavior of
modified sensor
Results • Experimental results corroborate the theory • Currently developing new methods for increasing
sensitivity of detecting magnetic fields
Lohmann, Nature, V.464 (2010)
Magnetic Field Sensing NASA Dryden / UCLA collaboration
Fiber optic Magnetic Field Sensor
Modified FBG sensor
Un-modified
FBG sensor
42


![Computational Engine Structural Analysis - NASA · Computational Engine Structural Analysis (NASA-T_] ... engine structural component modeling, (3) ... resistant fan blades using](https://img.dokumen.tips/doc/110x75/5ae5b62f7f8b9a29048c9bb9/computational-engine-structural-analysis-nasa-engine-structural-analysis-nasa-t.jpg)