Embed Size (px)
Citation preview

Jairus Hihn & Michael SaingSystems Analysis, Modeling & ArchitectureJet Propulsion Laboratory, California Institute of Technology
NASA Analogy Software Costing Tool:A Web-based Tool
orGoodbye Excel
© 2016. All rights reserved.
October 18-20, 2016
31tst International Forum on COCOMO and System/Software Cost Modeling

NC State University
Introduction
Development Team
Jairus Hihn, Michael Saing, Elinor HuntingtonJet Propulsion Laboratory, California Institute of Technology
ª Requirements, Tool Development, Data Specification and Collection, Domain Expertise
Tim Menzies and George MathewNorth Carolina State University
ª Methodology
James JohnsonNational Aeronautics and Space Administration
ª Requirements, Review, Oversight, Domain Expertise
2

NC State University
Introduction & Background - 1
ª ASCoTanAnalogyCostModelusingdataminingalgorithmsª Methodologyhandles
ª smallsamplesizesaswellasnoisyandsparsedataª ThepurposeofASCoT isto
ª SupplementcurrentestimationcapabilitiesªBeeffectiveintheveryearlylifecyclewhenourknowledgeisfuzzy
ªuseshighlevelsystemsinformation(SymbolicData)ªBeusablebyCostEstimators,SoftwareEngineersandSystemsEngineers
ª Corealgorithmisspectralclusteringtodefineclusterswithanearestneighborsearchwithinacluster
ª Previoustalksandpapersdescribedtheresearchapproachandactivitiesª ICEAA2014,2015ªNASACostSymposium2014,2015ª IEEEAerospace2016
3

NC State University
What’s New - Goodbye Excel!!
ASCoT Prototypeª Excel front end with
algorithms in Pythonª Only ran on PCª Data in excel workbookª Tool juggled multiple
workbooksª Required loading
miniconda and had configuration issues
ª Tool difficult to modify
4
ASCoT Betaª Web-based tool runs on
both Mac and PCª Data in a real databaseª Tool is easily extendableª On-Line Help and data
value popupsª Greatly expanded data
visualizationª More data

NC State University
Data Sources
ªWhere the data came fromªCADReªNASA 93 - Historical NASA data originally
collected for ISS (1985-1990) and extended for NASA IV&V (2004-2007)
ªContributed Center level dataªNASA software inventory ªProject websites and other sources for
system level information if not available in CADRe
5

NC State University
Data Items Overview
6
DataItem #ofRecordsTotaldevelopmenteffortinworkmonths 36
LogicalLinesofcode(LOC)
DelieveredLOC 49
EquivalentLOC 43
SystemsParameters
MissionType(DeepSpace,Earth/Lunar,Rover-Lander,
Observatory) 49
MulMpleelement(probe,etc…) 49
NumberofInstruments 49
NumberofDeployables 49
FlightComputerRedundancy(DualWarm,DualCold,
SingleString) 49
SoSwareReuse(Low,Medium,High) 41
SoSwareSize(Small,Medium,Large,VeryLarge) 49

NC State University
Data Items: Missions with some Data
7
Earth/LunarOrbiter(23) Observatory(6) DeepSpace(15) Insitu(5)
LRO HST GLL MPFOCO GRO DS1 MERSDO Kepler Stardust MSLGrail WISE MarsOdyssey PhoenixSMAP Stereo Genesis Insight
GPMCore Contour Deep_ImpactOCO3 MRONuStar JUNOGEMS MavenGLORY NewHorizonsGOESR MessengerNEAR Cassini
GEOTAIL OSIRISREXEO1 DawnAqua VanAllenProbe(RBSP)GLAST
NOAA-N-PrimeNPPLDCMRHESSILCROSSTIMEDIRIS

NC State University
8
Effort, Lines of Code and Productivity by Mission Type
Number of Deployables and Instruments by Mission Type
Data Summary – Key Metrics
MissionType Instrument DeployablesMedian Range Median Range
Earth/LunarOrbiter 3 1-7 2 0-7Observatory 4 1-6 2 0-6DeepSpace 5 2-12 2 0-8Insitu 5 3-10 6 2-10
MissionType#of
Records
Effort(Months)LogicalDelievered
LOC
Median S.D. Median S.D.
Earth/LunarOrbiter 23 544 380 95,000 43,691 Observatory 6 492 631 87,300 36,384 DeepSpace 15 643 343 121,500 61,444 Insitu 5 1,080 555 204,762 145,335
ProducBvity
(LogicalDel/month)
Median S.D.
203 216 126 174
183 147 249 81

NC State University
System Descriptor Details (Example)
9
Values Description Example
Earth/LunarOrbiter
Roboticspacecraftthatorbittheearthormoonconductingsciencemeasurements.Thesespacecraftareverysimilarifnotidenticaltothemanycommercialsatellitesusedforcommunicationaswellasmanymilitarysatellites.Theyoftencanhavehighheritageandevenuseproductionlinebusesfromindustry.
Aqua
Observatory
Observatoriesarespacebasedtelescopesthatsupportspacebasedastronomyacrossawidesetoffrequencies.TheycanbeearthorbitersorearthtrailingatthevariousLaGrangepointscreatedbythegravityfieldsoftheearth,sunandmoon.
Hubble
DeepSpace
Anyroboticspacecraftthatgoesbeyondthemoonsorbit.Sothiscategoryincludesanymissionwhosedestinationisaplanet,planetoids,anyplanetarysatellite,comet,asteroidorthesun.Thesemissioncanbeorbitersorflybysoramixtureofboth.
DeepImpact
StaticLanderAroboticspacecraftthatdoesitssciencein-situorfromthesurfaceofasolarsystembody.Itdoesnotmovefromitsoriginallocation.
Phoenix
RoverAroboticspacecraftthatdoesitssciencein-situorfromthesurfaceofasolarsystembodyandhastheabilitytomoveonthesurface.Todateallrovershavewheelsbutinthefuturetheymaycrawl,walkorhop.
MarsExplorationRover(MER)
MissionType
All captured in on-line help as well as a user guide

NC State University
10
Reminder - What We Learned from Methodology
ª There are a variety of models whose performance are hard to distinguish (given currently available data) but some models are better than others
ª If one has sufficient data to run COCOMO or a comparable parametric model then the best model is the parametric model
ª When insufficient information exists then a model using only system parameters can be used to estimate software costs with relatively small reduction in accuracy. The main weakness is the possibility of occasional very large estimation errors which the parametric model does not exhibit.
ª A major strength of the nearest neighbor and spectral clustering methods is the ability to work with a combination of symbolic and numerical data
ª While a nearest neighbor model performs as well or better as spectral clustering based on MMRE, spectral clustering handles outliers better and provides a structured model with more capability

NC State University
11
Effort Variation by Cluster
694

NC State University
12
Mission Membership by Cluster
NC State University
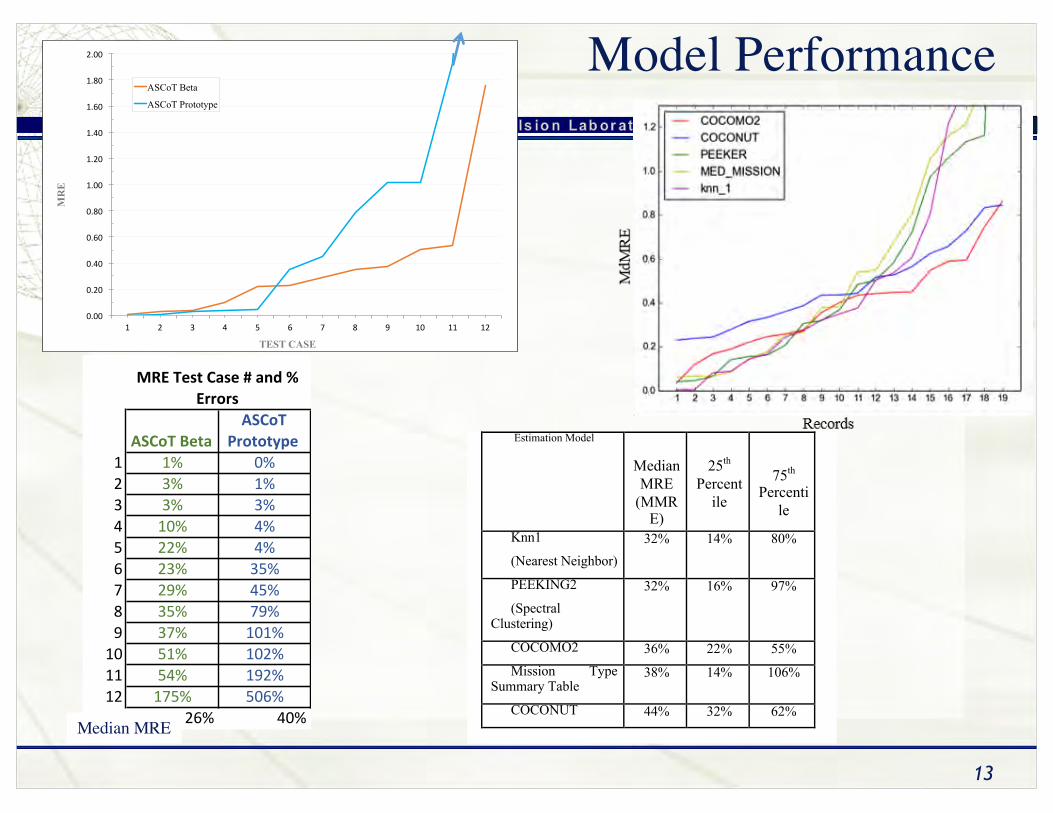
13
Model Performance
Estimation Model
Median MRE
(MMRE)
25th Percent
ile
75th Percenti
le
Knn1
(Nearest Neighbor)
32% 14% 80%
PEEKING2
(Spectral Clustering)
32% 16% 97%
COCOMO2 36% 22% 55% Mission Type
Summary Table 38% 14% 106%
COCONUT 44% 32% 62%
ASCoTBetaASCoT
Prototype1 1% 0%2 3% 1%3 3% 3%4 10% 4%5 22% 4%6 23% 35%7 29% 45%8 35% 79%9 37% 101%10 51% 102%11 54% 192%12 175% 506%
26% 40%
MRETestCase#and%Errors
0.00
0.20
0.40
0.60
0.80
1.00
1.20
1.40
1.60
1.80
2.00
1 2 3 4 5 6 7 8 9 10 11 12
MR
E
TEST CASE
ASCoT Beta
ASCoT Prototype
Median MRE

ToolPhase 2
ToolPhase 2
ToolPhase 1 Complete
Mission Descriptors
SLOC Range Estimate
COCOMO Multiplier
Range
COCOMO Monte Carlo
Estimate
Spectral Clustering
EffortEstimate
ASCoT Model Architecture
Cluster
Clu
ster
Ran
ges
Recommended Budget (70th Percentile) = 489.1 WM
Recommended Minimum (50th Percentile) = 402.7 WM
0%
10%
20%
30%
40%
50%
60%
70%
80%
90%
100%
0 50 100 150 200 250 300 350 400 450
Like
lihoo
d of
Occ
urre
nce
Effort (Work Months)
Total Effort CDF (Requirements through SW I&T)
COCOMO (214 WM - 266 WM)
Recommended Budget (70th Percentile) = 489.1 WM
Recommended Minimum (50th Percentile) = 402.7 WM
0%
10%
20%
30%
40%
50%
60%
70%
80%
90%
100%
0 50 100 150 200 250 300 350 400 450
Like
lihoo
d of
Occ
urre
nce
Effort (Work Months)
Total Effort CDF (Requirements through SW I&T)
COCOMO (214 WM - 266 WM)
ToolPhase 1
Complete
14
Size Estimate Histogram
0%
2%
4%
6%
8%
10%
12%
14%
20.9
22.7
24.6
26.5
28.4
30.2
32.1
34.0
35.9
37.7
39.6
ToolPhase 2
0"
200"
400"
600"
800"
1000"
1200"
0" 1" 2" 3" 4"
Cluster"Effort"Values" Training"Data"
es:mate"

NC State University
15
ASCoT Components
ª Web-based tool run from a serverª Has access control
ª Written Pythonª Uses a number of Python Packages
ª MySQL databaseª Django Web and Restª Javascript. ª The tool was deployed on the nextgen servers, which run
CentosOS. ª The graphing library used is plotly.js, which is open source
and fully local.

NC State University
16
ASCoT -1
Inputs
Estimate
On-Line help windows

NC State University
17
ASCoT – 2- Cluster Parameter Variation
Not in family
In family

NC State University
18
ASCOT -3 – Cluster Effort Variation
Where estimate falls
Data value popups

NC State University
19
ASCOT – 4 – 3D
SW Dev Cost = 3227 + 0.04273*Total_SC_Cost + 0.05347*(Num_of_Instr)

NC State University
20
Next Steps
ª Plan is to deliver ASCoT Rev 1 in December • Add Simple regression, COCOMO II, Nearest Neighbor• Improved clustering algorithm• Add LOC estimates and statistics• Add MRE performance statistics • Add data export feature
ª COMPACT, the NASA CubeSat cost model, will be delivered in the same web-based environment
ª Paper forthcoming for 2017 IEEE Aerospace


