Embed Size (px)
Citation preview

Community Health
Planning and Costing Tool Tool User Guide
Version 1.1
Management Sciences for Health

2
The Community Health Planning and Costing Tool is a UNICEF tool developed by Management Sciences for Health (MSH), under contract 43188968 funded by UNICEF, New York.
All trademarks and service marks, including Microsoft, MS, the XL design (the Microsoft Excel logo), and the logos of Microsoft Corporation, are the
exclusive property of Microsoft Corporation. Use of the Community Health Planning and Costing Tool requires a license of appropriate spreadsheet software, such as Microsoft Excel available by license from Microsoft Corporation. The Community Health Planning and Costing Tool is not a product of, or endorsed
by, Microsoft Corporation.
The findings, interpretations and conclusions resulting from the use of the Tool are those of the authors and do not necessarily reflect the policies or views of UNICEF or of the United Nations.
The designations in this tool do not imply an opinion on legal status of any country or territory, or of its authorities, or the delimitation of frontiers.
Disclaimer: This is an open source tool with all formulas accessible to the user. Structure and formulas within the tool have been developed and reviewed by
experts; any changes may result in errors or inconsistencies.
Comments and questions on the Community Health Planning and Costing Tool should be directed to [email protected] or [email protected] (or Jerome Pfaffmann [email protected] at UNICEF).

3
Table of Contents Acknowledgements .......................................................................................................................................................................... 5 Acronym List ..................................................................................................................................................................................... 6 Background: Importance of Costing Community Health Services ....................................................................................... 8 Section 1. Introduction .................................................................................................................................................................... 9 Section II: Tool User Guide ......................................................................................................................................................... 11
1. Title Page ......................................................................................................................................................................... 11 2. Tool Navigation .............................................................................................................................................................. 13 3. Background Worksheets ............................................................................................................................................. 16
Title Page .............................................................................................................................................................. 16 Main Menu .......................................................................................................................................................... 16 Data Entry Guide................................................................................................................................................. 16 Bottleneck Analysis .............................................................................................................................................. 16
4. Data Entry Worksheets ............................................................................................................................................... 16 General information ............................................................................................................................................ 16 Program Data ...................................................................................................................................................... 17 Program Scale-Up ................................................................................................................................................ 24 CHW Categories ................................................................................................................................................. 26 Supervisor Categories .......................................................................................................................................... 31 Package ................................................................................................................................................................ 33 Coverage ............................................................................................................................................................... 35 Supervision ........................................................................................................................................................... 38 Management........................................................................................................................................................ 40 Training ................................................................................................................................................................. 42 Equipment ............................................................................................................................................................ 44 Medicines, Supplies and Commodities .............................................................................................................. 46 Other Recurrent Costs ........................................................................................................................................ 48 Capital Costs ........................................................................................................................................................ 49 Financing ............................................................................................................................................................... 50 Standard Treatment Guidelines ......................................................................................................................... 53
5. Results Worksheets ...................................................................................................................................................... 54 Summary Tables .................................................................................................................................................. 55 Summary Graphs................................................................................................................................................. 55 Results for LiST .................................................................................................................................................... 56 Cost per Service ................................................................................................................................................... 57 Medicines Quantification .................................................................................................................................... 57

4
6. Illustrative Package......................................................................................................................................................... 58 7. Calculations Worksheets ............................................................................................................................................. 58
Demography ........................................................................................................................................................ 58 CHW Numbers ................................................................................................................................................... 63 Summary STGs .................................................................................................................................................... 66 Service Numbers ................................................................................................................................................. 66 Supervisor Numbers ............................................................................................................................................ 67 CHW Time ........................................................................................................................................................... 69 Medicine Costs ..................................................................................................................................................... 69 Quantification....................................................................................................................................................... 70 Summary CHW ................................................................................................................................................... 71 Summary by Program ......................................................................................................................................... 77 Cost by Input ........................................................................................................................................................ 78 Cost by Program .................................................................................................................................................. 80
8. Database Worksheets .................................................................................................................................................. 82 Country Database ............................................................................................................................................... 82 Population Database ........................................................................................................................................... 83
References ........................................................................................................................................................................................ 84

5
Acknowledgements
The Community Health Planning and Costing Tool was developed by Management Sciences for Health (MSH), under contract number 43188968 with UNICEF.
The Community Health Planning and Costing Tool was developed and finalized over the course of two country visits to Malawi and Sierra Leone. In each country, data on costs of a complete package of community health services was collected with the generous time and support of the following people: Humphreys Nsona (Head of IMCI Unit, Malawi MOH); Dr. Joseph Kandeh, Foday Sawi Lahai, Anitta Kamara, Elizabeth Musa, Mara Kardas-Nelson, Richard Musa, and Albert Vandy (Sierra Leone, MoHS); Sierra Leone; Jerome Pfaffman (UNICEF NYC); Kyaw Aung (Chief of Health, UNICEF Malawi); Dr. Indrani Chakma (Health Specialist, UNICEF Malawi); Dr. Nuzhat Rafique (UNICEF Sierra Leone); Dr. Kebir Hassan (UNICEF, Sierra Leone); and Mark Young (UNICEF NYC).
The developers of the Tool, David Collins and Zina Jarrah, would like to thank the members of the field piloting teams for their valuable feedback and suggestions on the tool design – William Newbrander, Colin Gilmartin, Sarah Davey, Sara Wilhelmsen and Christopher Villatoro (all of MSH) and Kemi Tezfazghi (independent consultant).
The authors of the user guide are Zina Jarrah, David Collins, Sarah Davey, Colin Gilmartin, and Sara Wilhelmsen. Zina Jarrah is an independent consultant. David Collins is a Senior Principal Technical Advisor, Sarah Davey is a Project Associate, Colin Gilmartin is a Senior Technical Officer, and Sara Wilhelmsen is a Senior Technical Advisor, all with MSH.

6
Acronym List
ACT Artemisinin-combination therapies
AEHO Assistant Environmental Health Officer
ARI Acute respiratory infection
BCC Behavior change communication
CHW Community health worker
CHS Community health services
C-IMCI Community-Based Integrated Management of Childhood Illness
DEHO District Environmental Health Officer
DHO District Health Officer
DMO District Medical Officer
DHS Demographic Health Survey
GHI Global Health Initiative
HMIS Health Management Information System
HAS Health Surveillance Assistant
iCCM Integrated community case management
IMCI Integrated Management of Childhood Illness
MCHIP Maternal and Child Health Integrated Program
MDG Millennium Development Goal
MOH Ministry of Health
MOH Ministry of Health and Sanitation
MOHP Ministry of Health and Prevention
MSH Management Sciences for Health
MUAC Mid-upper arm circumference
NGO Non-governmental organization
ORS Oral rehydration salts

7
RDT Rapid diagnostic test
SHSA Senior Health Surveillance Assistant
TB Tuberculosis
TRAction Translating Research into Action, project funded by USAID
UNICEF United Nations Children's Fund
URC University Research Corporation
USAID US Agency for International Development
WHO World Health Organization

8
Background: Importance of Costing Community Health Services There is growing evidence on the benefits of Community Health Services (CHS) as a key strategy to promote healthy behavior and improve access to high-impact maternal, newborn, and child health interventions from pregnancy to adolescence. Much less is known, however, of the financing needs for effective, comprehensive CHS and, without this information, programs are often under-funded and financially unsustainable. Additionally, opportunities to include CHS financing in insurance packages or in new global funding mechanisms (such as the Global fund to fight AIDS, Tuberculosis, and Malaria or the Global Financing Facility) are frequently missed.
Adequate financing can only be achieved if costs are known. While certain elements of CHS (e.g. malaria case management and prevention, family planning, reproductive health, and integrated community case management) have been costed individually, there is little or no information on the cost of comprehensive CHS. Effective CHS depend on a well-functioning overall health platform which ensures that training, equipment, medicines and supplies, management and supervision, transport, financing, information systems, quality control, demand generation, governance, and other key elements function well. These resources must be combined in the most efficient manner possible to maximize outputs and outcomes. Demand generation is particularly important as several studies have shown that services are not cost-effective unless they are well utilized. Equally important is the use of financial and non-financial incentives for CHWs to ensure they are motivated and well-performing as programs with high rates of CHW attrition are generally neither cost-effective nor sustainable.
Recognizing the need to support countries in the development and scale up of effective CHS, Management Sciences for Health (MSH), through support from the United Nations International Children's Emergency Fund (UNICEF), has developed a methodology and costing tool to support the creation of CHS investment cases. MSH has piloted this methodology and costing tool in Malawi and Sierra Leone, countries which were selected given the important role that CHWs play within each of the country’s health system. The purpose of this piloting was to test the methodology and tool in real situations and, at the same time, to provide an analysis of costs and an investment case that will be useful for the countries.
The following report details the results and findings of the pilot study conducted in Malawi in February – March 2016. The results of this study serve to support the Malawi Ministry of Health (MoH) and partners across a range of countries in the development of comprehensive community health strategies and investment cases. The lessons learned from the piloting have been taken into account in the development of the CHS investment case methodology, costing tool and guidelines, which are available from UNICEF and MSH.

9
Section 1. Introduction Welcome to the Community Health Planning and Costing Tool User Guide.
This User Guide is part of a set of documents and aids developed by Management Sciences for Health (MSH) for UNICEF to accompany a tool for the costing of comprehensive community health services. These documents and aids can be found on the UNICEF and MSH web sites and comprise the following:
• Blank and example versions of the Community Health Planning and Costing Tool; • The Community Health Planning and Costing Tool User Guide (this guide); • The Community Health Planning and Costing Handbook (an overall guide to the approach); • A final country piloting report for Malawi; • A final country piloting report for Sierra Leone; • A video introduction to the Tool; • A recorded Webinar on the development and use of the tool.
The purpose of the Community Health Planning and Costing Tool is to help planners and managers to determine the costs and finances of implementing comprehensive community health services (CHS) packages.
This User Guide provides program planners and managers with instructions for using the Tool. The Tool is customizable and can be used to assess the costs and financing of CHS program introduction and expansion in developing country settings, with different levels of CHS experience. The Tool can be used to calculate costs and financing requirements for a comprehensive CHS program baseline year, as well as for ten projection years.
This Tool can be customized to program or country context and covers all aspects of a comprehensive CHS program, comprising start-up costs, training costs, community-level service delivery costs, as well as support, supervision, and management costs at all levels of the health system. Additionally, the Tool has a financing element that can be used to show and program financing sources and show gaps in funding. The Tool is based in Excel and is open access, allowing the user to see all calculations and results in the model.
The Tool has the ability to include up to 100 health interventions. At the service delivery level, it is a bottom-up activity-based costing tool, in which unit costs per service are built up by type of resource (such as medicines) and multiplied by the total estimated numbers of services. Other costs, such as supervision and training, are allocated using a top-down methodology. The Tool uses standard treatment protocols for the CHS services to determine the standard costs of treatment.
The Tool automatically produces the following outputs used to measure cost efficiency and effectiveness:
Total program costs, baseline year and ten-year cost projections;
Costs per capita, per CHW, per contact, per program, and per resource type;

10
Incremental costs and incremental financing (start-up and recurrent) as a whole and for each level (national, regional, district, facility and community) over time;
Key drivers of costs and cost categories as a percent of total costs;
Ten-year projections of financing with sources of funding;
The Tool can be used for the following analyses:
Planning and budgeting a new package, additions or changes to a package or geographical expansion of a package;
Comparing cost efficiency and effectiveness of different service delivery platforms;
Calculating reimbursement rates for results-based financing or insurance;
Costing “What-if” scenarios to model a package in line with financing limitations;
Developing investment cases to get support (funding and otherwise) from donors and partners
Overall guidance on conducting the costing and financing analysis can be found in the separate Community Health Planning and Costing Handbook. This User Guide focuses on the use of the Tool itself – the entry and analysis of data.
This User Guide is for use with the Tool, which can be found online on the MSH and UNICEF websites.
1) A blank version of the Tool, to input all relevant assumptions and information regarding your country program (CHPCT_Master_Example_Version_Blank; and
2) An example version of the Tool, with sample country data included for your reference (CHPCT_Master_Example_Version).
The Tool requires a detailed level of data to estimate the costs and financing needs of CHS programs as accurately as possible. The Tool was designed specifically for CHS program managers and planners, and can be adapted to each individual country and program context. As a result, there are numerous data requirements that the user must enter. The authors recommend a thorough review of this document prior to starting any data collection, data entry and analysis with the Tool. They also recommend a thorough review of the Community Health Planning and Costing Handbook, which provide overall guidance on the approach. It is also recommended to view the accompanying video and Webinar, which can be found on the UNICEF and MSH web sites.

11
Section II: Tool User Guide This section provides instructions on how to enter data into the Tool and how to review the results. Two versions of the Tool are available: a blank version and a demo version with sample data filled in. The examples in this section of the user guide have been generated using the demo version of the Tool provided as part of the package. Once all the requisite information has been collected, use the blank version of the Tool to start entering data.
Note: All directions in this user guide are for use on PC computers. Some menus and instructions can vary slightly for users of the Macintosh version of Excel.
1. Title Page When opening the Tool, ensure that macros are enabled so that the Tool functions correctly. To enable macros, go to the Excel menu and select the following: File -- Options -- Trust Center -- Trust center settings -- Macro Settings -- Enable all macros. Or select “Enable content” at the prompt:
The Tool should automatically open at the Title Page. The title page of the Tool provides information on the Tool version, last update, developer information, and disclaimers.
Note: The Community Health Planning and Costing Tool is an open-source tool. Users take note that any changes in the structure or formulas may result in errors. Some default data are available in the Tool, please ensure before using that they are the most accurate for each country. UNICEF and MSH are not responsible for the use of the Tool or the results produced. These are entirely the responsibility of the user

12
Use the red “Main Menu” button to navigate to the Main Menu.

13
2. Tool Navigation
The Main_Menu worksheet will allow for quick navigation to the main sections of the Tool that should be used: the data entry worksheets and the results worksheets. All sheets can be protected or unprotected using the buttons at the bottom of the Main_Menu worksheet. With “protection” switched on, the user can only enter data in the unprotected cells that are designated for data entry.
By default, the Tool sheets will be automatically “protected.” If the user wishes to make any changes outside of the designated blue cells, they will need to select “unprotect” and enter in the password “community.” When in protected mode, the user will only be allowed to

14
make changes to the light blue, data entry cells on the worksheets. Unprotecting the workbook gives the user the ability to make changes to any cells within the tool, as well as to view all intermediate calculation worksheets. Note: Given the detailed formulas embedded into the tool, it is suggested that the users contact the creators of the tool prior to making any significant changes to its features.
In any of the other worksheets, use the tabs along the bottom to navigate to different parts of the Tool. Or, use the red navigation buttons located throughout the Tool for easy access to different sections and worksheets
All data entry should be made in light blue shaded cells only (see diagram below). Data entry can occur as a direct entry by the user, or can be made by a selection from a drop-down menu. When cells have a drop-down menu option, all data must be selected using the drop-down menu. Overwriting cells with a drop-down menu may cause errors in the Tool calculations.
Do not enter data into white or greyed out cells. Automatic calculations may appear in white cells; never delete or overwrite any of the formulas in these cells. Greyed out cells indicate that no data entry is necessary, based on a previous selection made by the user. For example, if the user indicates that the program will be scaled up in the next 10 years, the data entry cells on the Program_Scaleup page will appear as light blue. If the user indicates that the program will not be scaled up, the cells will automatically be shaded a grey color to indicate no data entry is required (see diagram below).
DATA ENTRYMAIN MENU TREATMENT GUIDELINES RESULTS

15
The next sections describe each worksheet in the Tool in detail. Use the demo version of the Tool when following the examples in this Tool user guide. Use the blank version of the Tool when you are ready to begin entering data for your program.
Important Tips for using the Community Health Planning and Costing Tool
• All worksheets in the tool can be unprotected on the Main_Menu page, allowing the user to enter data and modify formulas. For beginner users, it is recommended to keep cells “protected.”
• Never delete any rows, columns, or tables in the tool. Also, never add any rows or columns into the tool. This will disrupt the calculations and the tool will not function correctly.
• Cells containing “More Information” and a red triangle in the corner have additional information on how to enter data into the tool. Hover the mouse cursor over these cells to display the comments.
• It is recommended to start the data entry with the Program_Data page, then enter data in sequential order from worksheet to worksheet, moving from the left to right tabs in the tool.
• This document uses the generic terms “Community Health Worker”, “CHW”, and “Village”. These terms can be customized in the tool to reflect the country and program-specific context.

16
3. Background Worksheets
Title Page
This worksheet is the first page of the CHS Cost and Finance Modeling Tool and includes the acknowledgement information for the Tool.
Main Menu
The Main Menu is the main navigation page for the Tool. Use this page to quickly navigate through the background worksheets, data entry worksheets, and results worksheets, as well as to protect/unprotect cells.
Data Entry Guide
The Data Entry Guide provides brief instructions on using and navigating the CHS Costing and Financing Tool.
Bottleneck Analysis
The Bottleneck Analysis sheet provides a summary of the bottleneck analysis process.
4. Data Entry Worksheets
General information
Some cells in the Tool have embedded comments. These cells can be identified by the presence of a red triangle in the top right-hand corner (see example below). Clicking on or hovering over the cell will show these comments.
17
It is recommended that the Tool be used in its default “protected” mode to reduce the possibility of accidentally making errors or overwriting formulas. When in this mode, only the light blue data entry cells can be manipulated on most worksheets. If you are using the tool in “unprotected” mode, be careful not to accidentally write over a cell which appears to be blank. Some cells only populate when data are entered in other areas of the Tool. For this reason, it is essential that data are entered into the Tool in sequential order, starting with the Program_Data page and moving to the right. Always ensure that data are entered only in the light blue shaded cells. Do not add or remove columns or rows in the Tool, as this could cause disruptions to calculations throughout the Tool.
Program Data
Details of the program data, including country information, community health program information, community health sub-programs, and health systems levels included in analysis are entered in the Program_Data worksheet.
1. Country Information Input the country name and baseline year of analysis. Enter the total national population at baseline, the population growth rate, annual inflation rate, and the national currency and exchange rate to USD. If the inflation rate is entered, this rate will be applied to all costs on an annual basis, for each projection year. This includes the costs of medicines, equipment, training, supervision visits, and other recurrent costs. In the case of CHW and Supervisor salaries, the user can either opt to manually enter salaries each year, or enter a single salary, to which the inflation rate will then be applied. Select the currency in which data will be entered into the Tool. Note that all costs and financing information must be entered in this currency. If program costs are incurred in two different currencies, it is recommended to enter data using the currency in which the majority of program costs are incurred.

18
Next, select the currency in which data will be displayed in the Results worksheets. The results can be displayed in the local currency or automatically coverted to USD.
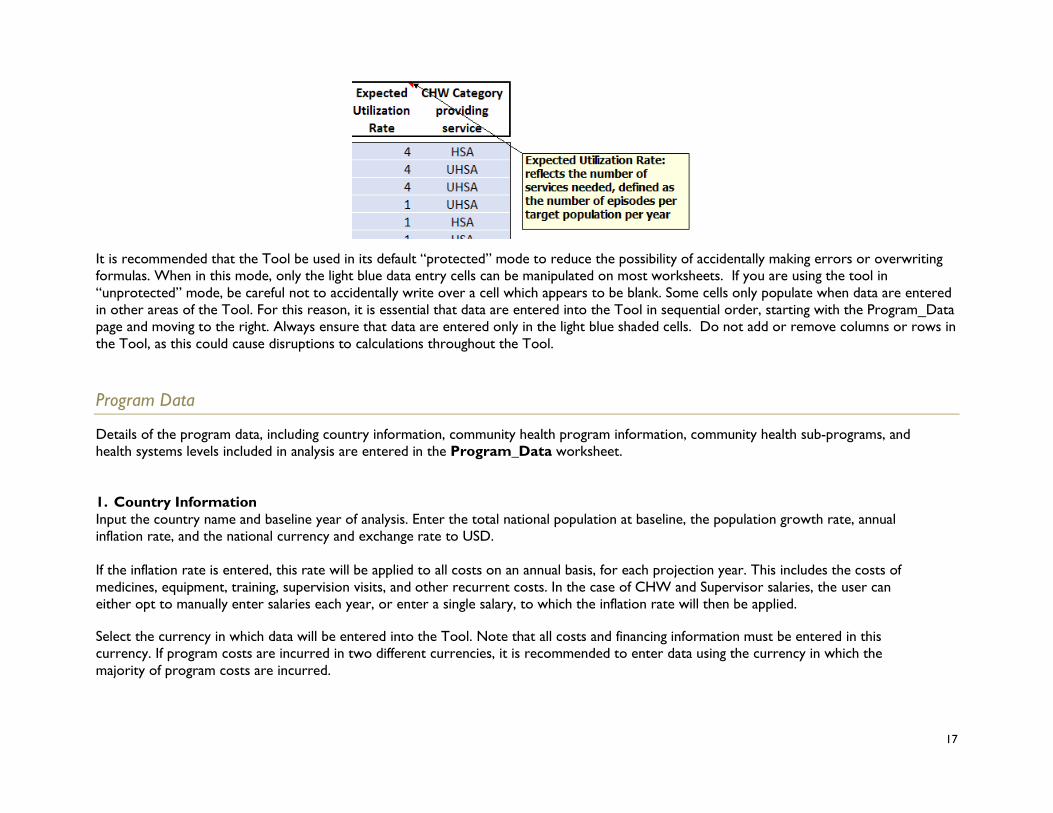
2. Community Health Program Information Input the Length of Program (number of projection years) and date of analysis in the Community Health Program Information section. Indicate whether or not this is a sub-national analysis; If “yes,” input the name of the sub-national area and population of sub-national area, as shown in the example below. Indicate whether the program will be scaled up within 10 years. If “Yes”, you will be prompted to fill in the scale-up assumptions on the next worksheet, titled Program_Scale-Up. If “No”, the Tool will assume the same number of districts, sub-districts, and communities will be covered by the community health program thoughout the projection years. The Tool will automatically calculate population growth for this scenario. If “No” is selected, no data entry is required in the Program_Scale-Up worksheet. Do not enter data or overwrite any cells. First, indicate whether a national or a sub-national analysis will be conducted. If a national analysis is selected, the total population entered in the previous section will be used. If a sub-national analysis is selected, the user is prompted to enter the population of that sub-national area, as well as the name. This sub-national population will then be used as the basis of calculating population assumptions throughout the tool.

19
Second, indicate whether the program will be scaled up over the 10-year projection period of the Tool. Here, scale-up refers to geographical scaling up, such as increasing the number of districts, sub-districts, or villages covered by the CHS program. It can also be used to indicate that the population covered will be scaled up. However, increasing numbers of services due to natural population growth would not be considered as scaling up. Increasing coverage of community health services to the same population is also considered separately from scaling up, and can be input on the Coverage worksheet. Indicate whether the program will cover both rural and urban areas. The user has the option to select only rural areas covered, only urban areas covered, rural and urban areas covered with the same package, or rural and urban areas covered with different packages. If “only rural areas covered,” “only urban areas covered,” or “rural and urban areas covered with same package,” are selected, then the user will only need to input the percentage of the population living in areas reached by CHWs. If “rural and urban areas covered with different packages” is selected, the user will need to enter what percentage of the total population lives in urban areas covered by CHWs. The percentage of the population living in rural areas will be automatically calculated based on what is entered for urban areas. Verify that the automatically calculated population sizes for urban and rural are correct. Next, the user is required to enter what proportion of the urban and rural populations are covered by the CHWs. This proportion should be entered as a percentage of the total urban or total rural population. In the example below, 25% of the population lives in urban areas; of that population of 139,736, 60% are covered by CHW services, or 83,841 people. The user then needs to enter the average household size, or number of persons per household in the chosen population.

20
If not a sub-national analysis, data fields will not be active for name of sub-national area or population of sub-national area:
21
3. Community Health Sub-Programs
Input the list of all Community Health Sub-Programs involved in providing services at the community level. Input the corresponding abbreviation for each sub-program. The demo version of the Tool includes the following sub-programs, which you can review and modify according to your country’s context.

22
4. Health System Levels Included in Costing Analysis Input the Country Administrative Structures, beginning with the first and highest level (National or Central) and working down. The last level should be reserved for the geographical area covered by the CHW (such as a Village, Community, or Hard-to-Reach Area). Input the number of health systems levels involved in implementation of the community health program at the baseline year. For example, if you are conducting a national-level analysis, you will include all districts, sub-districts, health centers, etc. throughout the country which are involved in supporting the community health program. If conducting a sub-national analysis, you will only select those within the sub-national area. If the scale-up option is selected, you will be asked to specify the number of health systems levels for each program year. If the scale-up option is not selected, the Tool will assume that the numbers input here will remain constant throughout the projection years. Depending on what options were selected for rural and urban coverage, you will be asked to specify the community-level administrative structures for each applicable.

23
5. Sources of Financing for Community Health Program Select the preferred method for input of financing information in the Tool: either fixed amount or percentage of total required. This will be relevant for the Financing worksheet. List all sources of financing for the community health program in the blue cells.

24
Program Scale-Up
Details of program scale-up assumptions, if selected “Y” on Program_Data worksheet, are entered on the Program-Scale-Up worksheet. 1. If you selected “N” for Program Scale-Up: If response was “no” to the question: “Will the program be scaled up within 10 years?” on the Program_Data tab, no data is to be entered on the Program_Scale-Up tab and a red warning message stating, “Program Scale-up has not been selected. No data entry required” will appear.
2. If you selected “Y” for Program Scale-Up:
If the community health program will be scaled up, use this worksheet to input the assumptions for the scale-up. The figures in Column C (2015 in the example) are propulated automatically, based on data entered in the Program_Data worksheet. Do not overwrite these cells – any changes should be made directly in the Program_Data worksheet. First, input the total population of the country or sub-national area in which the community health program will be implemented in row 7 (from Column D). Be sure to include assumptions for population growth. If you selected “rural and urban areas covered with same package,” “only rural areas covered,” or “only urban areas covered,” input the proportion of this population that will be targeted by community services in row 10. The total population to be covered by community services will then be automatically calculated in row 13. These population figures will serve as the basis for calculating the number of services provided each year, and will be used in combination with the target population and coverage for each service, entered in the Package and Coverage worksheets, respectively.

25
If you selected “urban and rural areas covered with different packages,” input the percentage of population in areas targeted by CHW services for urban areas in row 11 and rural areas in row 12. The total population to be covered by community services will then be automatically calculated in row 14 for urban areas and 15 for rural areas. Note that this percentage should be input out of 100, with 100% indicating that all of the urban population, or all of the rural population, will be covered by CHW services. Always be sure to verify that the populations automatically calculated in rows 14 and 15 correctly represents the total number of people that should be covered by the community health program, in urban and rural areas.

26
In the next section, input the number of health systems levels that will be implementing the community health program. The assumptions for the baseline year will be read in automatically into column C. Input the number of sub-national units and communities that will be providing the community health services. Make sure that the population figures entered into the first part of the worksheet are relating to the administrative structures in a logical way. For example, if the number of districts doubles, the number of communities and the population should also increase. Greyed out cells do not require any data entry, and may change depending on the selection made on the Program_Data page relating to the urban and rural packages. Ensure that all blue shaded cells have data entered in this section; failure to do so could result in calculations not working correctly throughout the Tool.
CHW Categories
Details pertaining to the community health worker categories included in the costing analysis are entered on the CHW_Categories worksheet. The Tool allows up to six different types of CHWs to be input; select the number of different categories of Community Health Worker from the drop down menu (1-6). Columns will be highlighted corresponding to the number of categories indicated. Different categories of CHWs are typically differentiated by the services they provide, their training and equipment, and their remuneration. The Tool allows for three different methods of determining the number of CHWs for each program year. Select the method of calculating number of CHWs, based on the following options:

27
Manual entry: The user inputs the number of CHWs for each program year, in the blue shaded cells indicated next to each category.
CHW per population: When this option is selected, the Tool will calculate the number of CHWs for each program year based on the total population covered and the ratio of CHW to population entered by the user. CHW per community: When this option is selected, the Tool will calculate the number of CHWs for each program year based on the total number of communities entered by the user. If no scale-up option is selected, the communities and therefore the number of CHWs will be the same every year.
Select the method of entering salary (constant or changes each year): either constant salary (enter once) or changing salaries (enter for each year). If constant salary option is selected, the inflation rate input on the Program_Data worksheet will be applied annually.
1. CHW Information
For each cadre of CHW selected do the following:
• Enter the full title of the CHW and the abbreviation. This abbreviation will be used throughout the Tool.
• Select either Rural or Urban CHW. This data entry will only be required for CHWs if the user indicates that the urban and rural areas receive different packages on the Program_Data page.
• Enter the desired ratio of CHWs per population, expressed as the population covered per 1 CHW (i.e. if each CHW should cover 1,000 people, input 1,000)
• Enter the desired ratio of CHWs per community (i.e. if there are expected to be 2 CHWs in each village, input 2).
• Input the annual CHW attrition rate as a percentage of the total number of CHWs. This figure will be used to calculate the additional number of CHWs that need to be trained to replace those lost to attrition each year.

28
• Input the hours per week and weeks per year available per person to work as a CHW. This information can be based on standards from a CHW policy; however, since most CHW programs involve volunteer workers with no standard working hours, it may be necessary to base this information from the CHW questionnaires.
• Enter the total number of CHWs trained and deployed at baseline year. If sub-national analysis, enter number of CHWs within sub-national area, if national analysis, enter number of CHWs for entire country.
• Enter annual CHW salary in the currency indicated for data entry on the Program_Data page.
• Indicate whether or not CHW receives any form of performance-based incentive. If yes, proceed to enter annual performance-based incentive payment, and the total annual salary + performance incentive will be calculated automatically by the Tool. If no incentives are received, these last two fields will be blank. This salary will be applied to all CHWs, throughout all the program years.

29
If “constant” salary” is selected as method of entering salary, the user will enter the annual CHW salary and any performance based incentives and an inflation rate will be applied annually to salaries:

30
If “changing salary” is selected as method of entering salary, the user will enter the annual CHW salary and any performance-based incentive payments at baseline and for all projection years:

31
Supervisor Categories
Details pertaining to the CHW Supervisor categories included in the costing analysis are entered on the Supervisor_Categories worksheet. The Tool allows up to six different types of CHW supervisors to be input; select the number of different categories of supervisors from the drop down menu (1-6). Columns will be highlighted corresponding to the number of categories indicated.
1. CHW Supervisors
Details of the supervision structure are entered in the Supervision sheet. Note: this worksheet should be used to enter direct supervisors of CHWs only. Supervisors of supervisors will be considered as management staff, and should be entered into the Management worksheet.
First, select the desired method of calculating the number of CHW Supervisors:
Manual Entry: Similarly to the CHWs, by selecting this option, the user must input the number of CHW Supervisors for each program year, using the “Supervisor Numbers” worksheet (link is included on the worksheet).
Ratio CHWs per Supervisor: When this option is selected, the Tool will automatically calculate the number of Supervisors needed based on the ratio entered in Column F. For example, if the user enters 10 CHWs per supervisors, the total number of CHWs per program year will be divided by 10 to determine the number of supervisors needed.
Select the method of entering salary (constant or changes each year): either constant salary (enter once) or changing salary (enter for each month). For each category of CHW supervisor, enter the following:
• Supervisor title • CHW category to supervise (select from drop-down menu). If a program has multiple cadres of CHWs and only one cadre of
supervisors, the user should select “All CHWs” • Community health program (select from drop-down menu) • Desired ratio of CHWs per supervisor • Percentage of time spent on CHW supervision at baseline. If manual entry was selected, enter desired percentage for each
projection year. • Total number of supervisors per category deployed at baseline year If manual entry was selected, enter desired number of
supervisors for each projection year. • Annual salary (in currency selected for data entry) at baseline year.
32
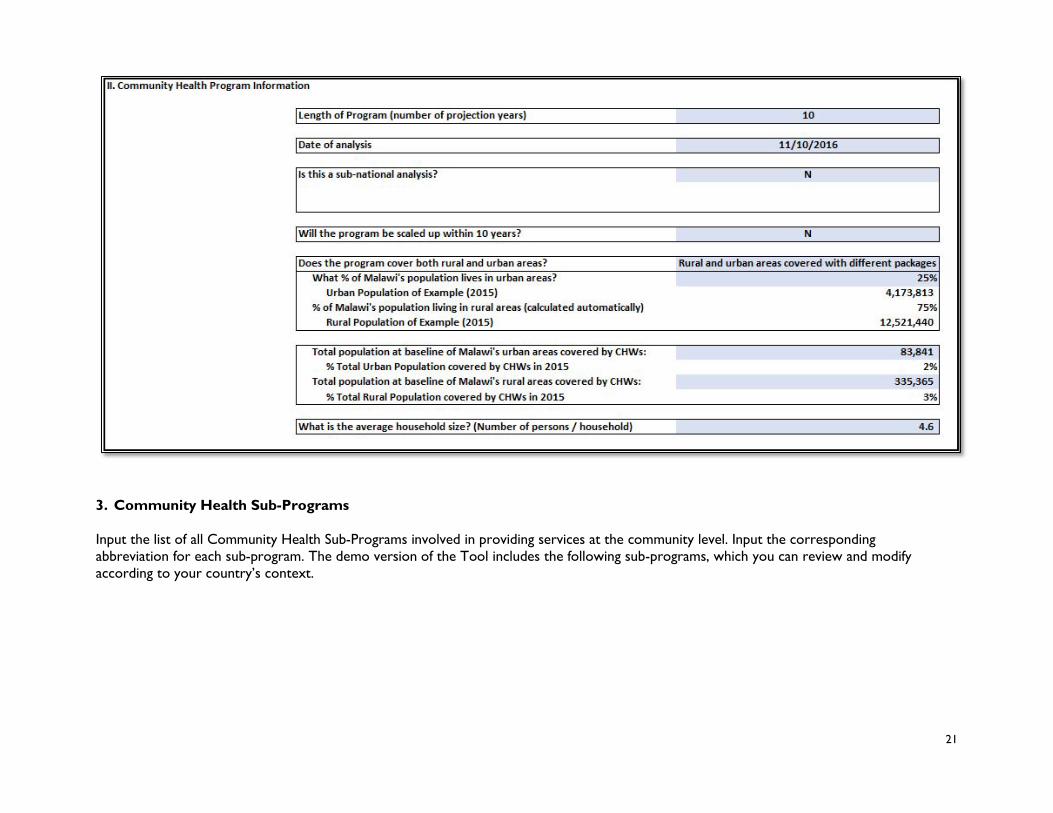
If “constant” salary” is selected as method of entering salary, the user will enter the annual CHW supervisor salary and an inflation rate will be applied annually to salaries:
If “changing salary” is selected as method of entering salary, the user will enter the annual CHW supervisor salary at baseline and for all projection years:

33
Package
The user can input up to 100 different services in the CHS package on the Package worksheet. Typically, the Tool has the flexibility to include all services that are currently being offered, or will be offered in the future. For best results, use this worksheet to input all services currently being offered or planned to be offered in your country; this way, you will build the foundation for a national-level model even if you are conducting a sub-national analysis. The Tool can then be used to cost the program in a different sub-national area, if desired.
To fill in this worksheet, first compile a comprehensive list of all services and interventions that will be provided by community health workers. This should include the full range of services, from preventive interventions such as antenatal care, to curative services such as malaria treatment, to promotional services such as community health talks. Input the list of services into Column B.The user has the option to select from an illustrative list of interventions delivered by CHWs based on a technical brief prepared by UNAIDS, UNFPA, UNICEF, UN Women, WHO, and World Bank published by WHO in 2015. Note: this is focused on sexual, reproductive, maternal, newborn, child, and adolescent health and may not include all the community services desired by a coutry. If the user wishes to enter interventions onto the Package worksheet based on this list, click the orange button at the top of the sheet.
Next, select the appropriate program related to each service from the drop-down list in Column C. Note: do not type the program in directly as this can cause errors in the Tool – be sure to use the drop-down list only. The program list is based on the user input from the Program Data worksheet; any additions should be made directly on this worksheet.
Next, select the appropriate target population for each service from the drop-down list in Column D. Note: once again, be sure to use the menu and do not directly enter information into this column. For promotional activities that are delivered to the entire community or to a household, use “Community” or “Household”, as appropriate. For other services, select the target population that is most appropriate. For example, antenatal care visits should target pregnant women; iCCM services should target children under 5. The target population will be combined with the incidence rate to determine the total number of services needed per year.
Next, select the “service type” for each service from the drop-down list in Column E (Promotional, Preventive, or Curative).
Next, select from the drop-down list in Column F whether the services are targeted at urban, rural, or both urban and rural populations. If the column is greyed out, no data entry is required (this indicates that there is not a separate package provided for urban and rural areas).
Next, input the expected utilization rate for each service into Column G. This rate should be expressed as the number of expected episodes per target population per year. The rate must be related directly to the target population selected in Column D. For example, if all newborns should receive a BCG vaccine, the target population selected should be “newborns”, and the incidence rate should be “1”.
34
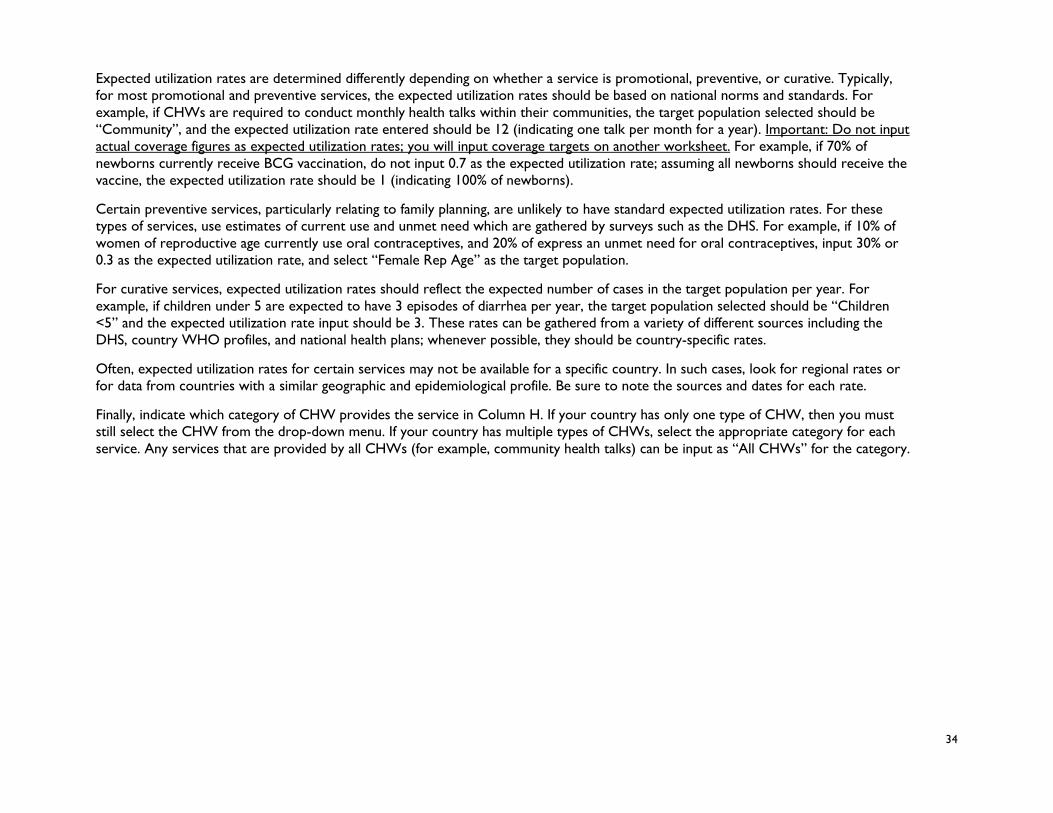
Expected utilization rates are determined differently depending on whether a service is promotional, preventive, or curative. Typically, for most promotional and preventive services, the expected utilization rates should be based on national norms and standards. For example, if CHWs are required to conduct monthly health talks within their communities, the target population selected should be “Community”, and the expected utilization rate entered should be 12 (indicating one talk per month for a year). Important: Do not input actual coverage figures as expected utilization rates; you will input coverage targets on another worksheet. For example, if 70% of newborns currently receive BCG vaccination, do not input 0.7 as the expected utilization rate; assuming all newborns should receive the vaccine, the expected utilization rate should be 1 (indicating 100% of newborns).
Certain preventive services, particularly relating to family planning, are unlikely to have standard expected utilization rates. For these types of services, use estimates of current use and unmet need which are gathered by surveys such as the DHS. For example, if 10% of women of reproductive age currently use oral contraceptives, and 20% of express an unmet need for oral contraceptives, input 30% or 0.3 as the expected utilization rate, and select “Female Rep Age” as the target population.
For curative services, expected utilization rates should reflect the expected number of cases in the target population per year. For example, if children under 5 are expected to have 3 episodes of diarrhea per year, the target population selected should be “Children <5” and the expected utilization rate input should be 3. These rates can be gathered from a variety of different sources including the DHS, country WHO profiles, and national health plans; whenever possible, they should be country-specific rates.
Often, expected utilization rates for certain services may not be available for a specific country. In such cases, look for regional rates or for data from countries with a similar geographic and epidemiological profile. Be sure to note the sources and dates for each rate.
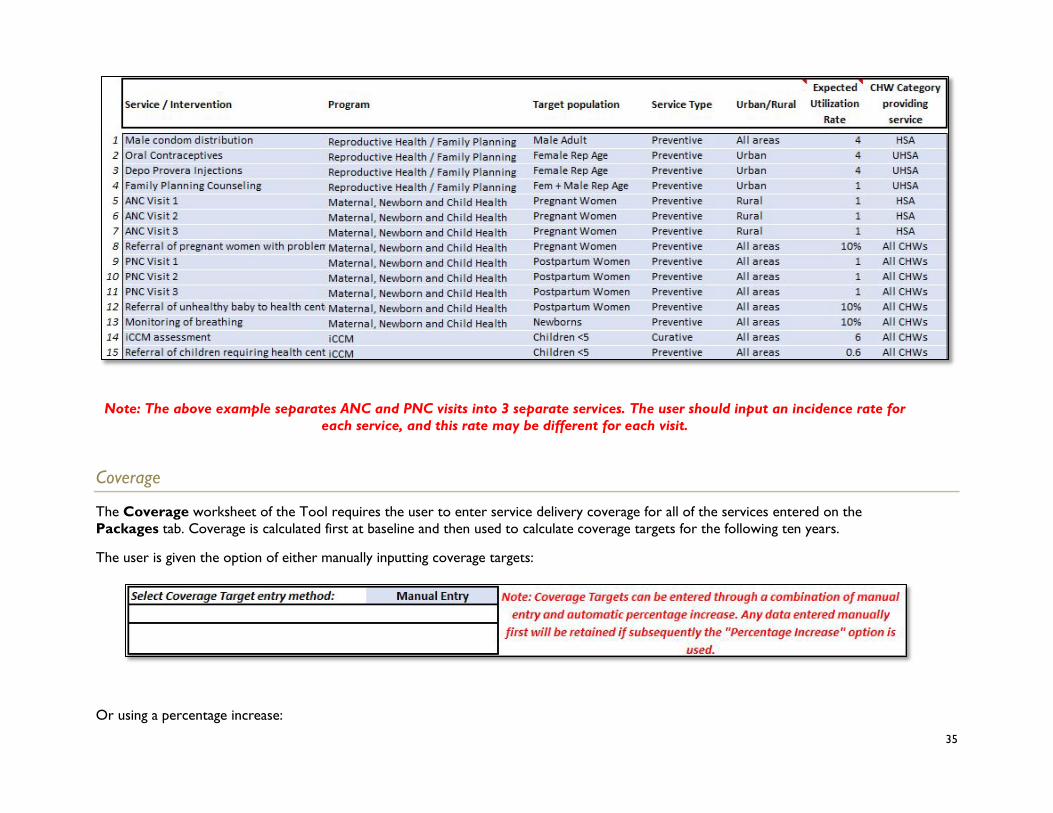
Finally, indicate which category of CHW provides the service in Column H. If your country has only one type of CHW, then you must still select the CHW from the drop-down menu. If your country has multiple types of CHWs, select the appropriate category for each service. Any services that are provided by all CHWs (for example, community health talks) can be input as “All CHWs” for the category.
35
Note: The above example separates ANC and PNC visits into 3 separate services. The user should input an incidence rate for
each service, and this rate may be different for each visit.
Coverage
The Coverage worksheet of the Tool requires the user to enter service delivery coverage for all of the services entered on the Packages tab. Coverage is calculated first at baseline and then used to calculate coverage targets for the following ten years.
The user is given the option of either manually inputting coverage targets:
Or using a percentage increase:

36
Note: a combination of these two methods can be used, as indicated in the explanatory note in the above screen shot.
1. Service Coverage at Baseline
First, input the actual number of services that were provided in the baseline year in Column E. These figures can be taken from the HMIS data or reports from the Districts. Caution should be used when obtaining these figures since they are often combined with clinic figures in the HMIS and may even be combined also at the district level. In this case these figures may only be separated between community level and clinic level services at clinics. In this case these data can only be obtained from the clinics and, if possible, the district health managers should be asked to get these data from all clinics. When collecting these data also check that they do not include services provided through outreach (where clinic taff visit communities and provide services). For example, if pneumonia in children <5 is treated by CHWs but also at clinics, ensure that the data entered for number of services relates only to the pneumonia cases treated by the CHWs. It is therefore important to verify that utilization data are disaggregated by level of service delivery.
Based on the figures input in Column E, the Tool will automatically calculate coverage for the baseline year in Column G. This is calculated by dividing the actual number of services (Column E) by the expected number of services (Column F). Expected number of services are calculated by the Tool, by multiplying the expected utilization rate per services by the target population. In the example below, there are a total of 13,318 pregnant women in the communities receiving CHW services. Each pregnant woman is expected to have three ANC visits in total (the example below divides each ANC visit as a separate service). With 13,318 ANC 1 visits expected, and a total of 1,200 ANC visits actually delivered in 2015, the baseline year coverage is 9%.

37
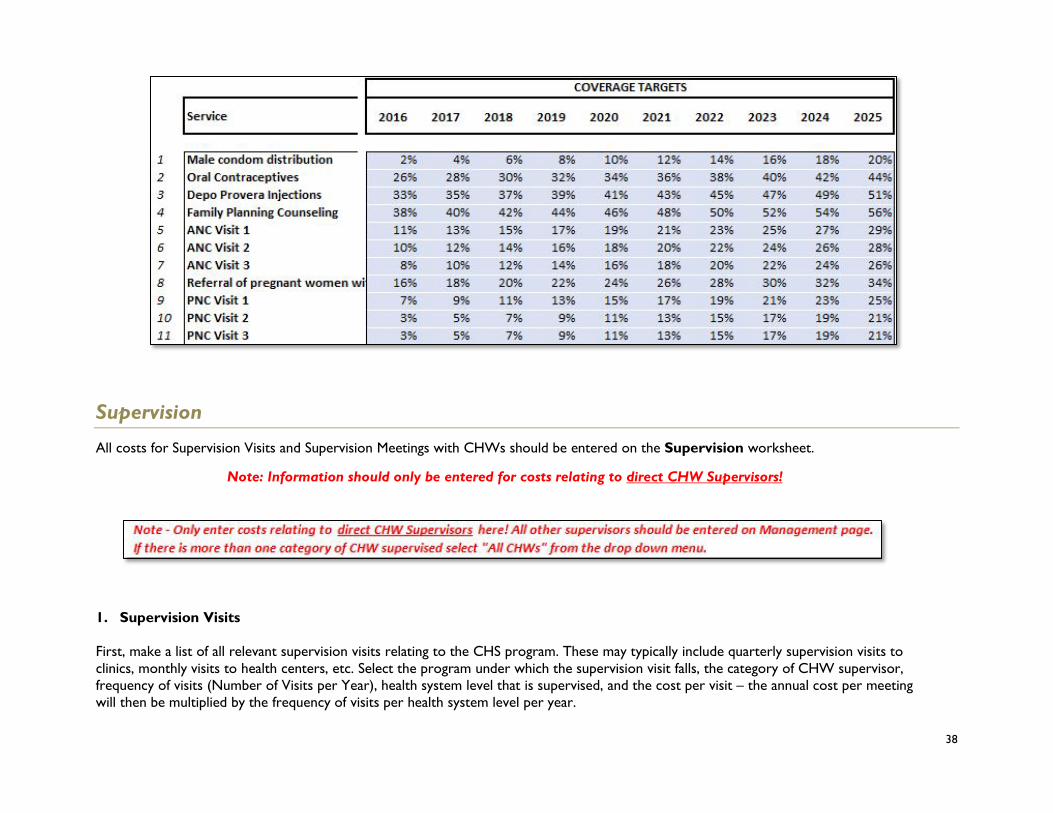
1. Service Coverage Targets
Use Columns I-R to input the coverage target for each program year. Coverage targets can be calculated or determined using a variety of different methods. Where applicable, these coverage figures should reflect national and sub-national targets as outlined in national health plans or similar documents. In addition, when possible, coverage targets should be realistic and feasible, and relate to the baseline coverage. For example, in the example below, the current coverage of referral of ANC Visit 1 is only 9%. A 2% increase per year was input into the Tool to show an incremental and realistic increase in coverage.
38
Supervision
All costs for Supervision Visits and Supervision Meetings with CHWs should be entered on the Supervision worksheet.
Note: Information should only be entered for costs relating to direct CHW Supervisors!
1. Supervision Visits
First, make a list of all relevant supervision visits relating to the CHS program. These may typically include quarterly supervision visits to clinics, monthly visits to health centers, etc. Select the program under which the supervision visit falls, the category of CHW supervisor, frequency of visits (Number of Visits per Year), health system level that is supervised, and the cost per visit – the annual cost per meeting will then be multiplied by the frequency of visits per health system level per year.

39
The administrative level entered for the supervision visit should indicate the level at which the supervisions occur (i.e., if the supervision staff are located at the Health Center level, and they will be supervising the community level, select “Community” (or Village Clinic, as in the example below) as the administrative level). The frequency of visits should relate to the administrative level. For example, if the health center conducts monthly supervision visits to each village, input 12. If there are 200 communities involved in the program, the Tool will automatically multiply the cost of the 12 visits by 200 communities.
2. Supervision Meetings with CHWs
Next, make a list of all relevant supervision meetings with CHWs relating to the CHS program. Use this section to enter data for all supervision meetings in which CHWs are given some form of remuneration (i.e. travel reimbursement, meal cost, or per diem). These typically include monthly supervision meetings of the CHWs at the nearest health center, visits to CHWs in village clinics, etc. Select the program under which the supervision visit falls, the category of CHW supervisor, frequency of visits (Number of Visits per Year), category of CHW supervised, and the cost per visit – the annual cost per meeting will then be multiplied by the frequency of visits per CHW per year. Note that if there are different categories of CHWs and all are supervised by one type of supervisor then under the CHW Supervised column select “All CHWs”.
Typically, direct supervision visits will comprise visits from health center staff to villages to observe the CHWs in the field. List all relevant types of direct supervision visits and the frequency at which they take place. Other levels of supervision (eg district supervision of CHW direct supervisors should be included under Management.

40
Management
The Management worksheet allows the user to input all costs associated with staff involved in management of the community health program, such as salary and frequency of meetings. Data entered on this worksheet will calculate the total costs of management associated with the community health program.
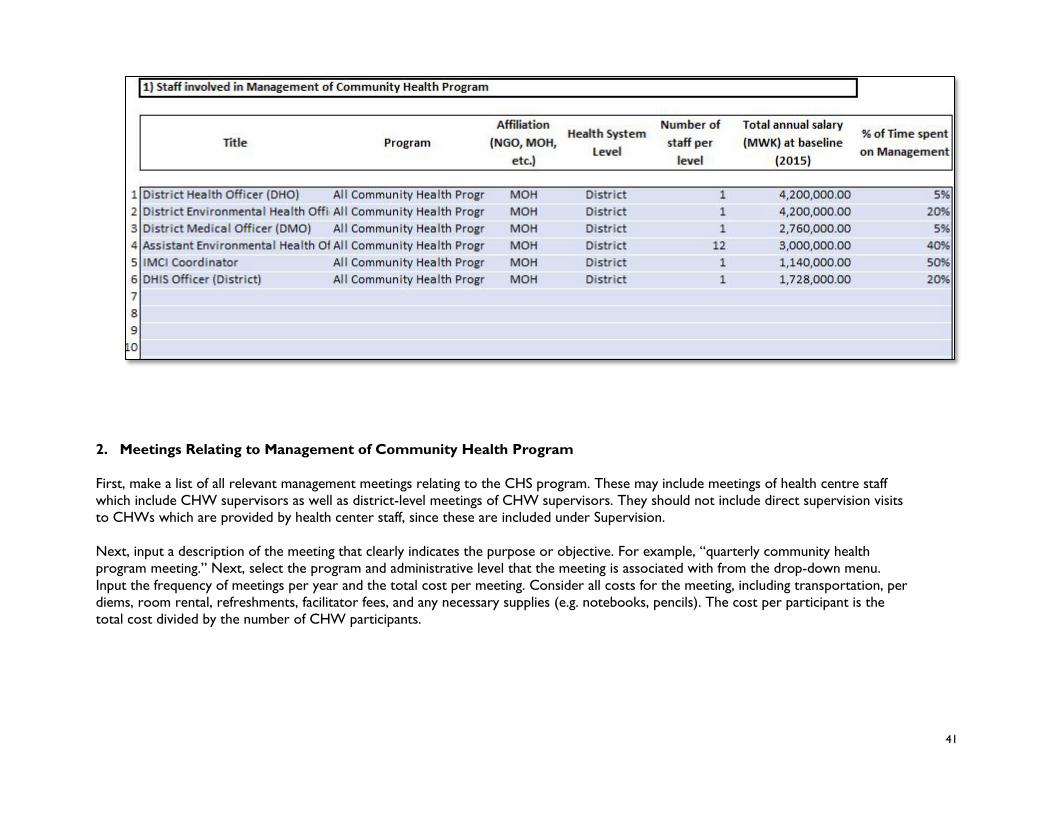
1. Staff Involved in Management of Community Health Program
The worksheet is similar to the Supervision tab, in that the user first makes a list of all relevant managers who are involved in the program. Select the program under which the management falls and the administrative level the management is affiliated with from the drop-down menus. Next, the user must input the number of staff per level. Finally, enter the percentage of time spent on management of the community health program; this percentage will be used to calculate the cost related to manager’s salary.
41
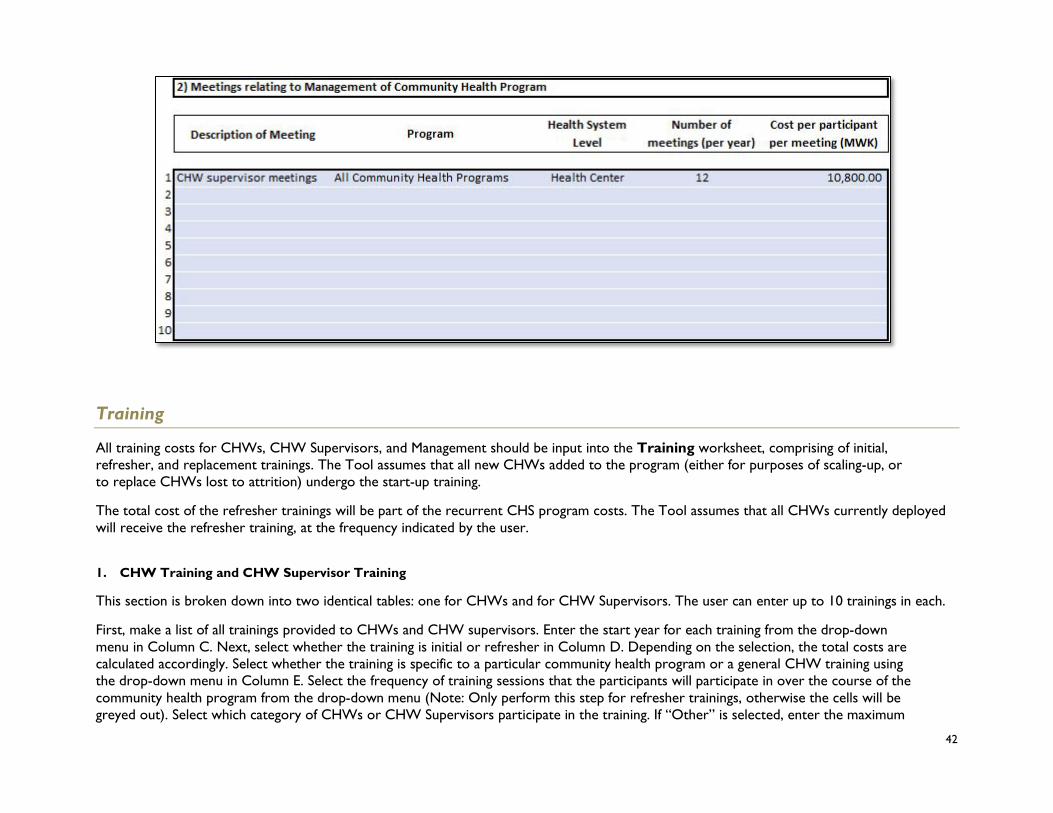
2. Meetings Relating to Management of Community Health Program First, make a list of all relevant management meetings relating to the CHS program. These may include meetings of health centre staff which include CHW supervisors as well as district-level meetings of CHW supervisors. They should not include direct supervision visits to CHWs which are provided by health center staff, since these are included under Supervision. Next, input a description of the meeting that clearly indicates the purpose or objective. For example, “quarterly community health program meeting.” Next, select the program and administrative level that the meeting is associated with from the drop-down menu. Input the frequency of meetings per year and the total cost per meeting. Consider all costs for the meeting, including transportation, per diems, room rental, refreshments, facilitator fees, and any necessary supplies (e.g. notebooks, pencils). The cost per participant is the total cost divided by the number of CHW participants.
42
Training
All training costs for CHWs, CHW Supervisors, and Management should be input into the Training worksheet, comprising of initial, refresher, and replacement trainings. The Tool assumes that all new CHWs added to the program (either for purposes of scaling-up, or to replace CHWs lost to attrition) undergo the start-up training.
The total cost of the refresher trainings will be part of the recurrent CHS program costs. The Tool assumes that all CHWs currently deployed will receive the refresher training, at the frequency indicated by the user.
1. CHW Training and CHW Supervisor Training
This section is broken down into two identical tables: one for CHWs and for CHW Supervisors. The user can enter up to 10 trainings in each.
First, make a list of all trainings provided to CHWs and CHW supervisors. Enter the start year for each training from the drop-down menu in Column C. Next, select whether the training is initial or refresher in Column D. Depending on the selection, the total costs are calculated accordingly. Select whether the training is specific to a particular community health program or a general CHW training using the drop-down menu in Column E. Select the frequency of training sessions that the participants will participate in over the course of the community health program from the drop-down menu (Note: Only perform this step for refresher trainings, otherwise the cells will be greyed out). Select which category of CHWs or CHW Supervisors participate in the training. If “Other” is selected, enter the maximum

43
number of trainees per session – the Tool will automatically calculate the number of sessions that are required at each level of the health system.
Finally, enter the cost per participant per session, taking into account transportation, per diem, lodging and for all materials needed for the trainings.

44
2. Management Trainings
Follow the same procedure for any training for Management (user can enter up to 10 for each).
Equipment
Enter all supplies and equipment provided to CHWs and their supervisors on the Equipment worksheet.
The Tool has an option to enter the mark-up on equipment for transport, storage, management, and distribution. This should be entered as a percentage and will be applied to each unit cost.
1. Community Health Worker Equipment Enter the equipment provided to CHWs in this section. Equipment can be defined as any materials provided to the CHWs that are used recurrently in the course of their work (as opposed to medicines and supplies which are used on a one-time basis per patient). This can include materials related to providing treatments such as: medicine boxes, ARI timers, MUAC tape, etc. This can also include other materials provided to CHWs such as bicycles, t-shirts, or boots.

45
For each piece of equipment, indicate which CHW category it is provided to and which community health program it is relevant to (note that there are options for “all CHWs” and “all community health programs.” For each of the “general” equipment, a portion of the unit cost will be allocated towards each individual program.
Input the number of units of each equipment provided to each CHW and the unit cost. Indicate the replacement frequency of each item in years using the drop-down menu. Select the initial year of purchase from the drop-down menu. Selecting “0” indicates that the CHW is given the item a single time and the equipment should last throughout the duration of the period selected. Selecting “1” indicates that the piece of equipment is replaced yearly, and so on. If the equipment is replaced twice per year, simply double the units per CHW to indicate that two units are given at a time, and select “1” for the replacement frequency (instead of inputting “0.5” as the replacement frequency, as the Tool will round up to the closest whole number).
2. CHW Supervisor Equipment Input any equipment provided to the CHW’s direct supervisor (as indicated on the “Supervision” worksheet), using the same instructions as for the CHW Equipment in section 1 above.

46
3. Management Equipment Input any equipment provided to the management of the CHW program (as indicated on the “Management” worksheet), using the same instructions as for the CHW Equipment in section 1 above.
Medicines, Supplies and Commodities
Enter all medicines, supplies and commodities that should be provided to CHWs on the Medicines worksheet. This information should be entered according to standard protocols, and should disregard any stock-outs. In order to fully understand the “Medicines” worksheet, it is also important to understand the standard treatment protocols worksheet which can be found on worksheets STG1-STG10

47
If the user cannot identify the unit costs of medicines and supplies in his or her country, the Tool links to two different medicine and supply pricing guides at the top of the worksheet. The user can either populate using their medicine and supply guide of choice, or access the pre-selected guides by clicking on the red buttons:
• MSH and WHO International Drug Price and Indicator Guide
• UNICEF Supply
Medicines and Supplies List the standard medicines,supplies, and commodities provided to CHWs. These should all be medicines and supplies used for treatments and should not include equipment that is used multiple times (for example, a needle safety box should not be included). Input the unit description and unit cost for each medicine, making sure to correlate the two together. For example, if the unit of ACT is per blister, ensure that the unit cost for ACT is per blister as well.
Enter each medicine individually. If there is a treatment regimen with multiple types of medications provided, each separate medicine should be input into a separate row. Where there are different dosages of the same medicine, enter the medicine twice and indicate the dosage in the title, as shown in the example with amoxicillin below.

48
The Tool has an option to enter the mark-up on medicines for transport, storage, management, and distribution. This should be entered as a percentage and will be applied to each unit cost (for example, a 5% mark-up would increase the unit cost of ORS in the example above from 71.02 MWK per sachet to 74.57 MWK). If the percentage for mark-up is already included in the unit cost of the medicines, or if it is unknown, leave this cell blank.
The user also has an option to input wastage, as a percentage. This percentage is applied to the total units of each medicine or commodity that are required.
Other Recurrent Costs
The Other_Recurrent_Costs worksheet allows the user to input any program costs that have not previously been addressed in the Tool. Typically, these costs include administrative or overhead costs such as office rental, communications, or vehicle maintenance costs.
Indicate the program and administrative level at which the costs are incurred – the Tool will automatically multiply the cost by the number of administrative levels covered by the CHS program. Thus, if office running costs are input at the district level, the Tool will assume that each district will incur the same running costs and multiply that cost by the number of districts.

49
Enter a description of the CHS program cost and program to which it relates. Then input the total number of units and unit cost per level per year. The health system level should indicate where the cost is incurred, and this will be used to multiply the unit cost. The total cost will be applied to each projection year of the program, in line with the assumptions input in the “Coverage” worksheet. Note: All transport related to management and supervision visits or trainings would be categorized as other recurrent costs.
Capital Costs
The Capital_Costs worksheet allows the user to include any costs, such as the construction of a health post or renovation of a health center that will be used to remove a bottleneck in the supply of community medicines.
First, enter a description of the capital cost or activity to be included. Next, select the year that the cost is incurred, community health program, and health system level from the drop-down menus in each cell. Input the total number of units per year and the unit cost at baseline.

50
Financing
Enter the sources of financing for the program in the Financing worksheet. These can be entered as fixed amounts in the Table 1 - “input available funds as a fixed amount” or as percentages of total required amounts in Table 2 - “Input available funds as a % of total required amount”. Note that the two methods cannot be used for the same program input. If, for example, a donor will contribute a fixed amount for equipment and the MOH will fund the balance then both amounts must be entered in the “fixed amounts” section, making sure that the two figures come to the total amount required. If the fixed amount table and the financing percentage table are both used, the tool will assume that the percentage entered is the percentage of the total amount needed and not the total less the fixed amount entered and the tool will show an excess of funding.
1. Input committed funds as a fixed amount This section should be used for funds that are committed as fixed amounts per year, and relate to a specific community health program components (such as medicines or supervision). First, input the source of financing. Then, indicate the program input covered from the drop-down menu. Next, enter the amount of funding per financing source per program year. When using this method, the total funding may be less than the total need and then the balance will be shown as a funding gap in Table 4 of the Financing worksheet.

51
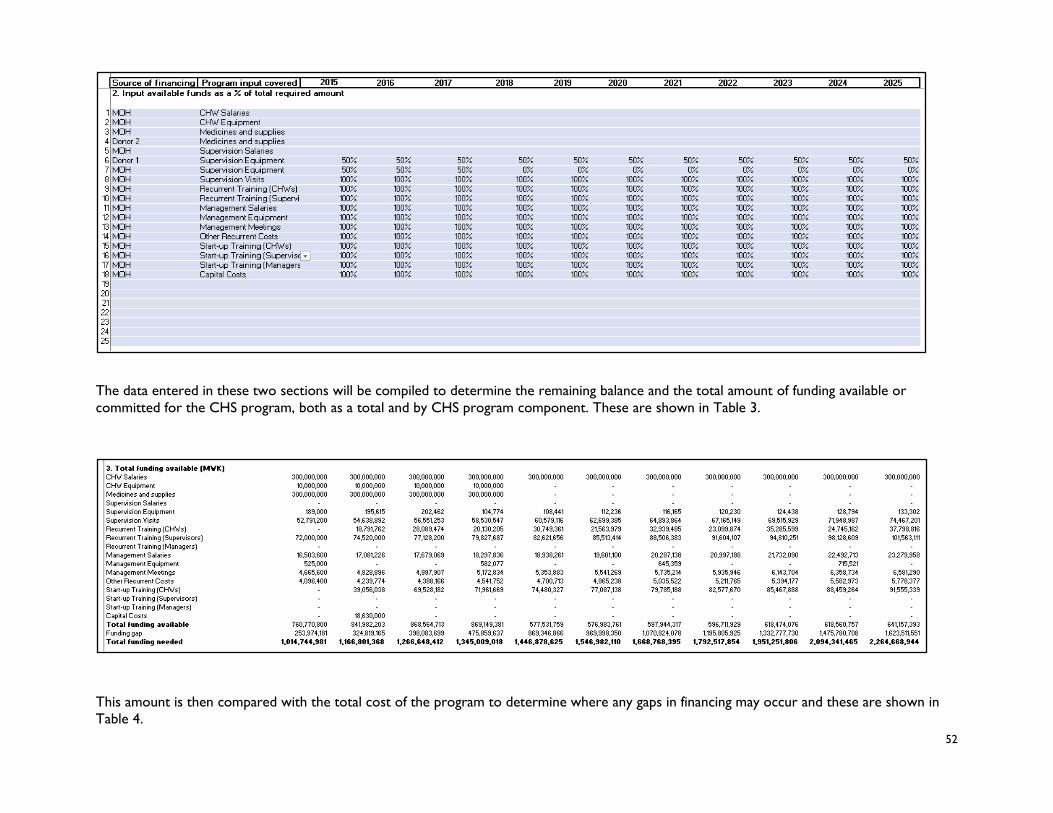
2. Input available funds as a percentage of total required amount Funding is entered in this section as a percentage of a specific community health program component. This section should be used for funding that can be linked directly to the type of cost and can vary with the total of that cost. For example, if the government will pay all management salaries the Government should be selected as the funding source. If there are two funding sources then both should be entered percentages shown for both. If the two percentages sum to 100% then the component will be fully funded, if they come to less than 100% the balance will be part of the funding gap. First, input the source of financing. Then, indicate the program input covered from the drop-down menu. Next, enter the percentage of funding per financing source per program year. If there are two funding sources for a program element enter them both separately. If the total percentage for a particular element is less than 100% the balance will show in Table 3 as a funding gap. Note that the total percentage for any program element should not exceed 100%.
52
The data entered in these two sections will be compiled to determine the remaining balance and the total amount of funding available or committed for the CHS program, both as a total and by CHS program component. These are shown in Table 3.
This amount is then compared with the total cost of the program to determine where any gaps in financing may occur and these are shown in Table 4.

53
A summary of the funding by source and the total funding gap is provided inTable 5.
Standard Treatment Guidelines
Input the standard treatment guidelines for each service in the CHS package on worksheets STG1-STG10. The names of the services will automatically be filled in based on the data entered on the Package worksheet.
First, input the “Time Required for One Full Service Including Follow-Up” in minutes for each of the interventions provided by the CHW. This time includes the initial visit (diagnosis and initial treatment) as well as the time it takes for a follow-up, if applicable.
Next, select each medicine or supply that is required for one treatment using the drop-down menu in column B. Note: never input a drug name directly into column B of the “Interventions” worksheet; always use the drop-down menu. Any changes to the medicine name should be made on the “Medicines” worksheet. Once the selection has been made, the unit cost should automatically populate in column H.

54
Input the number of times per day each medicine is administrated, the total number of days for the regimen, and the units per dose. This should be inclusive of medicines provided to take after the initial visit by the CHW. Note: ensure that the units per dose are in accordance with the unit cost entered in the “Medicines” worksheet.
Input the % of cases treated – this is for medicines that are given to only a subset of cases, or can be used to indicate different dosages based on weight or age.
Once all the information has been entered correctly, the “Total units” and “Total cost” columns should automatically populate. Repeat the data entry for all the remaining services in the community health package.
5. Results Worksheets The Results worksheets display the key results of the analysis. First, the Results-Graph worksheet provides visual data from the key results of the Tool. The Results-Tables worksheet show the key results in detail in tabular format. The Cost_per_Service breaks down results specifically related to the interventions from the Package worksheet. The Results_for_LiST provide the user with the inputs necessary to conduct an impact analysis in the LiST tool. Medicines_Quantification details the number of units required per each medicine and supply per year.

55
All results in the Tool are automatically generated and do not require user input. Any error messages in the results worksheets may indicate incorrect or insufficient data entered into the Tool. Note: do not change any formulas, add or delete rows or columns, or disrupt the results worksheets in any way.
All results will be displayed in the currency selected on the Program_Data page in row 15, “View results in” selection. The currency can be toggled between USD and another currency, such as the local currency used for data entry in the tool. Results will update automatically based on the selection.
Summary Tables
The Results-Tables worksheet show the detailed, comprehensive results of the costing and financing analysis, displayed in tabular format. The figures that make up these summary tables can be found in the calculation worksheets. No data is entered directly into these tables – they are populated from the Intermediate Calculations worksheets which are fed from the Data Entry worksheets. Note: do not change any formulas, add or delete rows or columns, or disrupt the calculation worksheets in any way.
Summary Graphs
The Results-Graphs worksheet show similar information contained in the summary tables, in graph form. Each graph shows the results by program year, and, where appropriate, totals or averages for the eleven years. The summary graphs include the following:
• Number of Services, by program and by category • Number of CHWs, by category • Average CHW Caseload per Week, by service (select individual service from drop-down) • Total Number of Services, by program • Cost per Capita
• The following options are provided: o Total Cost per Capita (total population): Total Program Costs (start-up + recurrent) / Total National or sub-national population o Recurrent Cost per Capita (total population): Total Recurrent Program Costs / Total National or sub-national population o Additional Cost per Capita (total population): Total Additional Program Costs (those costs incurred directly by the Community
Health Program, and which are not covered through other budgets) / Total National or sub-national population o Total Cost per Capita (population covered): Total Program Costs (start-up + recurrent) / Population covered by CHW
program o Recurrent Cost per Capita (population covered): Total Recurrent Program Costs / Population covered by CHW program o Additional Cost per Capita (population covered): Total Additional Program Costs (those costs incurred directly by the
Community Health Program, and which are not covered through other budgets) / Population covered by CHW program

56
• Cost per Service (select individual service from drop-down) • Cost per CHW
o The following options are provided: o Cost per CHW: Total Cost / Total number of CHWs o Recurrent Cost per CHW: Total Recurrent Cost / Total number of CHWs o Training and Equipment Cost per CHW o Supervision Cost per CHW
• Community Health Program Costs, by input • Community Health Program Costs, by program • Funding Commitments, by input • Funding Commitments, by source • Funding Gaps, by input
The user can display the results of the analysis in either local currency or in USD by navigating to the Program Data worksheet and selecting “View Results in USD/local currency.”
Note: Depending on categories selected on the Data Entry Worksheets, the Results Tables and Graphs may vary.
Results for LiST
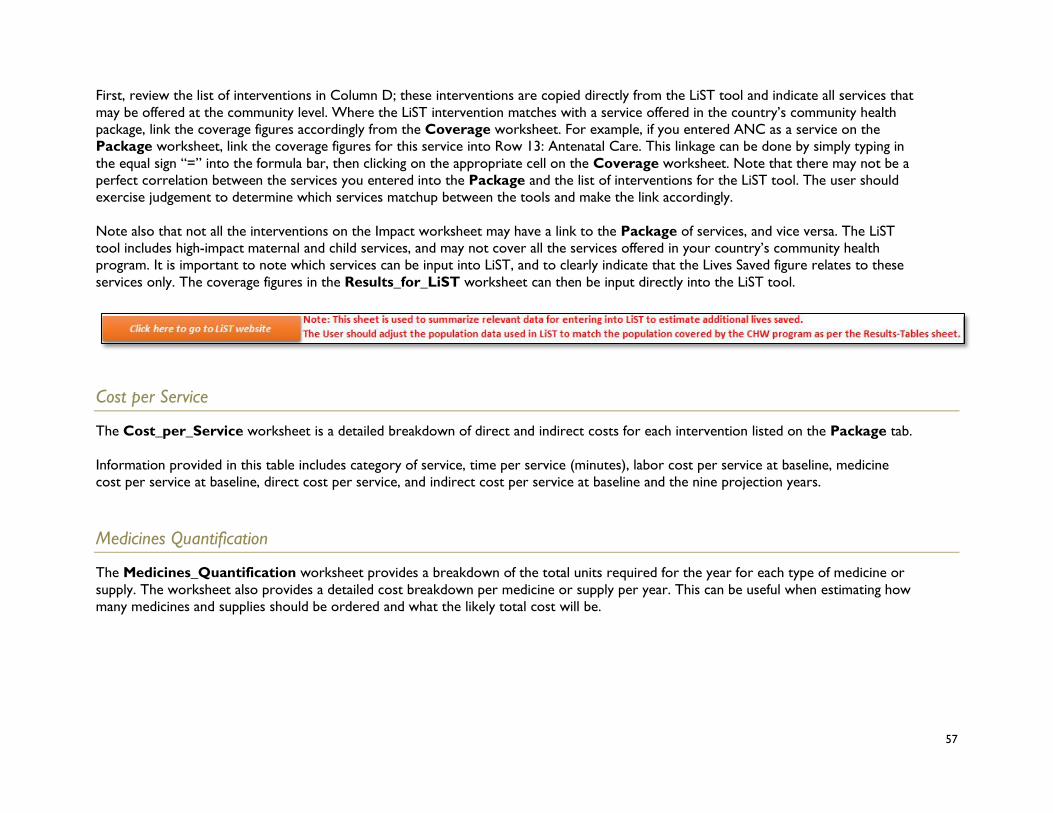
This worksheet provides a table for the user to link coverage data in the Tool to data entry into the Lives Saved Tool (LiST). For guidelines on how to use LiST, see the website at : http://livessavedtool.org/. This table does not populate automatically; it is provided to allow the user to easily show assumptions on coverage for input into LiST.
57
First, review the list of interventions in Column D; these interventions are copied directly from the LiST tool and indicate all services that may be offered at the community level. Where the LiST intervention matches with a service offered in the country’s community health package, link the coverage figures accordingly from the Coverage worksheet. For example, if you entered ANC as a service on the Package worksheet, link the coverage figures for this service into Row 13: Antenatal Care. This linkage can be done by simply typing in the equal sign “=” into the formula bar, then clicking on the appropriate cell on the Coverage worksheet. Note that there may not be a perfect correlation between the services you entered into the Package and the list of interventions for the LiST tool. The user should exercise judgement to determine which services matchup between the tools and make the link accordingly. Note also that not all the interventions on the Impact worksheet may have a link to the Package of services, and vice versa. The LiST tool includes high-impact maternal and child services, and may not cover all the services offered in your country’s community health program. It is important to note which services can be input into LiST, and to clearly indicate that the Lives Saved figure relates to these services only. The coverage figures in the Results_for_LiST worksheet can then be input directly into the LiST tool.
Cost per Service
The Cost_per_Service worksheet is a detailed breakdown of direct and indirect costs for each intervention listed on the Package tab. Information provided in this table includes category of service, time per service (minutes), labor cost per service at baseline, medicine cost per service at baseline, direct cost per service, and indirect cost per service at baseline and the nine projection years.
Medicines Quantification
The Medicines_Quantification worksheet provides a breakdown of the total units required for the year for each type of medicine or supply. The worksheet also provides a detailed cost breakdown per medicine or supply per year. This can be useful when estimating how many medicines and supplies should be ordered and what the likely total cost will be.

58
6. Illustrative Package The worksheet titled Annex1.Illustrative Package contains a list of interventions delivered by CHWs based on a technical brief prepared by UNAIDS, UNFPA, UNICEF, UN Women, WHO, and World Bank and published by WHO in 2015 titled, “Strengthening the capacity of community health workers to deliver care for sexual, reproductive, maternal, newborn, child, and adolescent health.” The package provides an illustrative list of community sexual, reproductive, maternal, newborn, child and adolescent health services as a reference.
The purpose of this worksheet is to provide the user with an example of a package of community health services and how each is categorized.
Note: This is focused on sexual, reproductive, maternal, newborn, child, and adolescent health and may not include all the community health services desired by a country
7. Calculations Worksheets Note: By default, all calculations worksheets of the Tool are hidden upon opening. In order to view these worksheets, the user
will need to unhide them through the Excel menu.
The Calculations worksheets (labelled in blue) display the breakdown of calculations from the Tool in a number of ways: Demography, Service Numbers, CHW Numbers, Supervisor Numbers, CHW Time, Medicine costs, CHW summary, Program Summary, Cost by Input, and Cost by Program.
All data on the calculations worksheets are prefilled from numbers entered into the data collection tabs and do not require user input. Note: do not change any formulas, add or delete rows or columns.
Demography
The Demography calculations worksheet breaks down the population of the nation or sub-nation given data entered on the data entry tabs, as well as the country and population databases which have been pre-entered into the Tool and populate based off of country of selection. The sheet lists important data figures such as total population, sub-national population, annual population growth rate, percent population targeted by community services, total population covered by community services, average household size, crude birth rate, and maternal mortality rate.

59
Next, the sheet displays the population broken down by category with data from the pre-filled country and population databases:

60
The sheet also breaks down demographic data by urban setting:

61
As well as rural settings:
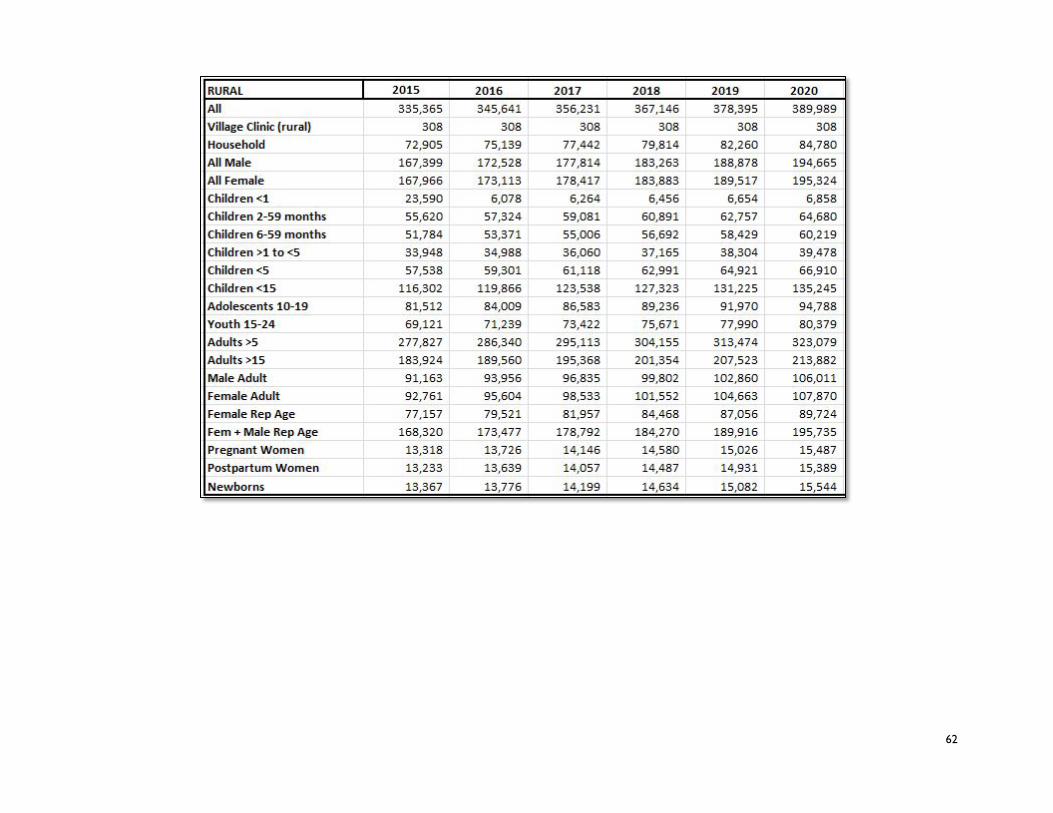
62

63
Finally, the sheet breaks down the population by age and gender:
CHW Numbers
The CHW_Numbers tab takes data entered on the CHW Categories worksheet and breaks down each category of CHW by different levels of need.
Next, the worksheet lists the number of CHWs needed nationally according to the population ratio entered on the CHW categories tab, the number of CHWs existing at the start of the year, and the number of CHWs needed to train at the start of the year in order to meet the population need. CHWs lost to attrition is calculated based off of the annual attrition rate entered on the CHW Categories tab. Finally, the Tool estimates the number of CHWs remaining at the end of the year, given attrition.

64
Note: the user can return to the CHW Categories Worksheet by following the red link in the top left corner of the sheet.
At the bottom of the worksheet, the Tool provides a summary for the numbers of each CHW category per year, as well as a summary for the number of CHWs needed to train per year for each category.
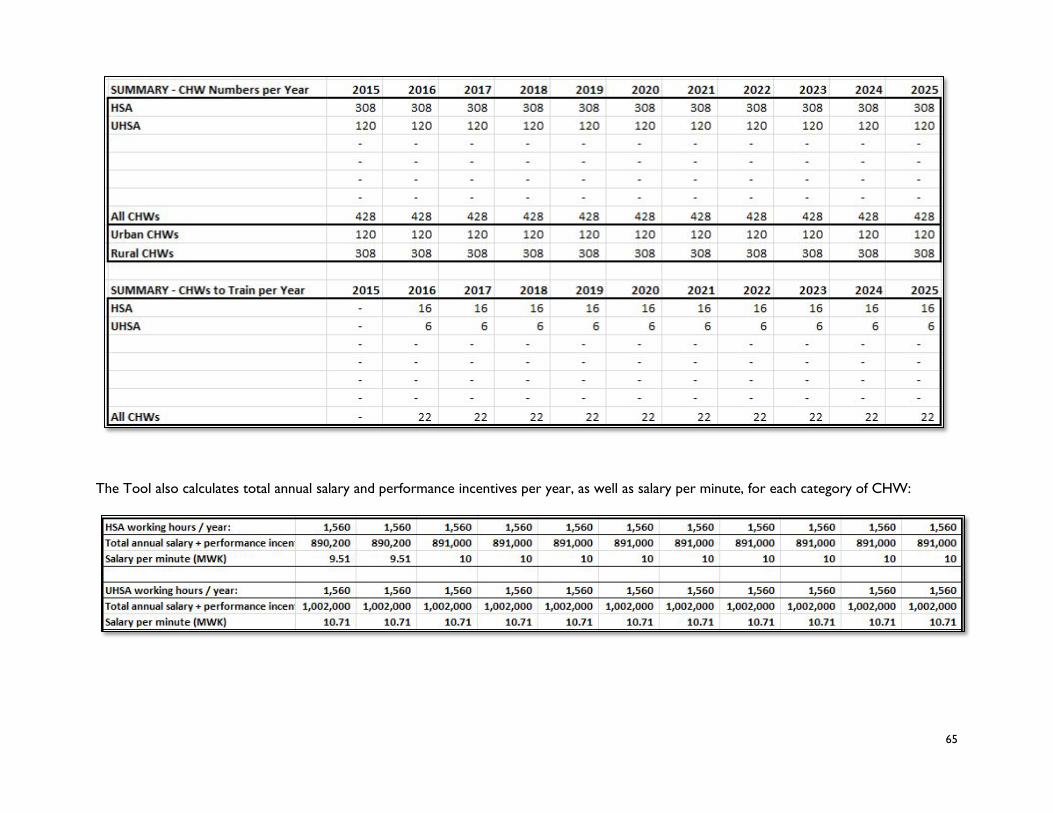
65
The Tool also calculates total annual salary and performance incentives per year, as well as salary per minute, for each category of CHW:

66
Summary STGs
A summary of all interventions entered can be found on the Summary_STG tab.
Service Numbers
The Service_Numbers calculations sheet lists all interventions provided by CHWs, with the actual number of services provided at baseline year and all projected numbers for the next ten years. Projected numbers of services are calculated from the coverage projections entered on the Coverage tab.

67
Supervisor Numbers
The Supervisor_Numbers calculations sheet is laid out in a simplified format of the CHW Numbers sheet, Calculations are available for all categories of supervisors entered on the Supervision Worksheet. As on the CHW Numbers sheet, the user is able to enter number of supervisors for all projection years. The Tool calculates the ratio of supervisors per category of CHW, given the ratios entered on the supervision worksheet. Next, the Tool calculates the total supervisors required, given the total numbers of CHWs per year. The Tool also calculates the number of supervisors existing at the start of each year and the number of supervisors to train at the start of each year.

68
Note: The user can return to the supervision worksheet easily by clicking on the red link in the top left corner of the sheet.
Finally, at the bottom of the calculation sheet the Tool provides summary tables for the supervisor numbers per year and supervisors to train per year:

69
CHW Time
The CHW_Time calculations sheet lists all services provided in the community health services package, input directly from the Package sheet. Time per service, in minutes, is prefilled from standard treatment guidelines in sheets STG1_STG10. The Tool then calculates the total time required by each CHW per service, per year for baseline and ten projection years.
Medicine Costs
The Medicine_Costs calculation sheet breaks down the cost per service listed on the Master List. For each service listed, a cost per service is calculated from data entered on the standard treatment guidelines list. Cost per service includes: CHW salary devoted to each service (calculated by salary data and time per service), cost of medicine per service (calculated from medicine cost and total units used), and the cost of any supplies or commodities needed. The Tool then calculates the total cost for each intervention, calculated by the actual number of services provided entered on the coverage tab multiplied by cost per service. Cost is calculated at baseline and for ten projection years.

70
Quantification
The Quantification sheet shows a summary of the total units for all treatments for each year, per each item on the Medicines worksheet. The example below shows the summary of Oral Contraceptives (1 month):

71
Summary CHW
The Summary_CHW sheet shows a summary of results by CHW and Supervisors with the total numbers and packages of services provided by each category of CHW. First, the sheet lists the total number of each category of CHW and CHW Supervisor per baseline and projection year:

72
Next, the Tool summarizes the CHWs per supervisor and CHW Salary per minute:
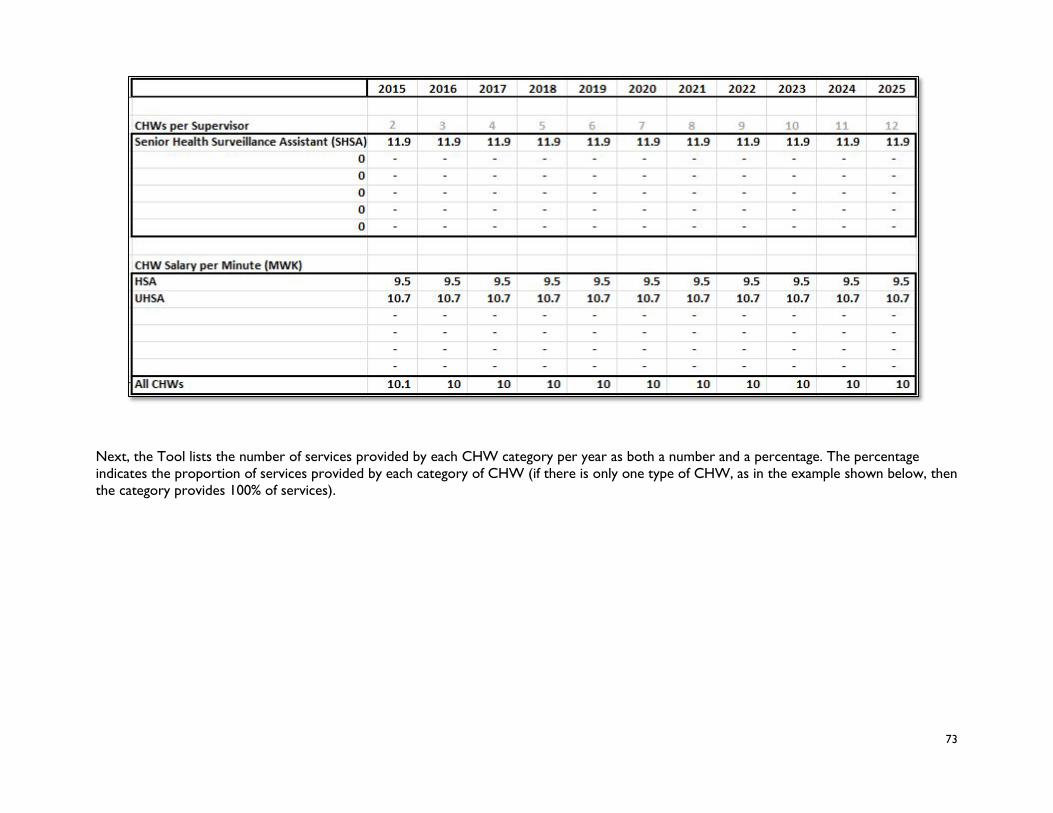
73
Next, the Tool lists the number of services provided by each CHW category per year as both a number and a percentage. The percentage indicates the proportion of services provided by each category of CHW (if there is only one type of CHW, as in the example shown below, then the category provides 100% of services).

74
The Tool also breaks down CHW time and availability spent on services. First, the Tool calculates the total time required for CHWs to provide all services in the package:

75
Then the Tool calculates the total CHW availability per year and the percentage of CHW time available spent on services:

76
Finally, the Tool calculates the average caseload per CHW per week per intervention:
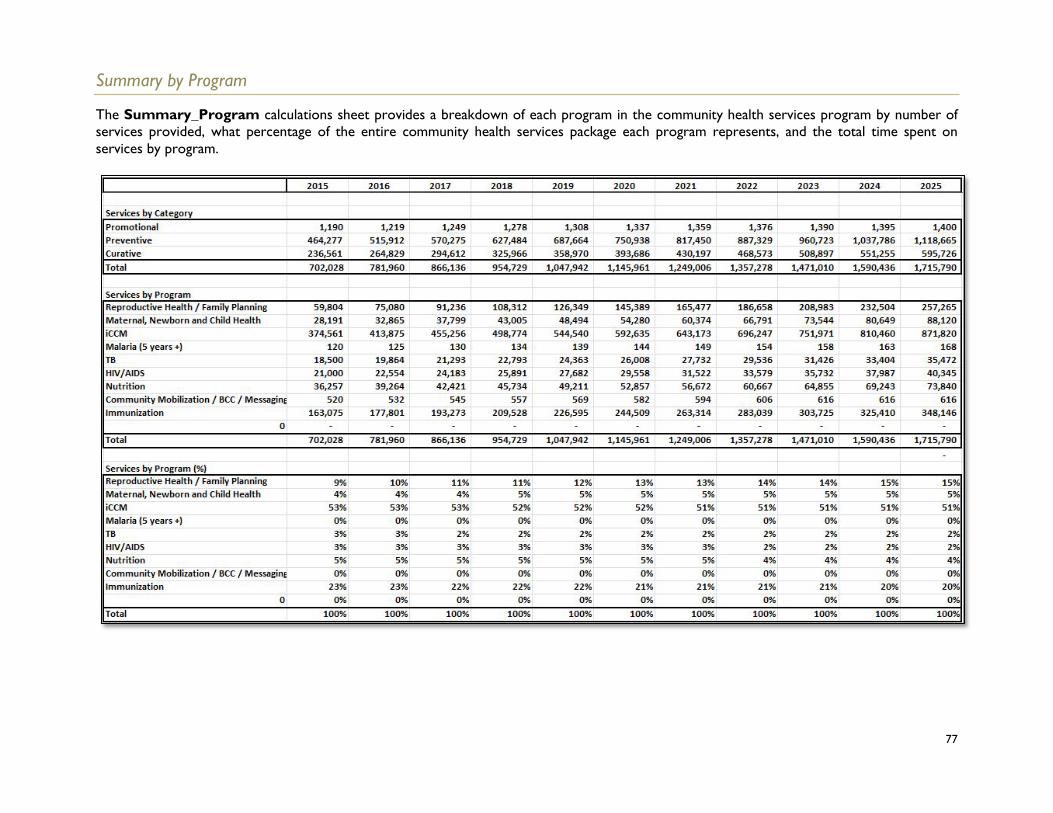
77
Summary by Program
The Summary_Program calculations sheet provides a breakdown of each program in the community health services program by number of services provided, what percentage of the entire community health services package each program represents, and the total time spent on services by program.

78
Cost by Input
The Cost_by_Input calculations sheet presents a detailed summary of the costs per input (CHW and Supervisor salaries; CHW and supervisor equipment; medicines, supplies, consumables; supervision; training; management; other program costs; and total).
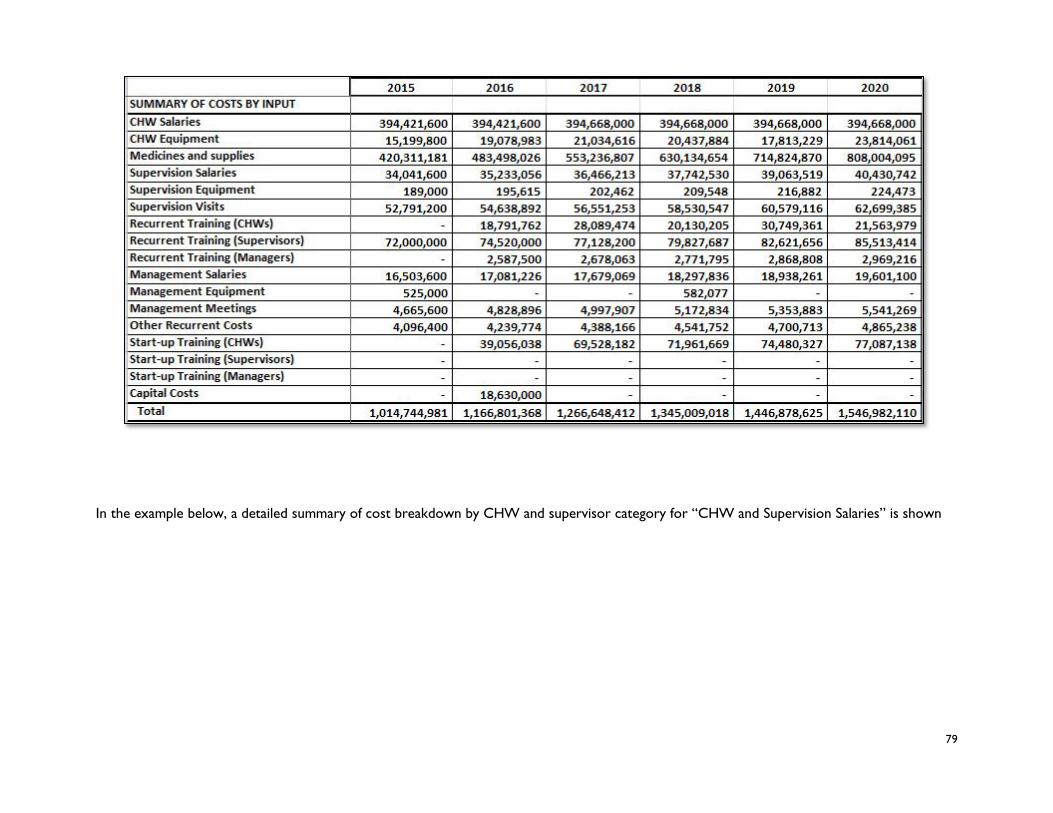
79
In the example below, a detailed summary of cost breakdown by CHW and supervisor category for “CHW and Supervision Salaries” is shown

80
Cost by Program
The Cost_by_Program calculation sheet presents a detailed summary of costs by community health program per year, as well as a detailed cost breakdown per input by program. First, the Tool presents a total summary of costs by program:

81
Then the Tool presents a detailed cost breakdown per input, by program category. In the example below, CHW and Supervisor Salaries (input) is broken down by cost per program:

82
8. Database Worksheets The Tool comes preloaded with both a Country Database and a Population Database, which contain figures that inform the population-related calculations in the Tool, including a breakdown of the population, annual population growth rate, under-five and maternal mortality rate, national currency and exchange rate, etc. Information from the databases are Reflected on the Demography worksheet. These worksheets are hidden by default and, in order to view, the user must “unhide” through Excel settings. If more update information is available (e.g. revised population breakdowns by age and sex), the user can update these figures.
Country Database
The Country_Database worksheet does not require any direct use by the user, but contains information regarding national currency, exchange rate per USD, annual population growth rate, crude birth rate, maternal mortality rate, neonatal mortality rate, under-5 mortality rate, and population breakdown by gender.
The user can view the sources for any of the information on the Country_Database worksheet by following the blue “Source” Links at the top of each column.

83
Population Database
The Population_Database worksheet also does not require any direct use by the user. All information on this worksheet has been pre-entered using the United Nations Population Division, World Population Prospects: The 2015 Revision. Data on this worksheet will be used to populate demographic and population figures throughout the costing Tool. For example, this database contains total population figures per country per year, from 1950-2015. This should be updated before using the tool in case the figures have changed. Note: In the event that the user wishes to make changes to population subgroups embedded in the tool, they are encouraged to contact the developers of the tool in order to do so. Demography figures are deeply embedded into the tool and care must be taken to make any changes.

84
References
1) Integrated Community Case Management (iCCM) Costing and Financing Tool. 2014. Management Sciences for Health, USAID, TRACTION Project.
2) Integrated Community Case Management (iCCM) Costing and Financing Tool Guide. 2014. Management Sciences for Health, USAID, TRACTION Project.
3) Modelling the Cost of Community Health Services in Malawi: the Results of Piloting a New Planning and Costing Tool. 2016. Management Sciences for Health, UNICEF Malawi, UNICEF New York.
4) Modelling the Cost of Community Health Services in Sierra Leone: the Results of Piloting a New Planning and Costing Tool. 2016. Management Sciences for Health, UNICEF Sierra Leone, UNICEF New York.
5) Community Health Services Planning and Costing Handbook: To help managers develop effective, sustainable, and comprehensive community services. 2016. Management Sciences for Health, UNICEF New York.

85