Embed Size (px)
Citation preview

1
NAR
UC
The National Association of Regulatory Utility Commissioners
Miles Keogh Sharon Thomas
NARUC Research Lab
September 2016
With support from the U.S. Department of Energy
Surface Transportation
Interdependencies & Convergence with the Power
Sector

2

3
Acknowledgements and Disclaimers
The report you are reading was created under the National Council on Electricity Policy & Energy Assurance program, a project of the National Association of Regulatory Utility Commissioners (NARUC) Research Lab. This material is based upon work supported by the U.S. Department of Energy under Award Number DE-OE0000578.
This report was authored by the NARUC Research Lab. Throughout the preparation process, the members of NARUC provided the authors with editorial comments and suggestions. However, the views and opinions expressed herein are strictly those of the author(s) and may not necessarily agree with positions of NARUC or those of the U.S. Department of Energy.
Special thanks to: Commissioner Ann Rendahl, Washington Utilities and Transportation Commission Commissioner Gladys Brown, Pennsylvania Public Utility Commission Commissioner Ellen Nowak, Public Service Commission of Wisconsin Thomas Pearce, Public Utilities Commission of Ohio The U.S. Department of Energy
Please direct questions regarding this report to Miles Keogh, NARUC’s Director of NARUC Research Lab, [email protected]; (202) 898-2200 and Sharon Thomas, Senior Program Officer, NARUC Research Lab, [email protected]; (202) 384-1572. © September 2016 National Association of Regulatory Utility Commissioners
Disclaimer: This report was prepared as an account of work sponsored by an agency of the United States Government. Neither the United States Government nor any agency thereof, nor any of their employees, makes any warranty, express or implied, or assumes any legal liability or responsibility for the accuracy, completeness, or usefulness of any information, apparatus, product, or process disclosed, or represents that its use would not infringe privately owned rights. Reference herein to any specific commercial product, process, or service by trade name, trademark, manufacturer, or otherwise does not necessarily constitute or imply its endorsement, recommendation, or favoring by the United States Government or any agency thereof. The views and opinions of authors expressed herein do not necessarily state or reflect those of the United States Government or any agency thereof.

4

5
Executive Summary
At first glance, the electric power sector – with its generating plants, transmission lines, and distribution networks – appears to have little to do with surface transportation. Similarly, roads, rails, bridges, boats, and other surface transportation infrastructures seem to have little that connects them to how we make, deliver, and use electricity. However, that sense of independence is an illusion. Transportation and power are inextricably interdependent with one another. If one of these sectors fails, it often has implications for the other. Many modes of transportation, for example, depend on electricity, and in one area – electric vehicles – the two sectors are increasingly converging with electric vehicle charging infrastructure becoming a part of transportation infrastructure and turning power into a transportation fuel.
As regulators of the power system, state Public Utility Commissions (state PUCs or Commissions) may feel that they do not need to have a very deep understanding of what goes on in the arena of transportation. However, many Commissions also have jurisdictional authority over aspects of the transportation sector. Even where overlapping authority does not exist, understanding the links between these two systems may be important in assuring reliable, affordable, vibrant, and viable service for citizens and ratepayers. This paper is written to help state regulators enhance their understanding of these connections.
The authors highlight the importance of the intersecting and interdependent nature of the electric power and transportation sectors, and show how failures to understand one sector can impede the growth – or lead to the failure – of the other sector. This paper is intended for state PUC regulators, state Department of Transportation (DOT) staff, governors, state energy and planning offices, and legislators who are involved with risk management and emergency preparedness. The primary modes of transportation discussed in this paper are rail, road, and barge. While there is also an interdependence between pipelines and electricity, pipelines are not discussed in this paper. The authors describe the regulatory entities for railways, vessels that traverse waterways,1 and roadways, and articulate rationales for why it is essential that these entities communicate regularly with electric power sector regulators.
The first section begins by explaining the interdependency between the electric power and transportation sectors and provides examples of this relationship. Next, we highlight events that can cause disruptions to the transportation or electric power sector, or both. We then provide an overview of points of vulnerability for infrastructure in both sectors. Thereafter, we show the transportation costs associated with coal as well as the modes of transportation by which coal is delivered.2 This is followed by a section on the challenges with undertaking restoration during an emergency event, as well as ways to enhance response capabilities. An explanation of how electric power and transportation reliability are managed, and the roles of various entities involved, is then provided. Thereafter, we discuss the topic of electric vehicles and ways that regulatory oversight by PUCs and state DOTs can overlap. Lastly, steps that regulators can take to address interdependencies between electric power and transportation infrastructures and the resulting challenges, is discussed. The final section of this paper includes a list of sample questions for state PUCs to ask themselves and their regulated gas and electric utilities to find out more about the nature of transportation and electric power interdependencies in their state.
1In this paper, ‘vessels that traverse waterways’ only refers to commercial vessels carrying cargo (not vessels carrying passengers) 2 Coal is the sole fuel included in the scope of this paper

6
Introduction
On August 14, 2003, a massive blackout affected much of the electric power grid in the Northeastern United States and Canada. This event was the largest blackout in North America, with 50 million people losing power,3 at least 11 deaths,4 and costs between $4 and $10 billion.5 The event, which began after high voltage power lines in Ohio brushed against overgrown tree branches and resulted in an outage, cascaded across parts of the Midwestern and Northeastern U.S., as well as Ontario, Canada.
Many of us remember signature images from that day: a satellite view of the blacked out northeastern region of the U.S. from space and a massive exodus of people crossing the Brooklyn Bridge on foot to get out of Manhattan. But why? The mass transportation system in New York City was not anywhere near that tree in Ohio. Few images better illustrate how our transportation system has become so dependent on the electric power system – and vice versa – that failures in one often result in disruptions for the other.
Disruptions to the transportation system, the power system, and/or both can result from a variety of events such as weather-related events, man-made disruptions, or system failure issues. While this discussion cannot cover every situation in which a disruption results in further disruption through the interdependence of the transportation and power sectors, it is intended to be illustrative to help regulators understand the differences between threats that are unique to each sector as well as the threats that are common to both. Knowledge about the risks to both sectors can help regulators determine where critical nodes between the two sectors exist and where resiliency investments are needed the most. A few examples of events that can damage roads and energy infrastructure, thereby causing disruptions in both sectors, include heavy rain and floods, sea levels rising due to climate change, storm surge leading to flooding, as well as arctic warming, which can lead to permafrost thaw.6 Resilience investments to mitigate risks like these can provide more bang for your buck since they pertain to both the electric power and transportation sectors. Appendix A provides further information in on events that can disrupt the power system, the electric system, and/or both - ‘Events that Can Cause Disruptions to the Transportation and Power Sectors’.
While regulators at the state PUCs, electric power system operators, and others keep a collective watchful eye on reliability in their systems, for a number of reasons the links between electric and transportation infrastructure may be overlooked. As many states are looking to increase the electrification of the transportation sector, this interdependency will become more significant. This primer highlights key points of interdependency, identifies some areas to explore for improving
3“Final Report on the August 14, 2003 Blackout in the United States and Canada: Causes and Recommendations,” U.S-Canada Power System Outage System Task Force, p.1, April 2004, http://www.ferc.gov/industries/electric/indus-act/reliability/blackout/ch1-3.pdf 4 JR Minkel, “The 2003 Northeast Blackout – Five Years Later,” Scientific American, August 2008, http://www.scientificamerican.com/article/2003-blackout-five-years-later/ 5 “Final Report on the August 14, 2003 Blackout in the United States and Canada: Causes and Recommendations,” U.S-Canada Power System Outage System Task Force, p.1, April 2004, http://www.ferc.gov/industries/electric/indus-act/reliability/blackout/ch1-3.pdf 6 Permafrost is permanently frozen soil, sediment or rock and occurs mostly in high latitudes. Permafrost covers about 25% of the Northern Hemisphere and stores large amounts of carbon. When it melts, it does not melt entirely because it consists of soil, etc., but it can shrink, swell, or cause erosion, affecting structures built on top of it. Another risk of melting permafrost is the release of stored carbon in the form of carbon dioxide and methane. Source: Energy and Environment Publishing, “Thawing Permafrost Jeopardizes Massive Maze of Russian Pipelines,” January 2013, http://www.eenews.net/stories/1059975505

7
preparedness and response in this arena, and suggests steps for regulators at the state PUCs to take action in coordination with transportation regulators and other engaged state regulatory and policy decision-makers.
Interdependency: What is it?
For years, all types of system operators have been mindful of how critical infrastructure systems are interconnected in ways where impacts to the normal operation of one system can have cascading impacts on other critical infrastructure and essential services. Affected are electric grids, fuel networks, transportation systems, water, food, finance, emergency services, telecommunications and others.
To further illustrate how this is evolving, Table 1 below shows the transportation modes that carry various types of fuels to power plants. It is often the case that a combination of transportation modes is required to get a fuel, such as coal, to power plants. To summarize Table 1: Rail transports coal, spent nuclear fuel,7 fuel oil,8 ammonia9 for selective catalytic reduction (used for pollution control at power plants), municipal solid waste,10 biomass,11 and petroleum coke.12 Barges move coal, petroleum coke,13 biomass14, municipal solid waste,15 and fuel oil.16 Trucks carry spent nuclear fuel,17 coal, biomass,18 liquefied natural gas, compressed natural gas, municipal solid waste,19 petroleum coke,20 and ammonia for selective catalytic reduction.21
7 “Transportation of Spent Nuclear Fuel,” U.S. Nuclear Regulatory Commission (NRC), October 2015, http://www.nrc.gov/waste/spent-fuel-transp.html 8“New Hampshire State Profile and Energy Estimates,” U.S. Energy Information Administration (EIA), May 2015, https://www.eia.gov/state/analysis.cfm?sid=NH 9“Transcaer Anhydrous Ammonia Training: Anhydrous Ammonia Properties,” Transcaer Hazardous Material Training, p. 5-9, http://www.transcaer.com/docs/AATour/Transcaer_Ammonia_Training_Student_Handout_rev04.pdf 10 “Waste Transfer Stations: A Manual for Decision-Making,” U.S. Environmental Protection Agency (EPA), p. 2, August 2004, http://www3.epa.gov/epawaste/nonhaz/municipal/pubs/r02002.pdf 11Salman Zafar, “How Biomass is Transported,” BioEnergy Consult, December 2013, http://www.bioenergyconsult.com/biomass-transportation/ 12 Anthony Andrews and Richard K. Lattanzio, “Petroleum Coke: Industry and Environmental Issues,” Congressional Research Services, p. 6, October 2013, http://www.nam.org/CRSreport/ 13 Michael Hawthorne, “BP Oil Refinery Waste Piles Up On Southeast Side,” Chicago Tribune, October 2013, http://articles.chicagotribune.com/2013-10-18/news/ct-met-petcoke-20131018_1_whiting-refinery-other-u-s-refineries-petcoke 14 Zafar, op. cit 15 EPA, op. cit. 16 EIA, op. cit 17NRC, op. cit 18Zafar, op. cit 19 EPA, op. cit 20 Hawthorne, op. cit 21Transcaer Hazardous Material Training, op. cit

8
Table 1: Modes of Transportation for Moving Various Fuels Types of Fuel Rail Truck Barge Coal x x x Spent Nuclear Fuel x x Fuel Oil x x Ammonia for Selective Catalytic Reduction x x Petroleum Coke x x x Liquified Natural Gas x Compressed Natural Gas x Biomass x x x Municipal Solid Waste x x x
The 2003 blackout described previously is just one example of the intricately interdependent nature of our transportation and electric power sectors. The high degree of interdependence between these systems and their infrastructure is also a major vulnerability in the sense that a disruption of service in one infrastructure system can cause failures in the other infrastructure system that relies on its service. This is known as an operational interdependency.22
Electric power outages can disrupt communications and controls across the transportation sector. Loss of power can cause traffic lights to fail, railroad systems to stop, and air transportation to be jeopardized if communication capability is lost and runways are not lit. Power outages can cause bridge failures, thereby potentially halting road, rail, or barge transportation that depend on this infrastructure capability. Subway systems and many other public transit systems require electricity to power system components and provide operational communications and management. Disruptions in the electricity system providing this service can cause transit system disruptions that range in impact depending on the cause of the electricity system disruption (e.g., if a substation in the electric power system is damaged, subway services may not be restored until the damaged substation is repaired). As the electric vehicle penetration increases, additional impacts to the transportation sector may be observed. Examples of interdependent infrastructure affected by electricity system outages:
• Bridges: The same issues can occur with movable bridges, most of which require electrical power to operate. Hurricane Katrina caused a lot of structural damage to bridges due to the direct effects of storm surge, which in turn caused flooding of electrical and or mechanical rooms of moveable bridges that caused failures of electrical systems and jamming of gear mechanisms, rendering bridges inoperable. Examples of these problems include the Portage Bridge on Hampton Road in Pass Christian and the swing bridge on US-82 at the Texas-Louisiana
22 An operational interdependency occurs when a component of one infrastructure requires services provided by another infrastructure in order to function properly (and vice versa). These operational interdependencies allow disruptions in one system to spread to others and cause cascading failures across the interdependent infrastructure. Source: Thomas C. Sharkey, Burak Cavdaroglu, Huy Nguyen, Jonathan Holman, John E. Mitchell, William A. Wallace, “Interdependent Network Restoration: Modeling Restoration Interdependencies and Evaluating the Value of Information-Sharing,” p. 1, July 2014, Rensselaer Polytechnic Institute, Troy, NY and Isik University, Istanbul, Turkey.

9
state line. Since these bridges could not be used following the disaster, recovery efforts were delayed.23
• Public Transit: Commuter railway systems are also dependent on electric power to run. Earlier in 2016, around eighty commuter rail passengers were stranded on a 50 foot high bridge. The outage was caused by an electrical wire that was severed because of a lightning strike. After waiting for two hours, passengers ended up climbing out of the trains and walking down the tracks.24
• Electric Vehicles: Although no known examples have been reported of the impact of an electrical outage on electric vehicles access to charging during an outage, this is a possible scenario that could occur unless a backup power source was available.
The transportation and electric power sectors directly depend on each other to move large amounts of fuel to a variety of industry stakeholders and to supply fuel for various types of transportation.25 Transportation of fuel to end-users such as industry — companies who sell the fuel directly to customers (i.e. gas stations or utilities that sell heating oil directly to residential customers), or companies that use the fuel themselves to generate power (i.e. electric utilities that burn coal to generate power) — can also be affected by power outages. For example, if there is a power outage that affects gas pumps (which generally require electricity for their operation), all road vehicles would be unable to refuel, including vehicles carrying fuel, and they therefore would not be able to reach industry and residential customers. As a result, public transportation and industries that require fuel for operation, may be temporarily out of service.
Emergency response situations can amplify the interdependent nature of disruptions of the electric power and transportation sector disruptions. For example, delays in the transportation sector can impede electric utility fleet movement as part of a mutual aid26 network during an electric power sector emergency response effort and lead to delays in electricity system restoration. In such cases, when electric utility fleets are called upon for help, they can experience delays — sometimes as long as 12 hours — at toll and or weigh stations as they try to move resources across state lines.27 This results in delayed power restoration to communities experiencing outages.28
23National Institute of Standards and Technology (NIST) “Performance of Physical Structures in Hurricane Katrina and Hurricane Rita: A Reconnaissance Report, NIST Technical Note 1476, p. 117-118, June 2006, http://www.fire.nist.gov/bfrlpubs/build06/PDF/b06016.pdf 24 “RTD Train Power Outage Caused By Lightning,” 9 News, May 25, 2016, http://www.9news.com/traffic/power-loss-along-a-line-buses-in-place/213817870 25 Department of Homeland Security (DHS), “Transportation Systems: Critical Infrastructure and Key Resources Sector-Specific Plan as input to the National Infrastructure Protection Plan,” p. 3, May 2007, http://www.aapa-ports.org/files/PDFs/Transportation%20SSP.pdf 26 Mutual aid refers to voluntary partnerships among utilities, where they can request support with utility restoration from other utilities in the same mutual aid network. 27 In some cases, the delay is due to these utility crews not having the necessary licenses to travel through non-affected states. 28 This issue was discussed at a meeting convened in Washington, D.C. by Edison Electric Institute and the National Association of Fleet Administrators on 05/18/2015, along with representatives from the National Governors Association, the National Association of Regulatory Utility Commissioners, utility companies, the National Rural Electric Cooperative Association, and the District of Columbia Homeland Security, Emergency Management Agency, and the All Hazards Consortium. A potential solution that this group discussed and would like to move toward to address this problem is to develop a single vehicle identifier, such as a hang tag, that provides automatic

10
Additionally, during restoration, challenges can be faced as a result of energy and transportation sector disruptions. For example, after Super Storm Sandy, electricity was needed to pump water out flooded subway stations in Manhattan. During an electricity system outage, the transit system pump systems may require, as they did in this case, the use of a portable generator which must be transported to the pump system location to provide the necessary power. If there is a transportation disruption that impedes the ability to deliver the portable generator, this can delay restoration efforts.
Finally, energy assurance planning should recognize the interdependent relationships between the transportation and power sectors. Understanding the interdependent nature of electric power and transportation sector disruptions can inform planning for contingencies. The State Energy Assurance Guidelines report by NASEO and NARUC in 200929 explains that a coal-fired power plant is generally dependent on rail or water-borne shipments, and that a disruption to either could result in reduced power production.30 Under such circumstances, other resources may be needed to compensate for the reduction in electricity generation and/or alternative transportation methods may need to be employed to deliver the fuel to the generator.
Addressing Interdependent Disruptions between Power and Transportation Infrastructures
There are many critical points of interdependency between certain transportation and power systems. As these infrastructures become increasingly interdependent due to growing system complexity and technologies, this complicates management and maintenance of service across both sectors even more. Proactively managing our critical infrastructure is essential for both economic and national security. So what is a state PUC regulator to do? The first part of taking action involves understanding the landscape. Understand your authority to act and ask questions in both the transportation and electric power sectors. Even when your transportation-sector authority is limited, you can explore the issue within your state PUC to determine if there is room for further inquiry that can lead to productive improvements. Consider and evaluate alternatives that obviate bottlenecks and improve system restoration. Additionally, if your state PUC regulates either the electric power or transportation sectors, or both, work to understand the convergence of these sectors and define the respective roles of your state PUC, the electric utilities, and state transportation agencies, and establish coordination and communication protocols to guide response activities when disasters strike. Additionally, you should also understand how the state transportation agency’s plans and procedures fit into your state’s overall emergency structure and plans.
The other part involves creating partnerships, reaching out, and communicating with other stakeholders. Engage proactively with power companies by asking questions about their systems’ dependence on rail, road, and waterborne traffic for delivering fuels, waste, critical supplies, and for emergency restoration. Understanding problems can help lead towards constructive solutions. Additionally, maintain regular communication with your state’s Department of Transportation (DOT) on
operating authority to allow all electric utility vehicles to cross state lines prior to, during, and after support of an emergency restoration event. 29 National Association of State Energy Offices (NASEO) and NARUC, “State Energy Assurance Guidelines,” December 2009, http://www.naruc.org/Publications/State_Energy_Assurance_Guidelines_Version_3.1.pdf 30NASEO and NARUC, p. 75

11
these issues and consider joint understanding of each other’s emergency situation responsibilities BEFORE something goes wrong. Work with partners in-state and across state lines to understand, and if needed, take action to improve the operation and preparedness of your states’ electric systems as they relate to the transportation sector.
A cornerstone of effective emergency preparedness matters is ongoing information sharing between the public and private sectors. Both the transportation and electric power sectors require an effective and efficient process for receiving, analyzing, and disseminating threat and situational awareness information when there is a cyber or physical threat. Resources that can provide such information include: National Cybersecurity and Communications Integration Center (NCCIC),31 your state Fusion Center, and Information Sharing and Analysis Centers (ISACs) specific to critical infrastructure sectors. Additionally, your state emergency management agency may offer training and drills to help with preparedness for emergencies, and can also coordinate mitigation and response efforts in emergency situations.
At the Federal level, numerous information sharing channels provide public and private stakeholders with classified and unclassified briefings, assessments, and summaries. Stakeholders may report security concerns, safety issues, and suspicious incidents to the Federal Government through a number of hot lines or tip lines, such as: National Highway Traffic Safety Administration Hotline, USCG National Response Center Hotline, the “If You See Something, Say Something™” Campaign phone line, etc.
Cyber-based technologies in both the transportation and electric power sectors offer benefits including better operational controls and improved customer service. Consequently, transportation companies are increasingly dependent on cyber systems for business, security, and operational functions. Cyber technologies upon which transportation services rely include positioning, navigation, tracking, shipment routing, industrial system controls, access controls, signaling, communications, and data and business management. These technologies are often interconnected through networks and remote access terminals, which may allow malicious actors easier access to key nodes. Previously mentioned resources such as the NCCIC, state Fusion Centers, and ISACs can provide resources to help in the event of a cyber attack.
Where should I look for vulnerabilities?
A reader might think that our nation’s transportation infrastructure has a broad enough network that a bottleneck or a single point of failure would not cause much disruption. After all, if one highway closes, drivers can just use another road. However, barge and rail routes do not offer as many alternatives. As a result, the concept of reducing single points of failure in transportation varies among modalities, and well-understood redundancy and diversification techniques from other regulated sectors may not translate as well.
Ports Ports can potentially be a point of vulnerability if they serve as LNG terminals or fuel import or export terminals, and traffic delays at ports that import and export fuel can result in delays of fuel deliveries. Railways
31More information about the NCCIC is online at https://www.us-cert.gov/nccic; resources for fusion centers are on the web at http://www.dhs.gov/state-and-major-urban-area-fusion-centers

12
If primary rail routes are not possible to use, finding alternative routes to deliver essentials by rail can be difficult because there simply are not as many rail lines as there are roads, for example. If, for instance, a supply of ammonia for selective catalytic reduction does not reach a coal plant on time, and the plant does not have additional ammonia on-site as a backup, the plant could be at risk of non-compliance with air regulations and as a result may need to temporarily halt operations. Securing rights of way for long distances can be very challenging.
Bridges Bridges are a transportation infrastructure that is sometimes closely linked with the power sector. Such bridges are a point of vulnerability when they carry pipelines and power cables because if there is a bridge failure, this will disrupt the transport of fuel to the power sector. Pipeline bridges are used to run pipelines carrying fuel across bridges. These bridges are used for carrying liquids or gases across them when traffic bridges are not possible to use for reasons such as being unavailable for public use for safety and security reasons. An example of this is the Trans Alaska Pipeline, which is carried by bridges over 13 river crossings.32 In the event that there is an issue with pipeline bridges, this can cause supply disruptions in the power sector.
Other methods may be available through siting and planning tools like co-locating infrastructure, which are beyond the scope of discussion for this paper.
How can I plan for and respond to system disruptions?
Following a disaster, utility crews need to get into areas to conduct search and rescue, and to restore power, among other post-emergency activities, but sometimes these areas are blocked by fallen trees, transformers, communication cables, utility poles in roads, or the roads themselves are damaged, thereby blocking access to disaster or rescue sites. In addition to utility crews, contract tree crews are often necessary for restoration after a major storm. Some tree crews are teamed with utility crews and accompany them to each job site. Other tree crews work independently with a guide and clear trees ahead of utility crews when energized conductors or other safety issues are not a concern.33 Who goes first – the road crews or the power crews – depends on the situation at hand. The power system is very dependent on transportation systems to restore power after an outage. NARUC authored a paper on mutual assistance that was released in November 2015,34 which elaborates on the key role that transportation plays in the restoration process.
As an example, in 2001 a 6.8 magnitude earthquake that lasted about 45 seconds was centered under the Nisqually delta hit the Seattle-Tacoma-Olympia area, injuring about 400 people and causing major damage.35 Bridge supports cracked; roads and highways were damaged - mostly due to liquefaction and landslides; and there was minor damage to Washington State Ferries' headquarters building. The earthquake disrupted Amtrak’s train service between Portland and Seattle as well as another line
32Public Broadcasting Service, “Pipe Designs,” Date Retrieved: August 2015, http://www.pbs.org/wgbh/amex/pipeline/sfeature/safety_guide_1.html 33 “Preparation For and Response To Hurricane Irene,” Commonwealth of Virginia State Corporation Commission, p. 12, April 2012, https://www.scc.virginia.gov/comm/reports/irene_pue.pdf 34 Online at http://www.naruc.org/Grants/Documents/NARUC%20RMAG%20Paper%2011_2_2015.pdf 35 U.S. Geological Survey, “Historic Earthquakes,” Earthquake Hazards Program, http://earthquake.usgs.gov/earthquakes/eqarchives/year/2001/2001_02_28.php

13
between Seattle and Los Angeles.36 Immediately after the earthquake, 200,000 customers in South King, Pierce, and Thurston counties lost power. Within six hours, only 8,000 customers remained without power. No damage was reported to the electrical power generation and distribution systems.37 In Seattle, cargo handling was briefly suspended until inspections were completed and showed no damage. In areas with soft soils, there were sand boils,38 lateral spreading, and water line breaks, but none of these interrupted service.39 The total cost of seismic upgrades and repairs came to $4 billion.40
Another example is when Hurricane Irene hit the Northeastern part of the U.S. in 2011. More than seven inches of rain fell in Vermont over two days, washing out hundreds of miles of roads and bridges across the state.41 Massive flooding, stretches of missing roads, downed power lines, and debris were scattered in the streets, which led to a lot of detouring. The storm caused severe damage to Vermont’s transportation infrastructure. More than 200 miles of state-owned rail was damaged and 146 state road segments and 34 bridges were closed, and of locally maintained assets, 2,260 road segments and 289 bridges were affected when 963 culverts were damaged, destroyed, or blown-out.42 The extensive damage made it difficult for crews to perform restoration work, so this was a very slow process. Staging crews before disasters such as this one hit, can help to quicken response time after threats have passed. In the case of Hurricane Irene, prior to the hurricane touching ground, power companies began their standard preparations of pre-positioning repair crews, equipment, and supplies and bringing in mutual assistance workers so that once the storm abated and winds were low enough, workers could begin restoring power to customers immediately.43 Mutual assistance is a noteworthy resource that can facilitate the restoration process by helping to identify available, shareable resources and coordinate the dispatch of them across utilities, to where they are needed. When disaster strikes, as illustrated with these examples, it is important for crews to be able to access disaster sites such as by clearing roads or other areas to allow for safe entry. What other options do we have to get around this? Drones are being increasingly used in the utility and transportation sectors to conduct safety inspections. The Federal Aviation Administration approved five hundred commercial drone exemptions around the country since 2013. Aerial safety inspections have been done for flare stacks, power plants, pipelines, bridges, railroads, power lines, oil rigs and possibly wind turbines in the near future.44 Likewise, drones could hold potential for search and rescue, and damage assessment efforts following severe events. In June 2015, emergency responders used a drone to track a flood in
36 Cascadia Region Earthquake Working Group (CREW), “Cascadia Deep Earthquakes 2008,”, p. 15, 2008, http://www.crew.org/sites/default/files/CascDeepEQweb.pdf 37CREW, p. 15 38 A sand boil is sand and water that come out onto the ground surface during an earthquake as a result of liquefaction at shallow depth.(source: USGS Earthquake Glossary, http://earthquake.usgs.gov/learn/glossary/?term=sand%20boil) 39CREW, p. 15 40CREW, p. 2 41Justin B. Clancy and Jessica Grannis, “Lessons Learned From Irene: Climate Change, Federal Disaster Relief, and Barriers to Adaptive Reconstruction,” Georgetown Climate Center, pg. iii (executive summary), December 2013, http://vem.vermont.gov/sites/vem/files/Lessons%20Learned%20From%20Irene%20-%20Final.pdf 42Clancy and Grannis, p. 2 43 “Preparation For and Response To Hurricane Irene,” Commonwealth of Virginia State Corporation Commission, p. 1, April 2012, https://www.scc.virginia.gov/comm/reports/irene_pue.pdf 44Dan Gettinger, “The Drone Exemptions,” Center for the Study of the Drone, April 2015, http://dronecenter.bard.edu/the-drone-exemptions/.

14
Texas in real-time.45 This, and other remote sensing capabilities, is an area where the transportation and power systems begin to converge. Interdependence of Power and Transportation Reliability
Reliability is a critically important issue for state PUCs, and the power sector and transportation sector depend on one another extensively enough that failures of one often profoundly impact the other. However, the way that regulators assure reliable service differs between the transportation sector and the electric power sector, as detailed in this section. Reliability Management in the Power Sector
The North American Electric Reliability Corporation (NERC) develops reliability standards for the bulk power system in North America. NERC, along with its regional reliability coordinators (i.e., Southwest Power Pool, Florida Reliability Coordinating Council, Midcontinent Independent System Operator, etc.) enforce reliability across the country. Electric utilities have reported measures of reliability, such as the frequency and duration of power disruptions, to the state PUCs for many years.46 Practices among utilities for collecting and reporting such information, however, does vary and this sometimes creates challenges for assessing reliability.47 Commissions are also involved with managing reliability issues when it pertains to judging whether or not a reliability investment is worth pursuing. State PUCs make this evaluation by using formulas that weigh the costs of outages to utilities against the costs of investments that avoid or minimize outages. Commissions are also tasked with deciding if the Commission’s approach to evaluating resilience48 (the ability to avoid or minimize service disruptions and recover, measured by frequency and duration of outages) will distinguish between customer classes as well as within customer classes, while also balancing costs with minimized outage durations. Additional factors that state PUCs take into account are the duration of outages, the scale of outages, and the value of lost load.
Reliability Management in the Transportation Sector
Where Commissions have the power to manage and regulate power reliability issues in their states, it may be more challenging for their oversight to extend into the interdependencies with the transportation sector. At the federal level, the U.S. Department of Transportation (U.S. DOT) develops and enforces federal regulations governing roads, highways, airports, railways, pipelines, and seaports. Reliability in the power sector influences reliability in the transportation sector and vice versa (since in cases where the two sectors are interdependent, failures or outages in one sector can have cascading effects on the other). As a result of this relationship, it is crucial that the federal agencies communicate with state agencies on reliability issues that span both sectors.
45 Melissa Crowe, “Texas Flood Tests Use of Drones by Emergency Responders,” Emergency Management, June 2015, http://www.emergencymgmt.com/disaster/Texas-Flood-Tests-Drones-Emergency-Responders.html. 46 Joseph H. Eto and Kristina Hamachi LaCommare, “Tracking the Reliability of the U.S. Electric Power System: An Assessment of Publicly Available Information Reported to State Public Utility Commissions,” Ernest Orlando Lawrence Berkeley National Laboratory, p. xi, October 2008, https://emp.lbl.gov/sites/all/files/REPORT%20lbnl%20-%201092e.pdf 47 Eto and Hamachi LaCommare, p. 29 48Miles Keogh and Christina Cody, “Resilience in Regulated Utilities,”NARUC, p. 5, November 2013, http://www.naruc.org/Grants/Documents/Resilience%20in%20Regulated%20Utilities%20ONLINE%2011_12.pdf
15
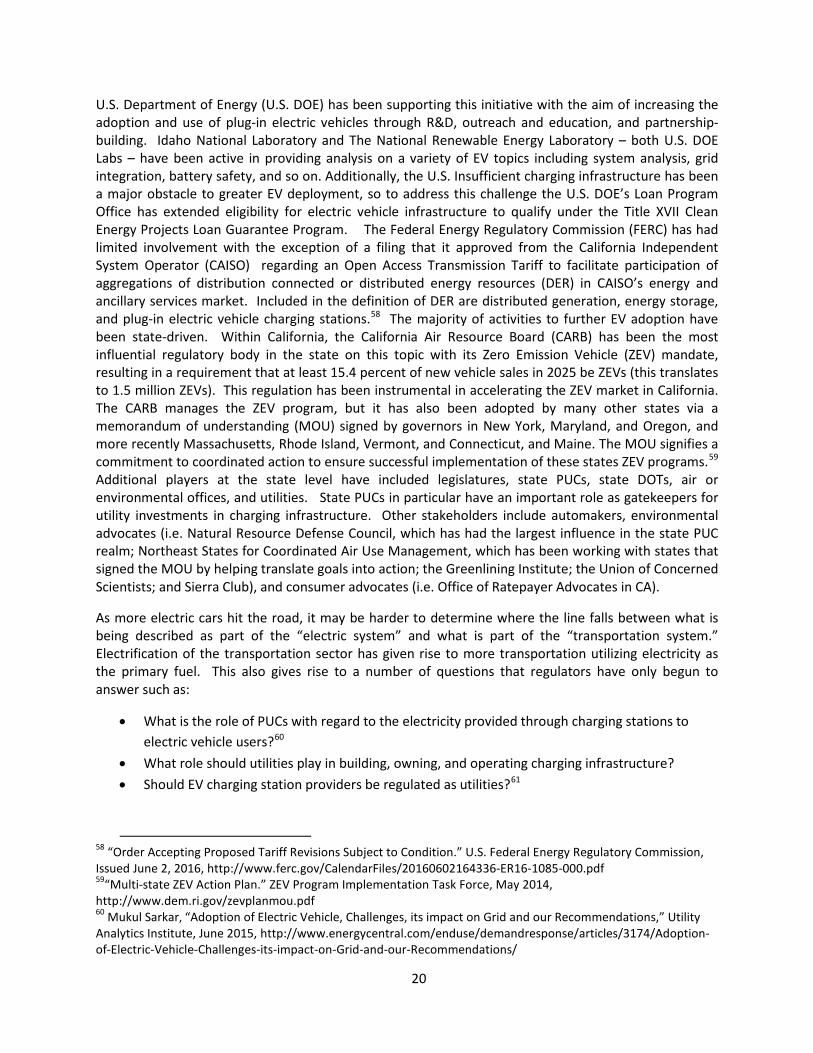
Transportation authority over intrastate rail, road, and barge varies from state to state across the U.S. Often, regulatory jurisdiction over transportation lies within the state PUC, or the state DOT, or another state agency, or some combination of these entities. NARUC contacted state PUCs across the U.S. and found that the extent to which, if at all, state Commissions regulate intrastate rail, road, and barge transportation varies greatly. By way of overview:
• there are twenty-four state PUCs that do not regulate rail, road vehicles, or barge transportation;
• seventeen of them regulate some aspects of both rail and road vehicle transportation; five regulate some aspects of rail (but not road vehicles or barges at all);
• four regulate some aspects of road vehicles (but not rail or barges at all); and • one state PUC regulates barge transportation along with road vehicles within state borders.
For more detailed information, see Appendix B.
Examples of state DOT reliability regulation are drawn from Minnesota and Iowa. In Minnesota, at the state level, the Office of Freight, Railroads and Waterways (OFRW) deals with track repair and removal, accident reports, and railroad/traffic signals among other things. OFRW is part of the Minnesota Department of Transportation, the Office of Freight, and Commercial Vehicle Operations. At the local level, regulatory powers are rather limited. They include: (1) special assessments, which cities use to collect the costs improvements that will benefit railroad property; (2) property taxes – cities can collect property taxes from railroad property, but the valuation of the property is usually done by the state; and (3) zoning – cities can enforce their zoning regulations against some types of property owned by railroads.49 In the case of Iowa, the state DOT has minimal regulatory jurisdiction over rail operations or services. The department participates in the Surface Transportation Board (STB) abandonment50 process as needed and voices the state’s views during STB and Federal Railway Administration (FRA) rule-making. Generally, complaints about railroads are either resolved with coordination assistance from the Iowa DOT or through a formal contested case process involving the Iowa Department of Inspections and Appeals.51
The State Energy Assurance Guidelines52 report by NASEO and NARUC discusses guidelines that are important precursors for effective planning that also enhance the resiliency of our response capability. The goal of energy assurance planning is to achieve a robust, secure, and reliable energy infrastructure that is also resilient (meaning it can restore services rapidly following any disaster). State and local officials are responsible for working with energy providers and stakeholders from other jurisdictions, government agencies, businesses, and related organizations, to reduce the consequences of severe events, assure public safety, and provide for rapid recovery.53
49 “Information Memo: Railroads and Cities,” League of Minnesota Cities, p. 2-3, January 2015, http://www.google.com/url?sa=t&rct=j&q=&esrc=s&source=web&cd=8&ved=0CE4QFjAH&url=http%3A%2F%2Fwww.lmc.org%2Fmedia%2Fdocument%2F1%2Frailroadsandcities.pdf&ei=KpA6VcrbDoX9oASJg4HYDA&usg=AFQjCNFSb9CONZvh2R1a-suC41vadH0ofQ&sig2=eJRV3_UbIY0LakmVzO445g&bvm=bv.91665533,d.cGU&cad=rja 50 Abandonment refers to cases where a railway is no longer used for transportation. The land and materials of an abandoned railway are sometimes repurposed for uses such as bicycle/pedestrian trails, or parks. 51 Iowa Department of Transportation, Web, Date retrieved: July 2015, http://www.iowadot.gov/iowarail/railroads/regulatory/whoregulates.htm. 52NASEO and NARUC, p. 2. 53 “Energy Assurance Planning,” NASEO, Web, Date retrieved: August 2015, http://www.naseo.org/energyassurance.

16
Examples of Interdependence: Coal
Coal – Implications of Transportation and Electric Power Sector Interdependence
Coal travels by all three modes of transportation focused on in this paper – rail, road, and barge – but a large percentage of it is moved by railroad alone, which presents a vulnerability. Figure 1, below, shows that rail accounts for around two thirds of coal shipping, whereas river barges each carry around a tenth of total coal. This high percentage of coal coming by rail means that if there was a failure in the rail system, much of our coal would not be delivered, and plants with low on-site stockpiles might need to halt operations or find alternative transportation.
Figure 154
Note: Sum of components may not equal 100% because of independent rounding. Other includes Pipeline, Other Waterway, Great Lakes Barge, Tidewater Pier, and Coastal Ports. Data for 2013 are preliminary. Intermodal transit uses multiple modes of delivery. Intermodal rail includes some movement over railways, whereas intermodal nonrail signifies multiple modes that do not include railway.
Moving coal by rail remains a huge link between power and transportation, and this link creates an interdependent vulnerability for power – interruptions of supply may mean interruptions of power. The Energy Information Administration reported55 that in 2013, power plants consumed 858 million tons of coal - 93% of all coal consumed in the United States. With fewer mine-mouth power plants, coal-by-rail is more dominant in the Eastern Interconnection footprint. The eastern portion of the U.S. has greater numbers of small coal mines, most of the country's coal-fired power plants, and more, smaller rail lines. By contrast, although there are fewer rail routes that handle coal, the western portion of U.S. coal mines are usually larger, and its rail routes handle large amounts of coal.
Transporting large amounts of coal over long distances by barge is the most cost-effective mode of transport, but waterway access is often limited. Transporting coal by rail is more expensive than by
54 “Coal Shipments to the Electric Power Sector by Transit Mode and Year,” EIA, Form EIA-923 Power Plant Operations Report, June 2014 http://www.eia.gov/todayinenergy/detail.cfm?id=16651; see also “Amount of Coal Carried by Rail, Road, and River Barge between 2008 and 2013,” EIA, Date Received: May 2015. 55 Ibid.

17
barge, but extensive railway networks linking the Powder River Basin (Wyoming and Montana), the Illinois Basin, and Central and Northern Appalachia to the rest of the country make it possible to consume coal from plants without navigable waterway access. Only coal plants relatively close to a coal mine depend on trucking to transport their fuel because of the higher cost of this mode of transport on a per-ton-mile basis. Those plants that are located directly at or very near a mine can also have their coal delivered by conveyor, but taken together, truck, barge, and conveyor movements make up less than 30% of the coal shipments in the country.56
Reliability and planning for fuel adequacy is not a coordinated function between the power and transportation sectors on a sector-wide basis; this vacancy remains an institutional barrier to addressing the vulnerability.
Key questions for Regulators:
How do you manage reliability issues in the power sector that either affect or are affected by the transportation sector?
How susceptible is your power supply to transportation disruptions, and vice versa?
Do you have a backup plan for power if bridge, rail or barge transportation is disrupted?
56 Ibid.

18
Transportation Costs Associated With Coal
Transportation costs also affect fuel costs for the power sector, especially for coal. Regulators may want to be aware of the price of fuel delivery as a component of the price of coal power if they are interested in knowing whether or not their coal utility has explored lower cost alternatives for moving this fuel. This section provides information on the transportation costs associated with moving coal for the electric power sector.
Table 2 below provides the transportation and delivered costs of coal between 2008 to 2014 by various transportation modes.
Table 2. Real average transportation and delivered costs of coal, by year and primary transport mode57 Year Average Transportation Cost
of Coal (Dollars per Ton) Average Delivered Cost of Coal (Dollars per Ton)
Transportation Cost Share of Delivered Cost (Percent)
Railroad 2008 18.71 45.59 41.04% 2009 17.56 47.91 36.65% 2010 18.90 48.50 38.97% 2011 20.63 50.27 41.05% 2012 20.96 48.87 42.89% 2013 21.27 46.33 45.91% 2014 21.24 45.85 46.32% Waterway 2008 7.22 56.86 12.69% 2009 6.74 62.87 10.71% 2010 6.78 60.63 11.18% 2011 6.67 61.50 10.84% 2012 5.74 60.43 9.49% 2013 5.77 57.67 10.00% 2014 5.96 57.07 10.44% Truck 2008 6.67 43.35 15.39% 2009 5.44 41.86 13.00% 2010 6.27 46.22 13.58% 2011 5.70 49.79 11.45% 2012 6.14 52.31 11.74% 2013 6.46 48.62 13.29% 2014 6.20 49.42 12.54% US Total[1] 2008 16.49 46.20 35.69% 2009 15.34 48.91 31.37% 2010 16.37 49.47 33.10% 2011 17.82 51.17 34.82% 2012 17.74 50.04 35.46% 2013 17.93 47.66 37.63% 2014 18.53 47.73 38.81% [1] Includes a small number of shipments in categories other than railroad, waterway or truck.
57“Real average transportation and delivered costs of coal, by year and primary transport mode,” EIA, Form EIA-923 Power Plant Operations Report, Date retrieved: August 2016, http://www.eia.gov/coal/transportationrates/pdf/table1.pdf

19
Notes: The rates were calculated by subtracting the commodity cost of the delivered coal from the total delivered cost, as reported by owners and operators of power plants with a combined nameplate capacity of 50 megawatts and above. Since the commodity cost and delivered cost data are reported in terms of energy content (i.e. million British thermal units), the costs were converted to dollars per ton using the average energy content of each shipment reported on the form. The representative transportation cost for each coal mine state, destination state and transportation mode is a weighted average. Finally, the values were converted to constant 2014 dollars by using the Implicit Price Deflators for Gross Domestic Product, as published by the U.S. Bureau of Economic Analysis in Table 1.1.9 of the National Income and Products Accounts Table.
Rates are based on primary mode of transportation. Since some shipments include a primary and secondary mode of transport, these rates do not necessarily reflect the rates associated with only one transport mode. In addition, the rates do not reflect shipments made to co-generators and other end-users of electricity and are based only on shipments made to plants in the electric power sector. EIA defined the electric power sector as consisting of electric utilities and regulated and unregulated independent power producers.
For the composition of coal basins, refer to the definition of "coal-producing regions" in EIA's glossary at www.eia.gov/tools/glossary. More information about coal transportation rates to the electricity sector can be found at: http://www.eia.gov/coal/transportationrates/
The cost of transporting coal from mine to power plant constitutes a significant part of the total cost of coal. The transportation portion of the delivered cost of coal was significantly higher when moving this fuel by rail than by waterway or truck from 2008-2014, as illustrated by the following figures:
• In 2014, coal by rail had a transportation cost share of delivered cost that was 3.6 times higher than by truck and 4.4 times more than by waterway.
• The transportation costs for coal in 2014 accounted for nearly half (46.32%) of the average overall cost of coal delivered at electric power plants
Coal is not the only fuel that creates interdependencies with transportation with reliability and cost implications. For decades, nuclear power plants have needed fuel deliveries and have generated spent nuclear fuel that needs to be disposed of appropriately. Transportation remains an important part of this consideration. However, it is too large and complicated of an issue to do justice to in the context of this paper, and may be the subject of future NARUC Research Lab exploration.
Key question for Regulators:
Is there a way to manage key transportation price risks, particularly for coal? What are the established relations between agencies responsible for transportation and power regulation in your state? Electric Vehicles
Electric vehicles (EVs) are an example of a marketplace that spans the breadth of both the electricity and transportation sectors. Within the U.S. Department of Transportation, the National Highway Traffic Safety Administration (NHTSA) is the agency that enforces safety performance standards for motor vehicles, as well as sets and enforces corporate average fuel economy standards (CAFÉ) for motor vehicles. The U.S. Environmental Protection Agency is in charge of enforcing air emissions standards. Until recently, the federal government has played a limited role in conversations about EVs and infrastructure that is needed. In 2012, President Obama launched the EV Everywhere Challenge. The
20
U.S. Department of Energy (U.S. DOE) has been supporting this initiative with the aim of increasing the adoption and use of plug-in electric vehicles through R&D, outreach and education, and partnership-building. Idaho National Laboratory and The National Renewable Energy Laboratory – both U.S. DOE Labs – have been active in providing analysis on a variety of EV topics including system analysis, grid integration, battery safety, and so on. Additionally, the U.S. Insufficient charging infrastructure has been a major obstacle to greater EV deployment, so to address this challenge the U.S. DOE’s Loan Program Office has extended eligibility for electric vehicle infrastructure to qualify under the Title XVII Clean Energy Projects Loan Guarantee Program. The Federal Energy Regulatory Commission (FERC) has had limited involvement with the exception of a filing that it approved from the California Independent System Operator (CAISO) regarding an Open Access Transmission Tariff to facilitate participation of aggregations of distribution connected or distributed energy resources (DER) in CAISO’s energy and ancillary services market. Included in the definition of DER are distributed generation, energy storage, and plug-in electric vehicle charging stations.58 The majority of activities to further EV adoption have been state-driven. Within California, the California Air Resource Board (CARB) has been the most influential regulatory body in the state on this topic with its Zero Emission Vehicle (ZEV) mandate, resulting in a requirement that at least 15.4 percent of new vehicle sales in 2025 be ZEVs (this translates to 1.5 million ZEVs). This regulation has been instrumental in accelerating the ZEV market in California. The CARB manages the ZEV program, but it has also been adopted by many other states via a memorandum of understanding (MOU) signed by governors in New York, Maryland, and Oregon, and more recently Massachusetts, Rhode Island, Vermont, and Connecticut, and Maine. The MOU signifies a commitment to coordinated action to ensure successful implementation of these states ZEV programs.59 Additional players at the state level have included legislatures, state PUCs, state DOTs, air or environmental offices, and utilities. State PUCs in particular have an important role as gatekeepers for utility investments in charging infrastructure. Other stakeholders include automakers, environmental advocates (i.e. Natural Resource Defense Council, which has had the largest influence in the state PUC realm; Northeast States for Coordinated Air Use Management, which has been working with states that signed the MOU by helping translate goals into action; the Greenlining Institute; the Union of Concerned Scientists; and Sierra Club), and consumer advocates (i.e. Office of Ratepayer Advocates in CA).
As more electric cars hit the road, it may be harder to determine where the line falls between what is being described as part of the “electric system” and what is part of the “transportation system.” Electrification of the transportation sector has given rise to more transportation utilizing electricity as the primary fuel. This also gives rise to a number of questions that regulators have only begun to answer such as:
• What is the role of PUCs with regard to the electricity provided through charging stations to electric vehicle users?60
• What role should utilities play in building, owning, and operating charging infrastructure? • Should EV charging station providers be regulated as utilities?61
58 “Order Accepting Proposed Tariff Revisions Subject to Condition.” U.S. Federal Energy Regulatory Commission, Issued June 2, 2016, http://www.ferc.gov/CalendarFiles/20160602164336-ER16-1085-000.pdf 59“Multi-state ZEV Action Plan.” ZEV Program Implementation Task Force, May 2014, http://www.dem.ri.gov/zevplanmou.pdf 60 Mukul Sarkar, “Adoption of Electric Vehicle, Challenges, its impact on Grid and our Recommendations,” Utility Analytics Institute, June 2015, http://www.energycentral.com/enduse/demandresponse/articles/3174/Adoption-of-Electric-Vehicle-Challenges-its-impact-on-Grid-and-our-Recommendations/

21
• Under what conditions should charging station providers be regulated as electric utilities?62 • Under what conditions should public utilities be allowed to own and operate charging
stations?63
Legislatures and public utility commissions in a number of states have been trying to figure out how utilities should be involved in the charging business, including Oregon, Washington, Illinois, Kansas, and Kentucky.64 Most states have used one of the three approaches: (1) not taking any action, potentially subjecting EV service providers to regulation by the state’s public utility commission; (2) affirmatively deciding that utilities may own and operate EV charging stations; or (3) exempting EV service providers from existing public utility regulations either through legislation or interpretation of statutes and regulations.65 California has also been grappling with the role utilities should play in owning EV charging infrastructure, and the California’s Public Utilities Commission (CPUC) is now set to approve proposals from all of its investor-owned utilities to invest ratepayer money in EV charging infrastructure. The pilot programs is intended to accelerate EV by providing greater certainty about the availability of public and semi-public infrastructure. Washington state, whose transportation sector accounts for half of its carbon dioxide emissions, has a goal of 50,000 EVs on the road by 2020 and is considering a bill that would encourage utilities to build EV charging infrastructure. Washington-based utility Avista recently asked the Washington Utilities and Transportation Commission for permission to install and rate-base 265 charging stations in homes, workplaces, and public locations at a cost of $3.1 million, and this decision is currently pending. Oregon – one of the largest EV markets in the country - has specific policy goals encouraging EVs, including a bill passed by the legislature that instructs the Oregon Public Utility
61 Owners and operators of charging stations, argue that the services they provide (such as access to charging equipment, use of related metering and communications software, network participation, billing, etc.) are not the same as traditional retail sales of electricity by a utility to local business and household consumers. They say they are themselves utility customers and it would be prohibitively expensive for them to comply with the extensive regulations covering public utilities. Moreover, requiring the PUC to regulate the hundreds or thousands of retail, commercial, municipal, and business owners providing public charging services would place an impractical regulatory burden on the commission itself. Some utilities and interest groups have argued that since charging station providers resell utility power, they are similar to public utilities and thus require PUC oversight to protect ratepayers and because they benefit from grid access. However, thus far, regulators and legislators have determined that providers of charging equipment and services are not public utilities. Emily Sangi, “PUCs: Are EV Charging Stations Utilities?” Advanced Energy Economy, September 2013, http://blog.aee.net/pucs-are-ev-charging-stations-utilities 62“Who Can Own/Operate a Charging Station,” Center for Climate and Energy Solutions, October 2014, http://www.c2es.org/initiatives/pev/maps/who-can-own-operate-a-charging-station. 63 Another regulatory issue is whether investor-owned utilities should be permitted to provide residential or commercial charging stations either as part of their regulated operations or as non-utility operations. At the heart of the issue is whether it is in the public interest for EV charging infrastructure to be deployed, and thus for ratepayers to shoulder the cost burden. In the traditional utility model, regulated utilities build infrastructure and recover from ratepayers the costs of that infrastructure plus a reasonable rate of return. Whether this model can or should be extended to electric vehicle charging stations is a topic of debate. Source: Sangi, supra 64 “Utility Involvement in Electric Vehicle Charging Infrastructure: California at the Vanguard.” Center for Strategic and International Studies, April 2016, https://www.csis.org/analysis/utility-involvement-electric-vehicle-charging-infrastructure-california-vanguard 65 “Electric Vehicle Charging Station Regulation: Why Your Local Electric Vehicle Charging Station Doesn’t (and Shouldn’t) Look Like Your Local Gas Station,” Pepper Hamilton LLP, June 2016, http://www.pepperlaw.com/publications/electric-vehicle-charging-station-regulation-why-your-local-electric-vehicle-charging-station-doesnt-and-shouldnt-look-like-your-local-gas-station-2016-06-23/

22
Commission to direct the state’s utilities to submit proposals for programs that accelerate transportation electrification, including “prudent investments in or customer rebates for electric vehicle charging and related infrastructure.”66
Proponents of greater utility involvement assert that the infrastructure needs to be in place in order to grow the EV market, and that utilities are the only entity that has the financial resources to build this infrastructure at the scale that is needed to meet deployment goals. It is also argued that utilities are well positioned to deal with cost and risk issues because they have access to low-cost capital (backed by ratepayers), and can also ensure investors on both the supply and demand side that there is a future market. Lastly, proponents say that utilities will need to be involved with charging infrastructure to some extent no matter what, due to the impacts of EV charging on grid dynamics and the role of utilities to manage supply and demand. Opponents to utility involvement have expressed concern about the burden of infrastructure costs falling on ratepayers where only a small group of them (those who can afford EVs) would benefit directly. There is also some concern about building out infrastructure without knowing what the EV adoption rates will be. An additional worry is that utilities will crowd out competition in the infrastructure market. There is also the possibility of unintended consequences associated with further deployment of EVs in an effort to promote energy efficiency. For example, there can be a tradeoff between the energy efficiency improvements made with increased EV use, and the resulting increase in electricity load that comes from electrifying the transportation sector. In states that want to promote both energy efficiency and EVs, they need to figure out a way to offset any increase in energy consumption. Utilities in states such as California offer special rates for plug-in EVs that take advantage of off-peak electricity and can save consumers much money, such as time-of-use rates.67 Lastly, having more EVs on the road and less gasoline consumption, can lead to lower budgets for transportation infrastructure maintenance and projects. To combat this, states such as Utah are considering proposals including increasing the gasoline tax, letting counties increase their sales tax by a quarter-cent per dollar purchase to help fund local road projects (although much of the additional revenue would be used for areas with train and bus service), and raising registration fees on electric or alternative-fuel vehicles.68
The role of electric utilities in this space and the degree to which they should operate need to be defined to resolve ambiguity about whether or not charging station owners are viewed as electric utilities (since they could be seen as re-selling electricity to end users), and should be regulated as such.69
66 “Utility Involvement in Electric Vehicle Charging Infrastructure: California at the Vanguard.” Center for Strategic and International Studies, April 2016, https://www.csis.org/analysis/utility-involvement-electric-vehicle-charging-infrastructure-california-vanguard 67 “Electricity,” DriveClean.CA.gov, Plug-in Electric Vehicle Resource Center, Date retrieved: October 2015, http://driveclean.ca.gov/pev/Costs/Electricity.php 68 “Legislators: Utah tax hikes coming for gas, roads, transit.” The Salt Lake Tribute, January 2015, http://www.sltrib.com/news/2026778-155/legislators-tax-hikes-coming-for-transportation
69 Mukul Sarkar, “Adoption of Electric Vehicle, Challenges, its impact on Grid and our Recommendations,” Utility Analytics Institute, June 2015, http://www.energycentral.com/enduse/demandresponse/articles/3174/Adoption-of-Electric-Vehicle-Challenges-its-impact-on-Grid-and-our-Recommendations/

23
Questions To Ask Utilities in Your State
The following is a list of sample questions for state PUCs to ask themselves and their electric utilities in order to find out more about the nature of transportation and power interdependencies in their state. It may be helpful to adjust these as necessary to fit your needs.
(1) How do you manage reliability issues in the power sector that either affect or are affected by the transportation sector?
(2) How susceptible is your power supply to transportation disruptions, and vice versa?
(3) Do you have a backup plan for power if bridge, rail or barge transportation is disrupted?
(4) Is there a way to manage the transportation price risk (particularly for coal?)
(5) What threats to the power system could have adverse impacts on the transportation system (and vice versa)?
(6) What are the established relations between utilities, departments of transportation, and state PUCs in your state?
(7) What is the role of PUCs with regard to the electricity provided from charging stations to electric vehicle users?70
(8) What is the relationship between utilities and electric vehicle charging?
Conclusion: Steps for Public Utility Commissions
This primer illustrates the degree of interdependence between power and transportation infrastructures and how challenges arising across the sectors are addressed and managed to keep the systems reliable and resilient. It explains why rail, road, and barge entities should be in regular communication with power sector regulators. To help regulators address these sector interdependences and the challenges that may arise between and across them, consider the following steps:
• Understand your authority to act and ask questions in both the transportation and power sectors. Appendix B provides a list of the areas, by state, where Commissions have authority in the transportation arena.
• Even where your transportation-sector authority is limited, explore the issue within your state PUC to determine if there is room for further inquiry that can lead to productive improvements.
• Engage proactively with power companies. Ask questions about their systems’ dependence on rail, road, and waterborne traffic for delivering fuels, waste, critical supplies, and for emergency restoration. Understanding problems can help lead towards constructive solutions.
• Be in communication with your state’s DOT on these issues and consider joint understanding of each other’s emergency situation responsibilities BEFORE something goes wrong.
70 This issue is explored in the following article online at http://www.energycentral.com/enduse/demandresponse/articles/3174/Adoption-of-Electric-Vehicle-Challenges-its-impact-on-Grid-and-our-Recommendations/

24
• Work with partners in-state and across state lines to understand, and if needed take action, to improve the preparedness of your states’ electric systems as they relate to the transportation sector.
• Communicate with your state emergency management agency, and with resource centers including National Cybersecurity and Communications Integration Center (NCCIC), your state Fusion Center, and Information Sharing and Analysis Centers (ISACs) specific to critical infrastructure sectors.
• Consider and evaluate alternatives that obviate bottlenecks and improve system restoration. • Work to understand the convergence of these sectors and define the respective roles of your
commission and the utilities as the sector grows.

25
Appendix A: Events that can Cause Disruptions
Events That Can Cause Disruptions to the Transportation and Power Sectors
Events Power and Transportation Disruptions
Transportation Disruptions
Power Disruptions
Heavy Rain, Floods Heavy rain and flooding can cause damage to above and below ground power infrastructure; if substations are flooded, that too can lead to outages. High levels of water can slow or stop traffic on roads, as well as damage roads.
Sea Level Rise from Climate Change and Storm Surge
Higher water levels can lead to flooding, which can impact roads, rail, and tunnels – halting or stopping road transportation.
Extreme Heat High temperatures can cause rail and road damage
Arctic Warming This can lead to permafrost thaw, causing damage to infrastructure such as roads, and energy infrastructure
Tornados, Hurricanes, Wind
High speed wind and flooding associated with these events can cause both power and road infrastructure damage: hurricanes and tornados can cause trees to be uprooted and fall into power lines, which

26
can knock down lines and poles connected to the first line that was hit. Trees and other debris following a storm can block streets and highways. High speed winds or fallen trees can cause power lines to touch, leading to power shutting off.
Lightning When lightning strikes a tree branch, the branch can come into contact with a power line, causing circuit breakers or other equipment to shut power off. Lightning can also strike electrical equipment, causing a loss of power.
Snow Snow can block roads and slow or stop traffic
Ice Ice can make driving conditions on roads dangerous. Ice can accumulate on power lines and trees. The weight of ice on power lines can cause them to sag, leading to power disruptions or outages. Ice weight on tree branches can cause them to fall onto power lines, knocking lines and poles down or breaking them.
Tsunamis High speed, large volumes of water can damage or destroy

27
infrastructure such as roads, bridges, power and communication lines, power plants, and pipelines.
Earthquakes Earthquakes can cause roads, bridges, rail tracks, tunnels, elevated highways, embankments, retaining walls, communication lines, maintenance facilities, and overpasses to crack or be otherwise damaged. It can damage various components of energy infrastructure including, generation plants, transmission lines, and distribution lines – leading to service disruptions.
Vehicle and Construction Accidents
Vehicle accidents can cause power lines to break or touch and can lead to damaged poles. Vehicle accidents can also cause road blockages or closures. Accidental contact with underground or overhead power lines can also lead to power outages.
28
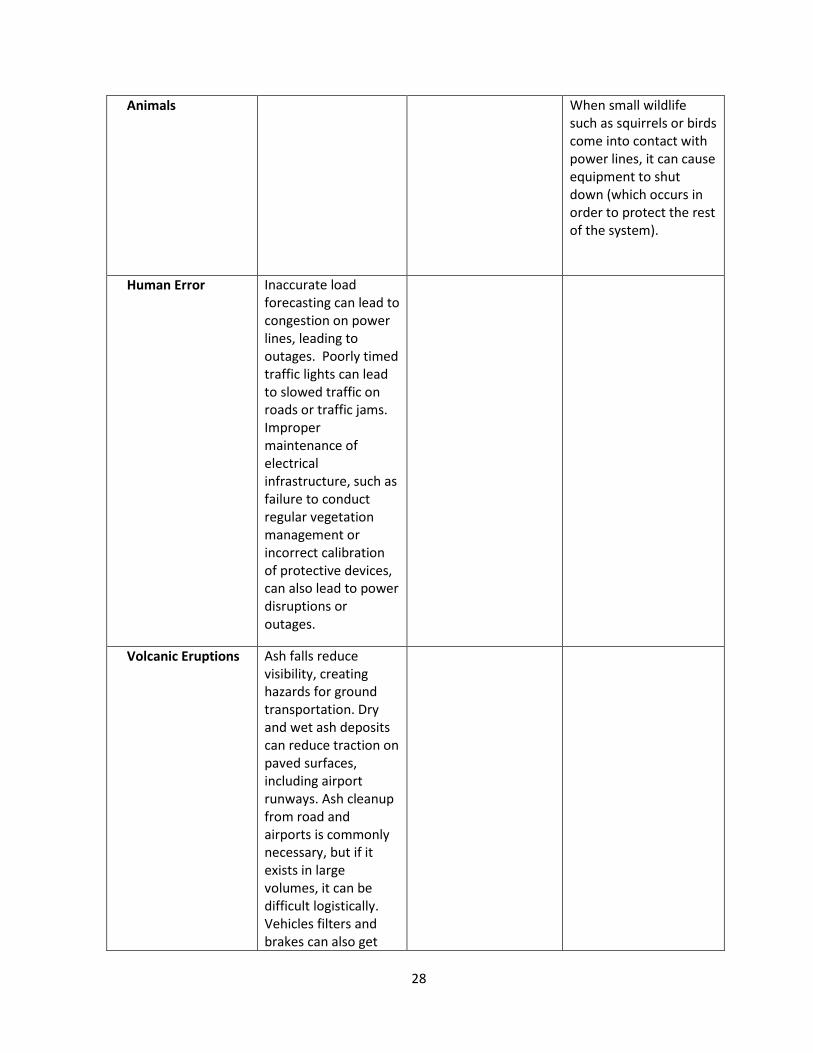
Animals When small wildlife such as squirrels or birds come into contact with power lines, it can cause equipment to shut down (which occurs in order to protect the rest of the system).
Human Error Inaccurate load forecasting can lead to congestion on power lines, leading to outages. Poorly timed traffic lights can lead to slowed traffic on roads or traffic jams. Improper maintenance of electrical infrastructure, such as failure to conduct regular vegetation management or incorrect calibration of protective devices, can also lead to power disruptions or outages.
Volcanic Eruptions
Ash falls reduce visibility, creating hazards for ground transportation. Dry and wet ash deposits can reduce traction on paved surfaces, including airport runways. Ash cleanup from road and airports is commonly necessary, but if it exists in large volumes, it can be difficult logistically. Vehicles filters and brakes can also get

29
clogged with ash; moving engine parts can also become worn down from ash.
Electricity networks are also vulnerable to disruption from volcanic ash falls, especially when fine ash is erupted because it is more likely to adhere to line and substation insulators, where it can cause unintended electrical discharge, which can lead to widespread outages.

30
Appendix B: State Public Utility Commission Regulatory Authority over Intrastate Rail, Road, and Barge Transportation
Utility Commission Name
Is Rail, Road, or Water Transport Regulated
by the
More Detail
Alabama Public Service CommissionRail & Road Vehicles
Rail (only tracks and the cars; RR crossings and signals are regulated by another agency; Motor Carriers (all forms of road transportation - commercial vehicles, passenger vehicles, taxis, buses, limos,
Regulatory Commission of Alaska N/AArizona Corporation Commission Rail RailArkansas Public Service Commission "Lyft-type services" (not taxis)
Colorado Public Utilities Commission Rail & Road Vehicles
Rail; Transportation (taxis, limos, buses, household goods movers, tow trucks)
Connecticut Public Utilities Regulatory Authority
N/A
Delaware Public Service Commission N/ADistrict of Columbia Public Service Commission
N/A
Florida Public Service Commission N/AGeorgia Public Service Commission N/A
Hawaii Public Utilities Commission
Road Vehicles & Water Transport
Motor carriers (tour buses, vans, or limousines, and some types of water transportation may display a PUC number). Water transport (It regulates water carriers carrying people, property, or other cargo including fuel, that is intrastate).
Iowa Utilities Board N/AIdaho Public Utilities Commission Rail Rail
Illinois Commerce Commission Rail & Road Vehicles
Rail; motor carriers (moving trucks carrying household goods)
Indiana Utility Regulatory Commission N/A
Kansas Corporation CommissionRoad Vehicles
Motor carrier (commercial trucking; moving companies carrying household goods; limos, buses, taxis are sometimes regulated, depending on # passengers and where it's going; )
Kentucky Public Service Commission N/A
California Public Utilities CommissionRail & Road Vehicles
Rail; Motor carriers (limousines, airport shuttles, charter and scheduled bus operators, household moving companies, and "Lyft-type services").

31
Louisiana Public Service CommissionRail & Road Vehicles
Rail (has statutes on the books but haven't done any implementation because of insufficent funding and other groups challenging PSC's authority to regulate). Motor carriers (passenger carrier services, waste
Maine Public Utilities Commission N/A
Maryland Public Service CommissionRail & Road Vehicles
Rail; Motor Vehicles (passenger motor vehicle carriers -sedans, limousines, and buses; taxis)
Massachusetts Department of Public Utilities Rail & Road Vehicles
Rail; Motor carriers (motor coach companies, including coaches and transit authority buses; school buses; trucks carrying household goods)
Minnesota Public Utilities Commission N/AMississippi Public Service Commission N/AMissouri Public Service Commission N/A
Montana Public Service Commission Rail & Road Vehicles
Rail; Motor Carriers (certain motor carriers hauling regulated commodities, including livestock and agriculture; taxis, limos, buses, moving trucks carrying household goods )
Nebraska Public Service Commission Rail & Road Vehicles
Rail; Motor Carriers (vehicles carrying household goods; passenger carriers)
Public Utilities Commission of Nevada Rail RailNew Hampshire Public Utilities Commission N/ANew Jersey Board of Public Utilities N/A
New Mexico Public Regulation CommissionRail & Road Vehicles
Rail; Motor carriers (taxi, limos, tour buses, shuttles, ambulances, tow trucks, household goods services, commuter services)
New York State Public Service Commission N/A
North Carolina Utilities Commission Road Vehicles
Motor Carriers (household goods transportation, busses);
North Dakota Public Service Commission Rail Rail
Public Utilities Commission of OhioRail & Road Vehicles
Rail; Motor Carriers (consumer motor carriers; commercial motor carriers or "trucking")
Oklahoma Corporation Commission Rail & Road Vehicles
Rail; Motor Carriers (motor carriers and commercial motor vehicles)
Michigan Public Service Commission Road Vehicles
Motor carriers of household goods (All other road motor vehicles are regulated by the Motor Carrier Enforcement Division, part of the Police Dept.)

32
Explanatory notes about information in middle column:
’N/A’ denotes that the state PUC does not regulate rail, road, or barge ‘Rail’ includes any of the following: railroad cars, tracks, railroad crossings, railroad crossing signals, protocols for personnel to follow ‘Road Vehicles’ include any of the following: commercial trucks, passenger motor carriers, moving trucks for household goods, taxis, buses, school buses, limos ‘Water Transport’ includes the following: commercial vessels carrying cargo
*If a transportation mode appears in column 2, this means that some aspect of it is regulated by the public utility commission (economic, operational, safety, etc.) Data Sources: State PUC websites and phone calls made to states; Advanced Energy Economy's PowerPortal Database; NARUC Policy Department
Oregon Public Utilities Commission N/A
Pennsylvania Public Utility Commission Rail & Road Vehicles
Rail (safety); Motor Carriers (limos, taxis, movers)
Rhode Island Public Utilities Commission Rail & Road Vehicles
Rail; motor carriers (tow trucks; taxis)
South Dakota Public Utilities Commission N/ATennessee Regulatory Authority N/A
Public Utility Commission of Texas N/A
Texas Railroad Commission N/AUtah Public Service Commission N/AVermont Public Service Board N/AVirginia State Corporation Commission Rail Rail (Railroad safety)
Washington Utilities and Transportation Commission
Rail & Road Vehicles
Transportation (commercial vehicles - only regulate entry and insurance; passenger carriers - regulate permitting, safety checks, and do compliance reviews, licensing; household goods carriers; charter and excursion carriers); Rail
Public Service Commission of West Virginia Rail & Road Vehicles
Rail; Transportation (taxi service, specialized limousine service, solid waste, transportation service, third-party towing and household goods movers; trucks carrying coal)
Public Service Commission of Wisconsin N/A
South Carolina Public Service Commission Road Vehicles
Motor Carriers (taxi, limo, shuttles, non-emergency vehicles, household moving trucks). PSC issues certificates of public