Embed Size (px)
Citation preview

The Pennsylvania State University
The Graduate School
Department of Electrical Engineering
NANOSTRUCTURED DIELECTRIC FILMS FOR NEXT GENERATION OF
ENERGY STORAGE CAPACITORS
A Dissertation in
Electrical Engineering
by
Yash Thakur
2017 Yash Thakur
Submitted in Partial Fulfillment
of the Requirements
for the Degree of
Doctor of Philosophy
August 2017

ii
The dissertation of Yash Thakur was reviewed and approved* by the following:
Qiming Zhang
Distinguished Professor of Electrical Engineering
Dissertation Advisor
Chair of Committee
Jerzy Ruzyllo
Distinguished Professor of Electrical Engineering
Noel Chris Giebink
Charles K. Etner Assistant Professor of Electrical Engineering
James Runt
Professor of Polymer Science in Materials Science and Engineering
Michael Lanagan
Professor of Engineering Science and Mechanics
Kultegin Aydin
Professor of Electrical Engineering
Head of the Department of Electrical Engineering
*Signatures are on file in the Graduate School
iii
ABSTRACT
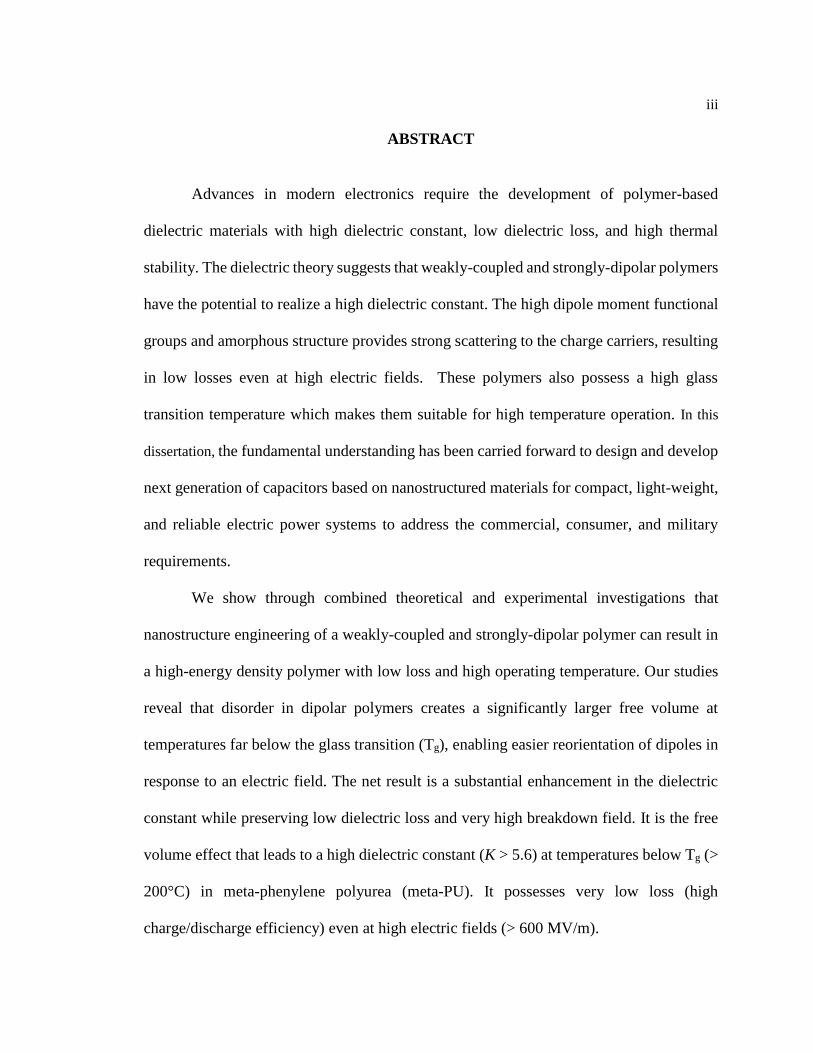
Advances in modern electronics require the development of polymer-based
dielectric materials with high dielectric constant, low dielectric loss, and high thermal
stability. The dielectric theory suggests that weakly-coupled and strongly-dipolar polymers
have the potential to realize a high dielectric constant. The high dipole moment functional
groups and amorphous structure provides strong scattering to the charge carriers, resulting
in low losses even at high electric fields. These polymers also possess a high glass
transition temperature which makes them suitable for high temperature operation. In this
dissertation, the fundamental understanding has been carried forward to design and develop
next generation of capacitors based on nanostructured materials for compact, light-weight,
and reliable electric power systems to address the commercial, consumer, and military
requirements.
We show through combined theoretical and experimental investigations that
nanostructure engineering of a weakly-coupled and strongly-dipolar polymer can result in
a high-energy density polymer with low loss and high operating temperature. Our studies
reveal that disorder in dipolar polymers creates a significantly larger free volume at
temperatures far below the glass transition (Tg), enabling easier reorientation of dipoles in
response to an electric field. The net result is a substantial enhancement in the dielectric
constant while preserving low dielectric loss and very high breakdown field. It is the free
volume effect that leads to a high dielectric constant (K > 5.6) at temperatures below Tg (>
200°C) in meta-phenylene polyurea (meta-PU). It possesses very low loss (high
charge/discharge efficiency) even at high electric fields (> 600 MV/m).

iv
To extend the idea of free volume, we propose a blending approach where two
glassy state dipolar polymers, poly(arylene ether urea) (PEEU, K=4.7) and an aromatic
polythiourea (ArPTU, K=4.4), are combined. The resulting blend exhibits a very high
dielectric constant(K=7.5) while maintaining low dielectric loss (< 1%). The experimental
and simulation results demonstrate that blending these dissimilar dipolar polymers causes
a slight increase in the interchain spacing of the blend in its glassy state. This reduces the
barriers for the reorientation of dipoles in the polymer chains and generates a much higher
dielectric response than the neat polymers.
In addition to designing new dielectric materials with excellent dielectric
properties, it is crucial that we continue to improve the electrical properties of the state-of-
the-art materials. This allows us to utilize the existential large-scale manufacturing
facilities of these polymers. Polyetherimide (PEI), a high glass transition amorphous
polymer, is seen as the material of choice for high temperature capacitors. But it possesses
a moderate dielectric constant of 3.2, which limits its energy density. We present a
nanocomposite approach, where addition of small amounts of inorganic nanoparticles in
PEI can improve the dielectric constant by 60% while maintaining the breakdown strength,
thereby increasing the discharged energy density by 50%. This is a very promising
approach and a breakthrough experimental discovery for engineering nanostructures by
introducing low volume content of nanofillers with dielectric constant similar to that of the
matrix, to achieve markedly enhanced dielectric response. The results are extremely
intriguing and eliminate many undesirable features, primarily being low breakdown
strength of traditional dielectric nanocomposites containing high dielectric constant fillers,
which have been a focal point of study for the past 20 years in this area of research.
v
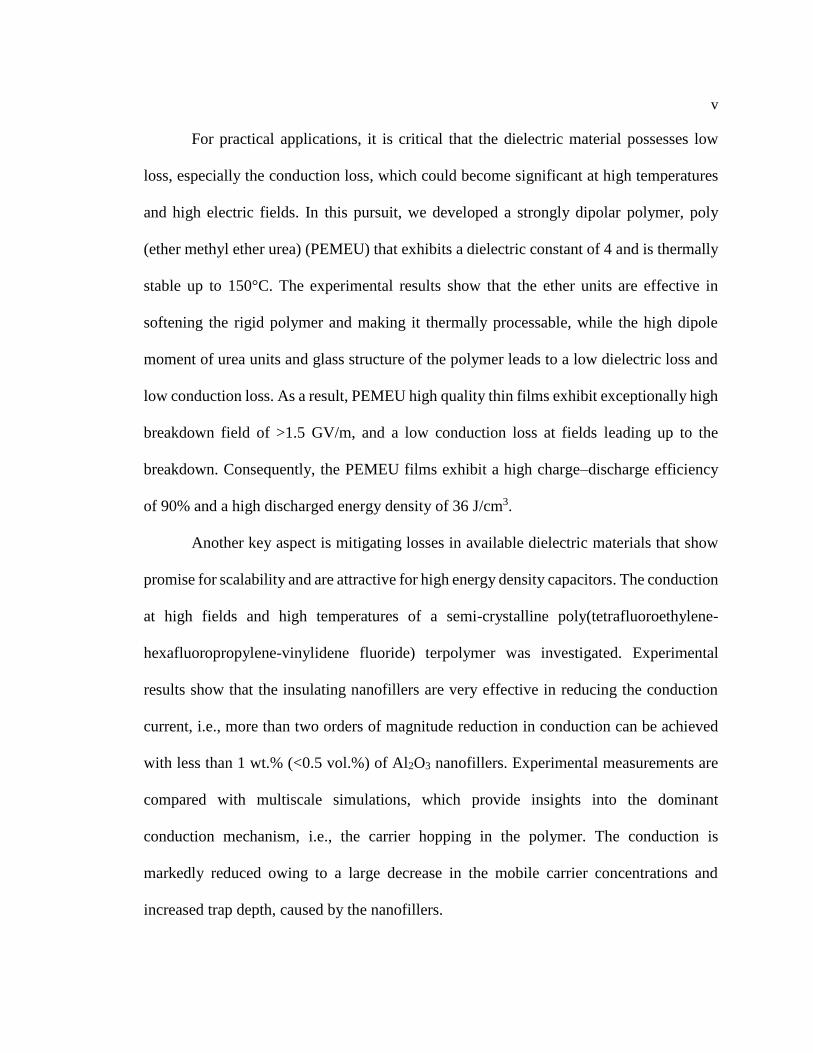
For practical applications, it is critical that the dielectric material possesses low
loss, especially the conduction loss, which could become significant at high temperatures
and high electric fields. In this pursuit, we developed a strongly dipolar polymer, poly
(ether methyl ether urea) (PEMEU) that exhibits a dielectric constant of 4 and is thermally
stable up to 150°C. The experimental results show that the ether units are effective in
softening the rigid polymer and making it thermally processable, while the high dipole
moment of urea units and glass structure of the polymer leads to a low dielectric loss and
low conduction loss. As a result, PEMEU high quality thin films exhibit exceptionally high
breakdown field of >1.5 GV/m, and a low conduction loss at fields leading up to the
breakdown. Consequently, the PEMEU films exhibit a high charge–discharge efficiency
of 90% and a high discharged energy density of 36 J/cm3.
Another key aspect is mitigating losses in available dielectric materials that show
promise for scalability and are attractive for high energy density capacitors. The conduction
at high fields and high temperatures of a semi-crystalline poly(tetrafluoroethylene-
hexafluoropropylene-vinylidene fluoride) terpolymer was investigated. Experimental
results show that the insulating nanofillers are very effective in reducing the conduction
current, i.e., more than two orders of magnitude reduction in conduction can be achieved
with less than 1 wt.% (<0.5 vol.%) of Al2O3 nanofillers. Experimental measurements are
compared with multiscale simulations, which provide insights into the dominant
conduction mechanism, i.e., the carrier hopping in the polymer. The conduction is
markedly reduced owing to a large decrease in the mobile carrier concentrations and
increased trap depth, caused by the nanofillers.

vi
In summary, this dissertation focusses on the development of next generation
capacitors by innovation in materials which possess high dielectric constant, low loss, high
breakdown strength, and high temperature thermal stability. We believe that the insightful
results and approaches shown by the introduction of localized free volume and low volume
content of nanoparticles may unravel new directions for future research in advanced
dielectrics.
vii
TABLE OF CONTENTS
List of Figures .............................................................................................................. ix
List of Tables ............................................................................................................... xiv
Acknowledgements ...................................................................................................... xv
Chapter 1 Introduction ............................................................................................................. 1
1.1 Fundamentals of capacitors ........................................................................................ 3 1.1.1 Static electric field ........................................................................................... 5 1.1.2 Time-varying electric field .............................................................................. 6 1.1.3 Polarization mechanisms ................................................................................. 8 1.1.4 Energy storage ................................................................................................. 11
1.2 Dielectric polymers .................................................................................................... 13 1.3 Statement of goals, objectives and dissertation organization ..................................... 17
Chapter 2 Introduction of free volume to achieve high dielectric constant in dipolar
polymers ........................................................................................................................... 19
2.1 Introduction ................................................................................................................ 19 2.2 Review of free volume theory .................................................................................... 23 2.3 Experimental section .................................................................................................. 27
2.3.1 Synthesis and film fabrication of ordered and disordered structures .............. 27 2.3.2 Measurement of dielectric properties of polymer powders ............................. 29 2.3.3 Details of characterization equipment ............................................................. 30
2.4 Results and discussion ............................................................................................... 30 2.5 Conclusion ................................................................................................................. 39
Chapter 3 Blending of dipolar polymers to enhance the free volume effect............................ 40
3.1 Introduction ................................................................................................................ 40 3.2 Experimental section .................................................................................................. 40
3.2.1 Synthesis and film fabrication of blends ......................................................... 40 3.2.2 Details of characterization equipment ............................................................. 42
3.3 Discussion of dielectric data ...................................................................................... 42 3.4 Structural analysis ...................................................................................................... 48 3.5 Conclusion ................................................................................................................. 54
Chapter 4 Enhanced dielectric response in dipolar polymers with inorganic nanodopants ..... 55
4.1 Introduction ................................................................................................................ 55 4.2 Composite theory ....................................................................................................... 55
4.2.1 Models for predicting effective permittivity ................................................... 58 4.3 Experimental section .................................................................................................. 59
4.3.1 Nanocomposites of polyetherimide ................................................................. 59 4.3.2 Nanocomposites of polystyrene ...................................................................... 60 4.3.3 Details of characterization equipment ............................................................. 61
viii
4.4 Results and discussion ............................................................................................... 62 4.4.1 Effect of alumina nanoparticles and the particle size ...................................... 62 4.4.2 Effect of nanoparticle type on dielectric constant ........................................... 70 4.4.3 Effect of high dielectric constant nanoparticles .............................................. 72 4.4.4 Importance of dipoles ...................................................................................... 74 4.4.5 Structural analysis ........................................................................................... 78 4.4.6 Multilayer core model for interfacial effect of nanocomposites ..................... 80
4.5 Conclusion ................................................................................................................. 82
Chapter 5 Dipolar polymers: high field behavior and study of conduction loss ...................... 83
5.1 Introduction ................................................................................................................ 83 5.2 Review of breakdown mechanisms ............................................................................ 84
5.2.1 Electronic breakdown ...................................................................................... 85 5.2.2 Thermal breakdown ......................................................................................... 86 5.2.3 Electromechanical breakdown ........................................................................ 87 5.2.4 Frohlich amorphous solid model ..................................................................... 90 5.2.5 Dependence of breakdown strength on film thickness .................................... 91
5.3 Experimental section .................................................................................................. 93 5.3.1 Synthesis and film fabrication of PEMEU ...................................................... 93 5.3.2 Details of characterization equipment ............................................................. 95
5.4 Results and discussion of PEMEU ............................................................................. 95 5.5 Introduction of nanoparticle dopants to reduce the conduction loss .......................... 102 5.6 Review of conduction in polymers ............................................................................ 103
5.6.1 Electrode limited conduction........................................................................... 105 5.6.2 Bulk limited conduction .................................................................................. 108
5.7 Film preparation and characterization of THV nanocomposites ................................ 113 5.8 Results and discussion of THV nanocomposites ....................................................... 115 5.9 Conclusion ................................................................................................................. 129
Chapter 6 Conclusion and recommendations for future work ................................................. 131
6.1 Summary .................................................................................................................... 131 6.2 Suggestions for future work ....................................................................................... 135
Appendix A Chapter 4 Supporting Information ..................................................................... 140
Appendix B Chapter 5 Supporting Information ...................................................................... 144
Bibliography ............................................................................................................................ 145

ix
LIST OF FIGURES
Figure 1-1 Ragone plot comparing various energy storage devices. [1] .................................. 2
Figure 1-2 Various generations of capacitor: (a) Leyden jar is a glass vessel coated inside
and out by conducting electrodes; (b) cylindrical capacitor is a rolled-up parallel
plate capacitor; (c) the multilayer capacitor with its staggered electrodes. [3] ................ 4
Figure 1-3 Schematic of parallel plate configuration. .............................................................. 6
Figure 1-4 Equivalent circuit diagram of a capacitor under AC field. ..................................... 8
Figure 1-5 The frequency dependence of the real and imaginary parts of the dielectric
constant in the presence of various polarization mechanism. [10]................................... 11
Figure 1-6 Polarization-electric field responses of: (a) linear; (b) relaxor ferroelectric; (c)
ferroelectric; (d) anti-ferroelectric [13]. ........................................................................... 12
Figure 1-7 Schematic of polarization-electric field response for a dielectric material at
high fields. ........................................................................................................................ 13
Figure 1-8 Organization flow of the objectives of this dissertation. ........................................ 18
Figure 2-1 Dipolar structure of urea and thiourea units. [47] .................................................. 21
Figure 2-2 Schematics of (a) aromatic polyurea (ArPU), (b) aromatic polythiourea
(ArPTU), (c) meta-phenylene polyurea (m-PhPU/meta-PU), and (d) methylene
polythiourea (MePTU). [50] ............................................................................................ 22
Figure 2-3 Schematic diagram illustrating free volume as calculated by Simha and
Boyer.[56] ........................................................................................................................ 25
Figure 2-4 Schematic of synthesis of meta-PU. ....................................................................... 28
Figure 2-5 Schematic of synthesis of PEEU. ........................................................................... 28
Figure 2-6 X-ray data for (a) ordered meta-PU structures; (b) films of disordered meta-
PU structure...................................................................................................................... 31
Figure 2-7 (a) DSC data and (b) TGA data of meta-PU. ......................................................... 32
Figure 2-8 (a) Dielectric constant vs. frequency, measured at room temperature; (b)
dielectric constant vs temperature, measured at 1 kHz; (c) P-E loop of meta-PU film. .. 34
Figure 2-9 Dielectric constant vs frequency for the mixture of meta-PU/castor oil (open
squares) and castor oil (open circles). .............................................................................. 35
Figure 2-10 (a) Dielectric constant and (b) dielectric loss as a function of frequency for
ordered and disordered structure of meta-PU. ................................................................. 36

x
Figure 2-11. X-ray data for (a) ordered PEEU structures, powder; (b) films of disordered
PEEU structure. ................................................................................................................ 37
Figure 2-12 Dielectric constant as a function of frequency for (a) disordered and (b)
ordered structure of PEEU. .............................................................................................. 38
Figure 3-1 Schematic of synthesis of aromatic polythiourea. .................................................. 41
Figure 3-2 Blend of two polymers: ArPTU and PEEU. .......................................................... 41
Figure 3-3 Dielectric data of the 1:1 blend of PEEU and ArPTU (a) as a function of
frequency at room temperature, including the inset which shows the dielectric data
of PEEU and ArPTU; (b) as a function of temperature at different frequencies. (c)
Dielectric constant vs. blend composition (weight ratio of PEEU:ArPTU) at room
temperature and 1 kHz. Data points are shown and the dashed line is drawn to guide
the eye. ............................................................................................................................. 44
Figure 3-4 Dielectric data of (a) ArPTU, (b) PEEU as functions of temperature measured
over a range of frequencies. ............................................................................................. 46
Figure 3-5 (a) Computational results of dielectric constant vs. specific volume for PEEU,
ArPTU, and blends for various supercells with different PEEU:ArPTU weight ratios.
(b) Comparison of simulation and experimental data of dielectric constant vs. blend
composition (PEEU:ArPTU weight ratio) at room temperature. Data points are
shown and the dashed line is drawn to guide the eye. [65] .............................................. 47
Figure 3-6 (a) X-ray diffraction data of ArPTU and PEEU, and their 1:1 blend.
Background subtracted data of (b) PEEU with peak at 18.6°, (c) ArPTU with peak at
18.6° and (d) blend data with peak at 17°. Wavelength of X-ray used was 1.54
angstroms. ........................................................................................................................ 49
Figure 3-7 AFM images: (a) amplitude and (b) phase for the PEEU:ArPTU 1:1 blend. ......... 50
Figure 3-8 DSC data of 1:1 PEEU:ArPTU blend. ................................................................... 50
Figure 3-9 TGA data of 1:1 PEEU:ArPTU blend. ................................................................... 51
Figure 3-10 PALS results of (a) positron lifetime, (b) spherical specific hole volume with
change in PEEU composition........................................................................................... 53
Figure 4-1 Molecular structure of the polyetherimide. [94] .................................................... 60
Figure 4-2 Molecular structure of the polystyrene. .................................................................. 61
Figure 4-3 (a) Room temperature dielectric properties of PEI/alumina (20 nm particle
size) nanocomposites at different alumina nanoparticle loading (in vol. %) vs
frequency. (b) Dielectric constant of nanocomposite films of PEI/alumina (20 nm
particle size) vs. nanofiller volume content and comparison with several widely used
dielectric models of diphasic dielectric composites (lines with no data points): curve
xi
(1) Parallel model, (2) Maxwell model, (3) Lichtenecker model, and (4) series
model. Inset shows an expanded view of the dielectric constants of the composite
films vs. alumina loading. Experimental data points are shown and lines are drawn
to guide the eye. (c) Dielectric properties vs. temperature of the PEI/alumina (20 nm
size) nanocomposite with 0.32 vol.% alumina loading at different frequencies. ............. 64
Figure 4-4 Dielectric properties at different frequencies of neat PEI as a function of
temperature....................................................................................................................... 65
Figure 4-5 (a) Charge-discharge cycles of PEI/alumina (20 nm) nanocomposites with
0.32 vol.% alumina under different electrical fields at 10 Hz and room temperature.
Inset: discharged energy density deduced from the charge-discharge cycle data. (b),
(c), (d) Discharged energy density of PEI/alumina (20 nm) nanocomposites with
0.32 vol.% loading at different temperatures (room temperature, 100oC, and 150oC),
and their comparison with that of neat PEI and BOPP (room temperature), measured
under 350 MV/m at 10 Hz. In (b), (c), and (d), Data points are shown and curves are
drawn to guide the eye. Data for BOPP were taken from Ref. [44] ................................. 66
Figure 4-6 Weibull plot showing failure distribution for PEI-0.32% Al2O3 nanocomposite
film. .................................................................................................................................. 67
Figure 4-7 Effect of nanofiller size on the dielectric response (at 1 kHz) of PEI/alumina
composite films vs filler volume content. ........................................................................ 68
Figure 4-8 Effect of nanofiller size on the dielectric response (at 1 kHz) of PEI/alumina
composite films vs filler volume content. Experimental data points are shown and
curves are drawn to guide the eye. ................................................................................... 71
Figure 4-9 Dielectric constant of PEI/BaTiO3 (50 nm size) nanocomposites vs. BaTiO3
volume content (experimental data points are shown and for > 3 vol.%
nanocomposites (orange squares) the data are from Ref. [95]). Experimental data are
compared with several commonly used composite models (Refs. [91]–[93]): (1)
Parallel model (black), (2) Maxwell model (red), (3) Lichtenecker model (green),
and (4) series model (blue), assuming the dielectric constant of BaTiO3 is 100X of
that of PEI. Inset is an expanded view of the enhanced dielectric response of
nanocomposites at very low volume content (< 1 vol.%) due to nanoparticle
interfacial effects, experimental data points are shown and solid curve is drawn to
guide the eye. ................................................................................................................... 73
Figure 4-10 Summary of dielectric constants of PEI nanocomposites with different
nanofillers (20 nm MgO; 20 nm SiO2; 20 nm alumina; 50 nm BaTiO3; 70 nm BN).
Experimental data points are shown and lines are drawn to guide the eye. ..................... 73
Figure 4-11 Dielectric constant measured at 1 kHz and room temperature vs. the
nanofiller content for PS nanocomposites. Data points are shown and solid curves
are drawn to guide the eye. .............................................................................................. 75

xii
Figure 4-12 (a) Dielectric data at different frequencies of PEI+0.32 vol.% Al2O3 20 nm
as a function of temperature, (b) Dielectric data of PEI and (c) PEI+0.32 vol.%
Al2O3 20 nm nanoparticle as a function of frequency at room temperature..................... 77
Figure 4-13 A representative TEM image of the PEI nanocomposite with 0.32 vol.%
alumina (20 nm particle size). Due to low volume content of nanoparticle in the
composite, only one nanoparticle is seen in the image area, as indicated. ....................... 79
Figure 4-14 (a) DSC and (b) X-ray diffraction data of PEI and the PEI nanocomposite
with 0.32 vol.% of alumina. ............................................................................................. 79
Figure 4-15 Tanaka’s multi-core model for interfaces between inorganic nanoparticles
and polymer matrix. [67], [97] ......................................................................................... 81
Figure 5-1 Schematic of synthesis and chemical structure of poly(ether methyl ether
urea), PEMEU. ................................................................................................................. 94
Figure 5-2 1H-NMR spectrum for PEMEU in DMSO-d6. ...................................................... 94
Figure 5-3 (a) Wide angle X-ray diffraction data at room temperature and (b) DSC data
of PEMEU film measured during heating. ....................................................................... 97
Figure 5-4 Dielectric constant and loss as functions of (a) frequency measured at room
temperature, and (b) temperature at frequencies from 1 kHz to 1 MHz of PEMEU
films. The error bars are attributed to the variation in thickness of film and the
electrode area. .................................................................................................................. 98
Figure 5-5 Electric breakdown field vs. film thickness for the PEMEU films measured at
room temperature. Dots represent y-axis error bars and symbols represent x-axis
error bars. ......................................................................................................................... 100
Figure 5-6 (a) AFM image, (b) Charging/discharging curves under different unipolar
fields, (c) Schematic showing calculation of discharged energy density and loss
under high field from the charging/discharging curves, (d) Discharged energy
density as a function of field of PEMEU thin films of 1.32 μm thick, measured at
room temperature. Dots represent y-axis error bars and symbols represent x-axis
error bar. ........................................................................................................................... 101
Figure 5-7 Schematic of conduction process in polymers. [12]............................................... 104
Figure 5-8 Schematic showing Schottky contact between metal and n-type polymer (a)
before contact, (b) after contact, (c) barrier lowering by image force and (d) barrier
lowering by external voltage. [126], [127] ....................................................................... 107
Figure 5-9 Schematic graph showing current density versus voltage for an ideal case of
space-charge limited current.[12] ..................................................................................... 110
Figure 5-10 Schematic showing random resistor network percolation. ................................... 113

xiii
Figure 5-11 Dielectric data of neat THV as a function of temperature.................................... 115
Figure 5-12 Dielectric data as a function of frequency for THV and THV nanocomposite
films, (b) DMA of THV and THV+0.5 wt.% Al2O3 films. .............................................. 117
Figure 5-13 (a) Current density, (b) conductivity as a function of field at different
temperatures, (c) conductivity as a function of temperature at different fields for neat
THV film. ......................................................................................................................... 118
Figure 5-14 (a) Current density, (b) conductivity as a function of field at different
temperatures, (c) conductivity as a function of temperature at different fields for
THV+0.5 wt.% Al2O3 film. .............................................................................................. 120
Figure 5-15 (a) Current density, (b) conductivity as a function of field at different
temperatures, (c) conductivity as a function of temperature at different fields for
THV+1 wt.% Al2O3 film. ................................................................................................. 122
Figure 5-16 (a) Comparison of conduction current of neat THV and different filler
loadings at 125°C, (b) scatter of conductivity at 60 MV/m as a function of alumina
nanofiller content. Dashed lines are drawn to guide the eye. ........................................... 123
Figure 5-17 Comparison of leakage conductivity from simulation and measurement at
85C and 125C for: (a) THV+0.5 wt.%, and (b) THV+1.0 wt.%, (c) carrier
concentration and trap depth as a function of filler content. ............................................ 125
Figure 5-18 X-ray diffraction data of neat THV polymer and THV+1 wt.% Al2O3
nanocomposite films. ....................................................................................................... 127
Figure 5-19 Two-dimensional X-ray diffraction data of neat THV polymer and THV+1
wt.% Al2O3 nanocomposite films. .................................................................................... 128
Figure 6-1 Current density as a (a) function of electric field over a range of temperatures,
(b) function of temperatures at 95.1 MV/m. .................................................................... 138
Figure 6-2 High frequency characterization of PEI-1wt.%Al2O3 nanocomposite films. ......... 139

xiv
LIST OF TABLES
Table 1-1 Summary of dielectric materials studied for capacitor applications. [20], [40] ...... 15
Table 2-1 Dipole moments of common dipolar units present in dielectric polymers. [15] ..... 20
Table 2-2 Summary of dielectric properties of ArPU, ArPTU, m-PhPU and MePTU. [50] ... 23
Table 2-3 Summary of experimental dielectric data of ordered and disordered structure of
meta-PU and PEEU. ......................................................................................................... 37
Table 3-1 Summary of the dielectric properties of the neat polymers and blends at 25 ˚C ..... 45
Table 4-1 Summary of dielectric data of polyetherimide (PEI) with alumina
nanoparticles. ................................................................................................................... 69
Table 4-2 Summary of dielectric data of polyetherimide (PEI) with different type of
nanoparticles. ................................................................................................................... 71
Table 4-3 Summary of dielectric data of polyetherimide (PEI) with barium titanate
(BaTiO3) nanoparticles. .................................................................................................... 74
Table 4-4 Summary of dielectric data of non-polar polystyrene (PS) nanocomposite films. .. 76
Table 5-1 Summary of dielectric theories of solids. [106]....................................................... 89
Table 5-2 Summary of fitting parameters of hopping conduction equation for the neat
THV and nanocomposites. ............................................................................................... 126
xv
ACKNOWLEDGEMENTS
First and foremost, I am deeply grateful to my adviser Prof. Qiming Zhang for his
constant guidance throughout this endeavor. He has tapped into my potential and brought
the best out in me. His work ethics are exemplary and have been a source of constant
motivation for me. Under his tutelage, I have become more disciplined and driven.
I sincerely appreciate my committee members: Prof. James Runt, Prof. Michael
Lanagan, Prof. Jerzy Ruzyllo and Prof. Noel Geibink. I am grateful to Prof. James Runt for
collaborating on my projects and I am indebted for his guidance and help with broadband
spectroscopy.
I would like to convey special thanks to Prof. Jerzy Ruzyllo, who was my master’s
adviser and has nurtured me through the early years of graduate studies. He gave me time
and guidance to prepare for the rigors of doctoral studies. A special mention to Prof.
Thomas Jackson who encouraged me to pursue doctoral degree and laid out strong
fundamentals of device physics. I appreciate his patience in solving my doubts and
strengthening my basics. Prof. Ashok has been a mentor and he has encouraged me
throughout my graduate studies.
I am thankful to my lab mates: Tian Zhang, Dr. Minren Lin, Dr. Shan Wu, Dr.
Xiaoshi Qian, Lu Yang. I sincerely acknowledge Dr. Minren Lin, who helped me in my
first year with polymer synthesis and film fabrication; Tian Zhang for nanocomposite film
preparation and Ciprian Iacob for performing broadband dielectric spectroscopy on my
samples. Special thanks to Jeff Long and Steve Perrini for their help and guidance in the
electrical characterization lab. I am grateful to Nicole Wonderling and Gino for their help

xvi
with XRD measurements, and rest of the MCL staff for their useful suggestions and help
with material characterization.
I would like to thank my collaborators: Prof. Jerry Bernholc at N.C. State and his
students Rui Dong and Bing Zhang, who carried out the simulation part of our free volume
study; Dr. Meng H. Lean (CTO of QEDone LLC) for his bipolar charge transport study;
Prof. Long-Qing Chen and his student Tiannan Yang for carrying out simulation study on
interfacial effect of nanoparticles; Prof. Qing Wang and his students Feihua Liu and Guang
Yang for their help with TGA and NMR study, and finally Prof. David Gidley from
University of Michigan for collaborating on PALS study. I sincerely acknowledge the
support of Office of Naval Research who supported this study.
A special mention to all my friends at Penn State especially Jared, Alyssa, Shruti,
Tanushree, Ganesh, Rahul Pandey, Rahul Simham Nitesh, Shantanab for their constant
support and company.
Last but not the least, I want to thank my beloved parents – Namita Singh and
Balwant Singh, grandmother Indra Shukla, and my extended family members – Dr. Amita
Dave, Mr. Atul Dave, Dr. Vasu Misra and Dr. Neeraj Tripathi for their constant support
and encouragement. I would like to dedicate this thesis to my loving parents.

1
Chapter 1
Introduction
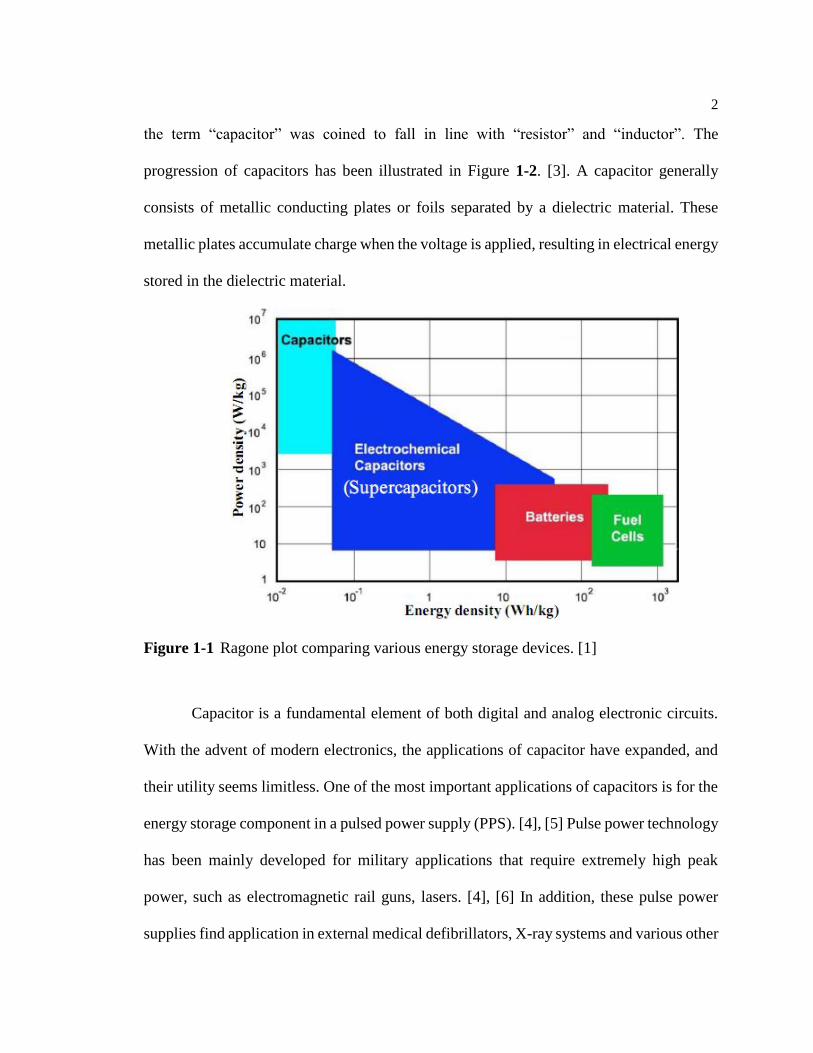
The development of efficient and high-performance devices for electrical energy storage
is essential to meet the ever-increasing demands for electrical energy. For past century,
researchers have sought better ways to store energy and the continued research in this area
has led to the development of various energy storage devices: batteries, fuel cells,
supercapacitors and capacitors. [1] These energy storage devices are shown in Figure 1-1.
[1] For microsecond to fractional-second electrical energy storage, discharge, filtering and
power conditioning, capacitor technology is unparalleled in flexibility and adaptability to
meet the broad range of requirements of the present and the future. [2] The development
of advanced dielectrics, which enable capacitors to store more charge and withstand high
voltages can fulfill the need for compact, light-weight and reliable electrical power systems
to meet commercial, consumer and military requirements.
In ancient times, the Greeks were the first to recognize that they could separate
charge by rubbing certain dissimilar materials. Even today, the charge storage amounts to
separation of ions and electrons. This was demonstrated over two centuries ago by the
Leyden jar and Volta’s pile, the predecessor of the modern capacitors and battery,
respectively. Capacitors were originally known as condensers with reference to the ability
to store a higher density of electric charge than a normal isolated conductor. In the late
1950s, it was decided to harmonize the nomenclature of most electrical components, and
2
the term “capacitor” was coined to fall in line with “resistor” and “inductor”. The
progression of capacitors has been illustrated in Figure 1-2. [3]. A capacitor generally
consists of metallic conducting plates or foils separated by a dielectric material. These
metallic plates accumulate charge when the voltage is applied, resulting in electrical energy
stored in the dielectric material.
Figure 1-1 Ragone plot comparing various energy storage devices. [1]
Capacitor is a fundamental element of both digital and analog electronic circuits.
With the advent of modern electronics, the applications of capacitor have expanded, and
their utility seems limitless. One of the most important applications of capacitors is for the
energy storage component in a pulsed power supply (PPS). [4], [5] Pulse power technology
has been mainly developed for military applications that require extremely high peak
power, such as electromagnetic rail guns, lasers. [4], [6] In addition, these pulse power
supplies find application in external medical defibrillators, X-ray systems and various other

3
monitoring systems in medical industry. The capacitor-based system offers advantages of
high power density, little magnetic flux leakage, and graceful degradation.
Another important application is DC-bus capacitors used in power electronic
devices, especially inverters, where they can pave the way for high performance hybrid
electric vehicles (HEV’s). [7], [8] The capacitors have become an integral part of energy
saving systems in auto sector – such as auto ignition, regenerative braking etc. A modern
car may use as many as 1700 capacitors for various functions and accessories. [9] Next
generation power inverters with lower cost, high-efficiency, light-weight, better
performance and lifetime are the biggest challenges. Moreover, the high-power density
demand has led to significant challenges on thermal management since the power loss has
also proportionally increased. The present polypropylene capacitors can only be used at
105°C, if they are installed with a secondary cooling loop. [8] Thus, innovation in
capacitors, a crucial component, can bring a revolution in the electric car industry.
1.1 Fundamentals of capacitors
Capacitor is one of the three basic passive circuit components of any electrical
circuit. They provide electrical energy to be stored over a relatively long charging time and
then released over short (microseconds-milliseconds) periods.
The capacitor can be modeled as two conducting plates with area A separated by a
dielectric as shown in Figure 1-3. When a voltage (V) is applied across the plates, a charge
+q accumulates on one plate and a charge -q on the other. The capacitance, a characteristic
of the charge storage capability is expressed as:

4
𝐶 =𝑄
𝑉= 𝜖𝑟𝜖0
𝐴
𝑑 (1.1)
where ϵr is the relative permittivity or also known as the dielectric constant, and ϵ0 is the
permittivity of free space (ϵ0 = 8.854 x 10⁻¹² F/m).
Figure 1-2 Various generations of capacitor: (a) Leyden jar is a glass vessel coated inside
and out by conducting electrodes; (b) cylindrical capacitor is a rolled-up parallel plate
capacitor; (c) the multilayer capacitor with its staggered electrodes. [3]
(a) (b)
(c)
5
1.1.1 Static electric field
The relationship between the static electric field E and the electric displacement D
can be derived from Maxwell equations:
𝐷 = 𝜖E (1.2)
where ϵ is the dielectric permittivity. In isotropic media, the relative permittivity
(ϵr) is given by ratio of dielectric permittivity (ϵ) and permittivity of free space (ϵ0).
𝜖𝑟 =𝜖
𝜖0 (1.3)
Instead of free space, let us consider a capacitor with a dielectric material inserted
between the two plates. The material will respond to the applied field by redistributing its
charge components, which will induce polarization charges P at the surface of the material.
In this case, a part of the charge density qs (qs = Q/A) is free charge as in the case of free
space. Another significant part of the charge density qs is bound at the boundaries of P for
charge compensation on the surfaces of the material in contact with the metal plates. This
bound surface qb is opposite in polarity and equal in magnitude to P. This can be
mathematically stated as:
𝑞𝑠 = (𝑞𝑠 − 𝑞𝑏) + 𝑞𝑏 = 𝐷 = 𝜖0𝐸 + 𝑃 = 𝜖𝑟𝜖0𝐸
= 𝜖0𝐸 + 𝜖0 (𝜖𝑟 − 1)𝐸 (1.4)
Polarization can be expressed as:
𝑃 = 𝜖0 (𝜖𝑟 − 1)𝐸 = 𝜖0𝜒𝑒𝐸
=𝑏𝑜𝑢𝑛𝑑 𝑐ℎ𝑎𝑟𝑔𝑒
𝑠𝑢𝑟𝑓𝑎𝑐𝑒 𝑎𝑟𝑒𝑎 (1.5)

6
= 𝑛𝑢𝑚𝑏𝑒𝑟 𝑜𝑓 𝑖𝑛𝑑𝑢𝑐𝑒𝑑 𝑑𝑖𝑝𝑜𝑙𝑒 𝑚𝑜𝑚𝑒𝑛𝑡
𝑣𝑜𝑙𝑢𝑚𝑒= 𝑁⟨�⃗� ⟩
where ⟨�⃗� ⟩ is the average dipole moment, 𝜒𝑒 is defined as the electric susceptibility.
Figure 1-3 Schematic of parallel plate configuration.
1.1.2 Time-varying electric field
When a time-varying voltage is applied to the dielectrics, the conduction current can be
expressed as:
𝐽𝑇 = 𝐽 + 𝑑𝐷
𝑑𝑡 (1.6)
where J is the conduction current. Consider a time-varying electric field is monochromatic
and a sinusoidal function with angular frequency ω as shown below:
𝐸 = 𝐸𝑚 exp(𝑗𝑤𝑡) (1.7)

7
Complex permittivity needs to be considered in this case and can be expressed as:
𝜖∗ = 𝜖′ − 𝑗𝜖′′ = (𝜀𝑟′ − 𝑗𝜀𝑟
′′)𝜖0 (1.8)
where 𝜀𝑟′ is the real part of the complex permittivity, also referred to as the dielectric
constant, and 𝜀𝑟′′ is the imaginary part. From here, the relative magnitude of losses can be
estimated by the dissipation factor (DF) or the loss tangent (tan δ), defined as:
tan δ = 𝜀𝑟′′
𝜀𝑟′ (1.9)
In a physical sense, the dielectric loss (tan δ) is due to the movement or rotation of
atoms or molecules in an alternating electric field. These losses depend on the temperature
as well as the frequency of the applied voltage. The dipoles or molecules cannot keep up
with change in the electric field when frequency is increased. The rotation of dipoles or
their ease of movement is a temperature dependent process, which will increase with rise
in temperature. Consequently, dielectric loss is directly proportional to both frequency and
temperature. There’s another loss in dielectrics known as the conduction loss, which
represents the flow of actual charge through the dielectric and occurs mostly at high field
and high temperature.
The capacitor under an AC field can be expressed by an equivalent diagram as
shown in Figure 1-4, where resistive component represents the loss. The quality factor (Q)
of a capacitor represents the efficiency of a given capacitor in terms of energy losses. It is
defined as:
𝑄 =𝑋𝑐
𝑅𝑐=
1
𝜔𝐶𝑅𝐶 (1.10)
where Xc is the reactance of the capacitor, C is the capacitance, Rc is the equivalent series
resistance and ω is the frequency at which the measurement is taken.

8
The dissipation is related to the quality factor by:
tan δ = 1
𝑄 (1.11)
The total current under electric field with a frequency of ω may be written as:
𝐽𝑇 = 𝐽 + 𝜖∗ 𝑑𝐸
𝑑𝑡= 𝜎𝐸 + 𝑗𝜔(𝜖′ − 𝑗𝜖′′)𝐸 (1.12)
Figure 1-4 Equivalent circuit diagram of a capacitor under AC field.
1.1.3 Polarization mechanisms
The frequency dependence of the real and imaginary parts of the permittivity are shown in
Figure 1-5. Each dielectric mechanism has a characteristic relaxation frequency. There are
four main types of polarization mechanisms:1) Electronic; 2) Atomic; 3) Orientational; 4)
Space-charge. [10]

9
Electronic polarization is associated with elastic displacement of electron cloud with
respect to nucleus under the influence of applied electric field. Atomic polarization is due
to displacement of ions/atoms. Both electronic and atomic polarization occur at frequencies
in the optical (>1015 Hz) and infrared (1012-1014 Hz) range, respectively. Thus, they are
classified in the resonance regime. Also, both the mechanisms are temperature
independent, as the phenomenon is intramolecular in nature. These mechanisms occur at
high frequencies and are instantaneous, which gives an indication that the dielectric
contribution in this regime is relatively smaller, irrespective of the polymer being polar or
non-polar. [11]
Orientation or dipolar polarization exists in polar materials consisting of dipoles,
for example, water has a permanent dipole in the structure. When electric field is applied,
the dipoles align along the direction of field, resulting in a net finite dipole moment per
molecule. The net polarization contributes to the effective dielectric constant of the
polymer. These dipoles need energy to overcome the resistance offered by the surrounding
molecules, which can be provided by thermal energy. Thus, this phenomenon is strongly
temperature dependent. When the field is removed, these dipoles take time to relax back to
the equilibrium. Hence, this type of polarization falls in the relaxation regime, and usually
this relaxation happens in audio frequencies.
Space charge polarization, also known as Maxwell-Wagner-Sillars interfacial
polarization occurs whenever there is an accumulation of charge at an interface between
two materials or between two regions within a material. The simplest example is interfacial
polarization due to the accumulation of charges in the dielectric near one of the electrodes.

10
It can also be due to the presence of impurities, non-homogeneity or incomplete contact of
the film with the electrode, which leads to regions of accumulated trap charges in the
dielectric medium. This mechanism is observed at low frequencies (<103 Hz). [10], [11]
In the presence of electronic, ionic, and dipolar polarization mechanisms, the
average induced dipole moment per molecule will be the sum of all the contributions in
terms of the local field.
𝑝𝑎𝑣 = 𝛼𝑒𝐸𝑙𝑜𝑐 + 𝛼𝑖𝐸𝑙𝑜𝑐 + 𝛼𝑑𝐸𝑙𝑜𝑐 (1.13)
where αe is the electronic polarizability, αi is the ionic polarizability and αd is the
dipolar polarizability. Each effect adds linearly to the net dipole moment per molecule.
Interfacial polarization cannot be simply added to the above equation because it occurs at
the interface and cannot be put into an average polarization per molecule in the bulk. [10]

11
Figure 1-5 The frequency dependence of the real and imaginary parts of the dielectric
constant in the presence of various polarization mechanism. [10]
1.1.4 Energy storage
During the charging and discharging of a capacitor, the stored (charged) and released
(discharged) energy density (Ue) can be calculated by the equation [12]
𝑈𝑒 = ∫𝐸𝑑𝐷 (1.13)
In linear dielectrics, the ratio between the polarization and the electric field is constant and
has typical P-E response as shown in Figure 1-6. For linear dielectrics, the equation can be
simplified to:
𝑈𝑒 = 1
2𝜀0𝜀𝑟𝐸
2 (1.14)

12
Other class of dielectrics are called non-linear dielectrics. They can be further divided into
three classes: relaxor ferroelectric, ferroelectric, and anti-ferroelectric. The P-E curves of
these materials are summarized in Figure 1-6.
Figure 1-6 Polarization-electric field responses of: (a) linear; (b) relaxor ferroelectric; (c)
ferroelectric; (d) anti-ferroelectric [13].
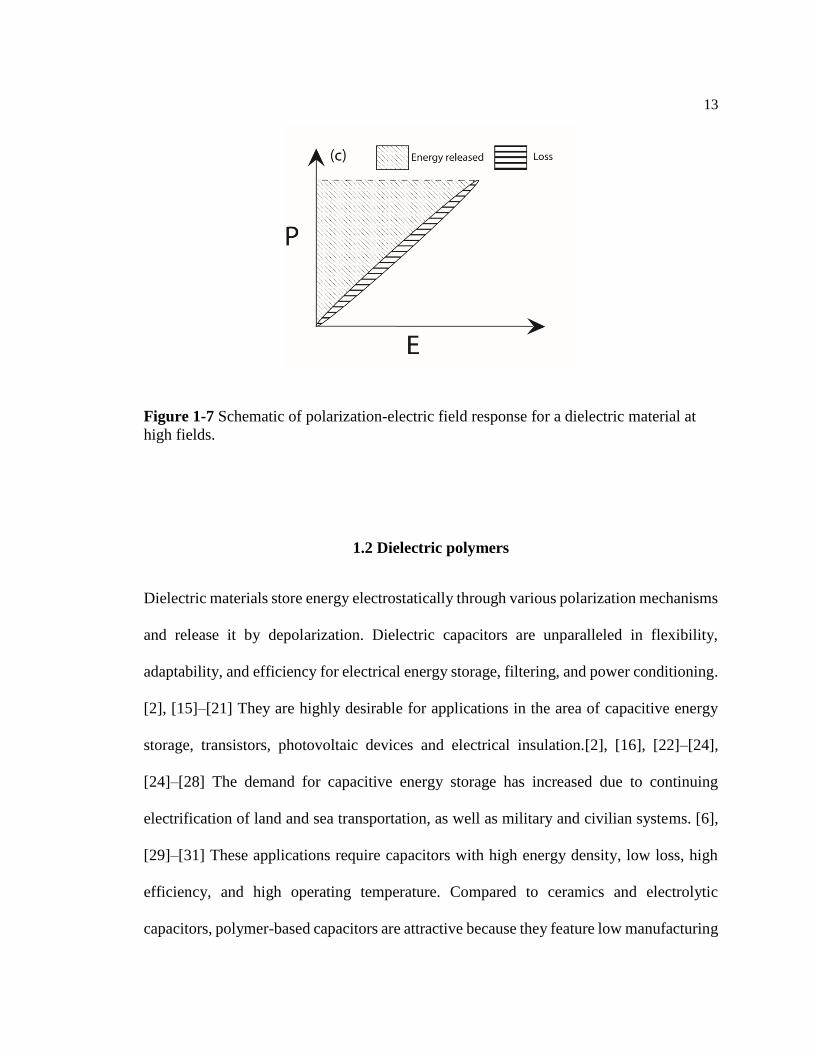
During the high field charging and discharging, most dielectrics exhibit a non-linear
increase of losses from the polarization hysteresis and high field conduction, especially at
fields greater than 100MV/m. This non-linear relationship between energy loss and the
electric field makes it very difficult to predict the high field loss from that at low electric
field. To make a quantitative comparison, Wu et. al. introduced the energy storage
efficiency (ƞ) for the charge-discharge cycle at high fields in Figure 1-7. [14]
𝜂 =𝑈𝑟
𝑈𝑠= 1 −
𝑈𝑙
𝑈𝑠 (1.15)
where the Us, Ur, and Ul are the charged, discharged and electrical loss energy densities in
the charging-discharging cycle respectively. The high field loss can be defined as 1- ƞ.
13
Figure 1-7 Schematic of polarization-electric field response for a dielectric material at
high fields.
1.2 Dielectric polymers
Dielectric materials store energy electrostatically through various polarization mechanisms
and release it by depolarization. Dielectric capacitors are unparalleled in flexibility,
adaptability, and efficiency for electrical energy storage, filtering, and power conditioning.
[2], [15]–[21] They are highly desirable for applications in the area of capacitive energy
storage, transistors, photovoltaic devices and electrical insulation.[2], [16], [22]–[24],
[24]–[28] The demand for capacitive energy storage has increased due to continuing
electrification of land and sea transportation, as well as military and civilian systems. [6],
[29]–[31] These applications require capacitors with high energy density, low loss, high
efficiency, and high operating temperature. Compared to ceramics and electrolytic
capacitors, polymer-based capacitors are attractive because they feature low manufacturing
14
cost and low dielectric loss, can be used under high voltage due to high breakdown strength,
and fail gracefully with an open circuit.[2], [15], [16] In many of these devices and systems,
capacitors constitute a substantial fraction of volume and weight (>30% volume and
weight).[7], [8], [32] To meet the demand of continued miniaturization of modern
electrical and electronic systems, the energy density of dielectric polymers must be
improved. In general, the energy stored in a capacitor is proportional to the dielectric
constant and the square of the electric field. Therefore, the materials of interest should
display high dielectric constant and high breakdown strength.
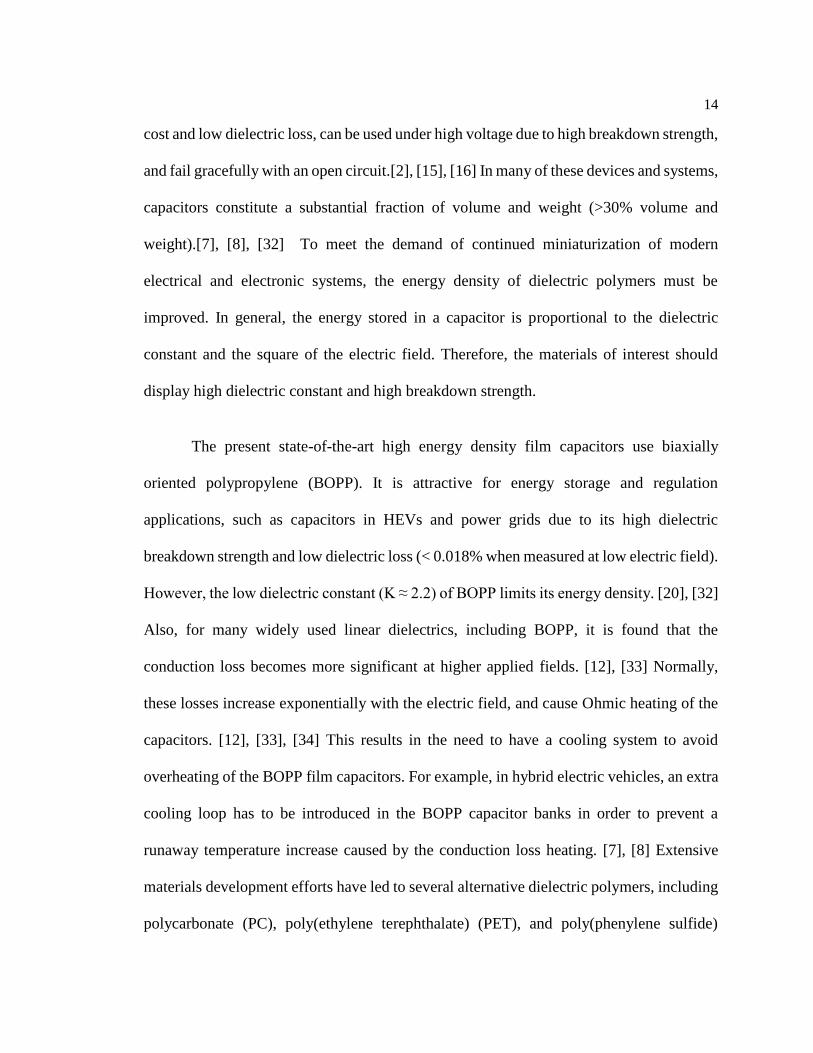
The present state-of-the-art high energy density film capacitors use biaxially
oriented polypropylene (BOPP). It is attractive for energy storage and regulation
applications, such as capacitors in HEVs and power grids due to its high dielectric
breakdown strength and low dielectric loss (< 0.018% when measured at low electric field).
However, the low dielectric constant (K ≈ 2.2) of BOPP limits its energy density. [20], [32]
Also, for many widely used linear dielectrics, including BOPP, it is found that the
conduction loss becomes more significant at higher applied fields. [12], [33] Normally,
these losses increase exponentially with the electric field, and cause Ohmic heating of the
capacitors. [12], [33], [34] This results in the need to have a cooling system to avoid
overheating of the BOPP film capacitors. For example, in hybrid electric vehicles, an extra
cooling loop has to be introduced in the BOPP capacitor banks in order to prevent a
runaway temperature increase caused by the conduction loss heating. [7], [8] Extensive
materials development efforts have led to several alternative dielectric polymers, including
polycarbonate (PC), poly(ethylene terephthalate) (PET), and poly(phenylene sulfide)

15
(PPS) with high operating temperatures (>125°C). However, the dielectric constant of
these polymers is still below 3.3. [20], [35] Table 1-1 summarizes the dielectric properties
of polymers used in industry and some recently developed dielectric polymers in research
labs.
On the other hand, the strong coupling among dipoles have led to high dielectric
constants of polyvinylidene fluoride(PVDF)-based ferroelectric polymers (K > 10). [15]–
[17], [36] By proper defect modifications of PVDF-based polymers, it has been shown that
these polymers can achieve either a high dielectric constant at room temperature (K > 50)
or a very high energy density (> 25 J/cm3). [37]–[39] However, the strong dipolar coupling
in these ferroelectric polymers causes high polarization hysteresis loss. The operating
temperature is still limited to below 100°C due to low Tm (< 140°C). Nevertheless, the
results demonstrate the potential of tailoring nano and meso-structures of dielectric
polymers to achieve high dielectric performance.
Table 1-1 Summary of dielectric materials studied for capacitor applications. [20], [40]

16
Material
Dielectric
Constant
(25°C)
Dielectric
Loss at
1 kHz
(10-3)
Working
Temperature
(°C)
Dielectric
Strength
(MV/m)
Energy
Density at
Breakdown
Strength
(J/cm3)
BOPP 2.2 0.2 90 820 6.2
PTFE 2.1 0.5 260 300 2.1
Solvent-cast PC 3.1 1.3 125 <820 9.2
Cyano-PC 3.2 3 180 710 7.1
PhONDI 3.2 7.8 150 350 1.7
PPS 3.1 0.5 150 470 3
PEEK 3.2 4 150 320 1.4
PEI 3.2 2 200 460 3
FPE 3.3 2.6 275 - -
PI 3.3 2 300 300 1.3
PEN/Si3N4 3.7 7 125 578 5.4
Polyurea 4.2 5 180 800 12
Nanolayer
PCPVDF-
HFP
4.6 10 125 750 14
Cyano-PEI 4.7 3 220 745 11.5
Modified polyurea 5.2 6.8 150 >700 >12
Modified PI 4–7 5 10 250 - -
Siloxane 8.6 60 150 - -
P(TFE-co-VDF) 10.2 30 270 >225 >2
PVDF-CTFE 11 50 125 750 27
Alkali-free barium
boroaluminosilicate
glass
6 5 180 >1000 >30

17
1.3 Statement of goals, objectives and dissertation organization
The objective of this work is to design nanostructured dielectric polymers based on
fundamental polymer physics for developing high energy storage capacitors. Considering
the rich polymer chemistry available for modifying and tuning the nanostructures, the new
directions developed by this dissertation will work towards the goal to generate polymeric
materials with high dielectric constant, low loss, high breakdown strength and high
operating temperature.
Chapter 2 and Chapter 3 discuss an unconventional approach to improve the
dielectric properties by introducing free volume in the dipolar polymers. The two
approaches: introducing disorder and blending of polymers, have been extensively
discussed. The introduction of free volume improves the dielectric constant while
maintaining low loss.
Chapter 4 discusses a nanocomposite approach, where addition of small amounts
of inorganic nanoparticles in PEI can improve the dielectric constant. This is a very
promising approach for engineering nanostructures by introducing nanofillers with
dielectric constant similar to that of the matrix, to achieve markedly enhanced dielectric
response.
In Chapter 5, the high field conduction and breakdown properties of dipolar
polymers is studied. The high quality thin films of the polyurea show colossal breakdown
strengths, demonstrating that introduction of polar units can be effective in scattering of
mobile charges, and defect free thin films can achieve high breakdown strength. In
addition, an approach to reduce the conduction loss in a semi-crystalline polymer, which

18
has been shown to be attractive for high energy storage capacitors has been discussed.
Experimental results show that introduction of tiny volume content of these nanoparticles
can dramatically reduce the conduction loss, thus making it practical for high temperature
operation.
Figure 1-8 Organization flow of the objectives of this dissertation.
Rational design of polymers
Approaches to improve the dielectric constant
Free volume approach
Introducing disorder in dipolar polymers
Blending of two dipolar polymers
Nanocomposite approach
Enhanced dielectric response using low volume content of inorganic dopants
Study of high field behaviour and
conduction loss
Ultra-thin films with high dipole moment
units
Doping of semi-crystalline polymer with low volume content of fillers

19
Chapter 2
Introduction of free volume to achieve high dielectric constant in
dipolar polymers
2.1 Introduction
In Chapter 1, we discussed the fundamentals of capacitors, and dielectric properties
of state-of-the-art polymers. The dielectric constant of these high energy density polymers
is still below 3.3. [15], [16], [20], [41] There has been many studies in the past where efforts
have been made to improve the dielectric constant. [11], [16], [20], [36], [42]. Still, for
next generation of materials, rational design of materials holds the key to fundamental
advances in energy storage, and is a smarter approach – given the exhaustive set of
materials available for selection. In dielectric polymers, a necessary condition for achieving
high dielectric constant is that they contain dipoles in the polymer chains. Strong coupling
among the dipoles can lead to high dielectric constant, as have been observed in semi-
crystalline polyvinylidene fluoride (PVDF)-based ferroelectric polymers (K > 10). [16],
[36] However, the strong coupling among dipoles causes large hysteresis loss, not desirable
for most polymer capacitor applications. Strongly-dipolar materials, in which dipole
moment is larger than 3 Debye with weak dipolar coupling have the potential to reach
relatively high dielectric constant than the widely used non-polar polymers including the
state-of-the-art dielectric polymer BOPP, and exhibit a lower loss. The dipole moments of
some functional groups of dielectric polymers are summarized in Table 2-1.

20
To reduce or even eliminate the polarization hysteresis loss, Zhang et. al. have
developed a class of amorphous polymers, containing high density dipoles of high dipole
moment, i.e., urea and thiourea (see Figure 2-1). [43]–[46] It has been shown that by
increasing the dipole moment and the dipole density, the dielectric constant in this series
of polymers increases from 4.1 to 5.7. The high dipole moments in these amorphous
polymers provide strong polar-scattering centers and traps, which significantly reduces the
conduction loss at high electric fields. As a result, these polymers exhibit an improved
electrical energy density than BOPP. [43] The high glass transition temperature also leads
to a higher operating temperature. In strongly dipolar polymer materials, such as the
polyurea and polythiourea, the orientation polarization is the dominant polarization
mechanism compared with the electronic, atomic or ionic polarization.
Table 2-1 Dipole moments of common dipolar units present in dielectric polymers. [15]
Dipole units Dipole moment (Debye)
Urea 4.56
Diphenyl urea 4.6
Thiourea 4.89
Diphenyl thiourea 4.9
PVDF 2.1

21
Urea Thiourea
Figure 2-1 Dipolar structure of urea and thiourea units. [47]
Compared with other models, the Frohlich model takes both the short-range
interaction between molecules, and the deformation polarizations into consideration. This
model has been used widely to describe the dielectric response in polymers. [48] In this
model, the dielectric constant, or the relative permittivity is proportional to the dipole
moment, volumetric dipole density, and correlation factor between the dipoles. It is given
as:
kT
Ngp
rrs
rrsrrs
0
2
2 9)2(
)2)((
(2.1)
where ϵrs, ϵr∞ are the dielectric constants at low frequency and optical frequency
respectively; N is the volumetric dipole density; g is the correlation factor; p is the dipole
moment; k is the Boltzmann constant; T is the temperature.

22
Four dielectric polymers based on polyurea and polythiourea have been developed, which
include aromatic polyurea (ArPU), aromatic polythiourea (ArPTU), meta-phenylene
polyurea (m-PhPU/meta-PU) and methylene polythiourea (MePTU), to study the influence
of dipole moment and dipole density on the dielectric properties. Figure 2-2 shows the
chemical structure of these polymers and Table 1.3 summarizes their dielectric properties.
Figure 2-2 Schematics of (a) aromatic polyurea (ArPU), (b) aromatic polythiourea
(ArPTU), (c) meta-phenylene polyurea (m-PhPU/meta-PU), and (d) methylene
polythiourea (MePTU). [50]
The enhanced dielectric constant observed in meta-PU is hard to explain by using
the Frohlich model as its difficult to experimentally predict the value of correlation factor
(g) shown in equation 2.1. The localized free volume can be used to explain the increased
dielectric constant of meta-PU and other dipolar polymers. In this chapter, free volume
theory is reviewed, followed by discussion of local free volume introduced by free volume.

23
Table 2-2 Summary of dielectric properties of ArPU, ArPTU, m-PhPU and MePTU. [50]
Polymer Dielectric constant
(1 kHz)
Loss
tangent
(1 kHz)
Breakdown
strength
Eb (MV/m)
Energy density at Eb
(J/cm3)
ArPU 4.1 0.87% 800 13.5
ArPTU 4.4 0.64% > 1000 20.1
meta-PU 5.7 1.71% 670 13
MePTU 5.7 1.55% 500 7.5
2.2 Review of free volume theory
Free volume is a semi-quantitative concept which has been employed in statistical
thermodynamic theories of the liquid state. (Lennard-Jones and Devonshire, 1939 [51],
[52]; Glasstone, Laidler and Eyring, 1941 [53]; Frenkel, 1946 [54]; Fowler and
Guggenheim, 1956 [55]. The earliest definition, according to Glasstone, Laidler and Eyring
(1941), of free volume is that it may be regarded as the volume in which each molecule of
a liquid moves in an average potential field due to its neighbors. However, theoretical
estimates of free volume depend on postulates regarding the compressibility of the
molecules and the nature of their packing in the liquid state. [55]
In terms of solids, the molecular motion in the bulk state depends on the presence
of vacancies, or voids. A similar model can be constructed for the motion of polymer

24
chains, the main difference being presence of multiple voids may be required to be in the
same locality, as cooperative motions are required. Therefore, for a polymeric segment to
move from its present position to an adjacent site, a critical void volume known as free
volume must first exist before the chain segments can move. [56] In molecular substances,
the transition from liquid to glass results in marked changes in viscosity, specific heat, and
thermal expansion coefficient within a narrow temperature interval centering about a glass
transition temperature (Tg). Thus, above Tg the marked changes in specific volume reduces
the constraints on the movement of polymer chain segments.
The definition of free volume often used in polymer studies is given by Doolittle
[57]–[59], which is given below:
if = v-vo (2.2)
where vf is the free volume per gram, v is the measured specific volume of the
polymer at temperature T and vo is termed as the occupied volume. In Doolittle’s studies,
vo is taken as the value of v extrapolated to 0°K and is therefore regarded as a constant
independent of temperature. This definition assumes that vf must tend to zero as the
temperature tends to absolute zero, and that the increase of v with temperature, due to
thermal expansion, is associated entirely with an increase in vf.
The basic idea underlying the free volume approach to relaxation phenomena is that
the molecular mobility at any temperature is dependent on the available free volume at that
temperature. As temperature increases, the free volume increases and molecular motions
become more rapid. A few molecular theories based on this free volume concept have been
proposed, with the ultimate aim of relating dynamic quantities such as the diffusion
coefficient, viscosity or relaxation time to free volume. [55], [56] These theories are

25
applicable to the liquid-like state and can therefore be applied to amorphous polymers at
temperature of the order of and above Tg. Figure 2-3 summarizes the conventional free
volume definition.
Figure 2-3 Schematic diagram illustrating free volume as calculated by Simha and
Boyer.[56]
It is important to note that the concept of “free volume” discussed in this work is focused
mainly on localized free volume pertaining to local motions in the polymer chain. Thus, it
is dependent more on the local nanostructures created than the glass transition of the
material. Fundamental dielectric theory suggests that strongly dipolar polymers have the
potential to realize a high dielectric constant. [55] In order to achieve high thermal stability,
these polymers should also possess a high glass transition temperature Tg. It has been

26
observed that in many dipolar polymers, the dielectric constant decreases markedly at
temperatures below Tg due to constraints of the glassy structure on the dipoles. In contrast,
at temperatures above Tg, the reduced constraints on the dipoles due to increased free
volume, lead to a large increase in dielectric constant. For example, polyvinyl chloride
(PVC), a simple polymer glass, exhibits a large increase in dielectric constant after
undergoing its glass transition, from K~3 below Tg to K>9 above Tg. [55], [60] The penalty
is that the dielectric loss also becomes high at temperatures above Tg (loss > 5%) due to
cooperative segmental motions in the rubbery state, which have long relaxation times. The
challenge is to introduce this excess free volume in strongly dipolar polymers at
temperatures far below Tg, thereby a relatively high dielectric constant may be achieved
without the penalty of high dielectric loss.
In this chapter, it has been shown that disorder in strongly dipolar polymers creates
a significantly larger free volume at temperatures far below Tg, enabling easier
reorientation of dipoles in response to an electric field in aromatic urea and thiourea
polymers. The net result is a substantial enhancement in the dielectric constant while
preserving low dielectric loss and high breakdown strength.
27
2.3 Experimental section
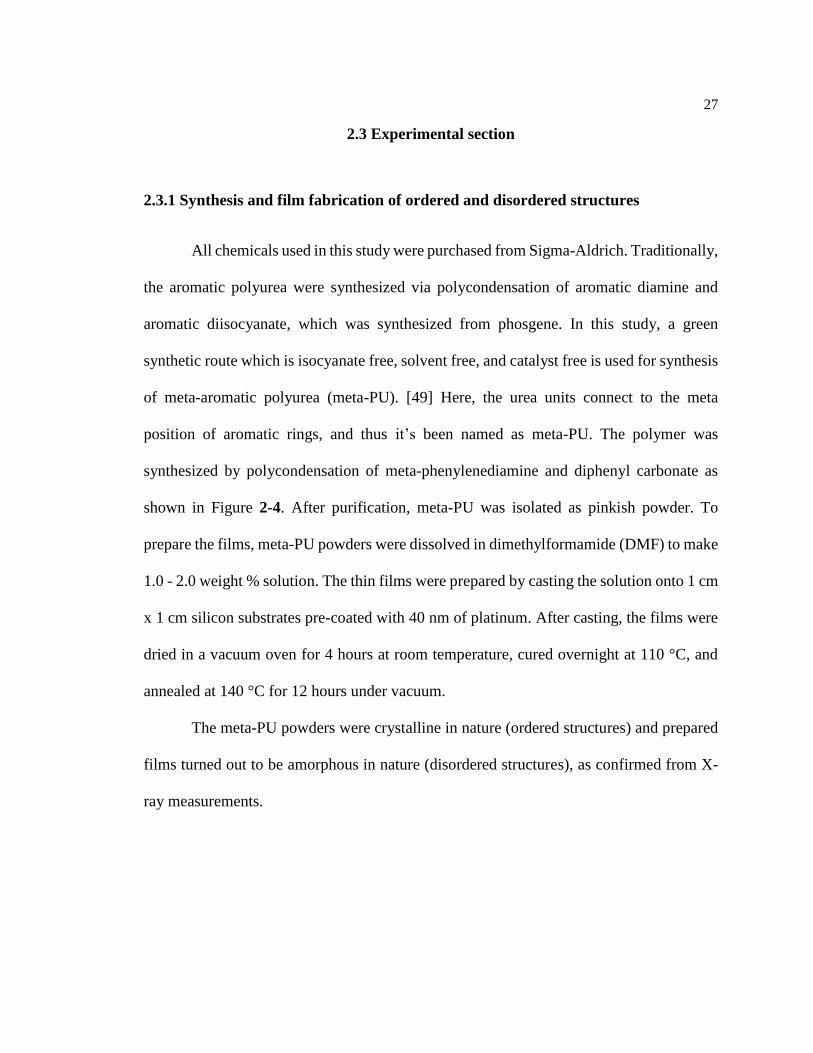
2.3.1 Synthesis and film fabrication of ordered and disordered structures
All chemicals used in this study were purchased from Sigma-Aldrich. Traditionally,
the aromatic polyurea were synthesized via polycondensation of aromatic diamine and
aromatic diisocyanate, which was synthesized from phosgene. In this study, a green
synthetic route which is isocyanate free, solvent free, and catalyst free is used for synthesis
of meta-aromatic polyurea (meta-PU). [49] Here, the urea units connect to the meta
position of aromatic rings, and thus it’s been named as meta-PU. The polymer was
synthesized by polycondensation of meta-phenylenediamine and diphenyl carbonate as
shown in Figure 2-4. After purification, meta-PU was isolated as pinkish powder. To
prepare the films, meta-PU powders were dissolved in dimethylformamide (DMF) to make
1.0 - 2.0 weight % solution. The thin films were prepared by casting the solution onto 1 cm
x 1 cm silicon substrates pre-coated with 40 nm of platinum. After casting, the films were
dried in a vacuum oven for 4 hours at room temperature, cured overnight at 110 °C, and
annealed at 140 °C for 12 hours under vacuum.
The meta-PU powders were crystalline in nature (ordered structures) and prepared
films turned out to be amorphous in nature (disordered structures), as confirmed from X-
ray measurements.

28
Figure 2-4 Schematic of synthesis of meta-PU.
Poly(arylene ether urea) (PEEU) was prepared from (m-phenylenedioxy) dianiline
and diphenyle carbonate by thermal poly condensation as shown in Figure 2-5. [46] The
mixture of the two monomers was stirred at 150 ℃ in vacuum for 4 hours, and PEEU
powder was obtained through purification with ethanol for 5-6 times. PEEU films were
prepared by dissolving the powders in DMF at elevated temperature, and solution cast at
80 ℃ for 2 days, followed by annealing at 150 ℃ for 2 days. After casting, the films were
dried in a vacuum oven for 4 hours at room temperature, cured overnight at 70 °C, and
annealed at 110 °C for 12 hours and then at 140 °C for 24 hours under vacuum.
Similar to meta-PU, the PEEU powders were crystalline in nature (ordered
structures) and prepared films turned out to be amorphous in nature (disordered structures),
as confirmed from X-ray measurements.
Figure 2-5 Schematic of synthesis of PEEU.

29
2.3.2 Measurement of dielectric properties of polymer powders
It is not easy to directly measure the dielectric constant of polymer powders. Here
a composite approach, i.e., mixing the powder with a fluid that does not affect the powder,
was employed for the dielectric characterization. Gold-sputtered glass slides were used as
the electrodes to form a parallel-plate capacitor. The electrodes were separated by Kapton
tape spacers with thickness of 64 µm. The area of the electrode was 1 cm x 1 cm (and
repeated with 0.5 cm x 0.5 cm electrode area). In order to measure the dielectric constant
of the meta-PU powder, we mixed the powder with dielectric fluids of different dielectric
constants and used the Lorenz-Lorentz equation (Equation (2.3)) [61] to deduce the
dielectric constant of the meta-PU powder from the dielectric constant of the mixture Ke.
It is noted that these dielectric fluids do not dissolve the meta-PU powder (as verified by
the X-ray diffraction data of the mixture). In the case of a two-phase, three-dimensional
medium, the Lorenz-Lorentz theory yields the following expression for eK in terms of the
dielectric constant1K (meta-PU powder),
2K (the fluid) and the powder volume fraction p1
of the mixture.
)2(
)(
2
)(
21
211
2
2
KK
KKp
KK
KK
e
e
(2.3)
High precision data can be obtained if the dielectric constant of the fluid is close to
that of the powder. The rationale behind this approach was that if the capacitance of a cell
filled with the reference fluid is lowered by adding powder, the dielectric constant of the
powder is lower than that of the fluid.

30
2.3.3 Details of characterization equipment
The dielectric data was obtained by using a HP 4294A Precision Impedance
Analyzer. The dielectric properties at variable temperature were measured using an HP
4284 impedance analyzer, which was connected to an environmental test chamber (Delta
9023). The Polarization-Electric field (P-E) response was measured with a modified
Sawyer-Tower circuit. The charged (stored) energy density, discharged (released) energy
density and efficiency were calculated from the P-E loop. The X-ray diffraction data were
collected using a Panalytical Xpert Pro MPD diffractometer.
2.4 Results and discussion
One of the ways to generate free volume in dipolar polymers is by introducing
disorder. In this work, through a combined theoretical and experimental investigation, it
has been shown that a disordered polymer with high Tg can be realized in several recently
developed strongly-dipolar polymers based on aromatic urea and thiourea units, with
dipole moments of 4.5 Debye and 4.89 Debye respectively,[50] which are much higher
than for VDF in PVDF based polymers, with the dipole moment of 2 Debye.[62] The
theoretical results are discussed briefly here and details of simulation work can be found at
Ref. [45], [63]. meta-PU was chosen because of its high dipole moment (4.5 Debye). The
theoretical results show that the specific volume is ~12% larger in the disordered structures
compared to the ordered structure of meta-PU. The larger volume gives urea units more
free space to reorient, thus large dipolar motion can lead to a larger permittivity. This was
confirmed by the experimental study of ordered and disordered structures. To compare

31
with the theoretical results, meta-PU with ordered (crystalline) and disordered (amorphous)
phases were prepared. It is interesting to note that the as synthesized meta-PU powder
shows relatively sharp X-ray diffraction peaks, visible in Figure 2-6 (a), indicating the
presence of a crystalline phase. In contrast, the films made from solution casting display a
broad X-ray peak centered at 2θ = 9.5°, shown in Figure 2-6 (b), indicating an amorphous
(disordered) structure.
Figure 2-7 shows DSC and TGA data. The DSC curves shows there is no glass
transition step up to 200°C. Also, TGA shows no sign of weight loss and transition below
200°C, which is a desirable feature for high temperature operation.
Figure 2-6 X-ray data for (a) ordered meta-PU structures; (b) films of disordered meta-
PU structure.

32
Figure 2-7 (a) DSC data and (b) TGA data of meta-PU.
The disordered structures (films) are discussed first. The dielectric properties of
meta-PU films are presented in Figure 2-8 (a) for the room temperature dielectric properties
as function of frequency and Figure 2-8 (b) for dielectric properties vs. temperature

33
measured at 1 kHz. The results show a high dielectric constant (K > 5.6) and low loss (loss
tangent ~ 1.5%) over a broad temperature range, due to the high glass transition
temperature. Even more importantly, the meta-PU films exhibit a linear dielectric response
and very low loss even at very high electric field, see Figure 2-8 (c) for the charge/discharge
curve at electric field close to 700 MV/m, measured at room temperature at 10 Hz. It is
the free volume effect (FVE) at temperatures below Tg (> 200°C) that leads to a high
dielectric constant (K > 5.6) in meta-phenylene polyurea (meta-PU).
The dielectric constant of meta-PU powder was measured by making slurries with
dielectric fluids of dielectric constant similar to the powder. Fluid (castor oil) with
dielectric constant of 4.7 was chosen to make slurry with meta-PU powder. The dielectric
constant of the mixture turns out as 4.6 at 1 kHz from the dielectric measurement. As shown
in Figure 2-9, the dielectric constant of the mixture of meta-PU powder (p1 = 25 vol %)
and castor oil (K2 = 4.75) is 4.5 (at 1 kHz), lower than that of the dielectric fluid, indicating
that the meta-PU powder has a dielectric constant smaller than 4.5. Using equation 2.3, the
calculated dielectric constant of the meta-PU powder is 3.8. The dielectric constant and
loss of disordered and ordered structure is summarized in the Figure 2-10.

34
Figure 2-8 (a) Dielectric constant vs. frequency, measured at room temperature; (b)
dielectric constant vs temperature, measured at 1 kHz; (c) P-E loop of meta-PU film.

35
Figure 2-9 Dielectric constant vs frequency for the mixture of meta-PU/castor oil (open
squares) and castor oil (open circles).
To further confirm that the results obtained here are not an isolated case, poly (arylene
ether urea) (PEEU) polymer (Figure 2-5) was also studied. Similar to meta-PU, the PEEU
powder shows sharp peaks, thus suggesting a crystalline phase (see Figure 2-11(a)). In
contrast, the solution-cast films display a broad X-ray peak (Figure 2-11(b)) indicating an
amorphous structure. The dielectric constant of PEEU films is 4.7, while the dielectric
constant of PEEU powder deduced from equation 2.3 using PEEU powder/fluid mixture is
3.65, which is smaller than that of the disordered structure (see Figure 2-12). The
experimental dielectric data of ordered and disordered structure is summarized in Table 2-
3.

36
Figure 2-10 (a) Dielectric constant and (b) dielectric loss as a function of frequency for
ordered and disordered structure of meta-PU.
(a)
(b)

37
Figure 2-11. X-ray data for (a) ordered PEEU structures, powder; (b) films of disordered PEEU
structure.
Table 2-3 Summary of experimental dielectric data of ordered and disordered structure of
meta-PU and PEEU.
Polymer Ordered structure (Powder) Disordered structure (Film)
meta-PU 3.8 5.7
PEEU 3.7 4.7
(a)
(b)
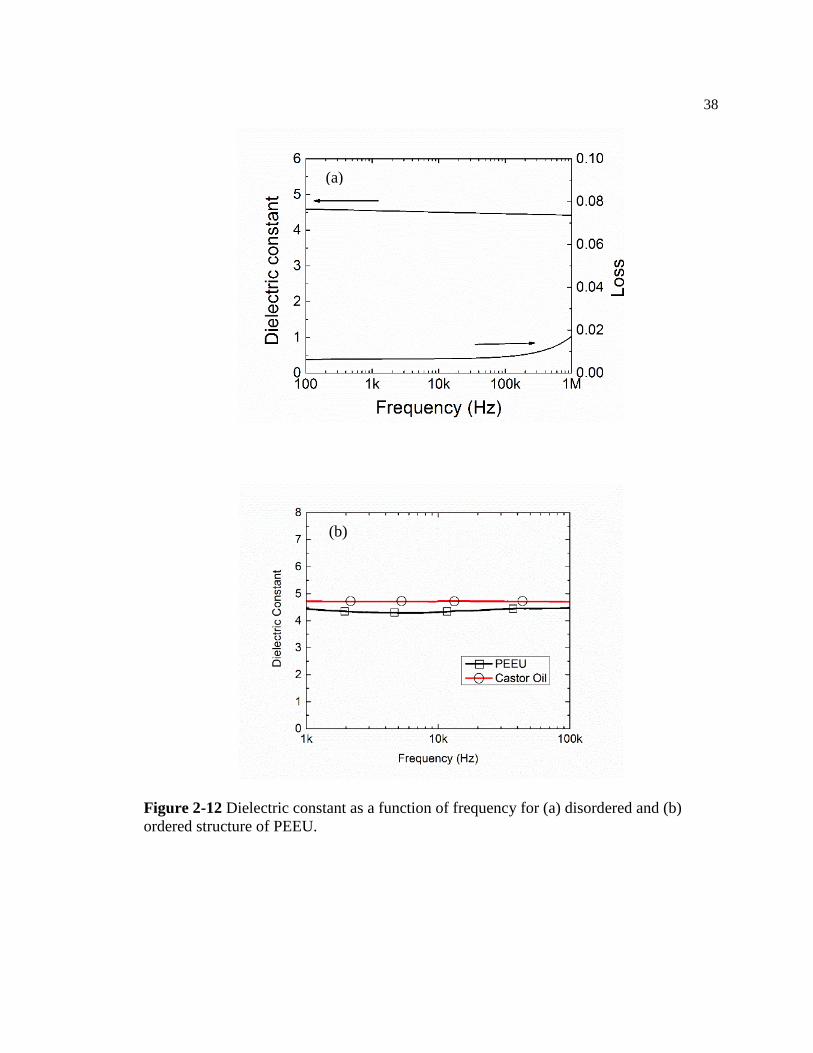
38
Figure 2-12 Dielectric constant as a function of frequency for (a) disordered and (b)
ordered structure of PEEU.
(a)
(b)

39
2.5 Conclusion
In conclusion, through combined theoretical and experimental studies, we show
that in meta-PU and PEEU, disordered phases exhibit higher dielectric constants compared
with those of ordered phases, due to the built-in free volumes in the disordered structures.
Localized free volumes in disordered phases of these strongly dipolar polymers at
temperatures far below the glass transition enable easier reorientation of dipoles in
response to an electric field, leading to high dielectric constants while preserving low
dielectric loss. At the same time, disorder enables longer wavelength vibrations, which also
increases permittivity. These concepts and the experimental results demonstrate a new and
promising approach for developing dielectric polymers with high dielectric constant, low
loss, and high operating temperature.
Acknowledgement
The part of this chapter has been published in Nanoenergy and IEEE Dielectrics and
Electrical Insulation Conference Proceedings. Reproduced here by the permission of
Elsevier.
[1] Y. Thakur et al., “Optimizing nanostructure to achieve high dielectric response with
low loss in strongly dipolar polymers,” Nano Energy, vol. 16, pp. 227–234, 2015
[2] Y. Thakur, M. Lin, S. Wu, and Q. Zhang, “Introducing free volume in strongly dipolar
polymers to achieve high dielectric constant,” in Electrical Insulation and Dielectric
Phenomena (CEIDP), 2015 IEEE Conference on, 2015, pp. 636–639

40
Chapter 3
Blending of dipolar polymers to enhance the free volume effect
3.1 Introduction
The understanding of localized free volume has been extended in this chapter
by blending two strongly dipolar polymers. Blending two polymers may create partial
mismatches between two dissimilar polymer chains, resulting in additional free volume.
Thus, reducing the constraints for dipole reorientation under applied field in the glassy
state, and raising the dielectric constant without causing high dielectric losses. Based on
these considerations, we investigate a class of nanostructured dipolar disordered polymers,
i.e., polymer blends. The introduction of blending in dipolar polymers increases the
dielectric constant significantly compared to the best state-of-the-art dielectric in current
use (biaxially oriented polypropylene, BOPP, K~2.2), while also tolerating much greater
operating temperature [1].
3.2 Experimental section
3.2.1 Synthesis and film fabrication of blends
All chemicals for synthesizing PEEU and ArPTU were purchased from Sigma-Aldrich.
ArPTU was synthesized via microwave-assisted polycondensation of diphenylmethane-diamino
(MDA) with thiourea in N-methyl-2-pyrrolidone (NMP) with p-toluenesulfonic acid (p-TSOH) as
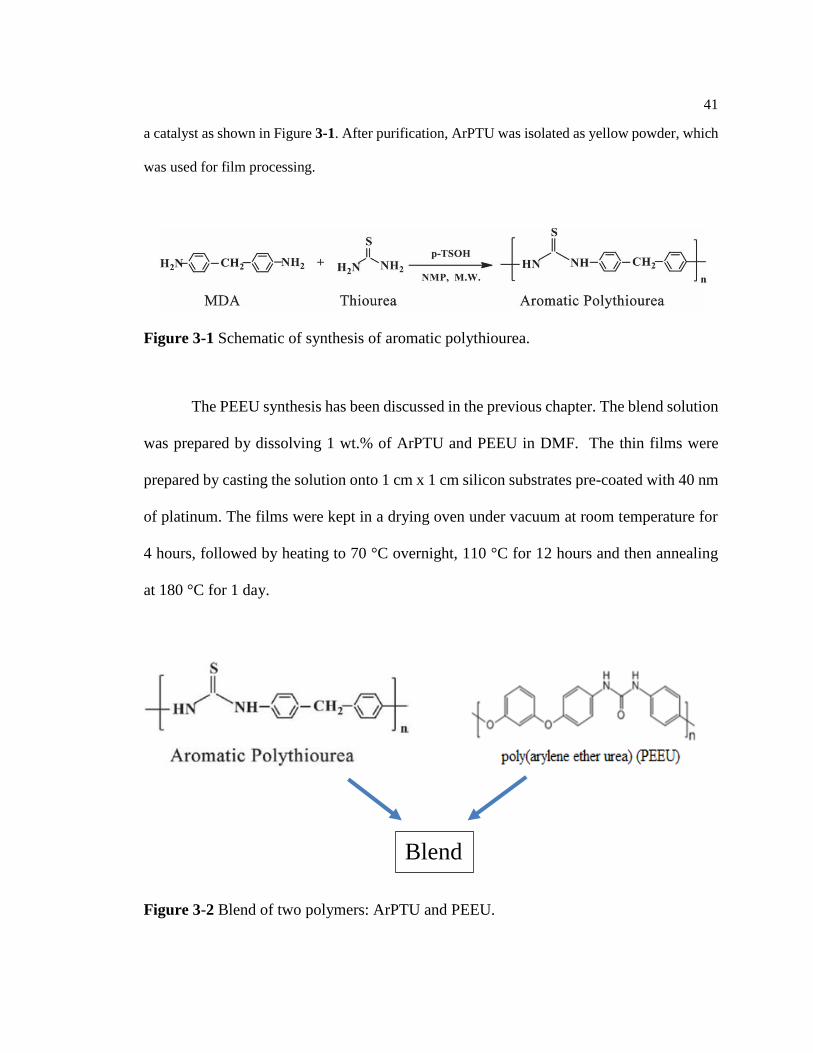
41
a catalyst as shown in Figure 3-1. After purification, ArPTU was isolated as yellow powder, which
was used for film processing.
Figure 3-1 Schematic of synthesis of aromatic polythiourea.
The PEEU synthesis has been discussed in the previous chapter. The blend solution
was prepared by dissolving 1 wt.% of ArPTU and PEEU in DMF. The thin films were
prepared by casting the solution onto 1 cm x 1 cm silicon substrates pre-coated with 40 nm
of platinum. The films were kept in a drying oven under vacuum at room temperature for
4 hours, followed by heating to 70 °C overnight, 110 °C for 12 hours and then annealing
at 180 °C for 1 day.
Figure 3-2 Blend of two polymers: ArPTU and PEEU.
Blend

42
3.2.2 Details of characterization equipment
The dielectric data was obtained by using a HP 4294A Precision Impedance
Analyzer and a Novocontrol GmbH Concept 40 broadband dielectric spectrometer. The
grazing incidence X-ray scattering data were collected using a Panalytical X’Pert PRO
MPD diffractometer. The wavelength of X-ray was 1.54 angstroms. Background scattering
was subtracted using JADE analysis software and then the peak position was calculated for
the individual polymers and blends. Atomic force microscopy (AFM) was performed using
a Bruker Dimension AFM in tapping mode. Thermal gravimetric analysis (TGA) was
carried out in N2 at a heating rate of 10°C/min using a 2050 TGA from TA Instruments.
Differential scanning calorimetry (DSC) was carried out using a TA instruments Q2000 to
probe the thermal behavior. The data were taken at a scan rate of 10°C/min during heating.
The negative heat flow represents endothermic (heat absorbed) direction.
3.3 Discussion of dielectric data
An aromatic polythiourea (ArPTU) and a poly(ether urea) (PEEU), see Figure 3-2
for the chemical structures, were chosen as the blend components. ArPTU and PEEU have
dipole moments of 4.5 Debye and 4.89 Debye, respectively, leading to relatively high
dielectric constants, K = 4.4 and K = 4.7 for the two polymers in the glassy state. The Tg
of both polymers is above 200°C. As presented in Figure 3-3 (a), the 1:1 blend (by weight)
of the two polymers exhibits remarkably high and reproducible dielectric constant (K =
7.5) while maintaining low loss (<1%). The inset in Figure 3-3 (a) shows the dielectric

43
constants of the individual polymers. This is the first report on a polymer with such a high
dielectric constant of 7.5 and sufficiently low loss (below 1%) with minimum frequency
dispersion to be used for capacitor applications. Figure 3-3 (b) displays the dielectric
properties vs. temperature (at 10 kHz), which shows that the blend exhibits a high dielectric
constant and low loss up to 120°C.
Blends with different PEEU/ArPTU ratios were also prepared and their
dielectric properties at room temperature and 1 kHz are summarized in Figure 3-3 (c) and
Table 3.1. A very large increase in the dielectric constant was also observed in blends with
different ratios of the two polymers. The dielectric loss of these blends (above and below
a 1:1 ratio) shows a slight increase (> 1%) compared to those of the constituent polymers
and the 1:1 PEEU:ArPTU blend. The increase in dielectric constant may be attributed to
the increased free volume. However, that increase in free volume can also result in larger
scale polymer chain motions, which increase the dielectric loss (>1%).
In order to examine the possible effect of any sub-Tg transitions (β and ɣ
relaxations) on the dielectric constant of the neat polymers and 1:1 blend [64], a broad band
dielectric spectroscopy study was carried out. As presented in Figure 3-3 (b) and Figure 3-
4, there are no sub-Tg transitions down to -150°C over a broad range of frequencies.
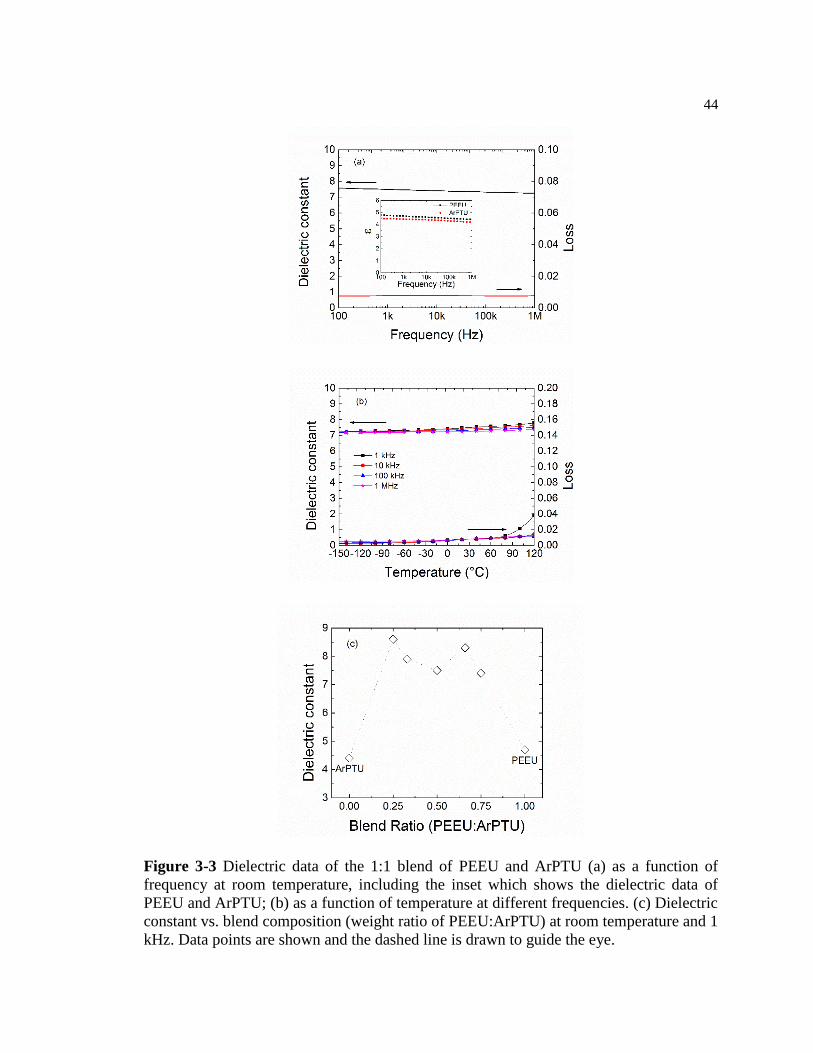
44
Figure 3-3 Dielectric data of the 1:1 blend of PEEU and ArPTU (a) as a function of
frequency at room temperature, including the inset which shows the dielectric data of
PEEU and ArPTU; (b) as a function of temperature at different frequencies. (c) Dielectric
constant vs. blend composition (weight ratio of PEEU:ArPTU) at room temperature and 1
kHz. Data points are shown and the dashed line is drawn to guide the eye.

45
Table 3-1 Summary of the dielectric properties of the neat polymers and blends at 25 ˚C
Polymer Dielectric Constant (1 kHz) Loss (1 kHz)
PEEU 4.7 1.1%
ArPTU 4.4 0.64%
Blend (1:1) 7.5 0.77%
Blend (1:2) 7.9 1.62%
Blend (1:3) 8.6 1.84%
Blend (2:1) 8.3 1.45%
Blend (3:1) 7.4 1.35%
To provide further insight into molecular and nanoscale mechanisms responsible
for the observed enhancement of the dielectric response in the blends, simulations of
ArPTU, PEEU, and blends of ArPTU:PEEU in various blend compositions were carried
by Prof. Jerry Bernholc’s group at North Carolina State University.[65] In the calculations
of the dielectric properties, they combine the results from both molecular dynamics (MD)
and density functional theory (DFT) simulations to obtain the permittivity. The blend
simulations reveal a significantly larger specific volume (see Figure 3-5 (a)) due to an
increase in interchain spacing, again in accordance with the experimental results.
Comparison of simulation and experimental data of dielectric constant vs. blend
composition (PEEU:ArPTU ratio by wt.) at room temperature is presented in Figure 3-5
(b). The calculated enhancements are smaller, probably due to the relatively small size of
the simulation cell, which does not fully capture the effects of nanoscale morphology,
inaccuracies in interatomic potentials, and relatively short simulation time.

46
Figure 3-4 Dielectric data of (a) ArPTU, (b) PEEU as functions of temperature measured
over a range of frequencies.

47
Figure 3-5 (a) Computational results of dielectric constant vs. specific volume for PEEU,
ArPTU, and blends for various supercells with different PEEU:ArPTU weight ratios. (b)
Comparison of simulation and experimental data of dielectric constant vs. blend
composition (PEEU:ArPTU weight ratio) at room temperature. Data points are shown
and the dashed line is drawn to guide the eye. [65]
(a)
(b)

48
3.4 Structural analysis
Grazing incidence X-ray scattering of the ArPTU, PEEU, and blend with 1:1
PEEU:ArPTU ratio was carried out to probe structural changes and the data are presented
in Figure 3-6. As shown in many earlier studies, the broad X-ray peak around 2θ = 18o in
Figure 3-6 for the neat polymers arises from interchain segment scattering in the
amorphous state. The scattering data reveal: (i) there is only one broad X-ray diffraction
peak for the 1:1 blend; (ii) the broad X-ray peak for the blend is at ca. 2θ = 17o, indicating
that interchain spacing in the blend is more than 5 % larger than those of the individual
polymers. The expanded interchain spacing in the blend enables easier dipole reorientation
to the applied field and leads to a higher dielectric constant compared with those of the neat
polymers while maintaining low dielectric loss. These results indicate that the reduced
constraints achieved by molecular engineering of the dipolar polymers in the glassy phase
can significantly increase the dielectric constant without compromising the dielectric loss
[17].
The AFM image of the blend with 1:1 PEEU:ArPTU ratio is presented in Figure 3-
7, showing uniform mixing of the two polymers in the blend at the nanoscale. The DSC
data of the blend (Figure 3-8) does not show two glass transition steps till 250°C,
suggesting single phase behavior, which is consistent with the AFM data.

49
Figure 3-6 (a) X-ray diffraction data of ArPTU and PEEU, and their 1:1 blend.
Background subtracted data of (b) PEEU with peak at 18.6°, (c) ArPTU with peak at 18.6°
and (d) blend data with peak at 17°. Wavelength of X-ray used was 1.54 angstroms.

50
Figure 3-7 AFM images: (a) amplitude and (b) phase for the PEEU:ArPTU 1:1 blend.
Figure 3-8 DSC data of 1:1 PEEU:ArPTU blend.
The TGA data in Figure 3-9 shows no weight loss below 250°C, thus confirming the
thermal stability up to 250°C, which is a very desirable feature for high temperature
operation.

51
Figure 3-9 TGA data of 1:1 PEEU:ArPTU blend.
Both structure analysis and computer simulation results indicate that the nano
(molecular) scale mixing of the two polymers causes a slight increase of the interchain
spacing in the glassy blend, thus reducing the barriers for dipole reorientation along the
applied electric field, and generating a high dielectric response without compromising the
dielectric loss.
In addition, positron annihilation lifetime spectroscopy (PALS) study is being
carried out by Prof. David Gidley’s group at University of Michigan on the blend samples
for direct measurement of free volume. The details of the PALS spectrometer can be found
from Ref. [66]. The preliminary results look promising and show the presence of increased
void size in the blend structure. The Figure 3-10 below shows the positron lifetime and
specific hole volume determined from the fitted positron lifetime as a function of blend
ratio. If there is a simple mixing of the two components (separate microscopic regions of
52
pure ArPTU and PEEU) then we would expect the fitted single Ps lifetime to simply be a
weighted average of the two individual lifetimes and vary linearly along this grey line.
However, as confirmed by the DSC results in Figure 3.8 that the blends show single phase
behavior, so as expected, the lifetime does not vary linearly. Also, the specific hole volume
increases with change in blend ratio except for PEEU:ArPTU blend ratio of 2:1 and 3:1.
Thus, suggesting that there is agreement with our hypothesis of localized free volume,
where these voids occupying few angstroms of volume can reduce the constraint on dipoles
in the glassy state of the polymer.

53
0 20 40 60 80 100
1.70
1.75
1.80
1.85
1.90
1.95
2.00
2.05
Fixed 0.8 ns
Ps L
ife
tim
e (
ns)
% PEEU (%)
0 20 40 60 80 100
70
75
80
85
90
95
100
Sp
he
rica
l S
pe
cific
Ho
le V
olu
me
(
A3)
% PEEU (%)
Figure 3-10 PALS results of (a) positron lifetime, (b) spherical specific hole volume with
change in PEEU composition.
ArPTU
PEEU
ArPTU
PEEU
(a)
(b)
54
3.5 Conclusion
In conclusion, we demonstrate a low-cost approach to achieve dramatically
higher dielectric constants while preserving the low loss and high operating temperature in
strongly dipolar polymer systems. Specifically, we show that nanostructure engineering
through blending of two dissimilar strongly dipolar polymers creates sub-nanoscale
unoccupied volume, leading to polymers with a dielectric constant of 7.5 and a loss less
than 1%. The results demonstrated here, which can be applied to many existing dipolar
polymers, pave the way for a very low-cost approach for creating “new” dielectric
materials from existing ones, but with dramatically improved dielectric response. These
advantages can enable many more uses of high power density capacitors in portable and
automotive systems, aircraft control, and advanced weaponry.
Acknowledgement
The part of this chapter has been published in Nanoenergy. Reproduced here by the
permission of Elsevier.
Y. Thakur, B. Zhang, R. Dong, W. Lu, C. Iacob, J. Runt, J. Bernholc and Q.M. Zhang, “Generating
high dielectric constant blends from lower dielectric constant dipolar polymers using nanostructure
engineering” Nano Energy, vol. 32, pp. 73–79, 2017

55
Chapter 4
Enhanced dielectric response in dipolar polymers with inorganic nanodopants
4.1 Introduction
In the previous chapter, a free volume approach to improve the dielectric constant was
discussed. That approach entails designing “new” dielectric materials which utilize free
volume to enhance dielectric constant. Nevertheless, it is also important to explore ways to
improve the properties of state-of-the-art materials; so that we can employ the existential
large-scale manufacturing setups of these polymers. In contrast to the traditional polymer
nanocomposites which rely on the high dielectric constant fillers to raise the dielectric
constant of composites, an emerging theme for developing new dielectric polymers is to
explore nanostructure engineering, such as utilizing the large interfacial fraction in
nanocomposites and the associated effects on dielectric response. In this chapter, a
nanocomposite approach has been discussed where addition of small amounts of inorganic
nanoparticles (< 1 vol.%) can considerably improve the dielectric properties of dipolar
polymers.
4.2 Composite theory
The introduction of inorganic particles in the host polymer matrix is one of the
promising ways to improve the dielectric properties of present dielectric materials. The
premise of this approach resides in the combination of inorganic particles with high
permittivity and high dielectric strength of polymers to achieve high energy density in

56
polymers. In this pursuit, both micro-sized particle and nano-sized particle filled systems
have been extensively investigated. [67] The composites with microparticles showed
impairment in the dielectric properties due to the surface defects and stress cracking after
ageing. In addition, the thickness of the film, an important aspect of miniaturization of
modern capacitors, was limited by the size of the microparticles. Thus, the interest shifted
to nano-sized particle filled systems, which allows for relatively low filler loading and
nanometer sizes, without sacrificing some of the inherent polymeric properties, such as
density, flexibility, and ease of processing. As the particle shrinks in size from the
micrometer to nanometer scale, the percentage of atoms at the surface of the particle
becomes more significant, resulting to a dramatic change in the physical properties,
interfacial properties, and also the agglomeration behavior relative to bulk materials. In
addition, the inter-filler distances in the nanocomposites can be in the range of nanometers,
and the filler would interact chemically and physically with polymer matrices, resulting in
the emergence of intermediate or mesoscopic properties. These mesoscopic properties at
interfaces may bring unexpected but excellent macroscopic properties of nanocomposites.
[68] It has been demonstrated that, as the size of filler particles decreases to the nanometer
scale, large interfacial areas in the composite between the polymer and nanoparticle would
promote the exchange coupling effect through a dipolar interface layer, resulting in higher
polarization levels, dielectric response and breakdown strength. [67], [69]–[71] The
dielectric properties of inorganic particles are largely dependent on their size, for example
in BaTiO3, the dielectric permittivity decreases dramatically from 5000 to hundreds as the
particle size is reduced from 1μm to 30 nm. The decrease in dielectric permittivity is due
to the reduction of tetragonality with decrease in particle size and the transition to cubic

57
structure when the grain size drops down to 30 nm. Still the inorganic nanoparticles have
dielectric constant(K>100) way higher than the commercial dielectric polymers (K<3.5).
One of the promising ways to improve the dielectric constant is by using a composite
approach, in which nanoparticles with the dielectric constant much higher (e.g. 100X) than
that of the polymer are added to the polymer matrix. [11], [16], [42] The increase in the
dielectric constant of such composites is usually attributed to the high dielectric constant
of the inorganic fillers since the composite dielectric constant is a volume average of those
of the constituents. This avenue has been extensively explored with high dielectric constant
inorganic particles like TiO2 [72]–[75], BaTiO3 [11], [42], [70], [76]–[78], ZrO2[75], [79]–
[81], CaCu3Ti4O12[82]–[85], PZT [86]–[89]. However, this approach suffers from several
issues for energy storage applications. The primary challenge is that the inclusion of high
dielectric constant fillers results in highly inhomogeneous electric fields at the interface of
polymer and nanoparticle due to the large difference in permittivity of both phases. This
results in intensification of local electric fields in the polymer matrix near the filler
particles, leading to a large reduction of the electric breakdown strength. [38], [67], [90]
This has prevented the practical applications of dielectric organic/inorganic composites.
The second challenge is with the physical dispersion of oxide nanoparticles. The high
surface energy of nanoparticles usually results in agglomeration and phase separation from
the polymer matrix. This yields in poor quality films with weakened dielectric properties,
such as high dielectric loss and low field strength. Lastly, for the nanocomposite films, it
is important to rationally optimize the particle concentration to maximize the energy
storage density. Following the composite theory, it requires a high-volume content of high
dielectric constant nanoparticles to increment the dielectric constant of the polymer

58
composite films. On the other hand, the dielectric strength drops off dramatically with high
volume content of these fillers. Despite the increment in dielectric constant, the reduced
breakdown strength can only give slight improvements in energy density. Therefore, it is
required to optimize the volume content of nanoparticles to achieve maximum
improvement in energy density.
4.2.1 Models for predicting effective permittivity
The effective permittivity of a polymer nanocomposite depends on the individual
permittivity of the filler and polymer matrix along with different filler loadings and
interactions among them. To find the effective dielectric constant of the nanocomposites,
various models have been derived.
The following models have been commonly used for two-phase dielectric composites:
The Maxwell model is relatively easy for modeling due to its linearity for the dielectric
constant of composite Km for spherical inclusions in a continuous matrix. [91]
K𝑚 = K1𝐾2+2𝐾1−2𝑉2(𝐾1−𝐾2)
𝐾2+2𝐾1+𝑉2(𝐾1−𝐾2) (4.1)
where Km, K1, and K2 represent the dielectric constants of the composite, phase 1, and
phase 2, respectively, V1 and V2 are the volume fractions of phases 1 and 2 (V1 + V2 = 1).
Series and parallel mixing models represent the extreme cases. The series model
corresponds to alternating layers of each phase in the direction perpendicular to the applied
field (two capacitors in series). The parallel model corresponds to alternating layers of each
phase in the direction parallel to the applied field (two capacitors in parallel). [92]
(a) Series model:
1
𝐾𝑚=
𝑉1
𝐾1+
𝑉2
𝐾2 (4.2)
59
(b) Parallel model
𝐾𝑚 = 𝑉1𝐾1 + 𝑉2𝐾2 (4.3)
The Lichtenecker model represents a widely used empirical relationship without any
concern for the physical geometry of the composite system. It is a logarithmic mixture
formula and is most efficient in calculating the effective permittivity of the polymer
nanocomposites. [93]
𝑙𝑛𝐾𝑚 = 𝑉1𝑙𝑛𝐾1 + 𝑉2𝑙𝑛𝐾2 (4.4)
4.3 Experimental section
4.3.1 Nanocomposites of polyetherimide
Nanocomposites of polyetherimide (PEI) with various nanofillers were prepared by
a solution casting method. Ultem 1000 PEI polymer resin was purchased from General
Electric (GE), molecular structure shown in Figure 4-1. Alumina (Al2O3) nanoparticles
with mean particle diameters of 5 nm, 20 nm and 50 nm, magnesium oxide (MgO) and
silicon dioxide (SiO2) nanoparticles of 20 nm size, BaTiO3 (BTO) with 50 nm size, and
boron nitride (BN) with 70 nm size were purchased from US-Nano. To prepare
nanocomposite films, the nanoparticles with selected weight percent were added to PEI
powder and dissolved in dimethylformamide (DMF). Following this step, the mixed
solution was sonicated at room temperature using VWR Aquasonic 76T for 12 h to achieve
good nanoparticle dispersion. The solution was then cast onto a clean glass slide. The

60
solution cast films were kept in a drying oven at 70 °C for 12h to remove the solvent and
then heated to 100 °C and 150 °C for 1h, respectively, and 200 °C for 12h, followed by a
final drying step at 225 °C for 2h. Afterward, the films were kept in a vacuum oven at 200
°C for one day to further remove any residual solvent. Finally, films were peeled off from
the glass substrate and dried in a vacuum oven at 80°C for 4h.
Figure 4-1 Molecular structure of the polyetherimide. [94]
4.3.2 Nanocomposites of polystyrene
Nanocomposites of polystyrene (PS) with various nanofillers were prepared by a
solution casting method. PS resin was purchased from Sigma–Aldrich, see molecular
structure in Figure 4-2. The 2 wt.% solution of polystyrene in DMAc was stirred at 70℃
for 12 h. Alumina nanoparticles (20 nm and 50 nm) with selected weight percent were
dispersed in DMAc using a VWR Aquasonic 76T for 1h and then added to the PS solution.
Following this step, the mixed solution was sonicated using the same instrument for 12h to
get good dispersion and then cast on a clean glass slide. The solution was kept in a drying
oven at 90℃ for 24h and then vacuum dried at 100℃ for another day, followed by the final

61
drying step at 200℃ for 2h. Finally, the film was peeled from the substrate and dried in a
vacuum oven at 80°C for 4h.
Figure 4-2 Molecular structure of the polystyrene.
4.3.3 Details of characterization equipment
Nanocomposite film thickness was in the range of 8-12 microns measured by
Heidenhain ND287 digital micrometer. Sputtered gold electrodes of 2 mm and 6 mm
diameter were deposited on both surfaces of the composite films for electrical
characterization. Dielectric data were characterized using an HP 4294A Precision
Impedance Analyzer and a Novocontrol GmbH Concept 40 broadband dielectric
spectrometer. The charge-discharge response was measured with a modified Sawyer-
Tower circuit. The DC breakdown test was performed by applying a ramp rate of 100 V/s.
Differential scanning calorimetry (DSC) was carried out using a TA instruments Q2000 to
probe the thermal behavior. The data were taken at a scan rate of 10°C/min during heating.
The X-ray diffraction data were collected using a Panalytical X’Pert PRO MPD
diffractometer. An FEI Talos F200X (Scanning) Transmission Electron Microscope
(S/TEM) was used at 200 kV to probe the nanoparticles in the polymer matrix.
62
4.4 Results and discussion
4.4.1 Effect of alumina nanoparticles and the particle size
We chose polyetherimide (PEI), a high temperature polymer (glass transition
temperature Tg ~ 217oC), as the matrix. PEI contains dipolar units in the polymer chains
[94] (see Figure 4-1), exhibits a dielectric constant of 3.2, which for polymer dielectrics is
at the higher end of the dielectric constant spectrum, and low dielectric loss (0.29 %). Due
to its high operating temperature, modest K, and low loss, PEI has been considered for the
next generation of high performance capacitor dielectric material. [20], [35] Alumina
nanoparticles, whose dielectric constant (K = 9.5) is not far from that of the polymer matrix,
were used as the nanofillers, thus avoiding large local field concentration in polymer
interfacial regions near the nanofiller particles. As presented in Figures 4-3 (a) and 4-3 (b),
films with a very low volume content of alumina nanoparticles (0.32 vol.%) can achieve a
dielectric constant > 5, a more than 55% increase over that of PEI, while maintaining low
loss. The alumina nanofiller particle size in the composite is ca. 20 nm. Summarized in
Figure 4-3 (b) is the dielectric constant of the PEI/alumina (20 nm size) nanocomposites
vs. alumina volume content, which displays a sharp increase in the dielectric constant with
alumina nanofiller loading and reaches K > 5 at 0.32 vol.%. Moreover, this large increase
in the dielectric constant occurs in a small and narrow composition range. With additional
nanofiller, the dielectric constant decreases, and at 0.64 vol.% the dielectric constant K of
the film is 4. There have been several studies of PEI nanocomposites in the past. [41],[80],
[94] These earlier reports focused on high nanofiller content (> 2 vol. %). Our results for
PEI nanocomposites at > 0.62 vol.% nanofillers are consistent with the earlier work. It is

63
startling that the large enhancement in the dielectric response of PEI/alumina (20 nm size)
nanocomposites occurs at such a low filler volume content. Figure 4-3 (b) presents a
comparison of the experimental data with several widely-applied dielectric composite
models using the dielectric properties of PEI and alumina. None of these models can
describe the observed phenomenon, since they are based on the geometrical volume
average of the dielectric responses of the constituents.
The temperature dependence of the dielectric properties of the 0.32 vol.%
alumina (20 nm) nanocomposite film was also characterized (Figures 4-3 (c)). The data
show that the nanocomposite maintains low loss at temperatures in excess of 150°C, the
same as that of PEI (see Figure 4-4). When the temperature approaches the PEI Tg (~217
°C), the dielectric loss will increase in both the pure polymer and nanocomposites.

64
Figure 4-3 (a) Room temperature dielectric properties of PEI/alumina (20 nm particle size)
nanocomposites at different alumina nanoparticle loading (in vol. %) vs frequency. (b)
Dielectric constant of nanocomposite films of PEI/alumina (20 nm particle size) vs.
nanofiller volume content and comparison with several widely used dielectric models of
diphasic dielectric composites (lines with no data points): curve (1) Parallel model, (2)
Maxwell model, (3) Lichtenecker model, and (4) series model. Inset shows an expanded
view of the dielectric constants of the composite films vs. alumina loading. Experimental
data points are shown and lines are drawn to guide the eye. (c) Dielectric properties vs.
temperature of the PEI/alumina (20 nm size) nanocomposite with 0.32 vol.% alumina
loading at different frequencies.

65
Figure 4-4 Dielectric properties at different frequencies of neat PEI as a function of
temperature.
For the nanocomposites with low volume content of nanofillers, the breakdown
field is not compromised. Figure 4-5 (a) presents the charge-discharge curves of the 0.32
vol% alumina (20 nm) nanocomposite films at room temperature. These films exhibit a
high breakdown field of 525 MV/m, similar to that of pure PEI [35], achieving a discharged
energy density of 5.25 J/cm3 (see inset in Figure 4-5 (a). The increased discharged energy
density at different temperatures has also been measured. As shown in Figure 4-5 (b), the
room temperature discharged energy density is 2.9 J/cm3 under 350 MV/m, compared to
that of pure PEI (1.9 J/cm3) under the same field, due to the increased dielectric constant
of the nanocomposite film. Furthermore, Figure 4-5 (b) presents the energy density from
biaxially-oriented polypropylene (BOPP), which is widely used as the state-of-the-art
polymer capacitor. [44] With only 0.32 vol.% nanofiller, the energy density of the PEI
nanocomposite becomes more than 100 % higher than BOPP. At 100oC (Figure 4-5 (c))
the discharge energy density of the nanocomposite films is still more than 40% higher than

66
that of PEI. Due to its operating temperature limitation, BOPP was not measured at 100oC.
At 150oC (Figure 4-5 (d)), there is increased conduction loss in both PEI and
nanocomposite films at high field, causing a reduction in the discharged energy density.
Nevertheless, the discharge energy density of the nanocomposite is still 12% higher than
that of PEI, i.e., PEI films with only 0.32 vol% alumina nanofiller exhibit enhanced
discharge energy density and higher dielectric performance up to 150°C and above this
temperature.
Figure 4-5 (a) Charge-discharge cycles of PEI/alumina (20 nm) nanocomposites with 0.32
vol.% alumina under different electrical fields at 10 Hz and room temperature. Inset:
discharged energy density deduced from the charge-discharge cycle data. (b), (c), (d)
Discharged energy density of PEI/alumina (20 nm) nanocomposites with 0.32 vol.%
loading at different temperatures (room temperature, 100oC, and 150oC), and their
comparison with that of neat PEI and BOPP (room temperature), measured under 350
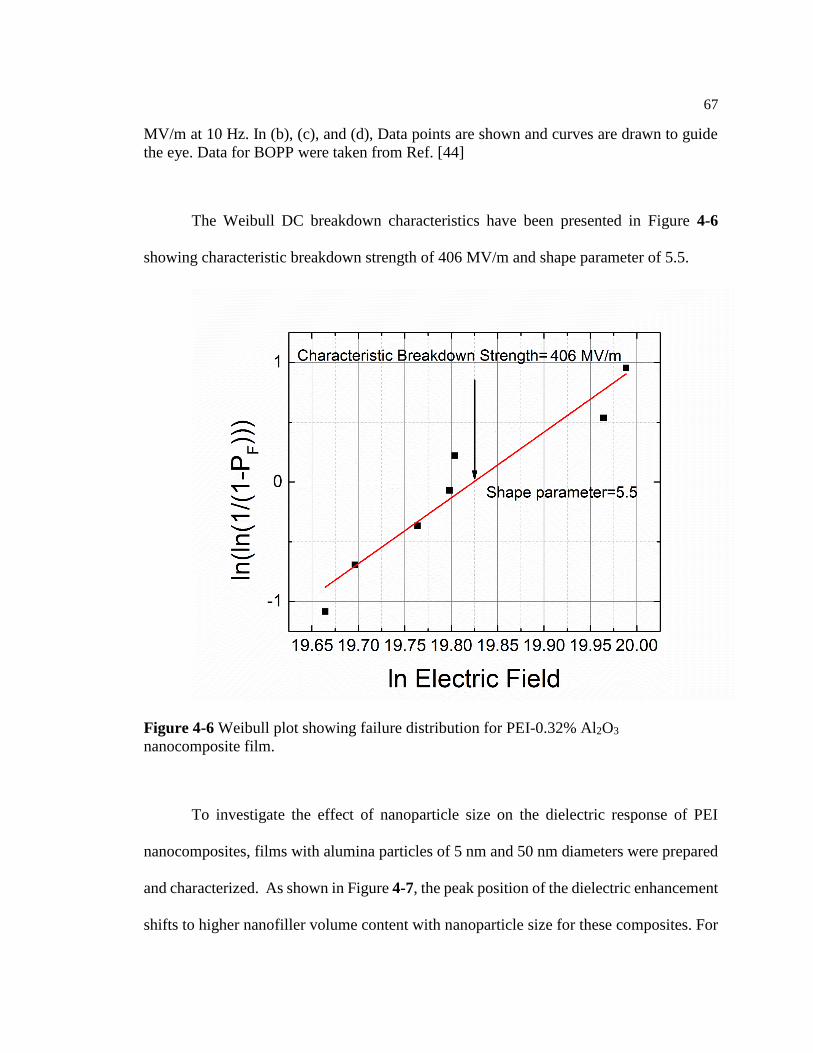
67
MV/m at 10 Hz. In (b), (c), and (d), Data points are shown and curves are drawn to guide
the eye. Data for BOPP were taken from Ref. [44]
The Weibull DC breakdown characteristics have been presented in Figure 4-6
showing characteristic breakdown strength of 406 MV/m and shape parameter of 5.5.
Figure 4-6 Weibull plot showing failure distribution for PEI-0.32% Al2O3
nanocomposite film.
To investigate the effect of nanoparticle size on the dielectric response of PEI
nanocomposites, films with alumina particles of 5 nm and 50 nm diameters were prepared
and characterized. As shown in Figure 4-7, the peak position of the dielectric enhancement
shifts to higher nanofiller volume content with nanoparticle size for these composites. For
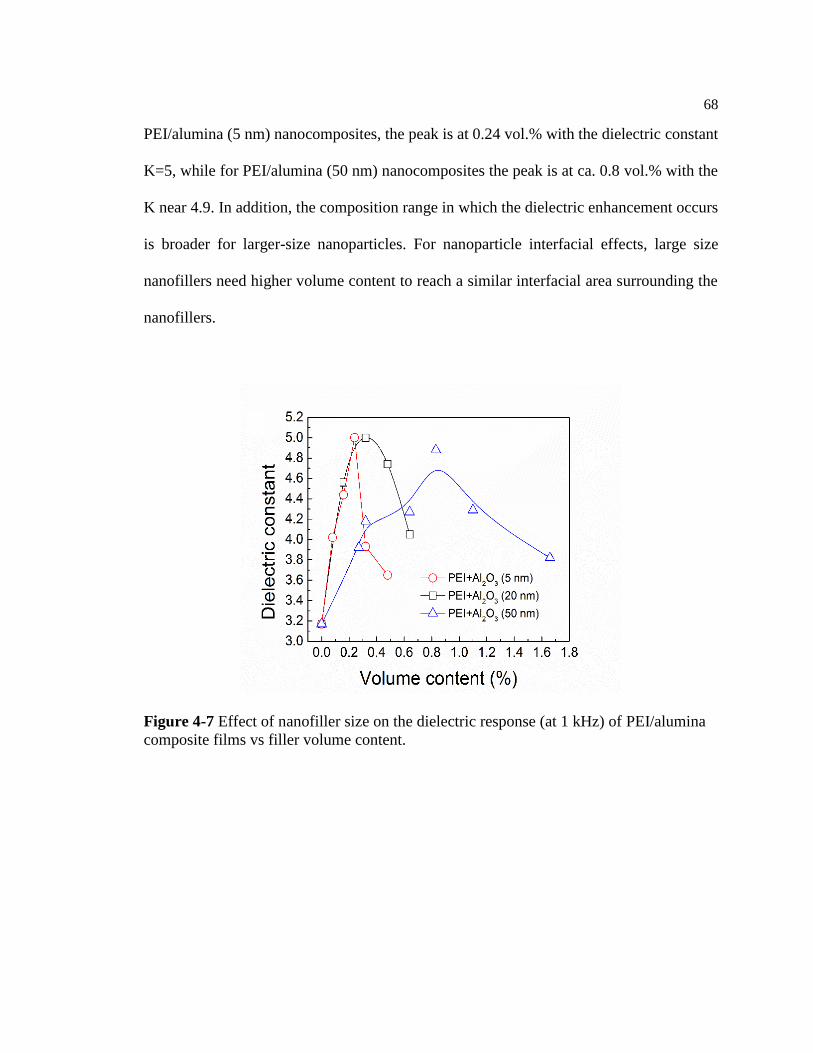
68
PEI/alumina (5 nm) nanocomposites, the peak is at 0.24 vol.% with the dielectric constant
K=5, while for PEI/alumina (50 nm) nanocomposites the peak is at ca. 0.8 vol.% with the
K near 4.9. In addition, the composition range in which the dielectric enhancement occurs
is broader for larger-size nanoparticles. For nanoparticle interfacial effects, large size
nanofillers need higher volume content to reach a similar interfacial area surrounding the
nanofillers.
Figure 4-7 Effect of nanofiller size on the dielectric response (at 1 kHz) of PEI/alumina
composite films vs filler volume content.

69
Table 4-1 Summary of dielectric data of polyetherimide (PEI) with alumina
nanoparticles.
Neat Polymer Film Dielectric constant (1 kHz) Loss (1 kHz)
Neat PEI 3.17 0.29%
Nanocomposite Film Dielectric constant (1 kHz) Loss (1 kHz)
PEI with Al2O3 (5 nm)
PEI+0.08% Al2O3 (5 nm) (by vol.) 4.02 0.48%
PEI+0.16% Al2O3 (5 nm) (by vol.) 4.44 0.38%
PEI+0.24% Al2O3 (5 nm) (by vol.) 5.0 0.42%
PEI+0.32% Al2O3 (5 nm) (by vol.) 3.93 0.25%
PEI+0.48% Al2O3 (5 nm) (by vol.) 3.65 0.15%
PEI with Al2O3 (20 nm)
PEI+0.16% Al2O3 (20 nm) (by vol.) 4.56 0.46%
PEI+0.32% Al2O3 (20 nm) (by vol.) 5.0 0.46%
PEI+0.48% Al2O3 (20 nm) (by vol.) 4.74 0.5%
PEI+0.64% Al2O3 (20 nm) (by vol.) 4.05 0.27%
PEI+1.28% Al2O3 (20 nm) (by vol.) 4.01 0.68%
PEI+1.63% Al2O3 (20 nm) (by vol.) 3.93 0.61%
PEI with Al2O3 (50 nm)
PEI+0.27% Al2O3 (50 nm) (by vol.) 3.92 0.63%
PEI+0.32% Al2O3 (50 nm) (by vol.) 4.18 0.29%
PEI+0.64% Al2O3 (50 nm) (by vol.) 4.27 0.35%
PEI+0.83% Al2O3 (50 nm) (by vol.) 4.88 0.43%
PEI+1.1% Al2O3 (50 nm) (by vol.) 4.29 0.61%
PEI+1.66% Al2O3 (50 nm) (by vol.) 3.82 0.53%

70
4.4.2 Effect of nanoparticle type on dielectric constant
It was also investigated whether the observed enhancement in dielectric
response occurs with other nanofillers. PEI films with 20 nm size SiO2 (K = 3.9) and MgO
(K = 9.7) were prepared and characterized. Dielectric constants measured at room
temperature and 1 kHz are presented in Figure 4-8 and Table 4-2. For example, PEI/MgO
films show a dielectric constant of 4.95 (and maximum enhancement at 0.35 vol.% MgO
content). At 0.7 vol.%, the dielectric constant of the composite is reduced to 4.1, a trend
very similar to that observed in PEI/alumina nanocomposites, i.e., a significantly enhanced
dielectric response at very low nanofiller loading. It is interesting to note that the PEI/SiO2
nanocomposite has a dielectric constant K ~ 5, which is higher than both the pure polymer
matrix and the nanofiller. In addition, nanocomposites with boron nitride of 70 nm size
(hexagonal BN, dielectric constant ~ 5 - 7 and dielectric loss < 0.2%) were also prepared
and characterized. As shown in Figure 4-8 and Table 4-2, the PEI/BN films display an
enhanced dielectric constant, peaking at ca. 0.83 vol.% with K = 4.7 and displaying low
dielectric loss (Table 4-2). These results indicate that the enhanced dielectric constant in
the PEI films does not depend on the nanofiller type.

71
Figure 4-8 Effect of nanofiller size on the dielectric response (at 1 kHz) of PEI/alumina
composite films vs filler volume content. Experimental data points are shown and curves
are drawn to guide the eye.
Table 4-2 Summary of dielectric data of polyetherimide (PEI) with different type of
nanoparticles.
Nanocomposite Film Dielectric constant (1 kHz) Loss (1 kHz)
PEI with MgO (20 nm)
PEI+0.17% MgO (20 nm) (by vol.) 4.36 0.55%
PEI+0.35% MgO (20 nm) (by vol.) 4.95 0.23%
PEI+0.70% MgO (20 nm) (by vol.) 4.09 0.49%
PEI with SiO2 (20 nm)
PEI+0.26% SiO2 (20 nm) (by vol.) 4.88 0.24%
PEI+0.79% SiO2 (20 nm) (by vol.) 3.84 0.43%
PEI with BN (70 nm)
PEI+0.27% BN (70 nm) (by vol.) 3.73 0.25%
PEI+0.55% BN (70 nm) (by vol.) 3.97 0.58%
PEI+0.83% BN (70 nm) (by vol.) 4.71 0.89%
PEI+1.1% BN (70 nm) (by vol.) 4.55 0.19%
PEI+1.66% BN (70 nm) (by vol.) 4.21 0.18%

72
4.4.3 Effect of high dielectric constant nanoparticles
We note that PEI nanocomposites with high dielectric constant BaTiO3 (BTO)
nanofiller (50 nm particle size, K > 500) have been investigated earlier. [42], [95] To reach
a dielectric constant of K = 5, required more than 12 vol.% BTO nanofiller (See Figure 4-
9). The BTO volume content in these earlier studies was more than 3 vol.%. We thus
prepared PEI/BTO (50 nm) nanocomposites at very low volume filler content. As presented
in Figure 4-9 and Table 4-3, the dielectric response of PEI/BTO (50 nm) is nearly the same
as that of PEI/alumina (50 nm) in spite of the large difference in filler dielectric constant,
i.e., the peak enhancement (K=4.9) is at ca. 0.8 vol.%. Figure 4-10 summarizes all of the
nanocomposite experimental data in terms of percentage enhancement in the dielectric
constant of the nanocomposites, compared with that of the pure polymer matrix, showing
more than 50% enhancement in the nanocomposites studied.

73
Figure 4-9 Dielectric constant of PEI/BaTiO3 (50 nm size) nanocomposites vs. BaTiO3
volume content (experimental data points are shown and for > 3 vol.% nanocomposites
(orange squares) the data are from Ref. [95]). Experimental data are compared with several
commonly used composite models (Refs. [91]–[93]): (1) Parallel model (black), (2)
Maxwell model (red), (3) Lichtenecker model (green), and (4) series model (blue),
assuming the dielectric constant of BaTiO3 is 100X of that of PEI. Inset is an expanded
view of the enhanced dielectric response of nanocomposites at very low volume content (<
1 vol.%) due to nanoparticle interfacial effects, experimental data points are shown and
solid curve is drawn to guide the eye.
Figure 4-10 Summary of dielectric constants of PEI nanocomposites with different
nanofillers (20 nm MgO; 20 nm SiO2; 20 nm alumina; 50 nm BaTiO3; 70 nm BN).
Experimental data points are shown and lines are drawn to guide the eye.

74
Table 4-3 Summary of dielectric data of polyetherimide (PEI) with barium titanate
(BaTiO3) nanoparticles.
Nanocomposite Film Dielectric constant (1 kHz) Loss (1 kHz)
PEI with BaTiO3 (50 nm)
PEI+0.16% BaTiO3 (50 nm) (by vol.) 3.77 0.35%
PEI+0.32% BaTiO3 (50 nm) (by vol.) 3.94 0.43%
PEI+0.48% BaTiO3 (50 nm) (by vol.) 4.18 0.23%
PEI+0.64% BaTiO3 (50 nm) (by vol.) 4.36 0.24%
PEI+0.80% BaTiO3 (50 nm) (by vol.) 4.88 0.40%
PEI+0.96% BaTiO3 (50 nm) (by vol.) 4.44 0.45%
4.4.4 Importance of dipoles
A necessary condition for a polymer to exhibit a relatively high dielectric constant,
that is above 3, is that it should contain dipoles. This is the case for PEI in which the
phthalimide group possesses a high dipole moment, > 4 Debye. [94] In addition, to meet
the requirement of low dielectric loss (loss tangent < 0.01, or 1%), the dipoles in these
polymers should be weakly-coupled, which is also the case for PEI due to its amorphous
nature. [50], [55], [94] PEI has a high Tg (ca. 217 oC) and thus ensures high operating
temperature and low dielectric loss. However, the rigid structure of the polymer glass
imposes severe constraints on the responses of the dipoles to applied electric fields, limiting
the dielectric constant. [48], [55] On the other hand, if the constraints on the dipoles in the
glassy state can be significantly reduced, in this case by the interfacial effects of

75
nanocomposites, higher dielectric response can be achieved without the penalty of high
dielectric loss.
Analogous to PEI nanocomposites, the polar polyimide (PI) nanocomposites also
exhibit an enhanced dielectric constant occurring at very low filler volume content. [96] In
contrast, nanocomposites of a non-polar polymer, polystyrene, with alumina nanofillers of
20 nm and 50 nm, respectively, do not show dielectric enhancement, see Figure 4-11 and
Table 4-4. Thus, confirming that presence of polar polymer matrix is important for the
dielectric enhancement with low volume content of nanoparticles.
Figure 4-11 Dielectric constant measured at 1 kHz and room temperature vs. the nanofiller
content for PS nanocomposites. Data points are shown and solid curves are drawn to guide
the eye.
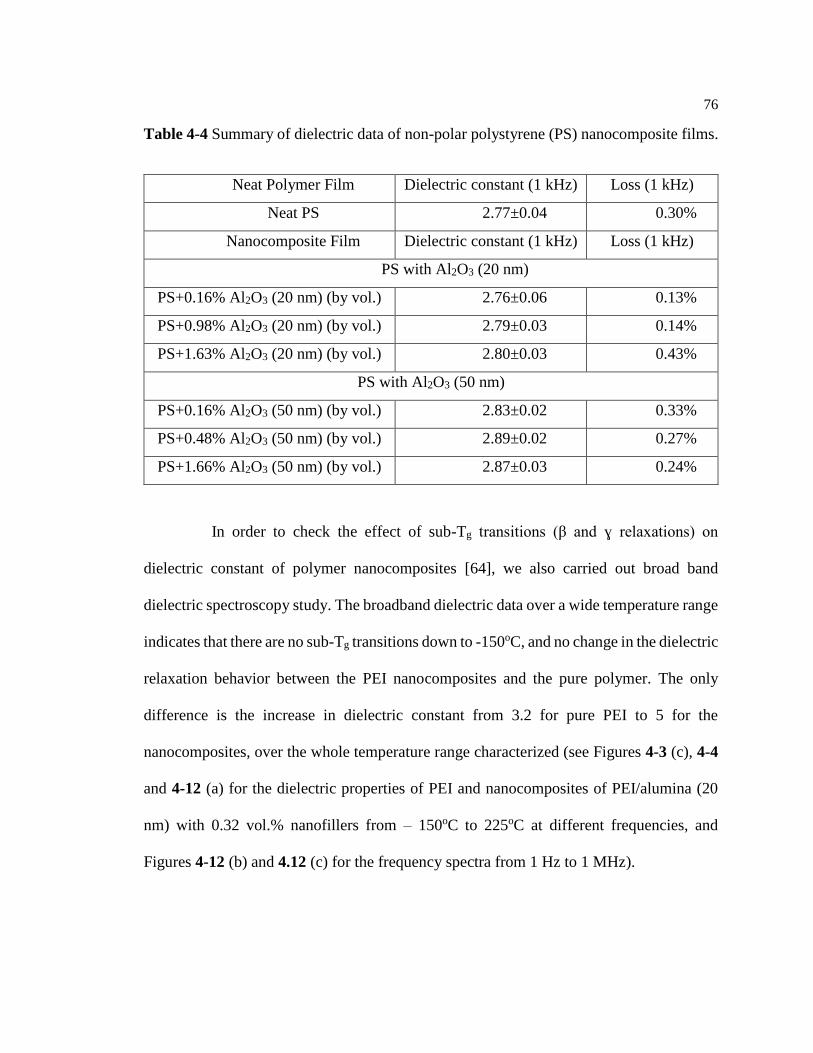
76
Table 4-4 Summary of dielectric data of non-polar polystyrene (PS) nanocomposite films.
Neat Polymer Film Dielectric constant (1 kHz) Loss (1 kHz)
Neat PS 2.77±0.04 0.30%
Nanocomposite Film Dielectric constant (1 kHz) Loss (1 kHz)
PS with Al2O3 (20 nm)
PS+0.16% Al2O3 (20 nm) (by vol.) 2.76±0.06 0.13%
PS+0.98% Al2O3 (20 nm) (by vol.) 2.79±0.03 0.14%
PS+1.63% Al2O3 (20 nm) (by vol.) 2.80±0.03 0.43%
PS with Al2O3 (50 nm)
PS+0.16% Al2O3 (50 nm) (by vol.) 2.83±0.02 0.33%
PS+0.48% Al2O3 (50 nm) (by vol.) 2.89±0.02 0.27%
PS+1.66% Al2O3 (50 nm) (by vol.) 2.87±0.03 0.24%
In order to check the effect of sub-Tg transitions (β and ɣ relaxations) on
dielectric constant of polymer nanocomposites [64], we also carried out broad band
dielectric spectroscopy study. The broadband dielectric data over a wide temperature range
indicates that there are no sub-Tg transitions down to -150oC, and no change in the dielectric
relaxation behavior between the PEI nanocomposites and the pure polymer. The only
difference is the increase in dielectric constant from 3.2 for pure PEI to 5 for the
nanocomposites, over the whole temperature range characterized (see Figures 4-3 (c), 4-4
and 4-12 (a) for the dielectric properties of PEI and nanocomposites of PEI/alumina (20
nm) with 0.32 vol.% nanofillers from – 150oC to 225oC at different frequencies, and
Figures 4-12 (b) and 4.12 (c) for the frequency spectra from 1 Hz to 1 MHz).

77
Figure 4-12 (a) Dielectric data at different frequencies of PEI+0.32 vol.% Al2O3 20 nm
as a function of temperature, (b) Dielectric data of PEI and (c) PEI+0.32 vol.% Al2O3 20
nm nanoparticle as a function of frequency at room temperature.
a
b
c

78
4.4.5 Structural analysis
A number of techniques were employed to characterize and analyze the changes
in PEI nanocomposites. Transmission electron microscopy images (see Figure 4-13 for a
representative image) show no evidence of appreciable nanofiller agglomeration in these
films. Differential scanning calorimetry (DSC) was performed on both pure PEI and the
PEI+0.32 vol.% alumina nanocomposite film. As shown in Figure 4-14 (a), the
nanocomposite film exhibits a reduced Tg (at ca. 210oC) compared with that of PEI (Tg
~217oC). In other words, average PEI segmental motion is somewhat faster in the presence
of a low volume fraction of well-dispersed alumina nanoparticles. This effect is presumably
dominated by changes in the dynamics of PEI segments near particle interfaces, leading to
reduced constraints for dipole reorientations in interfacial regions in the presence of applied
electric fields. Wide angle X-ray diffraction (XRD) was also carried out to probe possible
local structure changes due to the presence of nanofiller particles. As shown in Figure 4-
14 (b), the XRD pattern of the PEI - 0.32 vol.% alumina nanocomposite is nearly identical
to that of the neat PEI, displaying only the expected amorphous halo associated with PEI.

79
Figure 4-13 A representative TEM image of the PEI nanocomposite with 0.32 vol.%
alumina (20 nm particle size). Due to low volume content of nanoparticle in the composite,
only one nanoparticle is seen in the image area, as indicated.
Figure 4-14 (a) DSC and (b) X-ray diffraction data of PEI and the PEI nanocomposite with
0.32 vol.% of alumina.
20 nm

80
4.4.6 Multilayer core model for interfacial effect of nanocomposites
Tanaka’s multi-core model:
In order to explain how interfaces are formed chemically, physically and electrically,
Tanaka et. al. [97] proposed a hypothetical multi-layered core model to describe the
interfacial morphology between spherical inorganic particles and polymer matrix. The
multicore model involves a bonded layer, a bound layer and a loose layer as shown in the
Figure 4-15 below. The bonded layer corresponds to a transition layer with thickness of
about 1 nm, which is tightly bonded to both the spherical particle and the polymer. Such
bonding arises from either ionic, covalent or hydrogen bonds, or van der Waals force. The
bound layer is layer of polymer chains strongly bound and/or interacted to the bonded layer
and the surface of the particle. This layer plays a major role in altering the polymer chain
conformation, mobility and other stereographic structures. The thickness is in the range of
2-9 nm. The morphology and thickness of this layer is dependent on the interfacial
interaction strength in the bonded layer. The loose layer is a region loosely coupled to the
bound layer in which chain conformation, mobility, and even free volume and crystallinity
can differ from the polymer matrix. Comparatively, it has larger thickness, of several tens
of nanometers, than the inner layer. [67]

81
Figure 4-15 Tanaka’s multi-core model for interfaces between inorganic nanoparticles and
polymer matrix. [67], [97]
Based on Tanaka’s model Yang et al. [96] carried out the simulation study for our
experimental results. The interfacial region between the inorganic nanofiller and the
polymer matrix consists of multiple layers with different dielectric properties, where
dipoles in the inner layer may be restricted by chemical bonding or electric force, resulting
in a reduced local dielectric constant compared with the polymer matrix, whereas the outer
layer, which can be tens of nanometers thick, may contain more active dipoles with reduced
dipole rotation barriers, and thus show an increased local dielectric constant. The reduced
constraints for dipoles due to nanocomposites is consistent with the DSC data (Figure 4-
14 (a)). The analysis has been discussed in Appendix A.
82
4.5 Conclusion
We demonstrate a nanocomposite approach in which the dielectric response can be
enhanced markedly by addition of a very small amount of inorganic nanofiller, whose
dielectric constant can be similar to that of the polymer, thus eliminating many undesirable
features associated with the traditional nanocomposites using high dielectric constant
nanofillers to enhance the dielectric response. Although, the observed dielectric
phenomenon is beyond the present quantitative models of dielectric nanocomposites, still
these results will challenge and inspire fundamental research of interfacial effects in
nanocomposites. We expect that a successful development of theoretical understanding of
the observed phenomenon, plus the rich polymer chemistry available in tailoring the
nanostructures of dielectric polymers, will lead to a new generation of dipolar polymers
with much better performance than what is reported here. In addition to the higher dielectric
constant and breakdown field, nanocomposites with such a low volume content of
nanofillers allow for the use of melt extrusion method to produce dielectric films in large
quantities at low cost and high quality. Thus, opening the doors for commercialization of
this nanocomposite approach.
Acknowledgement
The part of this work has been submitted to Nanoscale published by RSC journal and has
been filed as a patent:
[1] Q. Zhang, Y. Thakur, T. Zhang and J. Runt, “Thin Film Capacitors” International
Patent Application PCT/US17/18307, February 17, 2017

83
Chapter 5
Dipolar polymers: high field behavior and study of conduction loss
5.1 Introduction
In the chapter 2, we discussed the rational design of dielectric polymers based on
weakly-coupled and strongly-dipolar polymers. Besides high dielectric constant, it is
important to maintain low conduction loss, especially at high electric fields. [44] In the
past few years, several aromatic polyurea and polythiourea polymers, possessing an
improved dielectric constant (K>4) have been developed. [50] The amorphous structure of
these polymers eliminates the polarization hysteresis loss, and high glass transition
temperature enables high thermal stability (>150°C operating temperature). However, most
of these aromatic polyurea and polythiourea polymers can only be processed into dielectric
films via solution-casting method, which causes higher manufacturing cost compared with
thermal (melt) process methods, and also solvents used may have deleterious impact on the
environment. Hence, one of the objective of this chapter is to investigate effective
approaches to chemically modify aromatic polyurea polymers, so that the resulting
polymer is thermally processable while maintaining high dielectric constant, low dielectric
loss, and exhibit high thermal stability.
One critical issue with many dielectric polymers which show low dielectric loss at
low electric field is the increased conduction loss at high electric fields. [31],[32]
Therefore, another objective is to examine the conduction loss of dipolar polymers. In the

84
first part of this chapter, the loss of PEMEU films at extremely high electric fields is
investigated.
The second part of this chapter is devoted to study of conduction loss at high field
and high temperature of another class of dipolar polymer – P(TFE-HFP-VDF) polymer,
which has been shown to be attractive for high temperature and high energy density
capacitors by Zhang et al. [98]. A nanocomposite approach has been proposed here, where
in order to suppress conduction at high temperature and high electric field, alumina (Al2O3)
nanofillers were added to the THV polymer matrix.
5.2 Review of breakdown mechanisms
In general, breakdown process in polymeric insulators is irreversible, and can be
destructive in many cases, resulting in a narrow conduction channel between the electrodes.
The term breakdown is used to describe processes in which a considerable current increase
results from a small voltage change. All the catastrophic breakdown in solids is electrically
power driven, and ultimately thermal in the sense that the discharge track involves at least
the melting and probably the carbonization or vaporization of the metalized dielectric. [99],
[100] An approach that can reduce the destructive effect of breakdown, and prolong the
lifetime is self-healing/self-clearing in metalized film capacitors. With a self-clearing
electrode, a fault in the dielectric will result in the thin metallized electrode in the
immediate vicinity being vaporized or turned from a metal conductor into a metal oxide
insulator. [2]

85
Deterministic models of breakdown are categorized to processes leading up to the
final stages of the breakdown. These are mainly subdivided into: electronic, thermal and
electromechanical breakdown. These processes are briefly discussed below:
5.2.1 Electronic breakdown
Electronic breakdown is initiated by local electric fields, in the range of 107-109 V/cm. At
high fields, the electrons accelerate with large mean free path by impact ionization,
resulting in catastrophic failure that can destroy the local lattice. The pioneering work in
this field was done by Von Hippel [101], who developed a single electron model to explain
the behavior in the low temperature range, followed by other models, such as the high-
energy criterion intrinsic breakdown by Frohlich, [102] and the avalanche breakdown by
Seitz [103].
The electronic breakdown in polymers can be considered of two types: intrinsic
breakdown and avalanche multiplication. The intrinsic breakdown occurs when the hot
electrons gain energy faster than the maximum rate at which they can lose energy by
electron-phonon scattering or inelastic collision to the lattice. Therefore, there must be a
critical field and corresponding electron energy above which the electrons indefinitely
acquire energy faster than they can lose it thereby leading to breakdown. This critical
electric field is referred as intrinsic breakdown field. [99]
The second is: avalanche multiplication or carrier impact ionization, where
electrons with a high energy, either as a result of acceleration in the field, or hot injection
from the electrode, or purely from chance fluctuations, collide with trapped or bound

86
electrons imparting sufficient energy for both electrons to be free after the collision. Given
a sufficiently high field both electrons rapidly gain enough energy to each cause a second
generation of collisions resulting in four free electrons. If this chain reaction continues, the
local concentration of high-energy electrons builds up to such an extent – that it is followed
by local destruction of the lattice. [99]
5.2.2 Thermal breakdown
Thermal breakdown occurs when electrical power dissipation causes heating of at least part
of the insulation to above a critical temperature, which results directly or indirectly in a
catastrophic failure. The conduction losses or losses due to polymer relaxation will result
in dissipation of power, and thereby cause Joule heating. The temperature will continue to
increase until the cooling of the insulator is equal to the electrical power dissipation, and
steady-state heat flow is set up. Breakdown occurs when this balance is disturbed by either
(1) physical change in the dielectric material, for example softening of the polymer; or (2)
the increase in conduction, as more carriers are available for conduction due to increase in
temperature. Alternatively, the increased segmental motion may increase the mobility for
intrinsic ionic conduction. Thus, electric power dissipation is increased causing a further
increase in temperature, and resulting in thermal runaway. [99], [104]
Mathematically, this mechanism can be expressed by the general equation (5.1) for the
thermal breakdown,
𝐶𝑣𝑑𝑇
𝑑𝑡− 𝑑𝑖𝑣(𝐾𝑡𝑔𝑟𝑎𝑑𝑇) = 𝜎𝐸2 (5.1)

87
where, Cv is the specific heat per unit volume; Kt is the thermal conductivity; T is the
temperature of the specimen; E is the applied field; σ is the electrical conductivity. The
first term on the left-hand side of equation represents heat absorbed by the material, and
the second term represents the heat lost to the surroundings. These are the two thermal
energy dissipation sources discussed above. The term on the right-hand side of the equation
represents the process of heat generation, which is dependent on the conductivity of the
material and applied field. The equation 5.1 clearly shows how the heat generation is
balanced by heat dissipation term. It is important to note that Cv, Kt and σ are functions of
both temperature and the applied field.
5.2.3 Electromechanical breakdown
Electromechanical breakdown takes place due to the electrostatic attraction of the
electrodes, which causes a mechanical compressive stress on the dielectric material
depending on its Young’s modulus. If the applied voltage is maintained, the field increases
due to the decrease in thickness, thereby increasing the attraction further. The breakdown
occurs when this mechanical compressive stress exceeds a critical value that cannot be
balanced by the dielectric’s elasticity. [99] Stark and Garton [105] gave the hypothesis for
this mechanism based on their observation of decreasing breakdown strength in
thermoplastics, when these materials start to soften with increase in temperature. This
breakdown mechanism can be mathematically evaluated by equating the two stresses for
the equilibrium situation before break down in a parallel-plate dielectric slab, i.e.,
electrostatic compressive stress = opposing elastic stress.
88
𝜖0𝜖𝑟
2 (
𝑉
𝑑)2
= 𝑌 𝑙𝑜𝑔𝑒 (𝑑0
𝑑) (5.2)
where Y is the Young’s modulus of elasticity, d0 is the initial dielectric thickness, and d is
the reduced thickness after application of voltage V. Rearranging the equation 5.2 in terms
of voltage,
𝑉 = 𝑑 (2𝑌
𝜖0𝜖𝑟𝑙𝑜𝑔𝑒 (
𝑑0
𝑑))
1
2
(5.3)
The above equation yields the critical voltage above which thickness goes to zero when
dV/d[d(V)]=0, which is expressed below:
𝑉𝑒𝑚 = 𝑑0 (𝑌
𝜖0𝜖𝑟exp (1))
1
2 (5.4)
Stark and Garton realized that their analysis pertaining to this model was rather
unrealistic as it assumed the dielectric material disappeared to an infinitesimal thickness at
V≥Vem, and it ignored plastic flow and dependence of Young’s modulus on time and stress.
The power law relation is used to characterize the polymers more accurately. [37]
𝜎 = 𝐾𝑒𝑁 = 𝐾 (𝑙𝑜𝑔𝑑0
𝑑)𝑁
(5.5)
1
2𝜖0𝜖𝑟 (
𝑉
𝑑)2
= 𝐾 (𝑙𝑜𝑔𝑑0
𝑑)𝑁
(5.6)
𝐸𝑐 =𝑉
𝑑𝑐=
2𝐾
𝜖0𝜖𝑟
1
2 (𝑁
2)
𝑁
2 (5.7)

89
where K is the Young’s modulus scales with the yield strength, N is the range of 0.1-0.6
for most polymers. For linear elasticity, K=Y and N=1; for the plasticity, N=0.
Table 5-1 Summary of dielectric theories of solids. [106]
I. Electronic breakdown process
Theories based on the single High energy criterion
electron approximation
Low energy criterion
Intrinsic breakdown
Collective critical field Single crystal
theories
Amorphous materials
Single avalanche model
Electron avalanche breakdown
Collective avalanche model
Field emission breakdown
Free volume breakdown
II. Thermal breakdown process
Steady state thermal breakdown process
Impulse thermal breakdown
III. Mechanical breakdown process
Electromechanical breakdown process

90
In addition to classification of various breakdown mechanism, the breakdown in
polymers depends on properties such as chemical structure, molecular motion, structural
irregularities, existence of additives etc. [99] Here, the focus will be on the electronic
breakdown mechanism and dependence of breakdown strength on the chemical structure,
specifically presence of polar groups in amorphous polymers. In the temperature
dependence of breakdown of non-polar polymers, the critical temperature (Tc) between low
and high temperature region clearly exists. However, in polar polymers a low temperature
region and Tc are not clearly defined. The introduction of a polar group in a polymer
structure increases the breakdown field in the low temperature region due to the scattering
of accelerated electrons by the dipoles from the polar group.
5.2.4 Frohlich amorphous solid model
Frohlich considered the effects of electron-electron interactions in an amorphous or
impure solid after giving his high-energy criterion theory. [102], [107] These types of
interactions are likely to dominate in amorphous insulators where traps are below the
conduction band. From his model, a collective breakdown field can be represented by the
following equation:
𝐸𝑐𝑜𝑙𝑙 = 𝐶 exp (𝛥𝐸
2𝑘𝐵 𝑇0) ,
where 𝐶 = (𝑚∗𝑛𝑣(𝑇0)𝐶2
exp (1)∆𝐸𝐶1)1/2 ℎ𝑣
𝑒𝜏𝑐 (5.8)

91
where C1 is an effective density of states and C2 = NtkBTe , Nt is the concentration of traps,
τc is the reciprocal of probability per unit time that an electron will make a transition in
energy.
In this mechanism, the breakdown strength drops rapidly with increasing
temperature, which has been observed in various amorphous materials. [107] The work
done by Austen and Pelzer [99] on polyethylene (PE) and polyvinylchloride (PVC)
confirmed the theory of Frohlich on amorphous solids. The long chains of PVC contain
strongly dipolar (H-C-Cl) side groups, which would act as scattering centers, thus the mean
free path for electrons in PVC should be much less than for PE. Frohlich theory predicts a
higher breakdown strength which was confirmed experimentally. [99] Moreover because
PVC is amorphous and PE is semi-crystalline, the transition to a negative temperature
coefficient of breakdown strength should be at a lower temperature; this was also found by
Austen and Pelzer. Apart from PVC, Wu et. al. showed that strongly dipolar and
amorphous polymers of thiourea can show high breakdown strength of (>1GV/m) at room
temperature due to presence of high dipole moment (>4Debye) polar groups, confirming
the Frohlich theory. [44], [108]
5.2.5 Dependence of breakdown strength on film thickness
Ideally, the dielectric breakdown strength of thin polymer films is a measure of the
intrinsic dielectric breakdown strength and should be independent of the thickness of film.
However, the situation is different for samples with thickness above 1 μm, which has been
supported by many studies in the past that show the dependence of breakdown strength on
92
the thickness. [109]–[113] It has been observed that the breakdown strength of the material
decreased with increasing the sample thickness. For instance, dc breakdown experiments
on very thin films deposited with Langmuir-Blodget technique have shown a power-law
dependence of the breakdown field on the film thickness. [109] In case of polypropylene,
it was shown that the electric strength of the polymer decreased with an increase in the
volume of an insulator, which was primarily due to the thickness dependence rather than
changes in area. [111]
In theory, the thickness dependence of breakdown strength is generally given by:
𝐸𝑏 = 𝑘𝑑−𝑛 (5.9)
where k is a constant, d is thickness of the sample, n is the exponent describing the
thickness dependence. For thermal breakdown mechanisms, this relationship is known for
steady-state and impulse thermal breakdown. Assumption of steady-state thermal
breakdown and field-independent conductivity leads to n=1 for thick slab approximation
(temperature distribution within the material) and n=0.5 for thin slab approximation
(constant temperature within material) .[99], [100] In case of field-dependent conductivity
and steady-state breakdown the exponents rely upon conduction mechanisms and show
independence or very weak dependence except space-charge limited conduction which
shows n=1.[99] The impulse thermal breakdown is independent or shows weak dependence
on the thickness.
In electronic breakdown, the intrinsic mechanism is independent of thickness. The
avalanche mechanism shows strong dependence on thickness for which Fowler-Nordheim
and Schottky emission result in n=0.5 and n=1. [114] While for electromechanical
breakdown mechanism, the breakdown strength is independent of thickness. The partial

93
discharge breakdown depends on the specimen dimension and void size; thickness
dependence shows n=0.39. [115]
5.3 Experimental section
5.3.1 Synthesis and film fabrication of PEMEU
Poly(ether methyl ether urea) (PEMEU) was synthesized from 2,2-Bis[4-(4-
aminophenoxy) phenyl] propane and diphenyl carbonate by polycondensation as shown in
Figure 5-1. The mixture of the two monomers was stirred at 150°C in vacuum for 4 h,
followed by washing with ethanol for 5-6 times to purify, and thus, PEMEU powder was
obtained. There is no solvent and no catalyst used in the synthesis. It is a green and low-
cost thermal polycondensation process. The 1H nuclear magnetic resonance (NMR) data
for PEMEU in DMSO-d6 is consistent with the structure of PEMEU (see Figure 5-2).
PEMEU peaks:1.48 (s, 6H, CH3-C-CH3); 7.07 (d, 4H, aromatic); 7.22 (d, 4H, aromatic);
7.48 (d, 4H, aromatic); 7.65 (d, 4H, aromatic); 8.75 (s, 2H, -NH-CO-NH-) and solvent
peaks: 2.45 (s, DMSO-d6); 3.35 (s, H2O in DMSO-d6). The free-standing films of PEMEU
were thermal processed (melt molding) under vacuum at 230°C, which is 70°C above its
Tg and 60°C below its decomposition temperature. The thickness of melt processed films
is in 70 μm to 100 μm range, that was used for dielectric characterization. To characterize
the high electric field response of the polymer films, solution-cast films of thickness down
to 1.32 μm were prepared. In this process, the PEMEU powder was dissolved in dimethyl

94
formamide (DMF) to make 1% solution by weight. The thin films were prepared by casting
the solution onto silicon substrates pre-coated with 40 nm of platinum at 70°C overnight,
and then annealed at 140°C under vacuum for 12 h. Circular gold electrodes of 2 mm to 6
mm in diameter were sputtered on the surfaces of the films for polarization loops
(charge/discharge) and dielectric characterization, respectively.
Figure 5-1 Schematic of synthesis and chemical structure of poly(ether methyl ether urea),
PEMEU.
Figure 5-2 1H-NMR spectrum for PEMEU in DMSO-d6.

95
5.3.2 Details of characterization equipment
The thickness of thin films was measured by Profilometer from KLA-Tencor. The
low-field dielectric constant and loss with varying temperature was measured using an HP
4294A precision impedance analyzer, which was connected to an environment test
chamber (Delta 9023). The Polarization-Electric field (P-E) response was measured with a
modified Sawyer-Tower circuit. The X-ray diffraction data were collected using a
Panalytical X’Pert PRO MPD diffractometer. Differential scanning calorimetry (DSC)
measurements were performed using the Q2000 DSC, TA instruments. The PEMEU
sample (film) was held in an aluminum pan and the scan was performed under nitrogen
ambient. The temperature was maintained at 40°C for 5 minutes, and then DSC scan was
performed as the sample was heated to 310°C at a heating rate of 10°C/min. The chemical
composition was characterized by 1H nuclear magnetic resonance (NMR) on a Bruker AM-
300 spectrometer. Atomic Force Microscopy (AFM) was performed using Bruker
Dimension AFM.
5.4 Results and discussion of PEMEU
In this work, a new type of aromatic polyurea, poly (ether methyl ether urea)
(PEMEU), was developed. Here, ether units are introduced to the polymer chain in order
to soften the rigid polymer backbone for developing thermally processable films. The
experimental results indicate that this approach is effective and free-standing films can be
fabricated using a laboratory melt molding machine. Concomitantly, the combination of
the high dipole moment of the urea units (dipole moment = 4.5 D), relatively high dipole

96
density in the polymer chains, and phenyl rings adjacent to the urea unit lead to a dielectric
constant of 4 with a low dielectric loss (~ 1%) over a broad temperature range (> 150°C).
The X-ray diffraction data of PEMEU film presented in Figure 5-3 (a) does not
show any sharp peak, just a broad halo at 2θ=17.5°, indicating that the polymer is
amorphous in nature. The amorphous nature of the PEMEU polymer can effectively
reduce the long-range polar coupling among the strongly dipolar urea units. Hence, in spite
of the very high dipole moment of the urea units in the polymer, the PEMEU films still
exhibit a low loss of 1 %. The DSC data in Figure 5-3 (b) shows a glass transition at 160°C
measured in the heating run. There is a heat absorption peak above 300°C due to the
decomposition of PEMEU. The high dipole moment and relatively high density of urea
units in the polymer chains impart a relatively high dielectric constant of 4 as presented in
Figure 5-4 (a), which is higher than most dielectric polymers reported in the literature with
dielectric constant below 3.3. [20], [32], [35] Moreover, the dielectric properties display
very little dispersion over a broad frequency range, a feature highly desirable for practical
dielectric devices. The temperature dependence of the polymer properties was also studied.
Figure 5-4 (b) shows that the dielectric properties of PEMEU are constant over a broad
temperature range and are stable up to 150°C.

97
Figure 5-3 (a) Wide angle X-ray diffraction data at room temperature and (b) DSC data
of PEMEU film measured during heating.

98
Figure 5-4 Dielectric constant and loss as functions of (a) frequency measured at room
temperature, and (b) temperature at frequencies from 1 kHz to 1 MHz of PEMEU films.
The error bars are attributed to the variation in thickness of film and the electrode area.

99
For dielectric films, the conduction loss at high electric field is a critical issue. [108],
[112], [113] Here, we examine the high field conduction loss of PEMEU films, especially
at very high electric fields. In dielectric films, it is well known that the dielectric breakdown
field increases with reduced film thickness. [112], [113] Earlier studies have shown that
the breakdown field of high-quality thin polymer films can reach > 1 GV/m. [44], [108]
Presented in Figure 5-5 is the electric breakdown field, measured from the polarization
loops at 10 Hz and room temperature, for the PEMEU films with different thickness. The
data shows that for PEMEU films of 1.32 µm thickness, the breakdown field can reach >
1.5 GM/m. The film quality (uniformity) was characterized by AFM and the result is
presented in Figure 5-6 (a). Indeed, across 2 µm x 2 µm surface area, the variation of the
film thickness is less than 0.5 nm for a 2.5 µm thick film. As observed in an earlier study,
avoidance of deep valleys in polymer films is essential for high dielectric strength, since
the sputtered electrode metal will penetrate into the defect areas and reduce the effective
dielectric thickness. [108] These thin spots in films will experience higher electric field,
increasing the conduction loss and causing breakdown.
The charge/discharge behavior was characterized in PEMEU thin films to
probe high field conduction and discharged energy density. The charging/discharging
behavior of the PEMEU films of 1.32 μm thick is presented in Figure 5-6 (b), measured at
10 Hz at room temperature. The data reveal that the 1.32 μm thick PEMEU films can reach
a breakdown field > 1.5 GV/m. It is interesting to note that the films even under 1.524
GV/m still show low conduction loss. The discharged energy density (UE, energy released)
and total stored energy density (US=UE + UL, where UL is the energy loss density) at high
fields were calculated from the charge-discharge curves as illustrated in Figure 5-6 (c),

100
where the charge-discharge efficiency ( ) is given by S
E
U
U .[14]
Figure 5-5 Electric breakdown field vs. film thickness for the PEMEU films measured at
room temperature. Dots represent y-axis error bars and symbols represent x-axis error
bars.
Due to the low conduction loss, the discharge energy efficiency at 1.524 GV/m is
90%, much higher than the non-polar polymers. [33] As a result, the polymer film delivers
a discharged energy density of 36 J/cm3, see Figure 5-6 (d). The results here are consistent
with the consideration that an effective approach to cut down the high field conduction loss
is to include high concentration of dipoles and deep traps in the polymer. The Coulombic
interaction between dipoles and charge carriers causes strong scattering compared with the
phonon-electron scattering, which reduces the conduction current and prevents dielectric
breakdown.[99], [116] Moreover, when the dipole moment exceeds a certain critical value,
as defined by, 64.0oaq
p
, the polar groups can also act as traps.[117]–[119] Here
q=1.6x10⁻¹⁹ C is the elementary charge, a0=5.29x10⁻¹¹ m is the Bohr radius, and ϵ is the

101
effective dielectric constant that represents the dielectric screening effect due to the
medium. Considering the ultrashort electron transit time between scattering events under
very high electric field, the optical-frequency dielectric constant ϵ~2.48 is used for
estimation, which has been calculated from the refractive index of 1.577 at 632.8 nm for
polyurea [15]. This leads to a critical dipole moment of 4.04 D and dipole moment of urea
group (4.5 D) is much higher than this critical dipole moment.
Figure 5-6 (a) AFM image, (b) Charging/discharging curves under different unipolar
fields, (c) Schematic showing calculation of discharged energy density and loss under high
field from the charging/discharging curves, (d) Discharged energy density as a function of
field of PEMEU thin films of 1.32 μm thick, measured at room temperature. Dots represent
y-axis error bars and symbols represent x-axis error bar.

102
5.5 Introduction of nanoparticle dopants to reduce the conduction loss
In the first part of this chapter, an approach to reduce conduction loss was discussed
by incorporating high dipole moment units which act as scattering centers, thus reducing
the conduction loss. Still, it is important to explore other approaches for dielectric materials
that show promise for scalability and have been attractive for high energy density
capacitors.
Poly(vinylidene fluoride) (PVDF) based polymers have been considered for high
energy density capacitors as they exhibit high dielectric constant and high breakdown
strength. [16], [17], [36], [120] Dielectric constant from 10 to 50 can be achieved in these
semi-crystalline polymers. However, the strongly coupled dipoles in these polymers
exhibit pronounced polarization hysteresis at high fields, resulting in high loss. By
introducing tetrafluoroethylene (TFE) to VDF to provide low loss and high temperature
stability, and hexafluoropropylene (HFP) for ease of thermal processibility, Zhang et al.
[98] have shown that the P(TFE-HFP-VDF) polymer is attractive for high temperature and
high energy density capacitors. However, for high temperature applications, its conduction
loss at high temperatures and high fields needs to be reduced.
Nanocomposites belong to a new class of materials that are engineered for
improved material performance. [11], [81], [121] Ceramic nanoparticles can be blended
with dielectric polymer matrix to form polymer nanocomposites in which the large
interfacial areas and associated phenomena may be utilized for improving the dielectric
performance and electric insulation. For example, in previous studies, it has been shown
that the conduction can be reduced by an order of magnitude in a semi-crystalline polymer,

103
i.e., linear density polyethylene (LDPE), due to increased trap density in the nanocomposite
compared with the neat polymer.[122], [123] In this second part of the chapter, the
conduction at high temperatures and at fields up to 100 MV/m has been investigated in a
semi-crystalline poly(tetrafluoroethylene-hexafluoropropylene-vinylidene fluoride)
(THV) terpolymer, which has been shown to be attractive for high energy density
capacitors.
5.6 Review of conduction in polymers
Electrical conduction is governed by the manner of generating charge carriers and their
transport in a material. In general, the measured leakage current of a polymer film consists
of two parts:
𝐽 = 𝐽𝑐 + 𝐽𝑑 (5.10)
where Jc is the conduction current and Jd is the displacement current. The
displacement current is due to the change in electrical displacement with time, which is:
𝐽𝑑 =𝑑𝐷
𝑑𝑡 (5.11)
Displacement current is closely related to dielectric relaxation in the polymer as
shown by the equation (1.4) in Chapter 1. While, the conduction current is generated by
transport of charge carriers. The charge carriers that contribute to conduction current can
be either intrinsic carriers that are provided by the material itself or external carriers that
are injected from electrodes. [12]

104
For a metal-insulator-metal (MIM) structure, the conduction process can be
described in three steps: charge injection from electrode into the polymer, charge transport
in the bulk, and charge escaping from polymer to electrode. Each step contributes to the
total conduction current and the step with lowest charge transition rate will limit the overall
conduction current. Based on the different limitations, the conduction in polymers can be
classified as: electrode (injection) limited conduction and bulk limited conduction. Figure
5-7 illustrates the conduction mechanism in polymers. [12] HOMO (Highest Occupied
Molecular Orbital) and LUMO (Lowest Unoccupied Molecular Orbital) are used in
polymers or organics instead of valence band and conduction band.
Figure 5-7 Schematic of conduction process in polymers. [12]

105
5.6.1 Electrode limited conduction
In the electrode-limited case, the bulk material can take more carriers than the
electrode supplies, and correspondingly the current is limited by charge injection from the
electrodes into the insulator through an energy barrier. Since, this energy barrier prevents
the injection of the charge carriers from the electrodes, the charge carriers must overcome
these energy barriers for the current to flow.
The contact between the metal electrodes and polymers can be either Ohmic or
Schottky type depending on the relative position of the Fermi levels of metal electrodes
and polymers.
1. Schottky emission
In the Schottky theory, or also called thermionic emission, the current density is
generated by the electrons emitted from the electrode to the conduction band (LUMO) of
the insulator governed by the height of the Schottky barrier. [124], [125] With the
assistance of image force, and external field lowering barrier height, the charge carriers can
be injected by acquiring sufficient thermal energy to surpass the barrier. Figure 5-8 depicts
the Schottky contact between metal and n-type polymer. For Schottky emission, if the
electrons emitted from the cathode are not influenced by either space charges or traps, and
collected at the anode, then the thermionic emission is given by:
𝐽 = 𝐴∗𝑇2𝑒𝑥𝑝 (−𝜙𝑆
𝑘𝐵𝑇) 𝑒𝑥 𝑝 (
𝛽𝑆√𝐸
𝑘𝐵𝑇) (5.12)
where T is temperature, 𝜙𝑆 is the barrier height, 𝑘𝐵 is Boltzmann’s constant,
𝐴∗ is the Richardson constant, which is related to effective mass:

106
𝐴∗ =4𝜋𝑞𝑘𝐵𝑚∗
ℎ3 , (5.13)
and 𝛽𝑆 is expressed as:
𝛽𝑆 = √𝑞3
4𝜋𝜀0𝜀, (5.14)
Practically, the injected charge carriers can accumulate near the interface and form
space charges at the interfaces. In addition, the defects at the interface act as traps in
polymer and influence the electrode conduction. The disordered nature of most polymers,
narrow energy band from the weak-coupling between the polymer chains, and the presence
of localized states result in smaller mean free path of charge carriers in dielectric polymers
compared to crystalline materials. Therefore, the equation (5.12) needs to be modified to
account for these effects. A modified formula for Schottky emission, which takes into
account the finite bulk transportation rate in solids has been suggested by Simmons:
𝐽 = 2𝑞𝜇𝐸 (2𝜋𝑚∗𝑘𝐵𝑇
ℎ2 )
3
2𝑒𝑥𝑝 (−
𝜙𝑆−𝛽𝑆√𝐸
𝑘𝐵𝑇) (5.15)

107
Figure 5-8 Schematic showing Schottky contact between metal and n-type polymer (a)
before contact, (b) after contact, (c) barrier lowering by image force and (d) barrier
lowering by external voltage. [126], [127]
2. Field emission
The field emission is caused by the quantum mechanical tunneling of electrons
across the potential barrier at high electric field. [128] Usually, field emission dominates
at low temperature, as electrons can be emitted from the Fermi level of the metal to the
insulator. At high temperature, the electrons tunnel at energy levels higher than the Fermi
level. In this case, the emission will be thermally assisted field emission. As temperature
continues to rise, the thermionic emission will dominate. The field emission current in
defect free insulator is given by:

108
𝐽 = 𝐴∗𝑇2𝑒𝑥𝑝(−2𝛼𝜙𝐵
3/2/3𝑞𝐸)
(𝛼𝜋𝐵1/2
𝑘𝑇/𝑞𝐸)sin(𝜋𝛼𝜋𝐵1/2
𝑘𝑇/𝑞𝐸) (5.16)
At low temperatures, the equation can be simplified to:
𝐽 = 𝐴∗𝑇2
𝜋𝐵(
𝑞𝐸
𝛼𝑘𝑇)2
𝑒𝑥𝑝 (−2𝛼𝜋𝐵
3/2
3𝑞𝐸) (5.17)
In case the defects are considered, the field emission current will be largely affected
as the electrons will be partially captured by the traps in the insulator; resulting in space
charge near the interface of the metal-insulator. The Fowler-Nordheim tunneling current
density can be rewritten as:
𝐽(𝑡) = 𝑞2𝑚0[𝐹𝑐(𝑡)]
2
16𝜋2ℎ𝑚∗[𝑞𝜋𝐵(𝑡)] ×𝑒𝑥𝑝
4(2𝑚∗)1/2[𝑞𝜋𝐵(𝑡)]3/2
3ℎ𝑞𝐹𝑐(𝑡) (5.18)
5.6.2 Bulk limited conduction
When the injected charge carriers from electrode transit through the polymer film,
they may experience several resistances such as phonon scattering, defect trapping,
recombination etc. When the rate of bulk transportation is much slower than the supply of
carrier from the electrode, the total conduction will behave as a bulk limited current.
1. Space charge limited conduction
Space charge is generally referred to as the space filled with a net positive or
negative charge, and it is commonly observed in semiconductors and insulators. Such a
space charge can impose the number of charge carriers passing from one electrode to the
other, thus conduction is referred to as space charge limited. For example, if the cathode
109
emits more electrons per second than the polymer can transport, the remainder will
accumulate and form a negative space charge, which creates a field to reduce the rate of
electron emission from the cathode. Therefore, the current is controlled not by the electron-
injecting electrode but by the bulk of insulator or semiconductor. Without considering
traps, the ideal space charge limited current density can be expressed as:
J= 9/8ϵ0 ϵμV2/d3 (5.19)
where μ is the mobility in the polymer, V is the applied voltage and d is the
thickness of the sample. In space charge limited conduction, the current is proportional to
the square of the applied voltage. In the presence of traps in the polymer, part of space
charge may be trapped and cannot contribute to conduction. The current-voltage
characteristics of space-charge limited conduction has been summarized in Figure 5-9. The
mathematical derivation and details of space charge limited conduction with traps can be
accessed from Kao (2003). [12], [129], [130]

110
Figure 5-9 Schematic graph showing current density versus voltage for an ideal case of
space-charge limited current.[12]
2. Poole-Frenkel Conduction
The Poole-Frenkel conduction bears similarity with Schottky emission and it is also
referred as internal Schottky effect, since the mechanism of this effect is associated with
field-enhanced thermal excitation (or detrapping) of trapped electrons or holes. Both
effects are due to columbic interaction between the escaping electron and a positive charge,
but they differ in that the positive charge is fixed for the Poole-Frenkel trapping barrier,
while the positive charge is a mobile image charge for the Schottky barrier. In this case,
the effects of applied field would be strong enough to distort the potential well and lower
the energy barrier of the trap, effectively decreasing the depth of the trap. [12]

111
Polymers have intrinsic defects due to structure disorders and extrinsic defects due
to chain end groups and impurities left from processing. These defects act as traps ending
to capture charge carriers either from the electrode or from band conduction. With some
thermal excitation, the trapped electrons or holes can escape from these traps due to the
barrier lowering by applied high field. The current density due to Poole-Frenkel effect is
given by:
𝐽 = 𝜎0𝐸𝑒𝑥𝑝 (−𝐸𝑡
𝑘𝐵𝑇)×𝑒𝑥𝑝 (
𝛽𝑃𝐹√𝐸
𝑘𝐵𝑇) (5.20)
where 0 is the zero-field conductivity, Et is the trap energy barrier, βPF is Poole-
Frenkel constant given by:
𝛽𝑃𝐹 = √𝑞3
𝜋𝜖0𝜖 (5.21)
3. Hopping Conduction
A localized electron can drift in a bulk material by hopping from an occupied state
to an unoccupied state of a neighboring molecule if it acquires the energy necessary to
overcome the potential barrier. The carriers gain enough energy through random thermal
fluctuations and phonon interaction to escape their localized state and travel in an extended
state for a small amount of time before being recaptured by another localized state. [12],
[130], [131]
The probability of a hopping transition may be determined by both the distance
between the two sites and the potential barrier that must be overcome. If the potential
barrier width (i.e., the distance between the two sites) is larger than 10 Å, electron hop

112
from one molecule to the neighboring molecule. The probability of a hopping transition
may be determined by both the distance (l) between two sites and the barrier height Ea to
overcome:
𝐽 = 𝐽0exp (−𝐸𝑎
𝑘𝐵𝑇)×𝑒𝑥𝑝 (
𝑞𝑙𝐸
2𝑘𝐵𝑇) (5.22)
In disordered materials, like polymers, the individual carriers in presence of high
density of traps can exhibit percolation type transport. [131]–[133] When percolation is
applied to polymers, it typically takes the form of a spatially random resistor network with
each link of the network corresponding to the probability of a carrier hop between localized
states. [134], [135] The Figure 5-10 shows the current path through a hopping system
corresponding to a random resistor solution. The important feature of any percolation
model is the sudden appearance of long-range connectivity at a critical value, typically a
critical temperature (Tc). This transition point can be often linked to a physical transition
point, such as glass transition temperature. Below a critical temperature Tc, carriers are
restricted to interchain movement; above Tc the carriers can gain enough energy through
phonon interaction for long-range, interchain movement. In theory, this transition should
be quite sudden, however in practice, the wide variety of chain lengths and variability in
interconnectivity between crystalline and amorphous regions produces a continuous
transition, that can be difficult to observe sometimes. [99], [132], [133]

113
Figure 5-10 Schematic showing random resistor network percolation.
5.7 Film preparation and characterization of THV nanocomposites
The alumina nanoparticles of size 30-50 nm dispersed in IPA were purchased from Sigma
Aldrich. The THV polymer with composition – TFE/HFP/VDF-76/13/11 by weight, in form
of pellets was provided by PolyK Technologies. The nanoparticles were mixed with the
pellets in ethanol by wt.%. The solution was kept in vacuum for 24 hours. The resultant
THV polymer and nanoparticle mix was thoroughly mixed in a twin-screw micro
compounder. The resultant polymer nanocomposite was melt molded at 300°C to obtain
films of 30-40 µm thickness. It can be noted that the wt.% can be converted to vol.% by
using density of PVDF (ρ=1.8 g/cm3) and alumina nanoparticle (ρ=3.9 g/cm3); thereby
1wt.% equals to 0.46vol.%. The film thickness was evaluated using a digital micrometer.

114
The wide-angle X-ray scattering (WAXS) data were collected using a Panalytical X’Pert
PRO MPD diffractometer. The curve fitting and crystallinity was calculated using JADE
analysis software. WAXS two-dimensional images were obtained using a Rigaku DMAX-
Rapid II micro-diffractometer. The dielectric data was characterized by using HP 4294A
Precision Impedance Analyzer. The conduction current was characterized using a HP
4140B pA meter, which was connected to Trek High Voltage Amplifier (Model 609 D-6)
and environment test chamber (Delta 9023). A wait time of 20 seconds was given after every
voltage step for the current measurement. A longer wait time of 100 seconds was also used
at several temperatures and fields. There is no significant difference between the trends of
two sets of data. Same conditions were emulated when simulation work was performed.
The empirical data above and below critical temperature (Tc) are used to identify
direct tunneling and hopping conduction as the dominant charge injection and bulk
transport mechanisms, respectively, through nanocomposite film consisting of Al2O3 fillers
dispersed in the THV binder. Extracted parameters viz. barrier height, effective electron
mass, equivalent oxide thickness, mean hopping distance, trap depth, and density of state
in the conduction band are used together with measured I-V data and derived hopping
mobility for multiscale simulations with original and self-consistent continuum and particle
models to predict leakage conduction behavior at high temperature and high field.[136]–
[141] The multiscale models incorporate measured and extracted data from injection by
direct tunneling and hopping conduction transport together with charge
attachment/detachment, and recombination. The continuum model uses an effective
permittivity derived from the Lichtenecker logarithmic rule while the particle model caters

115
to an electrical double layer representation for the nanofiller. The details of simulation
models can be found in the supplemental section of Ref. [142].
5.8 Results and discussion of THV nanocomposites
The THV (TFE/HFP/VDF-76/13/11 mol%) polymer shows a dielectric constant of 4.3 and
low loss of <1% at 1 kHz as presented in Figure 5-11 and Figure 5-12 (a). The polymer
maintains its low loss at high temperatures (>100°C), see Figure 5-12, which is a desirable
feature for practical applications. The glass transition temperature (Tg) of the polymer is at
55°C as obtained from dynamic mechanical analysis (see Figure 5-12(b)). The data in Figure
5-12 (a) reveal that introducing various filler loadings of alumina nanoparticles into THV
polymer does not affect the dielectric properties and Tg.
Figure 5-11 Dielectric data of neat THV as a function of temperature.

116
As shown in Figure 5-13 (a), there is a large increase in the conduction current (J)
for neat THV at high temperature and high field, i.e., a 10X increase in the conduction
current as the polymer transitions from 45°C to 55°C and then another 10X increase from
55°C to 65°C, as a result of going through the Tg transition. Above Tg, the segmental
motions of the polymer chains will facilitate charge hopping, resulting in a large increase in
conduction current. [12], [34] The conductivity, defined here as the ratio of J(E)/E where E
is the applied field and J(E) the conduction current at E, as a function of field and
temperature is presented in Figure 5-13 (b) and 5-13 (c). The conductivity at 125 °C is
almost three orders of magnitude higher than that at room temperature.
The conduction current of THV nanocomposites with 0.5 wt%, 1 wt%, and 2 wt% of
alumina nanofillers (30 to 50 nm size, 1 wt % ~ 0.46 volume %) was characterized and is
presented in Figures 5-14 to 5-16. Figure 5-14 reveals that the high field conduction (> 40
MV/m) at high temperature (> 80 oC) is reduced by more than two orders of magnitude by
adding 0.5wt.% alumina nanoparticles to the THV polymer. While the nanofillers do not
affect the glass transition of the polymer matrix as observed in Figure 5-11(b), the
nanocomposites with 0.5 wt% nanofillers do not exhibit much changes in the conductivity
from room temperature to ca. 90oC, which is in sharp contrast to the large increase of
conductivity as the neat THV polymer passing through Tg. The result indicates that the
nanofillers effectively suppress the Tg effect on the leakage current of the neat THV
polymer. The nanofillers have a large surface area that leads to large amount of interface
regions between the nanoparticles and the polymer matrix. The local structure changes in
the interface area due to the polymer-nanoparticle interaction may increase the density and

117
depth of the charge carrier trapping sites, thus, reducing the conduction current. [71], [74],
[97], [143]
Figure 5-12 Dielectric data as a function of frequency for THV and THV nanocomposite
films, (b) DMA of THV and THV+0.5 wt.% Al2O3 films.

118
Figure 5-13 (a) Current density, (b) conductivity as a function of field at different
temperatures, (c) conductivity as a function of temperature at different fields for neat
THV film.

119
It is noted that the nanocomposites show an increase in the conductivity after 95°C
(Figure 5-14). The increase in the conduction current can be explained by percolation
theory. [131] In polymers, percolation takes the form of a spatially random resistor network
with each line of the network corresponding to the probability of carriers hopping between
localized states. The important feature of percolation is the appearance of long-range
connectivity at a critical value, such as at a critical temperature (Tc). The mobile charge
concentration n0 increases with temperature which reaches a critical concentration at Tc for
percolation. Below the temperature Tc, carriers are restricted to intra-chain movement while
above Tc, the carriers can gain enough energy through phonon interaction for long-range,
inter-chain movement. Even with such a percolation transition, n0 of the nanocomposites at
125oC is still 10X smaller and trap depth is more than 10% higher than those of the neat
THV polymer. Consequently, the high temperature (125oC) and high field (> 40 MV/m)
conductivity of nanocomposites with 0.5 wt.% of alumina nanofillers is more than two
orders of magnitude lower than that of the neat THV polymer.

120
Figure 5-14 (a) Current density, (b) conductivity as a function of field at different
temperatures, (c) conductivity as a function of temperature at different fields for
THV+0.5 wt.% Al2O3 film.

121
Similar reduction in the conduction current and conductivity is seen in the case of THV with
1 wt. percent alumina (Figure 5-15). The drastic reduction in conduction current by alumina
nanofillers at high temperatures is summarized in Figure 5-16. At 125°C, the conduction is
reduced by more than two orders of magnitude by addition of merely 0.5 wt.% alumina
nanocomposite film. The effect is confirmed in 1 wt.% alumina composition as well. A
threshold-like behavior is observed at 2 wt.% loading, i.e., further addition of nanoparticles
causes an increase in the dc conductivity. At high filler concentration, increased shallow
traps start behaving as conducting paths (forming percolation path), thus resulting in high
conductivity. [75], [123] Figure 5-16 (b) shows the conductivity at several temperatures as
functions of alumina nanofiller content. It’s clearly visible that there is an optimum
composition of filler loading (<2 wt.%), where dramatic reduction in conductivity can be
obtained.

122
Figure 5-15 (a) Current density, (b) conductivity as a function of field at different
temperatures, (c) conductivity as a function of temperature at different fields for THV+1
wt.% Al2O3 film.
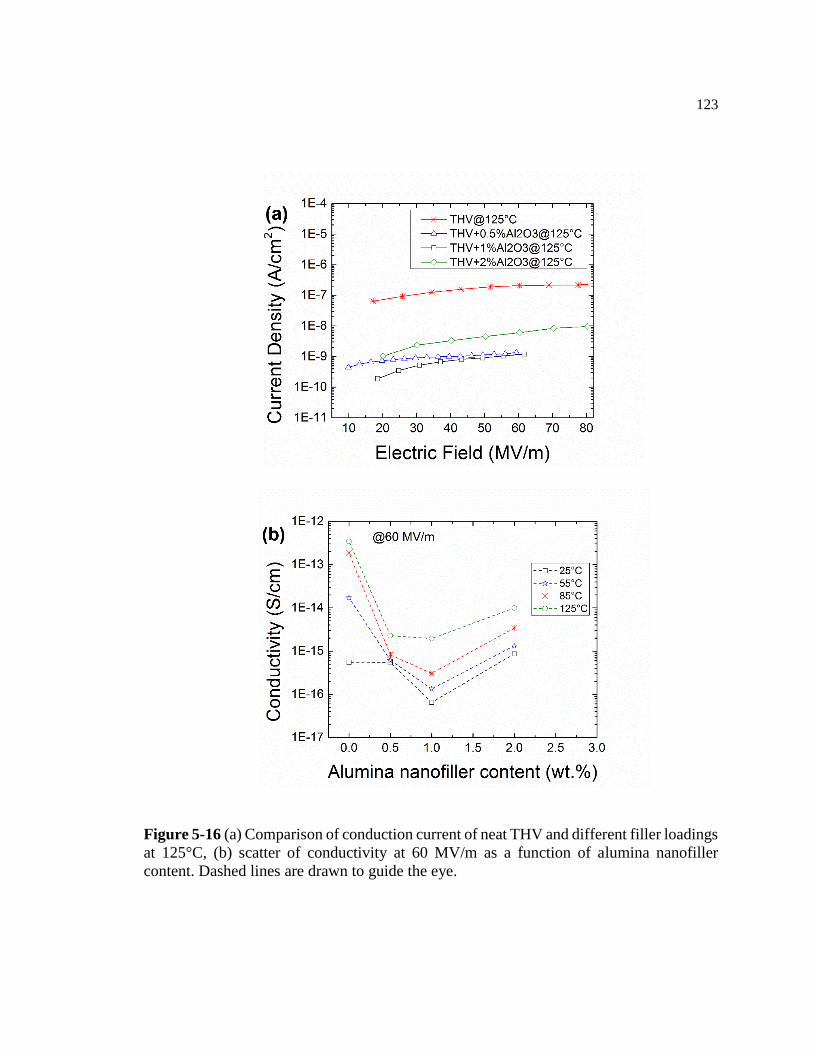
123
Figure 5-16 (a) Comparison of conduction current of neat THV and different filler loadings
at 125°C, (b) scatter of conductivity at 60 MV/m as a function of alumina nanofiller
content. Dashed lines are drawn to guide the eye.

124
To provide insights into the experimental observations, we carried out simulation study on
the charge transport in these nanocomposite films. The multiscale models incorporate
measured and extracted data from injection by direct tunneling and hopping conduction
transport together with charge attachment/detachment, and recombination. [142], [144]
Figures S4 show the conductivity derived from measured I-V data and computed leakage
conductivities from multiscale simulations for T=85°C and 125°C as functions of electric
field for cases with THV+0.5wt.% Al2O3 and THV+1.0wt.% Al2O3, respectively. Both
continuum and particle models are in good agreement with each other and exhibit excellent
agreement with those derived from measured I-V data, thus, confirming the hopping
conduction as the dominant charge transport mechanism.
Fitting the experimental data of the neat THV polymer and nanocomposites with 0.5 wt%
nanofillers to the hopping current equation,
𝐽 = 𝑞𝑎𝑛0 𝑒[𝑞𝑎𝐸
𝑘𝑇−
𝐸𝑎𝑘𝑇
] (3.14)
yields the carrier concentration n0 as well as other parameters. Indeed, as can be seen, n0 of
2.85x10¹⁶/m3 for nanocomposites at 85 oC with 0.5 wt% nanofillers is about 20X lower than
that of the neat THV at 55oC. In addition, the trap depth is also increased in the
nanocomposites. Table 5-2 summarizes the fitting parameters of Eq. (1), hopping
conduction, for the neat THV and THV nanocomposites. Figure 5.17 plots the mobile
carrier concentration and trap depth vs. the filler content at 125oC. The mobile carrier
concentration decreases with the nanofillers in the composites, from 2.5x10¹⁸/m3 of neat
THV to 3.38x10¹⁵/m3 of the nanocomposites with 2 wt% alumina nanofillers. On the other
hand, the trap depth for the carrier hopping is the highest for the nanocomposites with 0.5

125
wt% alumina while the trap depth of 2 wt% nanocomposites becomes shallower (0.46 eV)
than that of the neat THV (0.52 eV). Combining the two effects leads to the lowest
conductivity for nanocomposites with < 2 wt% nanofillers.
Figure 5-17 Comparison of leakage conductivity from simulation and measurement at
85C and 125C for: (a) THV+0.5 wt.%, and (b) THV+1.0 wt.%, (c) carrier
concentration and trap depth as a function of filler content.
(
b)

126
Table 5-2 Summary of fitting parameters of hopping conduction equation for the neat
THV and nanocomposites.
Temperature
(°C)
Hopping
Distance (nm)
Carrier
Concentration
(#/m3)
Trap Depth
(eV)
Neat THV Polymer
35 0.7962 1.3219E+17 0.4879
55 0.7851 4.9620E+17 0.4849
125 0.6478 2.4968E+18 0.5204
THV+0.5wt% Al2O3
85 1.8510 2.8504E+16 0.6214
125 0.6288 2.2991E+17 0.6022
THV+1wt% Al2O3
85 0.9492 1.6181E+16 0.5525
125 1.0553 1.3082E+16 0.5550
THV+2wt% Al2O3
85 1.3662 3.4373E+15 0.4604
125 1.2494 3.3773E+15 0.4610
The wide-angle X-ray scattering (WAXS) results in Figure 5-18 show sharp crystalline
peak around 18° for both neat THV polymer and THV+1 wt.% Al2O3 nanocomposite film.
The crystallinity percentage calculated using Jade software for neat THV came out to be
47.61% with least-squares fitting residual (R)=2.9%. The high crystallinity can be
attributed to the presence of large wt.% of TFE as a monomer in THV. Interestingly, the
crystallinity decreases to 39.24% with R=3.3% in THV+1 wt.% Al2O3 films. To check if
there is a change in orientation of the polymer chains by addition of nanoparticles, we
performed 2-D WAXS (see Figure 5-19). Both neat polymer and nanocomposite films
show ring-like, isotropic scattering patterns suggesting no change in the orientation.

127
Figure 5-18 X-ray diffraction data of neat THV polymer and THV+1 wt.% Al2O3
nanocomposite films.
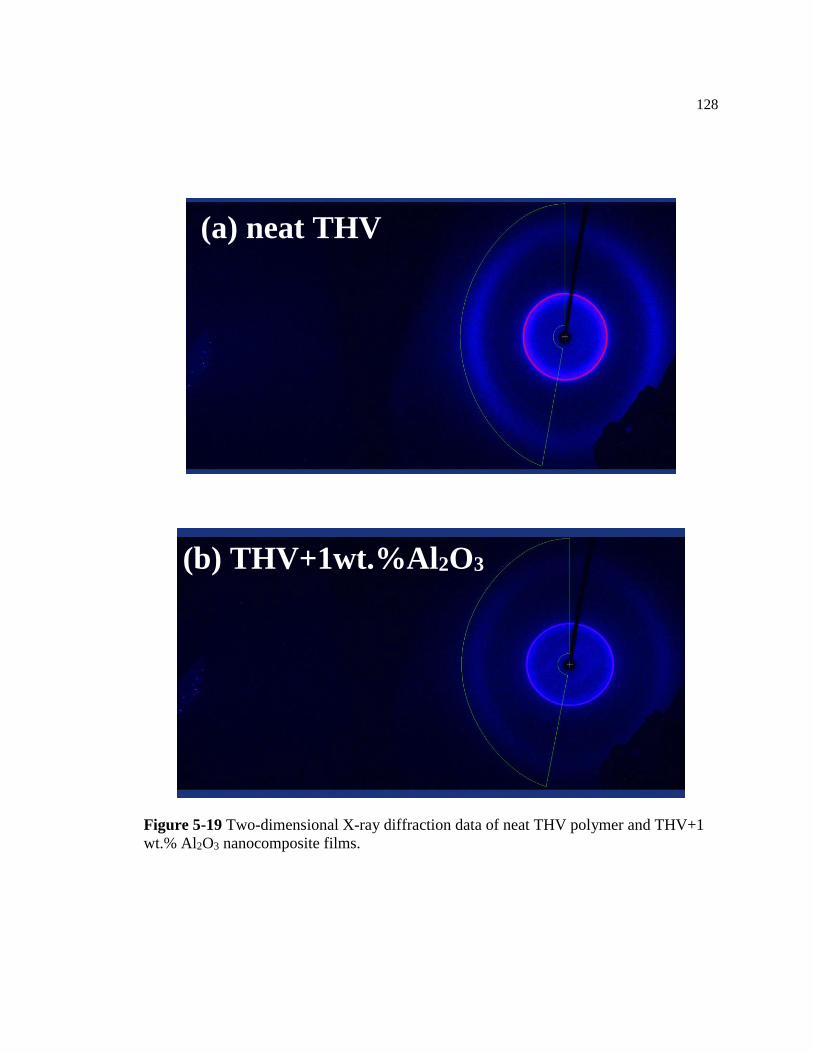
128
Figure 5-19 Two-dimensional X-ray diffraction data of neat THV polymer and THV+1
wt.% Al2O3 nanocomposite films.
(a) neat THV
(b) THV+1wt.%Al2O3

129
5.9 Conclusion
In summary, a thermally processable polymer, PEMEU, which shows a dielectric
constant of 4 with a low loss and thermal stability up to 150°C, was developed. In the high-
quality thin polymer films of 1.32 μm thick, an exceptionally high breakdown strength
(>1.5 GV/m) has been obtained. Because of the high dipole moment of urea units and
amorphous glass structure, the polymer films exhibit a low conduction loss even under 1.5
GV/m field. Consequently, the films generate a discharged energy density of 36 J/cm3.
In addition, it is shown that addition of small fraction (< 0.5 vol%) of alumina
nanofillers significantly reduces the conduction current in the THV polymer, which is
effective in introducing deep traps in the polymer matrix to suppress the mobile carrier
concentration. The results further reveal that there might exists a threshold nanofiller
concentration beyond which the suppression of conduction current becomes less effective.
Simulation study is in agreement with experimental findings. Moreover, the very low
volume content as demonstrated in the THV nanocomposites makes it possible to fabricate
nanocomposite films using melt extrusion technology, which is a very low cost and large-
scale fabrication technology for creating high quality polymer dielectric films. Thus, this
study paves the path for development of practical high temperature polymer-based
dielectrics using nanocomposites which exhibit low conduction loss at high fields and high
temperature.
130
Acknowledgement
The part of this chapter has been published in Journal of Electronic Materials, Applied
Physics Letters and International Conference of Dielectrics Proceedings. Reproduced here
by the permission of Springer and AIP Publishing LLC.
[1] Y. Thakur, M. Lin, S. Wu, and Q. M. Zhang, “Aromatic Polyurea Possessing High
Electrical Energy Density and Low Loss,” J. Electron. Mater., vol. 45, no. 10, pp. 4721–
4725, 2016
[2] Y. Thakur, T. Zhang, M. Lin, Q. Zhang, and M. H. Lean, “Mitigation of conduction
loss in a semi-crystalline polymer with high dielectric constant and high charge-discharge
efficiency,” in Dielectrics (ICD), 2016 IEEE International Conference on, 2016, vol. 1,
pp. 59–63
[3] Y. Thakur, M. H. Lean, and Q. Zhang, “Reducing conduction losses in high energy
density polymer using nanocomposites,” Appl. Phys. Lett., vol. 110, no. 12, p. 122905,
2017.

131
Chapter 6
Conclusion and recommendations for future work
6.1 Summary
The rational design of dielectric materials for high energy storage film capacitors
is one of the most active academic research areas in advanced functional materials. The
development of high energy storage capacitors will open ways for portable power supply
units for advanced weaponry; weight reduction for hybrid electric vehicles and medical
devices. This dissertation focused on designing nanostructured dielectric materials based
on fundamental concepts of applied polymer physics for application in high energy storage
capacitors. The key components for selection of dielectric materials are: dielectric constant,
loss, breakdown strength and thermal stability. In this dissertation, all of these components
have been discussed and addressed using rational design of materials.
Free volume approach
It is well known that strongly dipolar polymers that are weakly coupled exhibit low
dielectric loss, but also low dielectric constant at temperatures far below the glass transition
temperature Tg, due to constraints of the glassy structure on the dipoles. In contrast, at
temperatures above Tg, the reduced constraints on the dipoles, due to increased free
volume, lead to a large increase in dielectric constant. However, the loss also increases
markedly. The challenge is to introduce the free volume at temperatures below Tg, so that

132
large segment motion can be avoided and low loss is maintained. In this dissertation, we
showed through combined theoretical and experimental studies that by optimizing the
nanostructures in a family of weakly-coupled strongly dipolar polymers, such as aromatic
urea and thiourea polymers, we can overcome this challenge and develop a high energy
density polymer with low loss and high operating temperature. Two approaches to
introduce free volume below Tg was discussed: (1) by introducing disorder; (2) by blending
of two dissimilar dipolar polymers.
By introducing disorder in meta-phenylene polyurea (meta-PU), it is the free volume effect
(FVE) at temperatures below Tg (> 200°C) that leads to a high dielectric constant (K > 5.6).
It also possesses very low loss (high charge/discharge efficiency) even at very high electric
fields (> 600 MV/m). These results uncover that a disordered structure with a significantly
larger free volume enables easier reorientation of dipoles in response to an electric field
even at temperatures far below Tg, leading to a high dielectric constant while preserving a
low dielectric loss.
In the second approach, we showed that by blending two polymers from a family
of weakly-coupled strongly dipolar polymers, such as aromatic urea and thiourea polymers,
a high-energy density polymer with low loss and high operating temperature can be
realized. The resulting polymer blend of two strongly dipolar polymers, e.g., poly(arylene
ether urea) (PEEU, K = 4.7) and aromatic polythiourea (ArPTU, K = 4.4) exhibits an
exceptionally high dielectric constant, K = 7.5, while maintaining a low dielectric loss (<
1%). Both structure analysis and computer simulation results indicate that the nano
(molecular)-scale mixing of the two polymers causes a slight increase of the interchain
spacing in the glassy blend, thus reducing the barriers for dipole reorientation along the
133
applied electric field and generating a high dielectric response without compromising the
dielectric loss. Furthermore, we are able to show that the increase in the dielectric constant
of the mixture is due to increase in its specific volume, which enables easier reorientation
of the dipoles with the applied field.
Nanocomposite approach in dipolar polymers for high dielectric constant
In order to raise the dielectric constants of polymer-based dielectrics, composite
approaches, in which inorganic fillers with much higher dielectric constants are added to
the polymer matrix, have been investigated. However, the high dielectric constant fillers
cause high local electric fields in the polymer, resulting in a large reduction of the electric
breakdown strength. We show that a significant increase in the dielectric constant can be
achieved in polyetherimide nanocomposites with nanofillers whose dielectric constant can
be similar to that of the matrix. The presence of nanofillers reduces the constraints on the
dipole response to the applied electric field, thus enhancing the dielectric constant. Our
results demonstrate that through nanostructure engineering, the dielectric constant of
nanocomposites can be enhanced markedly without using high dielectric constant
nanofillers.
The realization of this proposed interfacial effect and successful demonstration of
the improvement in dielectric properties of dipolar polymers opens up new pathways in the
future research of nanocomposites. Most importantly, this approach can be applied to many
existing high temperature dielectric polymers, thus these nanocomposite polymers can be
easily scaled up by utilizing the existing manufacturing process and be readily developed
into capacitive devices.

134
Thermally processable polymer with high breakdown strength
Based on design of high dipole moment polyureas and polythioureas, a thermally
processable polyurea polymer, poly (ether methyl ether urea) (PEMEU), was designed by
introducing ether units in the structure to soften the rigid polymer. The polymer possesses
a dielectric constant of 4 and is thermally stable up to 150°C. The high dipole moment of
urea units and glass structure of the polymer leads to a low dielectric loss and low
conduction loss. As a result, PEMEU high quality thin films can be fabricated which
exhibit exceptionally high breakdown field of >1.5 GV/m, and a low conduction loss at
fields up to the breakdown. Consequently, the PEMEU films exhibit a high charge-
discharge efficiency of 90% and a high discharged energy density of 36 J/cm3. This is the
highest breakdown strength reported among class of polyureas and polythioureas
developed.
Nanocomposite approach for reducing conduction current
Apart from improving the energy density, it is also important to address the loss at
high fields and high temperature, known as the conduction loss. Normally, these losses
increase exponentially with the electric field, and cause heating of the capacitors. This
results in the need to have a cooling system to avoid overheating of the film capacitors. To
address this issue, a small fraction of alumina nanoparticles was added to a semi-crystalline
polymer, poly(tetrafluoroethylene-hexafluoropropylene-vinylidene fluoride) (THV)
terpolymer; resulting in the reduction of conduction loss by more than two orders of
magnitude at high temperatures (125°C), a desirable feature for practical applications. To

135
develop the theoretical understanding of the charge transport in these nanocomposite films,
we collaborated with Dr. Meng H. Lean, (CTO of QE Done LLC), who has developed
dynamic charge mapping models capable of simulating bipolar charge transport in both
layered and nanocomposite films. The combined theoretical and experimental study show
that the nanoparticles reduce the conduction losses in semi-crystalline polymers by
introducing deep traps in the polymer matrix, and thus trapping the charge carriers which
cause the conduction loss. The results further reveal that there might exists a threshold
nanofiller concentration (2 wt.%) beyond which the suppression of conduction current
becomes less effective.
6.2 Suggestions for future work
Utilization of Interfacial effect
The surface of nanofillers can be modified by chemical or physical means. There
has been a growing research interest in investigation of surface modification of the filler
on the dielectric properties. Zhou et al. [145] have shown that by modifying BaTiO3
(diameter=85-100 nm) nanoparticles with hydrogen peroxide (H2O2) improved the
morphology of PVDF-BaTiO3 nanocomposites due to hydrogen bonding between fluorine
and the hydroxyl group of PVDF and H2O2-modified BaTiO3. In addition, it made the
dielectric constant stable with frequency as well as temperature while reducing the
dielectric loss by restricting the movement of side groups and polymer chains near the
interface. Similarly, BaTiO3 has been modified using dopamine by Lin et al. [146],
resulting in increased dielectric constant by improved interface. On similar lines, there have
136
been many studies on surface modification of the fillers. [11], [67] However, all this work
has been on high volume content and mostly high dielectric constant fillers. There has been
hardly any work done on low volume content and low dielectric constant fillers. As it has
been presented in dissertation work that the low volume content nanocomposite films can
achieve high dielectric constant, it will be important to explore the interfacial phenomena
by surface modification of these nanofillers. There are few ideas along this line: chemical
synthesis of ceramic nanoparticles; i.e. utilizing the ability to choose ceramic particles
which can provide more interfacial area, thus providing more interfacial effect. Point
defects can also be introduced in these ceramic particles to introduce free volume. Another
nanoparticle system to look at would be conductive nanoparticles, which include metal
nanoparticles, e.g. bronze and copper nanoparticles; graphene nanoparticles. In addition,
effect on breakdown strength can be studied with surface modification of nanoparticles.
Thus, tailoring the nanoparticle surfaces as well as tuning the interfacial polymer shell
structures are recognized as crucial challenges along this direction of research.
Direct measurement of free volume
One of the ways to characterize free volume is by PALS (Positron Annihilation
Lifetime Spectroscopy). Till now, free volume measured in class of polyureas and
polythioureas has been using grazing incidence X-ray diffraction and simulation studies. It
is important to directly measure these sample using PALS. [66] Prof. David Gidley’s group
at University of Michigan studies nanoscale defects and open volumes in condensed matter
using positron annihilation spectroscopy. The initial PALS study of blends showed some
promising results of presence of large void sizes in blends compared to the individual

137
polymers. The blends of strongly dipolar polymers designed in future and surface modified
nanocomposite films can be studied using PALS technique.
Another method to probe changes in specific volume is by applying hydrostatic
pressures and measuring the dielectric properties. [147], [148] Changes in volume as a
function of pressure can give an insight into localized free volume effect.
Conduction mechanism of PEI nanocomposites
For charge transport study in Chapter 3, we collaborated with Dr. Meng H. Lean
(CTO of QE Done LLC), who has developed dynamic charge mapping models capable of
simulating bipolar charge transport in both layered and nanocomposite films. Till now, we
have studied THV, a semi-crystalline polymer, and seen reduction in charge conduction by
addition of nanocomposites. It is important to study an amorphous polymer as well,
preferably with high glass transition temperature like polyetherimide (PEI) or polyimide
(PI). [149] It’s a simpler system as it is a single polymer system, no copolymers plus they
are of commercial interest as well. The Figure 6-1 shows the conduction characteristics of
the neat PEI discussed in Chapter 4. The conduction is a function of both temperature and
field, and as seen in Figure 6-1 (b), the conduction increases by four orders of magnitude
when the neat polymer is heated from room temperature to 225°C. As demonstrated in
THV polymer system in Chapter 5, nanoparticles can be effective in reducing the
conduction current. Similar ideas can be applied to the PEI system as well. The
nanocomposites can be made by solution casting, so in that case it is easy to tune the size
of nanocomposites as well and study the size effect on charge conduction. Similarly, a non-
polar polymer like BOPP can also be studied. From the preliminary bipolar charge

138
transport simulations, it has been seen that the leakage current shows sensitivity to shape,
size and orientation of the nanoparticles. In addition, thermally stimulated discharging
current (TSDC) measurements can be conducted to study the trap levels, activation energy
and relaxation process of these nanocomposite films.
Figure 6-1 Current density as a (a) function of electric field over a range of temperatures,
(b) function of temperatures at 95.1 MV/m.
(a)
(b)

139
High Frequency Characterization
The high frequency characterization is important to understand the relaxation behavior of
these nanocomposite films. From initial discreet resonant experiments by Prof. Vid
Bobnar’s group at Jozef Stefan Institute in Slovenia, it is seen that these PEI nanocomposite
films start showing relaxation in GHz region as dielectric constant drops from 5 to 3.4. A
sweep of continuous high frequency scan in future will give more information on the
relaxation behavior but still discrete frequency results show signs of relaxation in these
nanocomposite films.
Figure 6-2 High frequency characterization of PEI-1wt.%Al2O3 nanocomposite films.

140
Appendix A
Chapter 4 Supporting Information
The following simulation work was performed by Tiannan Yang in Prof. Long-Qing
Chen’s group.
Based on Tanaka’s model presented in Chapter 4, a theoretical model is proposed
with a spatially varying local dielectric constant around the interfacial region within the
polymer matrix as:
2
interface 2 1 0,g
MK r K K g K e g r r
where r is the distance away from the surface of the nanofiller, KM is the dielectric
constant of the polymer matrix, K1 is the reduction of the dielectric constant in the inner
layer (r=0) compared to the polymer matrix, K2 determines the increase of the dielectric
constant in the outer layer, and r0 is a characteristic width of the interfacial region. Such
K(r) function features a quadratic growth in the inner layer (r/r0<<1), and an exponential
decay to KM far away from the interface (r/r0>>1). In calculating the polarization response
of the PEI/Al2O3 nanocomposites, the parameters are chosen as r0=50 nm, K1 = 0.7, and K2
= 8.5, as fitted from the experimentally measured effective dielectric constants of
PEI/Al2O3 nanocomposites with 20 nm filler size; KM = 3.2 is the dielectric constant of
PEI. See the distribution of dielectric constant in the interfacial region as a function of r in
Figure S1. These parameters are then fixed to reproduce the dielectric response of PEI
nanocomposites with different nanofiller sizes and volume contents.
The polarization response of the nanocomposite to an external field is simulated
through numerically solving the electrostatic equilibrium equation in a system with
periodically aligned 3-dimensional array of fillers in the polymer matrix described by the
phase-field method [150], [151], whereby the effective dielectric constant of the
nanocomposite can be calculated. Here, with the dielectric constant distributions around a
filler particle fitted to a well-established multilayer core model and a phase-field
description of a composite nanostructure, Yang et al. [96] successfully reproduced the
experimentally observed rapid increase in dielectric constant with filler volume fraction

141
and the appearance of a peak at very small volume fractions, as well as the shift of the peak
to higher volume fraction as the filler size increases. Figure S2 presents the spatial
distribution of the polarization in the PEI nanocomposites on applying an electric field of
1MV/m. As seen, at the dielectric peak of around 0.3 vol% nanofiller in PEI/Al2O3
nanocomposites with 20 nm filler size, a large region with greatly enhanced polarization
emerges in the middle of two nearest fillers on applying an electric field, due to its high
local dielectric constant resulting from an optimal distance to the surface of the fillers.
Changing the filler content to 0.1 vol% or 0.9 vol% leads to an increased or decreased
distance between nearest fillers, both of which will result in a reduced overall polarization
response. The dielectric peak shifts to a larger nanofiller volume content with an increased
filler size of 50 nm, due to a reduced surface-area-to-volume ratio. The distances between
adjacent nanofillers are listed in Table S1. As shown in Figure S3, with the parameters in
the multilayer core model fitted to specific filler materials, the computational results can
successfully reproduce the observed large increase of dielectric constants and the
appearance of a dielectric peak at low nanofiller volume content, as well as the shift of the
dielectric peak to higher nanofiller volume content with nanofiller size.
Figure S1. Distribution of the dielectric constant of polymer at the interfacial region as a
function of the distance r from the surface of nanofiller.

142
Figure S2. Polarization distribution in nanocomposites with (a) nanofillers of 20 nm at filler
content of 0.1 vol%, 0.3 vol%, and 0.9 vol%; and (b) nanofillers of 50 nm at filler content of 0.3
vol% and 0.9 vol%, on applying an electric field E3=1MV/m, within the cross section passing
through the centers of two nearest nanofillers.
Figure S3. Modeling results of the dielectric constant of PEI nanocomposites with 5 nm,
20 nm, and 50 nm nanofillers vs. the volume fraction of nanofillers.

143
Table S1. Effect of particle size and volume fraction on the distance between the
neighboring nanoparticles.
Particle diameter
(nm) Volume fraction (%)
Distance between neighboring
particles (nm)
20 0.1 141
20 0.3 92
20 0.9 57
50 0.3 230
50 0.9 144

144
Appendix B
Chapter 5 Supporting Information
The following simulation was performed by Dr. Meng H. Lean from QE Done LLC.
Figure S4. Comparison of leakage conductivity from simulation and measurement at
85C and 125C for: (a) THV+0.5 wt.%, and (b) THV+1.0 wt.%.
(a)
(b)

145
Bibliography
[1] M. Winter and R. J. Brodd, What are batteries, fuel cells, and supercapacitors? ACS
Publications, 2004.
[2] W. J. Sarjeant, J. Zirnheld, and F. W. MacDougall, “Capacitors,” Plasma Sci. IEEE Trans.
On, vol. 26, no. 5, pp. 1368–1392, 1998.
[3] S. Ducharme, “An inside-out approach to storing electrostatic energy,” ACS Nano, vol. 3, no.
9, pp. 2447–2450, 2009.
[4] H. Wisken and T. H. Weise, “Capacitive pulsed power supply systems for ETC guns,” IEEE
Trans. Magn., vol. 39, no. 1, pp. 501–504, 2003.
[5] H. Akiyama, T. Sakugawa, T. Namihira, K. Takaki, Y. Minamitani, and N. Shimomura,
“Industrial applications of pulsed power technology,” IEEE Trans. Dielectr. Electr. Insul.,
vol. 14, no. 5, 2007.
[6] F. MacDougall et al., “High energy density capacitors for pulsed power applications,” in
Pulsed Power Conference, 2009. PPC’09. IEEE, 2009, pp. 774–778.
[7] T. A. Burress et al., “Evaluation of the 2007 Toyota Camry hybrid synergy drive system,”
Oak Ridge National Laboratory (ORNL), Oak Ridge, TN, 2008.
[8] T. A. Burress et al., “Evaluation of the 2008 Lexus LS 600H hybrid synergy drive system,”
Oak Ridge National Laboratory (ORNL), Oak Ridge, TN, 2009.
[9] R. Deshpande, Capacitors: technology and trends. Tata McGraw-Hill Education, 2012.
[10] S. O. Kasap, Principles of electronic materials and devices. McGraw-Hill, 2006.
[11] V. K. Thakur and R. K. Gupta, “Recent progress on ferroelectric polymer-based
nanocomposites for high energy density capacitors: synthesis, dielectric properties, and
future aspects,” Chem. Rev., vol. 116, no. 7, pp. 4260–4317, 2016.
[12] K. C. Kao, Dielectric phenomena in solids. Academic press, 2004.
[13] I. Burn and D. Smyth, “Energy storage in ceramic dielectrics,” J. Mater. Sci., vol. 7, no. 3,
pp. 339–343, 1972.
[14] S. Wu, M. Lin, S. Lu, L. Zhu, and Q. Zhang, “Polar-fluoropolymer blends with tailored
nanostructures for high energy density low loss capacitor applications,” Appl. Phys. Lett.,
vol. 99, no. 13, p. 132901, 2011.
[15] H. S. Nalwa, Handbook of Low and High Dielectric Constant Materials and Their
Applications, Two-Volume Set. Academic Press, 1999.
[16] Q. Chen, Y. Shen, S. Zhang, and Q. Zhang, “Polymer-Based Dielectrics with High Energy
Storage Density,” Annu. Rev. Mater. Res., vol. 45, no. 1, 2015.
[17] B. Chu et al., “A dielectric polymer with high electric energy density and fast discharge
speed,” Science, vol. 313, no. 5785, pp. 334–336, 2006.
[18] V. Sharma et al., “Rational design of all organic polymer dielectrics,” Nat. Commun., vol. 5,
2014.
[19] Q. Li et al., “Flexible high-temperature dielectric materials from polymer nanocomposites,”
Nature, vol. 523, no. 7562, pp. 576–579, 2015.
[20] D. Tan, L. Zhang, Q. Chen, and P. Irwin, “High-Temperature Capacitor Polymer Films,” J.
Electron. Mater., vol. 43, no. 12, pp. 4569–4575, 2014.
[21] Y. Cao, P. C. Irwin, and K. Younsi, “The future of nanodielectrics in the electrical power
industry,” IEEE Trans. Dielectr. Electr. Insul., vol. 11, no. 5, pp. 797–807, 2004.
[22] M.-H. Yoon, H. Yan, A. Facchetti, and T. J. Marks, “Low-voltage organic field-effect
transistors and inverters enabled by ultrathin cross-linked polymers as gate dielectrics,” J.
Am. Chem. Soc., vol. 127, no. 29, pp. 10388–10395, 2005.
146
[23] S. Bertolazzi, J. Wünsche, F. Cicoira, and C. Santato, “Tetracene thin film transistors with
polymer gate dielectrics,” Appl. Phys. Lett., vol. 99, no. 1, p. 13301, 2011.
[24] M. E. Roberts, N. Queraltó, S. C. Mannsfeld, B. N. Reinecke, W. Knoll, and Z. Bao, “Cross-
linked polymer gate dielectric films for low-voltage organic transistors,” Chem. Mater., vol.
21, no. 11, pp. 2292–2299, 2009.
[25] A. Facchetti, “Π-conjugated polymers for organic electronics and photovoltaic cell
applications†,” Chem. Mater., vol. 23, no. 3, pp. 733–758, 2010.
[26] M. T. Dang, L. Hirsch, and G. Wantz, “P3HT: PCBM, best seller in polymer photovoltaic
research,” Adv. Mater., vol. 23, no. 31, pp. 3597–3602, 2011.
[27] L. Huo, S. Zhang, X. Guo, F. Xu, Y. Li, and J. Hou, “Replacing alkoxy groups with
alkylthienyl groups: a feasible approach to improve the properties of photovoltaic polymers,”
Angew. Chem., vol. 123, no. 41, pp. 9871–9876, 2011.
[28] T. L. Hanley, R. P. Burford, R. J. Fleming, and K. W. Barber, “A general review of
polymeric insulation for use in HVDC cables,” Electr. Insul. Mag. IEEE, vol. 19, no. 1, pp.
13–24, 2003.
[29] J. Ennis et al., “Recent advances in high voltage, high energy capacitor technology,” in
Pulsed Power Conference, 2007 16th IEEE International, 2007, vol. 1, pp. 282–285.
[30] H. Bluhm, “Power Systems,” 2006.
[31] T. Osaka and M. Datta, Energy storage systems in electronics. CRC Press, 2000.
[32] M. Rabuffi and G. Picci, “Status quo and future prospects for metallized polypropylene
energy storage capacitors,” Plasma Sci. IEEE Trans. On, vol. 30, no. 5, pp. 1939–1942,
2002.
[33] Q. Chen, Y. Wang, X. Zhou, Q. Zhang, and S. Zhang, “High field tunneling as a limiting
factor of maximum energy density in dielectric energy storage capacitors,” Appl. Phys. Lett.,
vol. 92, no. 14, p. 142909, 2008.
[34] C. Xu and S. Boggs, “Measurement of resistive and absorption currents in capacitor films up
to breakdown,” in Electrical Insulation, 2006. Conference Record of the 2006 IEEE
International Symposium on, 2006, pp. 249–252.
[35] J. Ho and R. Jow, “Characterization of high temperature polymer thin films for power
conditioning capacitors,” DTIC Document, 2009.
[36] L. Zhu and Q. Wang, “Novel ferroelectric polymers for high energy density and low loss
dielectrics,” Macromolecules, vol. 45, no. 7, pp. 2937–2954, 2012.
[37] X. Zhou et al., “Electrical breakdown and ultrahigh electrical energy density in poly
(vinylidene fluoride-hexafluoropropylene) copolymer,” Appl. Phys. Lett., vol. 94, no. 16, p.
162901, 2009.
[38] X. Zhou, B. Chu, B. Neese, M. Lin, and Q. Zhang, “Electrical energy density and discharge
characteristics of a poly (vinylidene fluoride-chlorotrifluoroethylene) copolymer,” Dielectr.
Electr. Insul. IEEE Trans. On, vol. 14, no. 5, pp. 1133–1138, 2007.
[39] Q. Zhang, V. Bharti, and X. Zhao, “Giant electrostriction and relaxor ferroelectric behavior
in electron-irradiated poly (vinylidene fluoride-trifluoroethylene) copolymer,” Science, vol.
280, no. 5372, pp. 2101–2104, 1998.
[40] N. J. Smith, B. Rangarajan, M. T. Lanagan, and C. G. Pantano, “Alkali-free glass as a high
energy density dielectric material,” Mater. Lett., vol. 63, no. 15, pp. 1245–1248, 2009.
[41] J. Ho and T. Jow, “Characterization of High Temperature Polymer Thin Films for Power
Conditioning Capacitors; Army Research Laboratory: Adelphi, MD, 2009,” There No
Corresp. Rec. This Ref.
[42] D. Tan, Y. Cao, E. Tuncer, and P. Irwin, “Nanofiller dispersion in polymer dielectrics,”
2013.

147
[43] Y. Wang, X. Zhou, M. Lin, and Q. Zhang, “High-energy density in aromatic polyurea thin
films,” Appl. Phys. Lett., vol. 94, no. 20, p. 202905, 2009.
[44] S. Wu et al., “Aromatic polythiourea dielectrics with ultrahigh breakdown field strength, low
dielectric loss, and high electric energy density,” Adv. Mater., vol. 25, no. 12, pp. 1734–1738,
2013.
[45] Y. Thakur et al., “Optimizing nanostructure to achieve high dielectric response with low loss
in strongly dipolar polymers,” Nano Energy, vol. 16, pp. 227–234, 2015.
[46] Z. Cheng et al., “Aromatic poly (arylene ether urea) with high dipole moment for high
thermal stability and high energy density capacitors,” Appl. Phys. Lett., vol. 106, no. 20, p.
202902, 2015.
[47] W. Kumler and G. M. Fohlen, “The Dipole Moment and Structure of Urea and Thiourea1,” J.
Am. Chem. Soc., vol. 64, no. 8, pp. 1944–1948, 1942.
[48] H. FROHLICH, Theory of Dielectrics: Dielectric Constant and Dielectric Loss. Oxford
University Press, 1987.
[49] S. Wu, M. Lin, Q. Burlingame, and Q. Zhang, “Meta-aromatic polyurea with high dipole
moment and dipole density for energy storage capacitors,” Appl. Phys. Lett., vol. 104, no. 7,
p. 72903, 2014.
[50] Y. Thakur, M. Lin, S. Wu, Z. Cheng, D.-Y. Jeong, and Q. Zhang, “Tailoring the dipole
properties in dielectric polymers to realize high energy density with high breakdown strength
and low dielectric loss,” J. Appl. Phys., vol. 117, no. 11, p. 114104, 2015.
[51] J. Lennard-Jones and A. Devonshire, “Critical and co-operative phenomena. III. A theory of
melting and the structure of liquids,” Proc. R. Soc. Lond. Ser. Math. Phys. Sci., pp. 317–338,
1939.
[52] J. Lennard-Jones and A. Devonshire, “Critical and co-operative phenomena. IV. A theory of
disorder in solids and liquids and the process of melting,” Proc. R. Soc. Lond. Ser. Math.
Phys. Sci., pp. 464–484, 1939.
[53] S. Glasstone, H. Eyring, and K. J. Laidler, The theory of rate processes. McGraw-Hill, 1941.
[54] J. Frenkel, “Viscous flow of crystalline bodies,” Zhurnal Eksp. Teor. Fiz., vol. 16, no. 1, pp.
29–38, 1946.
[55] N. G. McCrum, B. E. Read, and G. Williams, “Anelastic and dielectric effects in polymeric
solids,” 1967.
[56] L. H. Sperling, Introduction to physical polymer science. John Wiley & Sons, 2005.
[57] A. K. Doolittle, “Studies in Newtonian flow. I. The dependence of the viscosity of liquids on
temperature,” J. Appl. Phys., vol. 22, no. 8, pp. 1031–1035, 1951.
[58] A. K. Doolittle, “Studies in Newtonian flow. II. The dependence of the viscosity of liquids on
free-space,” J. Appl. Phys., vol. 22, no. 12, pp. 1471–1475, 1951.
[59] A. K. Doolittle, “Studies in Newtonian flow. III. The dependence of the viscosity of liquids
on molecular weight and free space (in homologous series),” J. Appl. Phys., vol. 23, no. 2,
pp. 236–239, 1952.
[60] H. Djidjelli, M. Kaci, T. Sadoun, D. Benachour, J. Farenc, and J.-J. Martinez-Vega, “Effect
of hydrothermic ageing on dielectric and mechanical properties of rigid poly (vinyl
chloride),” Macromol. Mater. Eng., vol. 286, no. 7, pp. 407–411, 2001.
[61] D. J. Bergman, “The dielectric constant of a composite material—a problem in classical
physics,” Phys. Rep., vol. 43, no. 9, pp. 377–407, 1978.
[62] K. Tashiro, Ferroelectric Polymers, ed. HS Nalwa. Dekker, New York, 1995.
[63] R. Dong, V. Ranjan, M. B. Nardelli, and J. Bernholc, “Atomistic simulations of aromatic
polyurea and polyamide for capacitive energy storage,” Phys. Rev. B, vol. 92, no. 2, p. 24203,
2015.

148
[64] J. Wei et al., “Achieving High Dielectric Constant and Low Loss Property in a Dipolar Glass
Polymer Containing Strongly Dipolar and Small-Sized Sulfone Groups,” ACS Appl. Mater.
Interfaces, vol. 7, no. 9, pp. 5248–5257, 2015.
[65] Y. Thakur et al., “Generating High Dielectric Constant Blends from Lower Dielectric
Constant Dipolar Polymers using Nanostructure Engineering,” Nano Energy, 2016.
[66] H. Hristov, B. Bolan, A. Yee, L. Xie, and D. Gidley, “Measurement of hole volume in
amorphous polymers using positron spectroscopy,” Macromolecules, vol. 29, no. 26, pp.
8507–8516, 1996.
[67] Z.-M. Dang, J.-K. Yuan, S.-H. Yao, and R.-J. Liao, “Flexible nanodielectric materials with
high permittivity for power energy storage,” Adv. Mater., vol. 25, no. 44, pp. 6334–6365,
2013.
[68] T. Tanaka, G. Montanari, and R. Mulhaupt, “Polymer nanocomposites as dielectrics and
electrical insulation-perspectives for processing technologies, material characterization and
future applications,” IEEE Trans. Dielectr. Electr. Insul., vol. 11, no. 5, pp. 763–784, 2004.
[69] Q. Wang and L. Zhu, “Polymer nanocomposites for electrical energy storage,” J. Polym. Sci.
Part B Polym. Phys., vol. 49, no. 20, pp. 1421–1429, 2011.
[70] P. Kim et al., “High energy density nanocomposites based on surface-modified BaTiO3 and
a ferroelectric polymer,” ACS Nano, vol. 3, no. 9, pp. 2581–2592, 2009.
[71] T. Lewis, “Interfaces are the dominant feature of dielectrics at the nanometric level,” IEEE
Trans. Dielectr. Electr. Insul., vol. 11, no. 5, pp. 739–753, 2004.
[72] J. Li, S. I. Seok, B. Chu, F. Dogan, Q. Zhang, and Q. Wang, “Nanocomposites of
ferroelectric polymers with TiO2 nanoparticles exhibiting significantly enhanced electrical
energy density,” Adv. Mater., vol. 21, no. 2, pp. 217–221, 2009.
[73] B. Balasubramanian, K. L. Kraemer, N. A. Reding, R. Skomski, S. Ducharme, and D. J.
Sellmyer, “Synthesis of Monodisperse TiO2- Paraffin Core- Shell Nanoparticles for
Improved Dielectric Properties,” ACS Nano, vol. 4, no. 4, pp. 1893–1900, 2010.
[74] J. K. Nelson and J. C. Fothergill, “Internal charge behaviour of nanocomposites,”
Nanotechnology, vol. 15, no. 5, p. 586, 2004.
[75] J. K. Nelson and others, Dielectric polymer nanocomposites. Springer, 2010.
[76] J. Li, J. Claude, L. E. Norena-Franco, S. I. Seok, and Q. Wang, “Electrical energy storage in
ferroelectric polymer nanocomposites containing surface-functionalized BaTiO3
nanoparticles,” Chem. Mater., vol. 20, no. 20, pp. 6304–6306, 2008.
[77] Z. Li et al., “In situ catalytic encapsulation of core-shell nanoparticles having variable shell
thickness: dielectric and energy storage properties of high-permittivity metal oxide
nanocomposites,” Chem. Mater., vol. 22, no. 18, pp. 5154–5164, 2010.
[78] Q. Li et al., “Sandwich-structured polymer nanocomposites with high energy density and
great charge–discharge efficiency at elevated temperatures,” Proc. Natl. Acad. Sci., vol. 113,
no. 36, pp. 9995–10000, 2016.
[79] N. Guo, S. A. DiBenedetto, P. Tewari, M. T. Lanagan, M. A. Ratner, and T. J. Marks,
“Nanoparticle, size, shape, and interfacial effects on leakage current density, permittivity,
and breakdown strength of metal oxide- polyolefin nanocomposites: experiment and theory,”
Chem. Mater., vol. 22, no. 4, pp. 1567–1578, 2010.
[80] C. Zou, D. Kushner, and S. Zhang, “Wide temperature polyimide/ZrO 2 nanodielectric
capacitor film with excellent electrical performance,” Appl. Phys. Lett., vol. 98, no. 8, p.
82905, 2011.
[81] X. Huang and C. Zhi, Polymer Nanocomposites: Electrical and Thermal Properties.
Springer, 2016.
[82] Z.-M. Dang et al., “Advanced calcium copper titanate/polyimide functional hybrid films with
high dielectric permittivity,” Adv. Mater., vol. 21, no. 20, pp. 2077–2082, 2009.

149
[83] W. Yang, S. Yu, R. Sun, and R. Du, “Nano-and microsize effect of CCTO fillers on the
dielectric behavior of CCTO/PVDF composites,” Acta Mater., vol. 59, no. 14, pp. 5593–
5602, 2011.
[84] B. S. Prakash and K. Varma, “Dielectric behavior of CCTO/epoxy and Al-CCTO/epoxy
composites,” Compos. Sci. Technol., vol. 67, no. 11, pp. 2363–2368, 2007.
[85] F. Amaral, C. Rubinger, F. Henry, L. Costa, M. Valente, and A. Barros-Timmons, “Dielectric
properties of polystyrene–CCTO composite,” J. Non-Cryst. Solids, vol. 354, no. 47, pp.
5321–5322, 2008.
[86] H. Tang, Y. Lin, C. Andrews, and H. A. Sodano, “Nanocomposites with increased energy
density through high aspect ratio PZT nanowires,” Nanotechnology, vol. 22, no. 1, p. 15702,
2010.
[87] J. Yao et al., “Enhancement of dielectric constant and piezoelectric coefficient of ceramic–
polymer composites by interface chelation,” J. Mater. Chem., vol. 19, no. 18, pp. 2817–2821,
2009.
[88] S. Banerjee and K. Cook-Chennault, “Influence of Al particle size and lead zirconate titanate
(PZT) volume fraction on the dielectric properties of PZT-epoxy-aluminum composites,” J.
Eng. Mater. Technol., vol. 133, no. 4, p. 41016, 2011.
[89] H. Tang, Y. Lin, and H. A. Sodano, “Enhanced energy storage in nanocomposite capacitors
through aligned PZT nanowires by uniaxial strain assembly,” Adv. Energy Mater., vol. 2, no.
4, pp. 469–476, 2012.
[90] L. An, S. A. Boggs, and J. P. Calame, “Energy storage in polymer films with high dielectric
constant fillers [Feature Article],” IEEE Electr. Insul. Mag., vol. 24, no. 3, pp. 5–10, 2008.
[91] R. C. Buchanan, Ceramic materials for electronics, vol. 68. CRC press, 2004.
[92] D. Barrow, T. Petroff, R. Tandon, and M. Sayer, “Characterization of thick lead zirconate
titanate films fabricated using a new sol gel based process,” J. Appl. Phys., vol. 81, no. 2, pp.
876–881, 1997.
[93] K. Lichtenecker, “Dielectric constant of artificial and natural mixtures,” Phys Z, vol. 27, pp.
115–158, 1926.
[94] J. Bendler and T. Takekoshi, “Molecular modeling of polymers for high energy storage
capacitor applications,” in Power Sources Symposium, 1992., IEEE 35th International, 1992,
pp. 373–376.
[95] J. Lomax et al., “Electrical properties of BaTiO3 nanoparticles in poly (ether imide),” Smart
Mater. Struct., vol. 21, no. 8, p. 85017, 2012.
[96] Y. Thakur et al., “Enhancement of the Dielectric Response in Polymer Nanocomposites with
Low dielectric Constant Fillers,” Nanoscale.
[97] T. Tanaka, M. Kozako, N. Fuse, and Y. Ohki, “Proposal of a multi-core model for polymer
nanocomposite dielectrics,” Dielectr. Electr. Insul. IEEE Trans. On, vol. 12, no. 4, pp. 669–
681, 2005.
[98] S. Zhang et al., “Semicrystalline polymers with high dielectric constant, melting temperature,
and charge-discharge efficiency,” Dielectr. Electr. Insul. IEEE Trans. On, vol. 19, no. 4, pp.
1158–1166, 2012.
[99] L. A. Dissado and J. C. Fothergill, Electrical degradation and breakdown in polymers. IET,
1992.
[100] J. J. O’Dwyer, The theory of dielectric breakdown of solids. Clarendon Press, 1964.
[101] A. Von Hippel and G. Lee, “Scattering, trapping, and release of electrons in NaCl and in
mixed crystals of NaCl and AgCl,” Phys. Rev., vol. 59, no. 10, p. 824, 1941.
[102] H. Fröhlich, “Electric breakdown of ionic crystals,” Phys. Rev., vol. 61, no. 3–4, p. 200,
1942.

150
[103] F. Seitz, “On the theory of electron multiplication in crystals,” Phys. Rev., vol. 76, no. 9, p.
1376, 1949.
[104] K. W. Wagner, “The physical nature of the electrical breakdown of solid dielectrics,” J.
Am. Inst. Electr. Eng., vol. 41, no. 12, pp. 1034–1044, 1922.
[105] K. Stark and C. Garton, “Electric strength of irradiated polythene,” Nature, vol. 176, no.
4495, pp. 1225–1226, 1955.
[106] M. Ieda, “Dielectric breakdown process of polymers,” IEEE Trans. Electr. Insul., no. 3, pp.
206–224, 1980.
[107] H. Frohlich, “On the theory of dielectric breakdown in solids,” in Proceedings of the Royal
Society of London A: Mathematical, Physical and Engineering Sciences, 1947, vol. 188, pp.
521–532.
[108] Q. Burlingame, S. Wu, M. Lin, and Q. Zhang, “Conduction Mechanisms and Structure–
Property Relationships in High Energy Density Aromatic Polythiourea Dielectric Films,”
Adv. Energy Mater., vol. 3, no. 8, pp. 1051–1055, 2013.
[109] V. Agarwal and V. Srivastava, “Thickness dependence of breakdown field in thin films,”
Thin Solid Films, vol. 8, no. 5, pp. 377–381, 1971.
[110] C. Lhymn, P. Kosel, and R. Vaughan, “Thickness dependence of dielectric breakdown
voltage,” Thin Solid Films, vol. 145, no. 1, pp. 69–74, 1986.
[111] S. Cygan and J. Laghari, “Dependence of the electric strength on thickness area and volume
of polypropylene,” IEEE Trans. Electr. Insul., no. 6, pp. 835–837, 1987.
[112] G. A. Schneider, “A Griffith type energy release rate model for dielectric breakdown under
space charge limited conductivity,” J. Mech. Phys. Solids, vol. 61, no. 1, pp. 78–90, 2013.
[113] B. Helgee and P. Bjellheim, “Electric breakdown strength of aromatic polymers:
dependence on film thickness and chemical structure,” Electr. Insul. IEEE Trans. On, vol.
26, no. 6, pp. 1147–1152, 1991.
[114] F. Forlani and N. Minnaja, “Electrical breakdown in thin dielectric films,” J. Vac. Sci.
Technol., vol. 6, no. 4, pp. 518–526, 1969.
[115] R. Gerson and T. C. Marshall, “Dielectric breakdown of porous ceramics,” J. Appl. Phys.,
vol. 30, no. 11, pp. 1650–1653, 1959.
[116] M. Mittleman and R. Von Holdt, “Theory of low-energy-electron scattering by polar
molecules,” Phys. Rev., vol. 140, no. 3A, p. A726, 1965.
[117] J.-M. Lévy-Leblond, “Electron capture by polar molecules,” Phys. Rev., vol. 153, no. 1, p.
1, 1967.
[118] J. Ugalde and C. Sarasola, “Bound electronic states in a statically screened electric-dipole
potential,” Phys. Rev. A, vol. 54, no. 4, p. 2868, 1996.
[119] C. Lü, Z. Cui, C. Guan, J. Guan, B. Yang, and J. Shen, “Research on preparation, structure
and properties of TiO2/polythiourethane hybrid optical films with high refractive index,”
Macromol. Mater. Eng., vol. 288, no. 9, pp. 717–723, 2003.
[120] Q. Zhang, V. Bharti, and G. Kavarnos, “Poly (vinylidene fluoride)(PVDF) and its
copolymers,” Encycl. Smart Mater., 2002.
[121] J. K. Nelson and others, Dielectric polymer nanocomposites. Springer, 2010.
[122] F. Tian, Q. Lei, X. Wang, and Y. Wang, “Investigation of electrical properties of
LDPE/ZnO nanocomposite dielectrics,” Dielectr. Electr. Insul. IEEE Trans. On, vol. 19, no.
3, pp. 763–769, 2012.
[123] A. T. Hoang, L. Pallon, D. Liu, Y. V. Serdyuk, S. M. Gubanski, and U. W. Gedde, “Charge
transport in LDPE nanocomposites Part I—Experimental approach,” Polymers, vol. 8, no. 3,
p. 87, 2016.
[124] E. H. Rhoderick and R. Williams, Metal-semiconductor contacts. Clarendon Press Oxford,
1978.

151
[125] P. Emtage and W. Tantraporn, “Schottky emission through thin insulating films,” Phys.
Rev. Lett., vol. 8, no. 7, p. 267, 1962.
[126] S. M. Sze and K. K. Ng, Physics of semiconductor devices. John wiley & sons, 2006.
[127] Y. Wang, “The application and characterization of dielectric and piezoelectric polymer
devices,” The Pennsylvania State University, 2009.
[128] M. Lenzlinger and E. Snow, “Fowler-Nordheim tunneling into thermally grown SiO2,” J.
Appl. Phys., vol. 40, no. 1, pp. 278–283, 1969.
[129] M. A. Lampert, “Simplified theory of space-charge-limited currents in an insulator with
traps,” Phys. Rev., vol. 103, no. 6, p. 1648, 1956.
[130] M. A. Lampert and P. Mark, “Current injection in solids,” 1970.
[131] R. Zallen, The physics of amorphous solids. John Wiley & Sons, 2008.
[132] J. Brunson, “Hopping conductivity and charge transport in low density polyethylene,”
2010.
[133] G. Deutscher, R. Zallen, and J. Adler, “Percolation structures and processes,” Princet. Ser.
Phys., 1983.
[134] D. Das-Gupta, “Conduction mechanisms and high-field effects in synthetic insulating
polymers,” IEEE Trans. Dielectr. Electr. Insul., vol. 4, no. 2, pp. 149–156, 1997.
[135] A. Hunt, “New developments in the theory of the hopping conductivity of spatially random
systems,” J. Phys. Condens. Matter, vol. 6, no. 6, p. 1239, 1994.
[136] M. H. Lean and W.-P. L. Chu, “Dynamic charge mapping in layered polymer films,”
Dielectr. Electr. Insul. IEEE Trans. On, vol. 21, no. 3, pp. 1319–1329, 2014.
[137] M. H. Lean and W.-P. L. Chu, “Simulation of charge packet formation in layered polymer
film,” COMPEL Int. J. Comput. Math. Electr. Electron. Eng., vol. 33, no. 4, pp. 1396–1415,
2014.
[138] M. H. Lean and W.-P. L. Chu, “Effect of gaseous void on bipolar charge transport in
layered polymer film,” J. Phys. Appl. Phys., vol. 47, no. 7, p. 75303, 2014.
[139] M. H. Lean and W.-P. L. Chu, “Effective permittivity of nanocomposites from 3D charge
transport simulations,” J. Appl. Polym. Sci., vol. 133, no. 15, 2016.
[140] M. H. Lean and W.-P. L. Chu, “Modeling effect of ferroelectric nanofiller size on bipolar
charge transport in nanocomposite film,” J. Polym. Sci. Part B Polym. Phys., vol. 53, no. 19,
pp. 1380–1390, 2015.
[141] M. H. Lean and W.-P. L. Chu, “Effect of degree of crystallinity on charge transport in
ferroelectric semicrystalline polymer film,” IEEE Trans. Dielectr. Electr. Insul., vol. 22, no.
3, pp. 1444–1454, 2015.
[142] Y. Thakur, M. H. Lean, and Q. Zhang, “Reducing conduction losses in high energy density
polymer using nanocomposites,” Appl. Phys. Lett., vol. 110, no. 12, p. 122905, 2017.
[143] T. Tanaka, “Dielectric nanocomposites with insulating properties,” Dielectr. Electr. Insul.
IEEE Trans. On, vol. 12, no. 5, pp. 914–928, 2005.
[144] Y. Thakur, T. Zhang, M. Lin, Q. Zhang, and M. H. Lean, “Mitigation of conduction loss in
a semi-crystalline polymer with high dielectric constant and high charge-discharge
efficiency,” in Dielectrics (ICD), 2016 IEEE International Conference on, 2016, vol. 1, pp.
59–63.
[145] T. Zhou, J.-W. Zha, R.-Y. Cui, B.-H. Fan, J.-K. Yuan, and Z.-M. Dang, “Improving
dielectric properties of BaTiO3/ferroelectric polymer composites by employing surface
hydroxylated BaTiO3 nanoparticles,” ACS Appl. Mater. Interfaces, vol. 3, no. 7, pp. 2184–
2188, 2011.
[146] V. KumaráThakur, E. JináTan, P. SeeáLee, and others, “Surface functionalization of BaTiO
3 nanoparticles and improved electrical properties of BaTiO 3/polyvinylidene fluoride
composite,” RSC Adv., vol. 1, no. 4, pp. 576–578, 2011.

152
[147] C. Roland and R. Casalini, “Effect of hydrostatic pressure on the viscoelastic response of
polyurea,” Polymer, vol. 48, no. 19, pp. 5747–5752, 2007.
[148] G. Williams, “Effect of pressure on the dielectric β-relaxation in polyethylene
terephthalate,” Trans. Faraday Soc., vol. 62, pp. 1321–1328, 1966.
[149] S. Diaham, F. Saysouk, M. Locatelli, and T. Lebey, “Huge nanodielectric effects in
polyimide/boron nitride nanocomposites revealed by the nanofiller size,” J. Phys. Appl.
Phys., vol. 48, no. 38, p. 385301, 2015.
[150] L.-Q. Chen, “Phase-field models for microstructure evolution,” Annu. Rev. Mater. Res., vol.
32, no. 1, pp. 113–140, 2002.
[151] T. Yang, J.-M. Hu, C. Nan, and L. Chen, “Predicting effective magnetoelectric response in
magnetic-ferroelectric composites via phase-field modeling,” Appl. Phys. Lett., vol. 104, no.
5, p. 52904, 2014.

153
VITA
YASH THAKUR
Yash Thakur was born in Lucknow on January 1991 and was raised in Slapper,
Himachal Pradesh, India. In 2012, he received his bachelor of engineering degree from
University Institute of Engineering and Technology – Panjab University, Chandigarh,
India. He joined the Electrical Engineering at The Pennsylvania State University for his
graduate studies in Fall 2012, and worked on nanocrystalline quantum dots for photovoltaic
applications in Prof. Jerzy Ruzyllo’s group for his master’s research. He joined Prof.
Qiming Zhang’s group in Summer 2014 with research focus on dielectric polymers for
high energy density capacitors. He has won IEEE DEIS Fellowship in the academic year
2015-16, a prestigious award given annually to three students in the world in the area of
dielectrics and electrical insulation. He has also been awarded the Melvin P. Bloom
memorial outstanding doctoral research award in Electrical Engineering department at
Penn State. He has authored 12 journal papers and has a provisional US patent. He is an
active member of IEEE, DEIS and MRS.