Embed Size (px)
Citation preview

c e p a l r e v i e w 1 1 0 • a u g u s t 2 0 1 3 83
nafta’s uninvited guest: China and the disintegration of North American trade
Enrique Dussel Peters and Kevin P. Gallagher
ABSTRACT This paper examines the extent to which China’s entry into the World Trade
Organization (wto) in 2001 and subsequent surge in global exports affected the
composition of trade between the United States and Mexico through 2009. The
authors found that China’s entry had a significant impact on the trade relations
between these two North American countries, replacing and displacing many of the
export strongholds in place before China joined the wto and after the first stage
of the North American Free Trade Agreement (nafta) (1994-2000). Based on this
research, the authors offer a variety of policy options for reinvigorating United States-
Mexico trade and cooperating with China in the global economy.
KEYWORDS International trade, China, international economic relations, free trade, Mexico, United States, nafta, trade policy, case studies, textile industry, automobile industry
JEL CLASSIFICATION O11, O24, O53, O54
AUTHORS Enrique Dussel Peters, Professor at the Graduate School of Economics at the National Autonomous University of Mexico (unam) and Director of the Center for Chinese-Mexican Studies. [email protected]
Kevin P. Gallagher, Associate Professor of International Relations at Boston University and Co-Director of the Global Economic Governance Initiative. [email protected]

c e p a l r e v i e w 1 1 0 • a u g u s t 2 0 1 384
nafta’s uninvited guest: China and the disintegration of north ameriCan trade • EnriquE DussEl PEtErs anD KEvin P. GallaGhEr
Many promises were attached to the North American Free Trade Agreement (nafta) between Mexico, the United States and Canada. In Mexico and the United States (the two nafta countries focused on in this paper), there was no lack of rosy predictions of export, employment and gross domestic product (gdp) growth for each country. Indeed, traditional theory predicted such an outcome, with the agreement allowing each nation to specialize in those sectors where each had a comparative advantage. Such an arrangement would create new winners and losers, but most predictions had the winners winning more than the losers would lose, thus holding out the possibility of the winners compensating the losers and all members being better off. However, the models assumed, among other things, that trade arrangements outside of nafta would remain constant. In 1994, none of the analyses or models reflected concern that China
might enter the World Trade Organization (wto) in 2001 with comparative advantages in a handful of sectors that were dear to both the United States and Mexico.
This paper analyses the extent to which China’s rise has posed a competitive threat to United States-Mexico trade and nafta as a trade bloc. The paper is divided into five sections, including this brief introduction. Section II reviews the literature on nafta and its expected effects on the region’s economy. Section III presents a quantitative analysis of the extent to which China has penetrated nafta members’ import markets in Mexico and the United States. Section IV presents the results from two case studies, one in the yarn, textiles and garments commodity chain and the other in the autoparts and automobile chain. The final section summarizes our main findings and makes suggestions for further research and policy efforts.
IIntroduction
IIReview of the literature
nafta has been a source of controversy for over 20 years. In general, it was predicted that the agreement would bring economic gains to all parties, with relatively larger benefits for Mexico (usitc, 1992). For the United States, Mexico’s geographical proximity and existing level of integration made an agreement very attractive (Erzan and Yeats, 1992). Whereas the United States Congressional Budget Office (cbo) predicted that Mexico could grow between 6% and 12% thanks to nafta, predictions for the United States economy were around 0.25% (cbo, 1993; Kehoe, 1994). The agreement was not expected to lead to significant job losses in the United States: perhaps half a million jobs over more than a decade (cbo, 1993). Moreover, although it would lead to a rise in average wages in the United States, it would have little or no effect on low-wage workers there (Burfisher, Robinson and Thierfelder, 2001). Indeed, several models predicted a growing trade surplus for the United States with Mexico. According
to the boldest predictions, “with nafta, U.S. exports to Mexico will continue to outstrip Mexican exports to the United States, leading to a U.S. trade surplus with Mexico of about $ 7 billion to $ 9 billion annually by 1995, rising to $ 9 billion to $ 12 billion between the years 2000 and 2010” (Hufbauer and Schott, 1993, p. 14).
At the time it was signed, nafta was expected to impact both Mexico and the United States in a number of other ways. First, most analyses assumed that nafta would have general positive effects on Mexico’s exports in the long run, specifically those to the United States, based largely on the argument that free trade has positive and automatic effects on growth.
Second, some authors stressed that Mexico would require a number of general and sectoral adjustments in the short and medium run and that there could be negative effects for Mexico in specific sectors. The authorities of some nations outside nafta also expressed concern that

c e p a l r e v i e w 1 1 0 • a u g u s t 2 0 1 3
nafta’s uninvited guest: china and the disintegration of north american trade • enrique dussel peters and Kevin p. gallagher
85
the agreement’s rules of origin would take comparative advantages away from non-nafta trading partners and create trade diversion. From this perspective, the three nafta members could potentially incur welfare losses due to increased prices related to rules of origin. The potential inclusion of other countries was discussed only in the 1990s for the case of Chile and has not been addressed again since. The potential impact of the trade activities of other nations —such as those in Asia, and China in particular— was not seriously considered during the nafta negotiations (Dussel Peters, 2000). For the “founders” of the agreement, nafta would be an active and offensive strategy vis-à-vis the world market rather than representing a “fortress” or defence against third countries —a view that coincided with expectations in the first stage of nafta.
Third, a number of authors saw nafta as guaranteeing Mexican exports to the United States over the long run. Some (Hufbauer and Schott, 1993; Weintraub, 1991) emphasized that Mexico’s efficiency would improve because nafta included regimes such as intellectual property rights, eliminated national value added requirements and explicitly included the services and transport sectors. The substitution of quotas with tariffs in specific sectors, the elimination of tariffs in the long run, national treatment for regional firms and investments, the inclusion of labour and environmental standards as side agreements and a general notion of complementarity between Mexico and the United States fed expectations of positive results for Mexico in general, and for manufacturing and services in particular. Nevertheless, results in the agricultural sector were expected to be mixed and negative for Mexico. nafta integration and free trade, from a theoretical perspective, would thus have positive effects on Mexico’s exports, foreign direct investment (fdi) flows, employment and wages (Hufbauer and Schott, 1993) and, therefore, political expectations were extremely high.1
Fourth, regarding the sectoral effects on Mexico’s economy, it is important to differentiate between the short- and long-term impacts. While practically all the analyses stressed that Mexico’s economy would require deep adjustments in all sectors —also as a result of
1 According to then President Salinas de Gortari of Mexico, “The Treaty will mean more jobs and better pay for Mexicans. This is fundamental as it will lead to more capital, more investment, which will mean more employment opportunities here, in our country, for our countrymen. Put simply, we will be able to grow more quickly and thus better focus our attention to benefit those that have the least” (quoted in secofi, 1992, p. 1).
liberalization of imports and capital flows— there was a widespread consensus that Mexico’s manufacturing sector would benefit from nafta in terms of exports, employment, wages and productivity growth.2 Other authors highlighted that Mexico’s socioeconomy would shift even more towards maquiladora processes (Kopinak, 1993), to the detriment of employment quality and the environment.3 However, there was a consensus that particularly the agricultural sector and services, such as the banking sector, were the sectors in Mexico that would suffer most under nafta (Arroyo Picard and others, 1993; Grinspun and Cameron, 1993; VanGrasstek and Vega, 1992).
Only a few authors suggested that both countries could see a negative general impact on employment, business creation and competitiveness as a result of nafta (Donahue, 1991). Issues such as weak regional institutions were explicitly raised, for example, in comparison with the integration process in the European Union (Baer, 1991; Donahue, 1991; Piore, 1991; Shelburne, 1991).4 According to estimates for the manufacturing sectors in general, intra-industry trade within the region would increase substantially. The Congressional Budget Office (cbo) predicted that nafta would boost exports of motor vehicles and autoparts to Mexico and increase imports at
2 inforum (1991, VII-A-1) was one of the few models that attempted to make estimates at the regional and sectoral level in Mexico. On the basis of tariff removal (scenario 1) and removal of tariffs and non-tariff barriers (scenario 2), it was calculated that in 1989 United States exports to Mexico would increase most in agriculture, computers and motor vehicles, and to a lesser extent in apparel and television sets. From this perspective, under scenario 2, United States exports to Mexico would increase by 27% and imports from Mexico by 7% during the period 1989-2000. The same model assumed negative impacts in the agricultural sector for 1989-2000, while manufacturing sectors would mainly benefit during the period.3 “American jobs have moved across the border to pay predominantly young women far less than one dollar per hour … The maquiladoras constitute a model of economic development tied to having the lowest wages in the world to attract multinational corporate investment that produces for foreign, not domestic, markets. Poorly paid workers can’t afford to buy “internationally competitive” products. We have not seen Mexican workers’ living standards raised by this economic development strategy” (Steve Beckman, United Auto Workers Association, quoted in United States International Trade Commission, 1990, pp. 1-23). 4 Several chambers of industry, such as the National Chamber of Manufacturing Industries (canacintra), were skeptical in 1994 regarding the potential for macroeconomic change and nafta: “We believe it is not sufficient to stabilize the vital signs of the economy. It is also not sufficient to modify the bases for the national development, nor to reconsider our insertion in the international flows of goods and capital, or to redefine the regulatory framework, if all of this is not complemented with a profound and intense restructuring of the activities and firms that integrate the economic network of the country” (canacintra, 1994, p. 16; see also Caballero Urdiales, 1991, p. 65 et seq.).

c e p a l r e v i e w 1 1 0 • a u g u s t 2 0 1 386
nafta’s uninvited guest: China and the disintegration of north ameriCan trade • EnriquE DussEl PEtErs anD KEvin P. GallaGhEr
a slower rate, therefore leading to a surplus or a narrower deficit. The cbo also foresaw increases in textile and garment trade between the United States and Mexico in both directions (cbo, 1993). However, some industry analysts expressed concern over China at an early stage in the discussions on the impact of nafta on the yarn-textile-garment value added chain. Although Chinese (and other Asian) exports were more competitive than Mexico’s in terms of the United States import market, it was hoped that the agreement might boost Mexico’s share so that the United States and Mexico might be able to join forces to meet challenges from abroad.
Lande (1991, p. 244) wrote “exchange-rate relationships will continue to favor labor-intensive
operations in Mexico and the Caribbean over traditional Far Eastern sources”. That same analyst stated that nafta would be most welcome in the United States: if Mexico’s access is increased as Far Eastern exports are reduced, there is a greater chance for success. Imports from Mexican industries are seen as less threatening to United States producers than those from the Far East or from Far Eastern controlled facilities in third countries. Far Eastern producers do not market through United States apparel companies, but often sell directly to retailers or to contractors in the United States. In contrast, Mexican producers are more likely to use normal United States distribution channels, including United States apparel companies (Lande, 1991, p. 243).
IIIAnalysis: China crashes the nafta party
In this section we examine the extent to which China is penetrating markets in the United States and Mexico, with a particular focus on Mexico. From the moment in which China joined the wto in 2001 and up to 2009, we find that China outcompeted Mexico in the United States market and began to compete with the United States in the Mexican market. Interestingly, we find 53 sectors in Mexico where the United States is losing market share and China is gaining, thus appearing to allow Mexico to make efficiency gains and become more competitive in United States markets. However, in those 53 sectors —which represent 49% of all Mexico’s exports to the United States— Mexico is losing market share in the United States. The case studies that follow will more closely examine these trends for the Mexican economy.
This section is divided into four parts. First, we outline trends in trade between the United States, Mexico and China from a historical perspective. Second, we examine the extent to which Mexico is competing with China in United States import markets. Third, we look at the extent to which the United States is competing with China in Mexican markets. Finally we examine a subset of 53 sectors in which the United States is losing market share to China in the Mexican market and in which Mexico is losing market share in the United States.
1. nafta: conditions and trends
China is becoming an important trading partner for both Mexico and the United States. By 2009 China had become the second largest trading partner for both countries, whereas in 1995 China had not been among the top five trading partners for either one. Table 1 shows how China has gained significant ground in both the United States and the Mexican import markets since it joined the wto in 2001.
As shown in table 1, in 2005 China leapfrogged over Mexico to become the second largest trading partner of the United States; it has remained in that position ever since.
As the United States market has become more open, both Mexico and China have gained ground. Mexico and China have very similar export profiles (Blázquez-Lidoy, Rodríguez and Santiso, 2006; Feenstra, 2007) and have been competing for United States market share in low-skilled manufactures for some time. Figure 1 shows that the market share of Mexican products in the United States was on the rise until it reached 11.6% in 2002 (just one year after China entered the wto). In 2003, China’s share leaped to 12.1% and has continued to gain ground ever since. In 2010, China accounted for 19.1% of all United States imports, and Mexico’s share was 12.1%.

c e p a l r e v i e w 1 1 0 • a u g u s t 2 0 1 3
nafta’s uninvited guest: china and the disintegration of north american trade • enrique dussel peters and Kevin p. gallagher
87
TABLE 1
top trading partners of Mexico and the united states, 1993-2009 (Share of total trade)
Mexico
1 2 3 4 5
1994 United States Japan Germany Canada Spain
2000 United States Canada Japan Germany Republic of Korea
2003 United States China Japan Germany Canada
2009 United States China Canada Japan Germany
United States
1 2 3 4 5
1993 Canada Japan Mexico United Kingdom Germany
1999 Canada Mexico Japan China Germany
2003 Canada Mexico China Japan Germany
2005 Canada China Mexico Japan Germany
2009 Canada China Mexico Japan Germany
Source: prepared by the authors, on the basis of United Nations Commodity Trade Statistics Database (comtrade).
FIGURE 1
united states: share of total imports, 1991-2011(Percentages)
0
5
10
15
20
25
1990 1991 19921993 1994 1995 1996 19971998 19992000 20012002 2003 20042005 2006 2007 2008 2009 2010 2011
China Canada Mexico Japan
Source: prepared by the authors, on the basis of United States International Trade Commission, 2011.

c e p a l r e v i e w 1 1 0 • a u g u s t 2 0 1 388
nafta’s uninvited guest: China and the disintegration of north ameriCan trade • EnriquE DussEl PEtErs anD KEvin P. GallaGhEr
FIGURE 2
Mexico: imports from china and the united states, 1995-2010(Percentage share of total)
0
10
20
30
40
50
60
70
80
1995 1996 1997 1998 1999 2000 2001 2002 2003 2004 2005 2006 2007 2008 2009 2010
United States China
Source: prepared by the authors, on the basis of World Trade Atlas, 2011.
Albeit in a less dramatic manner, the United States is losing ground in Mexican markets and China is gaining. In the first five years after nafta was signed, the United States had close to 75% of Mexican import markets, but that share shrank to 48% in 2009. China has gained market share, but it still accounts for a relatively small part of Mexican imports. As shown in figure 2, China held less than 0.75% of the Mexican market in 2000, but had captured 15.13% of that market by 2010. As the analysis will later show, in some sectors the trend is even more dramatic.
Table 2 shows the top 20 Mexican exports to the United States and the top 20 United States exports to Mexico in 2000. This year was chosen because it provides a benchmark before China entered the wto and because 2000 was a high point for United States-Mexico trade. While China’s share in the top 20 exports to the United States jumped from 6.22% in 2000 to 19.42% in 2009, Mexico’s share faltered from 16.61% to 16.06% in the same period. Meanwhile, the United States’ share in its top 20 exports to Mexico plummeted from 72% in 2000 to 41.54% in 2009, and China’s share shot up from 1.09% in 2000 to 17.83% in 2009.
TABLE 2
Mexico and the united states: main exports, 2000
Top 20 United States exports to Mexico Top 20 Mexican exports to the United States
1 S2-776 Thermionic, microcircuits, transistors, valves, etc. S2-781 Passenger motor vehicles (excluding buses)2 S2-784 Motor vehicle parts and accessories, nes S2-333 Crude petroleum and oils obtained from bituminous
minerals3 S2-772 Electrical apparatus for making and breaking
electrical circuitsS2-764 Telecommunication equipment, nes; parts and
accessories, nes4 S2-699 Manufactures of base metal, nes S2-752 Automatic data processing machines and units
thereof

c e p a l r e v i e w 1 1 0 • a u g u s t 2 0 1 3
nafta’s uninvited guest: china and the disintegration of north american trade • enrique dussel peters and Kevin p. gallagher
89
Top 20 United States exports to Mexico Top 20 Mexican exports to the United States
5 S2-893 Articles, nes of plastic materials S2-931 Special transactions, commodity not classified according to class
6 S2-778 Electrical machinery and apparatus, nes S2-773 Equipment for distribution of electricity7 S2-764 Telecommunication equipment, nes; parts and
accessories, nesS2-782 Lorries and special purposes motor vehicles
8 S2-773 Equipment for distribution of electricity S2-784 Motor vehicle parts and accessories, nes9 S2-583 Polymerization and copolymerization products S2-761 Television receivers10 S2-713 Internal combustion piston engines, and parts
thereof, nesS2-772 Electrical apparatus for making and breaking
electrical circuits11 S2-781 Passenger motor vehicles (excluding buses) S2-821 Furniture and parts thereof12 S2-334 Petroleum products, refined S2-778 Electrical machinery and apparatus, nes13 S2-749 Non-electric parts and accessories of machinery, nes S2-713 Internal combustion piston engines, and parts
thereof, nes14 S2-752 Automatic data processing machines and units
thereofS2-842 Men’s and boys’ outerwear, textile fabrics not knitted
or crocheted15 S2-874 Measuring, checking, analysis, controlling
instruments, nes, partsS2-759 Parts, nes of and accessories for machines of
headings 751 or 75216 S2-642 Paper and paperboard, precut, and articles of paper
or paperboardS2-843 Women’s, girls’, infants’ outerwear, textile, not
knitted or crocheted17 S2-771 Electric power machinery, and parts thereof, nes S2-771 Electric power machinery, and parts thereof, nes18 S2-759 Parts, nes of and accessories for machines of
headings 751 or 752S2-874 Measuring, checking, analysis, controlling
instruments, nes, parts19 S2-728 Other machinery, equipment, for specialized
industries; parts nesS2-716 Rotating electric plant and parts thereof, nes
20 S2-931 Special transactions, commodity not classified according to class
S2-762 Radio-broadcast receivers
Source: prepared by the authors, on the basis of United Nations Commodity Trade Statistics Database (comtrade).Abbreviation: nes, not elsewhere specified.
2. Does china constitute a “threat” to North american trade?
Can we pinpoint the extent to which Chinese firms are outcompeting their Mexican and United States counterparts at a more specific sectoral level? For this analysis we draw on an established methodology developed by Lall and Weiss (2005). These authors study the changes in China’s and Latin America and the Caribbean’s export shares in both the world and the United States markets and look for evidence of increased Chinese competition in sectors where the penetration of Chinese exports is rising as the penetration of exports from Latin America and the Caribbean falls.
As shown in table 3, Lall and Weiss (2005) define various categories of competitive interaction between China and other countries in export markets. When China’s market share in the United States market is rising and the share of Latin America and the Caribbean is falling, the authors classify the region as experiencing a “direct
Table 2 (concluded)
threat” from China. Similarly, when the shares of both China and Latin America and the Caribbean are increasing, but China’s share is growing faster, it would be a case of the region experiencing a “partial threat” from China.
Table 4 presents the results computed using the Lall and Weiss 2005 methodology. For these calculations we look at trade between 2000 (the year before China entered the wto) and 2009. We conduct this analysis for 118 sectors covering all trade, disaggregated at the three-digit level using the United Nations Commodity Trade Database (comtrade) classification system, for the economies of the United States and Mexico. For each sector we calculate the market share in 2000 and in 2009, and the percentage-point change in market share during the period under consideration. Again, when market share for the United States or Mexico shrinks in a sector where China gains, that is called a “direct threat”. When the United States or Mexico increases its market share, but at a slower rate than China, it is termed a “partial threat”.

c e p a l r e v i e w 1 1 0 • a u g u s t 2 0 1 390
nafta’s uninvited guest: China and the disintegration of north ameriCan trade • EnriquE DussEl PEtErs anD KEvin P. GallaGhEr
TABLE 3
Matrix of competitive interactions between china and other countries in export markets
China’s export market shares
Rising Falling
Other countries’ export market shares
Rising
A. No threat C. Reverse threat
Both China and the other country have rising market shares and the latter is gaining more than China
No competitive threat from China. The threat is the reverse, from the other country to China
B. Partial threat
Both are gaining market share but China is gaining faster than the other country
Falling
D. Direct threat E. Mutual withdrawal: no threat
China gains market share and the other country loses; this may indicate causal connection unless the other country was losing market share in the absence of Chinese entry
Both parties lose market shares in export markets to other competitors
Source: Sanjaya Lall and John Weiss, “China’s competitive threat to Latin America: an analysis for 1990–2002”, Oxford Development Studies, vol. 33, No. 2, Taylor & Francis, 2005.
TABLE 4
the “threat” posed by china in Mexican and united states markets(Percentages)
Direct Partial Total
United States Percentage of manufactures exports to Mexico 96 0 96Percentage of total exports to Mexico 62 0 62
Mexico Percentage of manufactures exports to United States 52 29 81Percentage of all exports to the United States 36 20 56
Source: prepared by the authors, on the basis of United Nations Commodity Trade Statistics Database (comtrade), 2011; and Sanjaya Lall and John Weiss, “China’s competitive threat to Latin America: an analysis for 1990–2002”, Oxford Development Studies, vol. 33, No. 2, Taylor & Francis, 2005.
Table 4 shows that 96% of United States manufacturing exports to Mexico, which represent 62% of total United States exports to Mexico, are under threat from China. It is interesting to note in this case that none of the exports are experiencing a partial threat, rather all are considered to be under direct threat. For Mexico, 81% of Mexican manufactures exports and 56% of total Mexican exports to the United States are under threat from China. In the case of Mexican manufactures, 52% of Mexican exports to the United States are under direct threat, and 29% are under partial threat. The only sector in which Mexico is not under threat from China or is gaining market share with respect to China is in relation to cars, trucks and related parts and accessories. This is because such items are physically heavy to
transport from China and because the North American auto sector enjoys protection under nafta (Gallagher, Moreno-Brid and Porzecanski, 2008). In terms of total Mexican exports, 36% are under direct threat and 20% are under partial threat from China. Unlike Mexico, China does not export petroleum or other commodities to the United States, which explains why its total export share is not as significant.
Table 5 shows 53 sectors that we term under “triple threat.” In these sectors, which represent 49% of all Mexican exports, the United States is losing market share to China in the Mexican market and Mexico is losing market share to China in the United States market. First let us examine the United States and China in the Mexican market. For the 53 sectors under consideration,

c e p a l r e v i e w 1 1 0 • a u g u s t 2 0 1 3
nafta’s uninvited guest: china and the disintegration of north american trade • enrique dussel peters and Kevin p. gallagher
91
the United States share in the Mexican market was on average 69% in 2000. By 2009, that share had fallen to 43%, representing a 26 percentage point change in just nine years. For example, in 2000 the United States held 68% of the Mexican market for synthetic fibres and China had 0.1% of that market. By 2009 the United States’ share had shrunk by 20 percentage points and China had increased its share by almost 14 percentage points. Likewise, in 2000 the United States supplied Mexico with 60.8% of its office machine and computer imports and 70% of the peripheral parts for those machines. By 2009 those shares had dropped by 51 percentage points and 60 percentage points, respectively. By 2009 the United States held only 10% of the Mexican import market in each. By contrast, China held 13% of the office machine import market and 5% of the parts market in Mexico in 2000 and, by nine years later, it had 48% and 58% of those markets, respectively. The United States commanded 60% of Mexico’s telecommunications market in 2000, but lost 44 percentage points of market share and held just 16% of the market in 2009. In 2000 the United States supplied 90% of all Mexican imports of base metals manufactures, but that percentage dropped by 30 percentage points in 2009 when China increased its share in the Mexican market from 0% to 15%.
If the United States is losing market share to China in the Mexican market, that would indicate that export-oriented firms operating in Mexico may have the opportunity for efficiency and productivity gains. The United States is presumably losing ground because Chinese imports are cheaper than their United States counterparts. To the extent that Chinese exports to Mexico represent inputs to Mexican firms, firms in Mexico should be able to export at a more competitive price (Lederman, Olarreaga and Rubiano, 2008). However, for the same 53 sectors where the United States is losing market share to China, Mexico is actually losing market share to China in the United States market. On average, Mexico held 14% of the United States import market for these sectors in 2000, but that share dropped to 9% in 2009. Returning to the example of the synthetic fibre sector, in 2000 Mexico had 15% of the United States import market, but that share dropped by 14 percentage points to just 1% in 2009. In 2000 Mexico supplied the United States with 9% of its office machine and computer imports and 11% of the peripheral parts for those machines. By 2009 those shares dropped by 9 percentage points and 5 percentage points, respectively, to stand at approximately 1% and 2%, respectively, of the United States import market. With regard to telecommunications, Mexico is also losing market share in the United States.
TABLE 5
the “triple threat”(Percentages)
Products
Change in United States exports
to Mexico
Change in Chinese exports to Mexico
Change in Mexican exports to the United States
(2000-2009) (2000-2009) (2000-2009)
1 Synthetic fibres suitable for spinning -20.5 13.4 -14.1
2 Other man-made fibres for spinning, and waste -2.6 8.0 -7.1
3 Alcohols, phenols, etc., and their derivatives -11.1 1.4 -1.2
4 Soap, cleansing and polishing preparations -8.8 0.9 -5.9
5 Fertilizers, manufactured -7.0 5.4 -0.04
6 Regenerated cellulose; derivatives of cellulose; vulcanized fibre -19.0 3.2 -0.3
7 Pesticides, disinfectants -1.0 2.8 -3.7
8 Miscellaneous chemical products, nes -11.0 2.5 -0.3
9 Manufactures of leather or of composition leather, nes; etc. -36.9 8.4 -7.6
10 Furskins, tanned or dressed; pieces of furskin, tanned or dressed -45.8 1.5 -0.6
11 Cotton fabrics, woven (not including narrow or special fabrics) -21.3 11.2 -6.0
12 Fabrics, woven, of man-made fibres (not narrow or special fabrics) -5.7 9.0 -1.0
13 Knitted or crocheted fabrics (including tubular, etc., fabrics) -13.1 15.8 -4.0

c e p a l r e v i e w 1 1 0 • a u g u s t 2 0 1 392
nafta’s uninvited guest: China and the disintegration of north ameriCan trade • EnriquE DussEl PEtErs anD KEvin P. GallaGhEr
Products
Change in United States exports
to Mexico
Change in Chinese exports to Mexico
Change in Mexican exports to the United States
(2000-2009) (2000-2009) (2000-2009)
14 Tulle, lace, embroidery, ribbons, trimmings and other small wares -30.0 9.4 -4.6
15 Made-up articles, wholly or chiefly of textile materials, nes -44.3 25.9 -8.0
16 Floor coverings, etc. -19.7 3.2 -0.4
17 Pottery -9.1 46.7 -1.9
18 Universals, plates, and sheets, of iron or steel -13.5 1.9 -1.9
19 Tube, pipes and fittings of iron or steel -12.5 11.3 -1.7
20 Nails, screws, nuts, rivets, etc., of iron, steel or copper -28.6 8.9 -0.9
21 Cutlery -19.4 11.5 -0.9
22 Household equipment of base metal, nes -26.8 28.5 -9.8
23 Manufactures of base metal, nes -29.6 14.9 -1.5
24 Steam boilers and auxiliary plant; and parts thereof, nes -5.1 9.0 -0.4
25 Rotating electric plant and parts thereof, nes -16.2 15.6 -12.2
26 Civil engineering, contractors’ plant and equipment and parts, nes -12.3 2.5 -0.2
27 Food-processing machines (non-domestic) and parts thereof, nes -11.3 1.9 -1.2
28 Non-electric parts and accessories of machinery, nes -22.4 8.3 -2.7
29 Office machines -51.1 35.0 -8.1
30 Parts, nes of and accessories for machines of headings 751 or 752 -60.3 53.4 -4.8
31 Television receivers -28.4 27.2 -11.3
32 Radio-broadcast receivers -2.8 8.0 -9.1
33 Gramophones, dictating machines and other sound recorders -42.2 53.4 -4.5
34 Telecommunication equipment, nes; parts and accessories, nes -43.6 37.0 -2.5
35 Electric power machinery, and parts thereof, nes -51.5 36.7 -7.0
36 Equipment for distribution of electricity -27.6 15.7 -16.8
37 Electro-medical and radiological equipment -16.2 5.1 -1.4
38 Passenger motor vehicles (excluding buses) -26.8 0.3 -2.0
39 Trailers, and other vehicles, not motorized, nes -9.0 6.7 -2.0
40 Railway vehicles and associated equipment -31.3 7.2 -16.4
41 Furniture and parts thereof -32.4 18.3 -4.5
42 Travel goods, handbags etc., of leather, plastic, textile, others -22.6 20.6 -2.4
43 Men’s and boy’s outerwear, textile, not knitted or crocheted -47.9 8.7 -5.9
44 Women’s, girls’, infants’ outerwear, textile, not knitted or crocheted
-66.7 3.0 -9.9
45 Outerwear knitted or crocheted, not elastic nor rubberized -61.4 5.0 -7.6
46 Under-garments, knitted or crocheted -72.7 0.5 -13.1
47 Clothing accessories, of textile fabrics, nes -45.6 14.1 -5.7
48 Articles of apparel, clothing accessories, non-textile, headgear -57.2 38.1 -0.7
49 Footwear -8.2 9.5 -0.7
50 Meters and counters, nes -13.7 6.4 -5.1
51 Measuring, checking, analysis, controlling instruments, nes, parts -26.1 5.7 -4.1
52 Photographic and cinematographic supplies -4.2 1.0 -3.6
53 Baby carriages, toys, games and sporting goods -26.7 34.1 -1.5
Source: prepared by the authors, on the basis of United Nations Commodity Trade Statistics Database (comtrade), 2011.
Abbreviation: nes, not elsewhere specified.
Table 5 (concluded)
c e p a l r e v i e w 1 1 0 • a u g u s t 2 0 1 3
nafta’s uninvited guest: china and the disintegration of north american trade • enrique dussel peters and Kevin p. gallagher
93
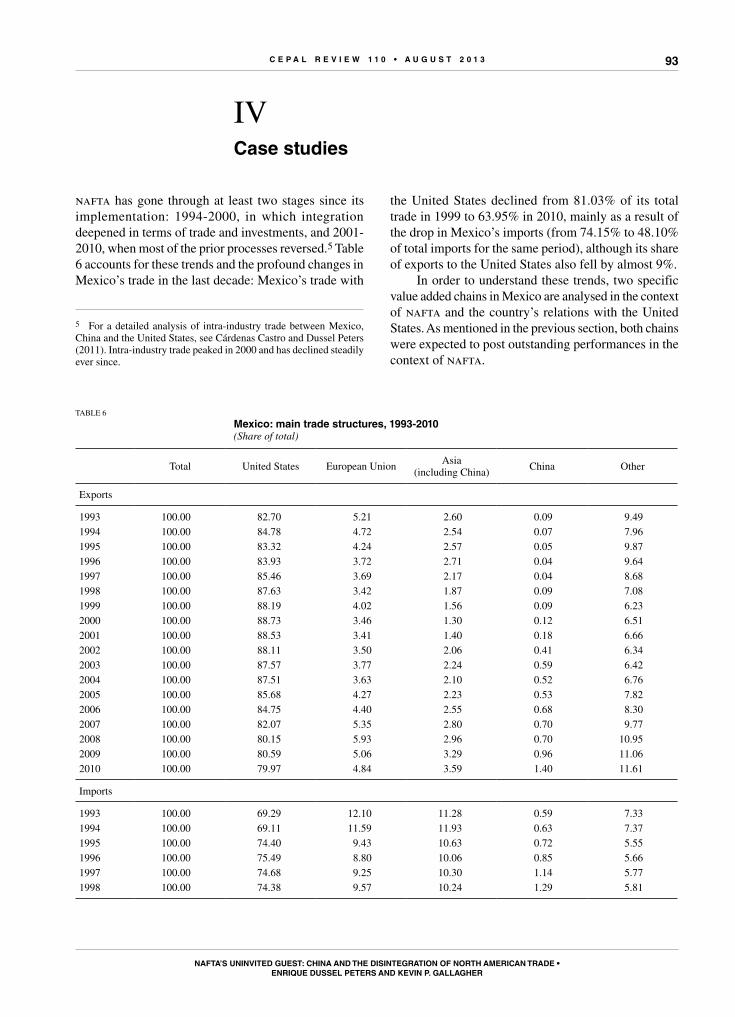
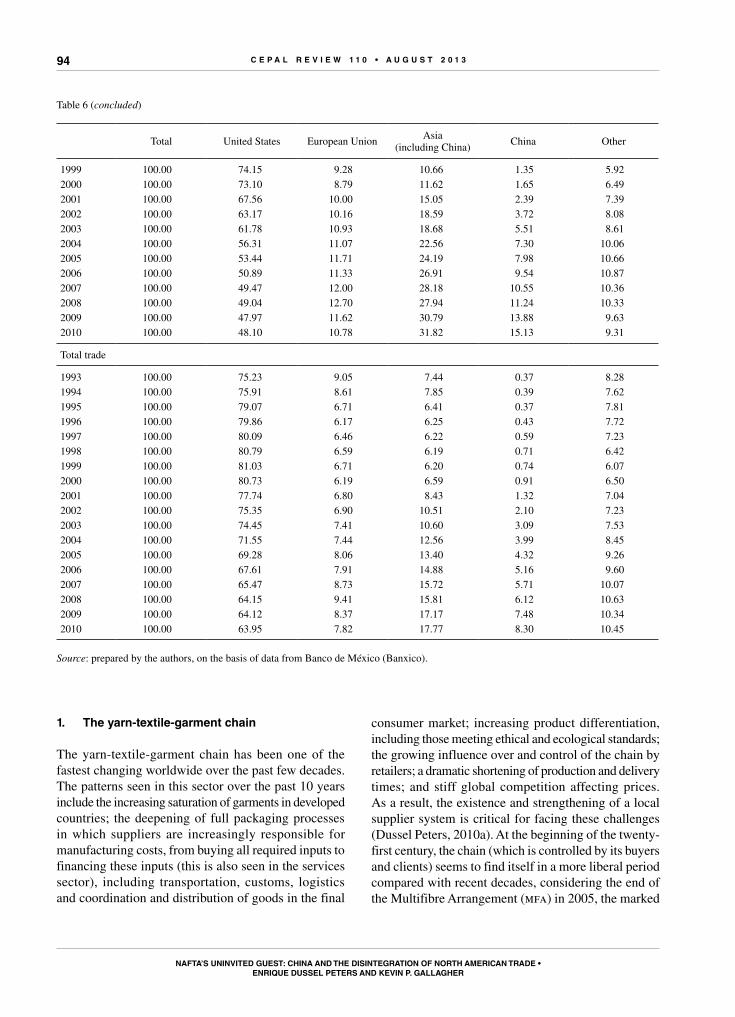
nafta has gone through at least two stages since its implementation: 1994-2000, in which integration deepened in terms of trade and investments, and 2001-2010, when most of the prior processes reversed.5 Table 6 accounts for these trends and the profound changes in Mexico’s trade in the last decade: Mexico’s trade with
5 For a detailed analysis of intra-industry trade between Mexico, China and the United States, see Cárdenas Castro and Dussel Peters (2011). Intra-industry trade peaked in 2000 and has declined steadily ever since.
IVCase studies
the United States declined from 81.03% of its total trade in 1999 to 63.95% in 2010, mainly as a result of the drop in Mexico’s imports (from 74.15% to 48.10% of total imports for the same period), although its share of exports to the United States also fell by almost 9%.
In order to understand these trends, two specific value added chains in Mexico are analysed in the context of nafta and the country’s relations with the United States. As mentioned in the previous section, both chains were expected to post outstanding performances in the context of nafta.
TABLE 6
Mexico: main trade structures, 1993-2010 (Share of total)
Total United States European UnionAsia
(including China)China Other
Exports
1993 100.00 82.70 5.21 2.60 0.09 9.491994 100.00 84.78 4.72 2.54 0.07 7.961995 100.00 83.32 4.24 2.57 0.05 9.871996 100.00 83.93 3.72 2.71 0.04 9.641997 100.00 85.46 3.69 2.17 0.04 8.681998 100.00 87.63 3.42 1.87 0.09 7.081999 100.00 88.19 4.02 1.56 0.09 6.232000 100.00 88.73 3.46 1.30 0.12 6.512001 100.00 88.53 3.41 1.40 0.18 6.662002 100.00 88.11 3.50 2.06 0.41 6.342003 100.00 87.57 3.77 2.24 0.59 6.422004 100.00 87.51 3.63 2.10 0.52 6.762005 100.00 85.68 4.27 2.23 0.53 7.822006 100.00 84.75 4.40 2.55 0.68 8.302007 100.00 82.07 5.35 2.80 0.70 9.772008 100.00 80.15 5.93 2.96 0.70 10.952009 100.00 80.59 5.06 3.29 0.96 11.062010 100.00 79.97 4.84 3.59 1.40 11.61
Imports
1993 100.00 69.29 12.10 11.28 0.59 7.331994 100.00 69.11 11.59 11.93 0.63 7.371995 100.00 74.40 9.43 10.63 0.72 5.551996 100.00 75.49 8.80 10.06 0.85 5.661997 100.00 74.68 9.25 10.30 1.14 5.771998 100.00 74.38 9.57 10.24 1.29 5.81
c e p a l r e v i e w 1 1 0 • a u g u s t 2 0 1 394
nafta’s uninvited guest: China and the disintegration of north ameriCan trade • EnriquE DussEl PEtErs anD KEvin P. GallaGhEr
Total United States European UnionAsia
(including China)China Other
1999 100.00 74.15 9.28 10.66 1.35 5.922000 100.00 73.10 8.79 11.62 1.65 6.492001 100.00 67.56 10.00 15.05 2.39 7.392002 100.00 63.17 10.16 18.59 3.72 8.082003 100.00 61.78 10.93 18.68 5.51 8.612004 100.00 56.31 11.07 22.56 7.30 10.062005 100.00 53.44 11.71 24.19 7.98 10.662006 100.00 50.89 11.33 26.91 9.54 10.872007 100.00 49.47 12.00 28.18 10.55 10.362008 100.00 49.04 12.70 27.94 11.24 10.332009 100.00 47.97 11.62 30.79 13.88 9.632010 100.00 48.10 10.78 31.82 15.13 9.31
Total trade
1993 100.00 75.23 9.05 7.44 0.37 8.281994 100.00 75.91 8.61 7.85 0.39 7.621995 100.00 79.07 6.71 6.41 0.37 7.811996 100.00 79.86 6.17 6.25 0.43 7.721997 100.00 80.09 6.46 6.22 0.59 7.231998 100.00 80.79 6.59 6.19 0.71 6.421999 100.00 81.03 6.71 6.20 0.74 6.072000 100.00 80.73 6.19 6.59 0.91 6.502001 100.00 77.74 6.80 8.43 1.32 7.042002 100.00 75.35 6.90 10.51 2.10 7.232003 100.00 74.45 7.41 10.60 3.09 7.532004 100.00 71.55 7.44 12.56 3.99 8.452005 100.00 69.28 8.06 13.40 4.32 9.262006 100.00 67.61 7.91 14.88 5.16 9.602007 100.00 65.47 8.73 15.72 5.71 10.072008 100.00 64.15 9.41 15.81 6.12 10.632009 100.00 64.12 8.37 17.17 7.48 10.342010 100.00 63.95 7.82 17.77 8.30 10.45
Source: prepared by the authors, on the basis of data from Banco de México (Banxico).
Table 6 (concluded)
1. the yarn-textile-garment chain
The yarn-textile-garment chain has been one of the fastest changing worldwide over the past few decades. The patterns seen in this sector over the past 10 years include the increasing saturation of garments in developed countries; the deepening of full packaging processes in which suppliers are increasingly responsible for manufacturing costs, from buying all required inputs to financing these inputs (this is also seen in the services sector), including transportation, customs, logistics and coordination and distribution of goods in the final
consumer market; increasing product differentiation, including those meeting ethical and ecological standards; the growing influence over and control of the chain by retailers; a dramatic shortening of production and delivery times; and stiff global competition affecting prices. As a result, the existence and strengthening of a local supplier system is critical for facing these challenges (Dussel Peters, 2010a). At the beginning of the twenty-first century, the chain (which is controlled by its buyers and clients) seems to find itself in a more liberal period compared with recent decades, considering the end of the Multifibre Arrangement (mfa) in 2005, the marked

c e p a l r e v i e w 1 1 0 • a u g u s t 2 0 1 3
nafta’s uninvited guest: china and the disintegration of north american trade • enrique dussel peters and Kevin p. gallagher
95
reduction of public interventions (in terms of tariff and non-tariff barriers and government subsidies) and the concentration of support instruments in the textile and accessories industry, and, to a lesser degree, in the clothing industry (Frederick and Gereffi, 2009).
In addition to these trends, there has been a rapid “reorientalization” of the yarn-textile-garment chain. While China, India, Bangladesh and Pakistan, among other countries, substantially increased their share of global production and trade in the first decade of the twenty-first century, developed countries have witnessed a continuous fall in production and trade since the 1980s. In the case of the United States, for example, textiles and apparel accounted for 1.1 million jobs in 2000, but that figure had more than halved by 2008 and is expected to fall by a further 22.6% by 2016 (Bureau of Labor Statistics, 2009).
In Mexico the yarn-textile-garment chain is one of the symbols of global and nafta integration. Based on the latest input-output matrix for the Mexican economy for 2003 (Dussel Peters, 2010a), this chain has several distinctive features. On the one hand, there are marked differences between the segments that make use of the maquiladora industry and the rest. The levels of imported inputs as a proportion of total inputs are higher for the chain than for all other areas of manufacturing: 33.1% for the yarn-textile-garment chain and 38.2% for the textile segment. In 2003, foreign trade accounted for 51% of output and 60% of the apparel segment. Despite the high level of integration in the world market, the chain has a profound structural weakness: its high component of net imports. In the case of the maquiladora industry, domestic content for the entire economy, manufacturing, the yarn-textile-garment chain and the textile segment was 0.3%, 3.1%, 4.7% and 15.7%, respectively. This structure is the result of complex incentives linked to temporary imports to be exported (Cárdenas Castro and Dussel Peters, 2007). On the other hand, the chain stands out for paying taxes (on output) that are 45% higher than in the Mexican economy as a whole (for apparel, taxes were 63% higher), for payments per employee (23% lower than the overall economy, with the exception of the textile segment) and for being particularly job-creation sensitive as a result of import substitution: a 10% increase in final demand owing to import substitution would lead to the creation of 17,000 jobs in the chain, particularly in the garment segment. Only 5 of 75 activities in the entire economy would generate more employment than the yarn-textile-garment chain (Dussel Peters, 2010a).
Considering the yarn-textile-garment chain’s growing orientation towards foreign trade (and a 60%
share of apparel production in 2003), what are the main features in terms of production, employment, trade and integration in the United States market and its relationship with China?
First, the yarn-textile-garment chain accounted for 0.9% and 5% of Mexico’s total and manufacturing gross value added, respectively, in 2009. Table 7 reflects the strong cyclical movement of the chain during the first nafta stage (until 2000) and the fall of gdp and employment indicators since then. In terms of gdp, while manufacturing has recovered slowly since 2005 (in 10 years its gdp grew by just 7%), the chain’s gross value added as a proportion of the total was lower than prior to nafta and was down by more than one quarter in 2010 compared with 2000. This performance, which is also a result of productivity growth and new forms of industrial organization discussed in the previous chapter, had a particularly marked impact on employment: while Mexico’s manufacturing sector as a whole lost almost a million jobs during 2000-2010 (or a quarter of total manufacturing employment), the yarn-textile-garment chain has lost almost half of its jobs since 2000 despite initial gains in the period 1994-2000. These losses have been particularly profound in the garment segment. The entire chain accounted for more than half a million jobs in 2009 (inegi, 2010a).
Second, in 1995-2010, 69.76% of Mexican exports from the yarn-textile-garment chain were in the apparel segment,6 followed by textiles (9.6%), yarn (8.97%) and other accessories (12.40%). Figure 3 reflects Mexico’s differentiated yarn-textile-garment dynamics before and after 2000, with an average annual growth rate of exports of 20.7% and -5.4% for 1995-2000 and 2000-2010, respectively. Over the period 1995-2010, the United States accounted for 90.6% of Mexico’s yarn-textile-garment chain exports. This differentiated performance is particularly striking for the garment segment (see figure 4). Rather surprising is the fact that Mexico’s trade balance in the chain turned negative in 2006 (figure 4) as a result of a drop in apparel exports since 2001 and a rise in imported inputs.
6 The yarn-textile-garment chain is an aggregation of 5,503 fractions at the 10-digit level of the Harmonized Tariff System. For the case of United States trade, which registers trade at the 10-digit level, for example, we account for fibres and yarn (493 items), textiles (1,575 items), garments (2,985 items) and other inputs (450 items) at the 8-digit level (for Mexico, for example). The items change over time as new products appear and old ones disappear from the Harmonized Tariff System. For more information on this issue, see Cárdenas Castro and Dussel Peters (2007) and Dussel Peters (2004).

c e p a l r e v i e w 1 1 0 • a u g u s t 2 0 1 396
nafta’s uninvited guest: China and the disintegration of north ameriCan trade • EnriquE DussEl PEtErs anD KEvin P. GallaGhEr
TABLE 7
Mexico: gdp and employment trends in manufacturing and the yarn-textile-garment chain, 1994-2010(Percentages)
1994 1995 1996 1997 1998 1999 2000 2001 2002
gdp (2000=100)
Manufacturing 72.77 68.77 75.94 83.90 89.93 93.90 100.00 96.13 95.10Yarn-textile-garment chain 76.42 71.51 82.33 89.44 92.54 96.63 100.00 90.15 84.46
Employment (2000=100)
Manufacturing 71.84 70.07 74.97 83.48 88.54 93.95 100.00 95.99 90.84Yarn-textile-garment chain 94.34 85.38 90.99 96.38 98.26 98.85 100.00 90.91 83.65Garment 91.34 81.02 86.98 92.05 100.30 101.45 100.00 91.74 83.56
2003 2004 2005 2006 2007 2008 2009 2010
gdp (2000=100)
Manufacturing 93.75 97.44 100.91 106.89 108.74 107.95 97.38 107.03Yarn-textile-garment chain 78.58 79.68 77.61 78.07 75.10 73.83 69.11 74.04
Employment (2000=100)
Manufacturing 87.20 86.86 87.24 88.60 88.83 85.88 77.30 80.70Yarn-textile-garment chain 77.27 71.67 68.65 66.52 64.52 60.11 54.86 55.47Garment 77.60 71.97 67.15 66.07 63.74 58.68 53.27 52.75
Source: prepared by the authors, on the basis of National Institute of Statistics and Geography (inegi), Monthly Manufacturing Survey (eim) and Mexican System of National Accounts.
Abbreviation: gdp, gross domestic product.
FIGURE 3
Mexico: yarn-textile-garment chain exports by segment, 1995-2009(Average annual growth rate)
-10
-5
0
5
10
15
20
25
30
Yarn Textile Garment Other Yarn-textile-garment
1995-2010 1995-2000 2000-2010
Source: prepared by the authors, on the basis of data from United States International Trade Commission (usitc), 2010.

c e p a l r e v i e w 1 1 0 • a u g u s t 2 0 1 3
nafta’s uninvited guest: china and the disintegration of north american trade • enrique dussel peters and Kevin p. gallagher
97
FIGURE 4
Mexico: trade balance by main segments, 1995-2010(Millions of dollars)
-6 000
-4 000
-2 000
0
2 000
4 000
6 000
1995 1996 1997 1998 1999 2000 2001 2002 2003 2004 2005 2006 2007 2008 2009 2010
Yarn Textiles Clothing Other Total
Source: prepared by the authors, on the basis of data from the Center for Chinese-Mexican Studies (CECHIMEX), 2011.
Third, considering the high concentration of Mexican yarn-textile-garment chain exports to the United States, several issues highlight the increasing disintegration of the regional chain’s industrial organization in the nafta region. Table 8 shows that Mexico’s yarn-textile-garment exports to the United States increased substantially during the 1990s and subsequently declined, growing by an average annual rate of 30.7% in 1990-2000 and contracting by 4.4% in 2000-2010. Mexico’s share of total United States imports in the chain peaked in 1999 at 13.27%, and then fell continuously to 6.51% in 2010. Meanwhile, China’s share expanded from 12.41% to 42.1% in the same period. Two other aspects are important: (i) the import/export coefficient of the United States (also a proxy for measuring the United States content of United States imports) shows that Mexico and Central America are major consumers of the United States yarn-textile-garment chain, in contrast with the rest of the world and China (in other words, Mexico is not only a major exporter to the United States, but also the country with the highest United States value added in its exports, which reflects an important degree of regional integration); and (ii) also as a result of nafta, Mexico still benefits from massive tariff incentives, paying in
2000-2010 only 4.62% of the tariffs paid on all United States yarn-textile-garment imports. Tariffs in this chain are substantial and those paid by Asian countries are much higher than those paid by Mexico (see table 8).
Fourth, as Mexico faces increasing competition in the United States market, production of supplies (fabric and textile accessories) has fallen, especially in the case of synthetic fibres such as polyester and rayon, while wool and cotton products remain quite competitive and have not yet been displaced by Asian and Chinese products.7
Finally, and in qualitative terms, Mexican businesses (Dussel Peters, 2010a) have been outspoken in calling for the modernization of nafta. After more than 17 years, the agreement’s regional integration framework is outdated since it was developed at the beginning of
7 At a disaggregated level, Mexico is still a critical exporter to the United States in denim and cotton products for men and women. Some examples are items 6203424011 (men’s cotton and blue denim trousers and breeches of cotton not knitted) and 6204624011 (women’s cotton and blue denim trousers and breeches of cotton, not knitted). But in products related to synthetic fibres and nylon, such as items 6203434010 (men’s synthetic fiber pants and underwear, not stitched) and 6204633510 (women’s synthetic fiber pants and underpants, not stitched), Mexico’s share of United States imports and absolute exports has fallen drastically.

c e p a l r e v i e w 1 1 0 • a u g u s t 2 0 1 398
nafta’s uninvited guest: China and the disintegration of north ameriCan trade • EnriquE DussEl PEtErs anD KEvin P. GallaGhEr
the 1990s and based on the industrial organization of the late 1980s that does not exist today: most of the textile and accessories producers have left the region, and Asia has become the main global producer of these items. In addition, the United States has granted significant benefits to other countries with which it has signed free trade agreements that are not part of nafta. Thus, from this business perspective, the rules of origin and other legal requirements of nafta are increasingly obsolete and
impossible to fulfil, and the United States authorities have developed a number of annual instruments to overcome these regional limitations. However, the current nafta framework and these annual incentives to enable certain products, which would otherwise fail to comply, to meet rules of origin requirements have weakened the regional and Mexican yarn-textile-garment chain, since firms cannot depend on monthly and annual decision-making for long-term operations and strategies.
TABLE 8
united states: yarn-textile-garment chain imports, 1990-2010
Share of total imports
1990 2000 2010 1990-2000 2000-2010
China 11.44 12.02 42.10 13.07 27.13
Viet Nam 0.00 0.06 4.80 0.04 3.28
Mexico 2.98 13.22 6.51 9.34 8.45India 3.17 3.85 2.48 3.77 4.48Indonesia 2.64 3.11 1.68 2.97 3.36Total imports 100.00 100.00 100.00 100.00 100.00
Import/export coefficient (percentages)
China 5.498 20.518 25.329 10.070 26.956Viet Nam ... 6.093 95.909 3.043 91.020Mexico 309 754 783 674 732India 10.398 25.542 10.849 14.323 26.933Indonesia 16.005 28.242 24.579 17.729 38.757Total imports 1.289 1.774 3.122 1.513 2.461
Tariffs on imports (total = 100)
China 92.66 105.24 118.45 99.23 114.14Viet Nam ... 371.4 5.09 316.41 137.48Mexico 85.76 3.38 2.16 14.29 4.62India 86.12 109.69 8.78 101.99 102.71Indonesia 124.88 159.46 19.39 147.27 163.39Total imports 100 100 100 100 100
Source: prepared by the authors, on the basis of data from the United States International Trade Commission (usitc), 2011.
2. the autoparts-automobile chain
The autoparts-automobile chain was not only one of the first that began transferring segments of its value chain at the international level (Piore and Sabel, 1984), it is also producer-driven (unlike the yarn-textile-garment chain). As a result of consumer preferences, tariff considerations and public sector interventions to incentivize local and national production and firms, the autoparts-automobile chain has
increasingly regionalized. In addition, the chain has been characterized by (i) the formation of “modules” that can be transferred; (ii) significant ecological, environmental and efficiency concerns and standards that have generated a new dynamic of innovation and competition in hybrid and electric vehicles; and (iii) massive mobilization of national resources to enhance domestic production, particularly since the 2007-2008 international crisis (Rodrik, 2010; Sturgeon, Biesebroeck and Gereffi, 2008).

c e p a l r e v i e w 1 1 0 • a u g u s t 2 0 1 3
nafta’s uninvited guest: china and the disintegration of north american trade • enrique dussel peters and Kevin p. gallagher
99
Several international trends are relevant for understanding the specific industrial organization in the nafta region and its relationship with China. First are the profound spatial readjustments of the autoparts-automobile chain over the past few decades (see table 9). While the United States has lost substantial market share, falling from levels close to 50% of global production in the 1960s to 15% in the first half of the 1990s to 10% in 2010,8 Japan’s output increased until the 1990s to levels above 25% and fell continuously after that, to 12.9% in 2010. On the other hand, a group of emerging countries including Brazil, China, India, Mexico and the Republic of Korea substantially increased their production to account for more than 40% in 2010. China, which became the main global producer in 2009 and accounted for 23.5% of global output in 2010, is probably one of the most outstanding cases in the history of automobiles, considering that in the first half of the 1990s its share of output was less than 1%. Mexico, on the other hand, increased its share in the 1990s to 3.3% in 2000-2001, but saw its participation slip back to 3% by 2010.
8 The United States has not only witnessed a substantial fall in sales of new vehicles, from more than 17 million units in 2000-2006 to 10.6 million and 11.5 million in 2009 and 2010, respectively, but also a massive penetration of Asian brands in overall United States imports, which accounted for more than 35% in 2010 (SE, 2011).
Second, these regional patterns have deepened since the global crisis in 2008-2009: while vehicle production fell and the average annual growth rates for the European Union, the United States, Japan and the world as a whole were -5.1%, -5.5%, -8.8% and 4.7%, China posted an average annual growth rate of 40.1% for 2008-2010. Only a few emerging countries, such as India and Mexico with average annual growth rates of 23.1% and 4.0%, respectively, also recovered quickly following the crisis or saw no fall in production at all.
Third, although companies based in Japan, the United States and Europe continued to predominate in 2009 (Toyota, General Motors, Volkswagen, Ford and Hyundai headed total vehicle output), 21 Chinese companies now rank among the world’s top 50 automobile producers. None of these companies is among the top 10 producers, but they are already beginning to edge into the top 20.
What are the main trends for the Mexican autoparts-automobile chain in respect of the United States and nafta? In Mexico, the automotive market and its segments represented 2.7% of total gdp and 16% of manufacturing output in 2009 and was the manufacturing sector that recovered most quickly after the global crisis in 2008-2009 in terms of production, employment and exports (Monitor de la Manufactura Mexicana, 2012). There are currently 13 original equipment manufacturer
TABLE 9
share of international automobile output, 1961-2010(Percentages)
1961 1971 1981 1991 1999 2000 2005 2008 2009 2010
United States 48.5 32.5 22.8 15.4 23.2 21.9 18.0 12.3 9.3 10.0United Kingdom 8.8 6.6 3.5 3.5 3.5 3.1 2.7 2.3 1.8 1.8Italy 6.1 6.4 4.6 4.6 3.0 3.0 1.6 1.5 1.4 1.1Germany 15.8 14.5 13.7 13.3 10.1 9.5 8.7 8.6 8.4 7.6France 8.7 10.2 9.5 9 5.7 5.7 5.3 3.6 3.3 2.9 Mexico ... 0.6 1.3 2 2.8 3.3 2.5 3.1 2.5 3.0Japan 2.2 14.1 25.4 27.6 17.6 17.4 16.2 16.4 12.9 12.4China ... ... ... 0.2 3.3 3.5 8.6 13.3 22.4 23.5Spain 0.5 1.7 3.1 5.5 5.1 5.2 4.1 3.6 3.5 3.1Brazil 0.9 1.3 1.5 2 2.4 2.9 3.8 4.6 5.2 4.7Republic of Korea ... ... 0.3 3.3 5.1 5.3 5.6 5.4 5.7 5.5India 0.2 0.2 0.2 0.5 1.5 1.4 2.5 3.3 4.3 4.6Total world output (millions of vehicles)
11.391 26.453 27.407 35.287 56.259 58.374 66.482 70.527 61.715 77.610
Source: prepared by the authors, on the basis of data from the International Organization of Motor Vehicle Manufacturers (oica), 2011.

c e p a l r e v i e w 1 1 0 • a u g u s t 2 0 1 3100
nafta’s uninvited guest: China and the disintegration of north ameriCan trade • EnriquE DussEl PEtErs anD KEvin P. GallaGhEr
The autoparts-automobile chain in Mexico is the result of a long history of incentives, which include the adoption of five decrees between 1962 and 1993 (the last of which was aimed at achieving certain levels of value added in Mexico), as well as technological provisions and requirements related to the trade balance, among other purposes. With nafta, regional rules of origin govern Mexico’s industrial organization: the regional content value (measured based on either the transaction value or the net cost) established under article 401 of nafta enables regional production to benefit from tariff reductions. Since 2002, the level of value added has been replaced by regional rules of origin (62.6% for automobiles) in order to prevent foreign companies from using Mexico as an export platform to the United States (Dussel Peters, Ruiz Durán and Taniura, 1997; Hufbauer and Schott, 2005). On the other hand, Mexico has its own legislation to promote competitive advantages for the autoparts-automobile chain (dof, 2003) and several later decrees dating up to 2010. In general, Mexican legislation requires compliance with a series of provisions by new manufacturers of vehicles (but not for autoparts and accessories) weighing up to 8,864 kg:(i) To manufacture at least 50,000 units;(ii) To invest in Mexico at least US$ 100 million in
fixed assets for automotive production;(iii) To establish agreements with distributors of vehicles;(iv) For new manufacturers without previous production
in Mexico, in addition to items (i)-(iii), exceptional permission is granted for importing vehicles with zero ad-valorem tariff rates during the first three years following installation of a new manufacturer for 10% of production.9 This criteria continues even after the first three years of production.
9 The import tariff was 40% until 2009, 30% in 2010-2011 and 20% in 2012. According to some firms, this sharp decline may result in
(oem) plants dedicated to passenger-vehicle production and another 11 for commercial vehicles. Exports are the primary destination of autoparts-automobile chain output in Mexico, accounting for 78% of the total (inegi, 2010a). From this perspective, the 1994-1995 crisis and the launch of nafta marked a turning point in the shift towards export orientation. Table 9 shows that vehicle production almost doubled in the first stage of nafta (1994-2000), but remained relatively stable during the period 2006-2010, with a sharp downturn during the crisis and a rapid recovery in 2010.
The autoparts-automobile chain in Mexico presents a set of specific features (Dussel Peters, Ruiz Durán and Taniura, 1997; inegi 2010b; SE 2008). First, in Mexico this chain is made up of four large segments (assemblers, larger components and subassembly, parts and components and raw materials) and none of the 18 assembly companies in the first segment is Mexican. The automotive parts and components segment is made up of about 1,000 national and foreign manufacturers, of which 345 are first-tier firms (amda/amia/ina, 2009; SE, 2011). Second, the autoparts-automobile chain is paradigmatic for Mexico since it has shifted dramatically towards exports. And, unlike its structure in the 1980s (which changed with the signing of nafta), this chain in Mexico is profoundly integrated with that of the United States, to such a degree that we could refer to a regional autoparts-automobile chain with regional models, inputs, products and processes. Table 10 shows how all segments in the chain have experienced this export orientation in relation to both cars and trucks.10
However, the domestic market has not recovered significantly, and in 2008-2010 it still posted levels well below those of the early 2000s. Third, the autoparts-automobile chain has acquired more and more importance in Mexico’s foreign trade, accounting in 2010 for 28% of exports and 17% of imports, with an annual trade surplus above US$ 20 billion since 2006, making it the chain with the largest trade surplus in Mexico. Exports from the autoparts and components segment have increased significantly and accounted for 57% of the chain’s exports during the period 1995-2010. Fourth, a country by country analysis shows that, although 93% of Mexico’s autoparts-automobile chain exports were directed to the United States and Canada during the period 1995-2010, the proportion of United States imports from Mexico declined substantially. The United States share peaked at 76% in the mid-1990s and dropped to below 50% by 2009. In other words, the United States has experienced a notable loss in market share in Mexico (Dussel Peters, 2010b) (see table 11).
substantial new investments and imports from third countries. With respect to autoparts in 2010, 80% of the 1,837 tariff items were duty-free, while the rest did not pay tariffs above 5% (SE, 2011).10 The autoparts-automobile chain is made up of 491 items at the 10-digit level of the Harmonized Tariff System (96 items relating to automobiles and 395 relating to autoparts).

c e p a l r e v i e w 1 1 0 • a u g u s t 2 0 1 3
nafta’s uninvited guest: china and the disintegration of north american trade • enrique dussel peters and Kevin p. gallagher
101
TABLE 10
Mexico: total production of vehicles (domestic markets and exports), 1988-2010
Total production (units)
1988 1993 1994 1995 2000 2005
505 202 1 055 221 1 097 381 931 178 1 889 486 1 606 460
Share of total production (percentages)
EXPORTS Vehicles 34.49 46.74 52.40 83.62 75.84 74.25 Cars 40.99 53.34 58.79 85.33 72.80 69.59 Trucks 19.31 21.65 29.67 78.47 82.21 83.13
DOMESTIC MARKET Vehicles 65.51 53.26 47.60 16.38 24.16 25.75 Cars 59.01 46.66 41.21 14.67 27.20 30.41 Trucks 80.69 78.35 70.33 21.53 17.79 16.87
IMPORTS Vehicles 3.87 3.99 10.01 4.00 23.69 46.98 Cars 0.36 1.08 7.20 2.12 19.95 36.18 Trucks 12.07 15.07 20.01 9.66 31.54 67.52
TOTAL DOMESTIC SALES Vehicles 69.38 57.26 57.61 20.37 47.85 72.73 Cars 59.38 47.74 48.41 16.79 47.15 66.60 Trucks 92.76 93.42 90.34 31.19 49.33 84.39
Total production (units)
2008 2009 2010 1988-1993 1994-2000 2000-2010
2 103 801 1 507 527 2 260 776 5 005 406 9 388 600 20 009 039
Share of total production (percentages)
EXPORTSVehicles 79.20 81.36 82.97 37.92 72.41 77.71 Cars 79.99 80.26 80.66 45.59 70.47 74.40 Trucks 77.54 83.58 87.25 15.66 76.63 84.15
DOMESTIC MARKET Vehicles 20.80 18.64 17.03 62.08 27.59 22.29 Cars 20.01 19.74 19.34 54.41 29.53 25.60 Trucks 22.46 16.42 12.75 84.34 23.37 15.85
IMPORTSVehicles 29.93 30.77 19.26 4.38 14.36 33.29 Cars 20.94 22.27 14.96 1.29 9.86 26.99 Trucks 48.73 48.01 27.24 13.35 24.15 45.56
TOTAL DOMESTIC SALESVehicles 50.73 49.41 36.29 66.46 41.95 55.58 Cars 40.95 42.01 34.29 55.70 39.40 52.59 Trucks 71.19 64.43 39.99 97.69 47.52 61.41
Source: prepared by the authors, on the basis of data from the Mexican Automotive Industry Association (amia), 2011.

c e p a l r e v i e w 1 1 0 • a u g u s t 2 0 1 3102
nafta’s uninvited guest: China and the disintegration of north ameriCan trade • EnriquE DussEl PEtErs anD KEvin P. GallaGhEr
TAB
LE
11
Mex
ico
: au
top
arts
-au
tom
ob
ile c
hai
n t
rad
e by
mai
n c
ou
ntr
ies,
199
5-20
10
1995
2000
2005
2008
2009
2010
1995
-201
0
IMPO
RT
S
Val
ue (
mill
ions
of
dolla
rs)
1U
nite
d St
ates
7 24
224
918
22 1
9825
708
18 2
4226
379
321
524
2G
erm
any
662
2 39
63
296
4 48
33
887
3 62
439
288
3Ja
pan
821
1 73
32
814
4 23
92
696
4 64
137
119
4C
hina
1717
81
255
3 89
43
749
5 06
820
623
5B
razi
l77
914
2 84
52
541
1 83
72
296
23 8
00
Subt
otal
8 81
930
140
32 4
0840
864
30 4
1042
008
442
354
R
est
702
5 36
16
853
10 4
467
415
9 42
987
923
To
tal
9 52
135
501
39 2
6151
310
37 8
2551
437
530
277
Shar
e (p
erce
ntag
es)
1U
nite
d St
ates
76.0
670
.19
56.5
450
.10
48.2
351
.28
60.6
32
Ger
man
y6.
956.
758.
408.
7410
.28
7.05
7.41
3Ja
pan
8.62
4.88
7.17
8.26
7.13
9.02
7.00
4C
hina
0.18
0.50
3.20
7.59
9.91
9.85
3.89
5B
razi
l0.
812.
587.
254.
954.
864.
464.
49
Subt
otal
92.6
384
.90
82.5
479
.64
80.4
081
.67
83.4
2
Res
t7.
3715
.10
17.4
620
.36
19.6
018
.33
16.5
8
Tota
l10
0.00
100.
0010
0.00
100.
0010
0.00
100.
0010
0.00
Gro
wth
rat
e
1U
nite
d St
ates
...28
.0-2
.35.
0-2
9.0
44.6
9.0
2G
erm
any
...29
.36.
610
.8-1
3.3
-6.8
12.0
3Ja
pan
...16
.110
.214
.6-3
6.4
72.2
12.2
4C
hina
...60
.547
.745
.9-3
.735
.246
.35
Bra
zil
...64
.025
.5-3
.7-2
7.7
25.0
25.4
Su
btot
al...
27.9
1.5
8.0
-25.
638
.111
.0
Res
t...
50.2
5.0
15.1
-29.
027
.218
.9
Tota
l...
30.1
2.0
9.3
-26.
336
.011
.9

c e p a l r e v i e w 1 1 0 • a u g u s t 2 0 1 3
nafta’s uninvited guest: china and the disintegration of north american trade • enrique dussel peters and Kevin p. gallagher
103
1995
2000
2005
2008
2009
2010
1995
-201
0
EX
POR
TS
V
alue
(m
illio
ns o
f do
llars
)
1U
nite
d St
ates
17 0
5643
058
50 9
8358
819
46 7
8866
347
651
400
2C
anad
a1
375
1 89
21
492
2 29
84
286
5 44
127
224
3G
erm
any
9388
21
362
3 66
82
312
2 57
821
403
4A
rgen
tina
6113
393
631
522
1 11
14
373
6B
razi
l21
313
418
71
895
1 18
21
788
7 56
17
Chi
na0
2094
260
264
724
1 90
2
Subt
otal
18 7
9845
999
54 5
1067
571
55 3
5477
989
713
863
R
est
895
749
2 27
25
146
3 21
75
038
32 6
30
Tota
l19
694
46 7
4856
783
72 7
1758
572
83 0
2774
6 49
3
Shar
e (p
erce
ntag
es)
1U
nite
d St
ates
86.6
092
.11
89.7
980
.89
79.8
879
.91
87.2
62
Can
ada
6.98
4.05
2.63
3.16
7.32
6.55
3.65
3G
erm
any
0.47
1.89
2.40
5.04
3.95
3.11
2.87
4A
rgen
tina
0.31
0.03
0.69
0.87
0.89
1.34
0.59
6B
razi
l1.
080.
290.
332.
612.
022.
151.
017
Chi
na0.
000.
040.
170.
360.
450.
870.
25
Subt
otal
95.4
598
.40
96.0
092
.92
94.5
193
.93
95.6
3
Res
t4.
551.
604.
007.
085.
496.
074.
37
Tota
l10
0.00
100.
0010
0.00
100.
0010
0.00
100.
0010
0.00
Gro
wth
rat
e
1U
nite
d St
ates
...20
.33.
44.
9-2
0.5
41.8
9.5
2C
anad
a...
6.6
-4.6
15.5
86.5
26.9
9.6
3G
erm
any
...56
.89.
139
.1-3
7.0
11.5
24.8
4A
rgen
tina
...-2
7.0
99.0
17.1
-17.
311
3.0
21.4
6B
razi
l...
-8.8
6.8
116.
5-3
7.6
51.2
15.2
7C
hina
...12
6.6
36.5
40.2
1.3
174.
366
.9
Subt
otal
...19
.63.
57.
4-1
8.1
40.9
9.9
R
est
...-3
.524
.931
.3-3
7.5
56.6
12.2
To
tal
...18
.94.
08.
6-1
9.5
41.8
10.1
Sour
ce: p
repa
red
by th
e au
thor
s, o
n th
e ba
sis
of d
ata
from
the
Uni
ted
Stat
es I
nter
natio
nal T
rade
Com
mis
sion
(u
sitc
), 2
011.
Tabl
e 11
(co
nclu
ded)

c e p a l r e v i e w 1 1 0 • a u g u s t 2 0 1 3104
nafta’s uninvited guest: China and the disintegration of north ameriCan trade • EnriquE DussEl PEtErs anD KEvin P. GallaGhEr
Considering the critical importance of the United States for Mexican autoparts-automobile chain trade, table 12 illustrates the profound integration of this chain between Mexico and the United States. Since the signing of nafta, Mexico has consolidated itself as the primary importer from the United States; and while Mexican autoparts-automobile chain imports represented barely 8% in 1990, by 2010 Mexico was the third-ranking autoparts-automobile chain exporter to the United States (21.32%), after Canada and Japan. China (which in 1990 represented only 0.11% of United States imports from this chain) has recorded the highest average annual growth rate (24.9% in 1990-2010) of the primary exporters to the United States, with exports representing 3% of the United States total in 2010. Additionally, Mexico has impressive tariff benefits as a result of nafta, with only Canada paying lower tariffs than Mexico. China, for example, paid a tariff that was 38 times higher than that paid by Mexico in 2010. While the average tariff rate in 2010 was relatively low (China paid 3.29% on average), because of small profit margins this difference can play a critical role in final firm-level decision-making (see table 12).
Five final points are relevant: (i) The 2008-2010 crisis had profound repercussions
for the autoparts-automobile chain in North America
and Mexico, and it has been the most severe since comparative information started to be compiled. The production of 1.6 million units in Mexico in 2009 fell by 28.9%, while employment dropped by 21.3% between August 2007 and January 2010.
(ii) Mexico started an impressive recovery trajectory early in 2010 and exports, trade and investments, with the exception of the domestic market, all increased dramatically.
(iii) United States firms in Mexico are by far the largest producers and exporters. The “big three” (General Motors, Chrysler and Ford) accounted for well above 60% prior to the signing of nafta and 52.4% in 2009.
(iv) Mexico’s autoparts-automobile chain attracted more than US$ 10 billion in foreign direct investment (fdi) in 2000-2010 and is a major player owing to the knowledge it has acquired over several decades of investments, trading, training and supplier systems, new forms of organization of local firms, links with higher education and initiatives to provide plants in 17 Mexican states with infrastructure and urban services.
(v) Mexico’s export performance has been particularly strong in the autoparts and components segment,
TABLE 12
united states of america: imports from selected countries in the autoparts-automobile chain, 1990-2010
1990 1995 2000 2005 2008 2009 2010 1990-2010Growth rate 1990-2010
Share (percentages)
1 Japan 36.68 30.48 24.13 21.91 23.85 21.40 22.81 25.27 3.22 Canada 33.87 36.15 32.61 29.64 22.94 22.64 26.26 30.31 4.43 Mexico 8.03 14.96 20.55 18.42 21.06 24.29 21.32 18.57 11.04 Germany 9.27 7.44 9.61 11.54 11.35 10.42 10.47 10.05 6.45 Republic of Korea 2.08 1.86 3.07 4.88 4.94 5.36 5.43 3.76 10.96 China 0.11 0.52 0.85 2.30 3.82 4.65 3.13 1.76 24.9 Total 100.00 100.00 100.00 100.00 100.00 100.00 100.00 100.00 5.7
Effective tariff (paid by total imports = 100)
1 Japan 12.37 9.50 4.73 5.84 186.61 189.71 174.12 7.14 2 Canada 150.25 166.53 157.68 143.37 3.45 2.86 2.69 159.87 3 Mexico 154.81 45.23 10.61 7.47 7.66 7.52 8.44 26.01 4 Germany 144.12 168.81 210.41 192.29 177.29 175.39 212.14 181.99 5 Republic of Korea 156.43 173.12 209.82 195.81 182.50 201.56 183.50 184.09 6 China 183.81 240.64 217.08 195.50 201.17 272.36 235.58 204.59 Total 100.00 100.00 100.00 100.00 100.00 100.00 100.00 100.00
Source: prepared by the authors, on the basis of data from the United States International Trade Commission (usitc), 2011.

c e p a l r e v i e w 1 1 0 • a u g u s t 2 0 1 3
nafta’s uninvited guest: china and the disintegration of north american trade • enrique dussel peters and Kevin p. gallagher
105
Unlike the yarn-textile-garment chain, the autoparts-automobile chain is at an advanced stage of integration in the nafta region. While the former has already been losing ground in the region, and particularly in the United States, autoparts-automobile chain integration between Mexico and the United States has continued. The latter trend is also reflected in Mexico’s large share in United States imports and the continuing expansion of fdi from United States firms in Mexico. However, there are also several regional trends that might in the
where it has been the main exporter to the United States since 2000 (32.83% of total United States autoparts imports in 2010). In the automobile segment Mexico ranks third (at 15.13% in 2010), after only Japan (27.56%) and Canada (26.58%). In the autoparts segment Mexico has maintained its leading position in items such as bodies and parts, chassis and drivetrain parts, electrical components, and engines and parts, while China has become the main exporter of tyres and tubes.
short term create scenarios similar to the patterns seen in the yarn-textile-garment chain over the past 10 years (Dussel Peters, 2010b). First, nafta output fell drastically in 2008-2010, while output by Asia and China seems to be unstoppable in the medium run. Second, in addition to the financial and technological crisis of the “big three” in 2008-2010, they have been losing substantial market share in Mexico, as the United States has in total autoparts-automobile chain imports. Thus, the chain has not only contracted in absolute terms in the nafta region, it has also been surpassed by its competitors from Asia and China. Indeed, China has not yet started to export automobiles or, for all practical purposes, autoparts on a significant scale, as domestic consumption has surged by more than 25% over the past five years —a growth rate that cannot continue. The impact of China exporting in the coming years at levels of around 30% of its output, based on production levels in excess of 20 million vehicles, will be substantial worldwide and in the nafta region.
IVsummary and policy alternatives
The analyses set out in this paper suggest that nafta has gone through two distinct phases. In the first phase (1994-2000), the region integrated profoundly as a result of trade, investments, rules of origin and specific segments of industrial chains, such as the autoparts-automobiles and yarn-textile-garments chains. In this first phase, nafta evolved in line with some of the predictions and estimates outlined in the literature review in the second section of this paper: on the whole the region experienced growth in terms of gdp, trade, investment, employment and wages, among other variables, and intra-industry trade also increased substantially. While some of the gaps between the United States and Mexico were closing slowly, this was true for only a small part of Mexico’s highly polarized socioeconomic and territorial structure. Even in segments of Mexican industry that were highly integrated in nafta, the integration process did not lead to a wider process that promoted backward and forward linkages in Mexico. In the second phase (since 2000), nafta has been deteriorating in terms of trade, investment and intra-industry trade, among other
variables, and both Mexico and the United States have been losing ground to third countries such as China.
The first part of our analysis finds that from the point at which China entered the wto in 2001 and up to 2010, China outcompeted Mexico in the United States market and began to compete with the United States in the Mexican market. We found 53 sectors in Mexico where the United States is losing market share and China is gaining, which should allow Mexico to make efficiency gains and become more competitive in United States markets. However, in those 53 sectors (representing 49% of all of Mexico’s exports to the United States) Mexico is losing market share in the United States. We then use two case studies to examine these trends in the Mexican economy in more detail.
The second part of the document highlights changes in competitiveness during these different stages of nafta. The trade analysis clearly shows how Mexico increased its share of total United States imports, ranking second only to Canada in 2001-2004, only to be subsequently displaced by China. And while the United States has historically been

c e p a l r e v i e w 1 1 0 • a u g u s t 2 0 1 3106
nafta’s uninvited guest: China and the disintegration of north ameriCan trade • EnriquE DussEl PEtErs anD KEvin P. GallaGhEr
Mexico’s main trading partner, its share of total Mexican imports fell from more than 75% in the first five years after nafta came into effect to less than 50% since 2009. As shown by different calculations, in both cases China is the main factor behind this disintegration. China’s share of Mexico’s top 20 exports to the United States and the United States exports to Mexico has increased substantially since 2000. The United States’ share of Mexico’s total exports fell from 72% to 41.54% in the period 2000-2009, while China’s share jumped from 1.09% to 17.83%. In all, 96% of United States exports to Mexico, and 81% of Mexican exports to the United States are under “threat” as defined in this paper. Finally, the “triple threat” is examined: sectors in the Mexican market in which the United States is losing market share to China and those in the United States market in which Mexico is losing market share to China.
The two case studies illustrate the clearly defined stages that nafta has gone through since 1994. The yarn-textile-garment chain reflects the profound integration at the firm level and in terms of industrial organization between Mexico and the United States. From a Mexican perspective, the sector has been symbolic for integration with the United States: it is a very dynamic export-oriented, labour-intensive sector that is highly dependent on imports from the United States and that produced a trade surplus (that has surprisingly turned into a trade deficit since 2005) based on massive imports of parts and components and exports of finished and assembled garments. However, the sector shed more than 50% of its jobs during the period 2000-2010 and is in a deep crisis region-wide: nafta incentives have lost their impact, and both Mexico and the United States lost hundreds of thousands of jobs over the decade. The erosion of nafta rules of origin, the signing of other free trade agreements since nafta took effect, and competition with Asia and China took their toll within the nafta region: China’s share of total United States imports expanded from 12% to 42.1% in 2000-2010, while Mexico’s fell from 13.22% to 6.51%. The crisis and loss of competitiveness of key inputs for the yarn-textile-garment chain, particularly in synthetic fibres, has profoundly affected Mexico’s output and exports to the United States, although Mexico does still maintain a substantial share in exports of natural fibres, including cotton and fabric such as denim.
The autoparts-automobile chain differs from the yarn-textile-garment chain in that, to date, competition from China has been quite limited. Even though China became the leading producer of automobiles in 2010 (almost a quarter of vehicles worldwide and more than
twice the figure for the United States), it consumes 100% of its output, in addition to imports. However, as a result of massive investments by the Chinese public sector, new Chinese brands are entering the market, with increasingly sophisticated technologies, and now account for almost 40% of total vehicle production. China will very soon start competing with vehicles produced in Latin America, Mexico and the United States, thus, the sector could be very important in terms of policy responses in the nafta region regarding relations between the treaty members and, specifically, Mexico-United States bilateral relations. Policies in the United States during 2008-2009 reflected its strategic significance. Mexico is at present one of the major suppliers and players in this sector in the United States, while China still lags behind in this respect. Mexico is still the leading supplier of autoparts for nafta and the United States, particularly in segments such as bodies and parts, chassis and drivetrain parts, electrical components and engines and parts, while China is already the main exporter of automotive tyres and tubes and is expected to increase its share in all other segments of the chain.
Several policy recommendations result from this analysis. On the one hand, there are substantial arguments for deepening a regional and nafta policy framework. Since 2000, China has profoundly changed the socioeconomic and territorial integration framework provided by nafta, with enormous effects on production, trade, employment and wages, among other variables. The aggregated analysis in this paper and the two case studies show that Mexico and the United States are deeply integrated in many value added chains. The question is when policymakers will start proposing a short-, medium- and long-term development agenda with explicit reference to Asia and China.
First, nafta nations would do well to identify strategic sectors that are deeply integrated in the region and structure policies to enhance their competitiveness and further integration. nafta has a number of forums and institutions that could be bolstered for such a task, including the North American Development Bank (nadb). Whereas the China Development Bank has played a key role in providing credit for the development and expansion of Chinese export industries, the nadb has played a secondary role, limited to water, sanitation and related projects. The original idea that the nadb would serve regional development and provide adjustment assistance could be revisited (Fishlow, Robinson and Hinojosa-Ojeda, 1991).
Second, direct bilateral negotiations between nafta and China seem inevitable. Although the nafta members

c e p a l r e v i e w 1 1 0 • a u g u s t 2 0 1 3
nafta’s uninvited guest: china and the disintegration of north american trade • enrique dussel peters and Kevin p. gallagher
107
could achieve relevant results in bilateral meetings and rounds with China, some of the issues in the balance are strictly regional and go beyond any bilateral agenda. As we saw in both case studies, regional integrated structures call for regional responses, since concrete policies will otherwise be too general and obsolete.
Third, these regional competitiveness policies have to be designed and implemented with a sense of urgency: as seen in both case studies, structures, industrial organization, trade, investment and employment are shifting rapidly from the region to Asia and China. In only a few years the respective segments of interest might have disappeared completely. From another perspective, starting a nafta-China dialogue might also help to ease tensions in United States-China and Mexico-China relations and allow for a long-term dialogue within the institutional framework of nafta.
Fourth, the yarn-textile-garment chain shows that deepening integration in the nafta region must go beyond tariffs in the future, since they only had an impact until the late 1990s. Future strategies for a regional development agenda must focus on the production of key inputs for the entire chain (such as new materials, equipment and fabrics and other inputs for the synthetic segments), improve distribution channels, transportation, the creation of own brands and the incorporation of new production techniques (for example, improving the modular form of production
for apparel and adopting new full packaging modalities). The successful cases of integration in natural fibres could serve as a basis for policymakers in the nafta institutions in each of the countries in the region.
Fifth, the autoparts-automobile chain has not, so far, experienced massive competition from China given its particularities in China, including the relatively recent explosive production and even higher domestic consumption, in addition to a rapid learning process by Chinese brands. Experience with other chains (such as the electronics and yarn-textile-garment chains) shows, however, that China will start exporting automobiles on a large scale in the short run. The three nafta countries (individually and as a region) should therefore consider how to prepare for this new and strong competition. Regional negotiations with China specifically regarding this chain could anticipate future trade tensions.
All the former policy proposals could include a mixture of trade, industrial, research and development (R&D) and fiscal policies and incentives from a regional perspective, in addition to national policies and the respective negotiations with China. Decisions that are only national in scope (as they have been so far) are clearly insufficient both in terms of competitiveness and in connection with negotiations with China as they do not take into account the existing regional integration under the nafta framework.
Bibliography
amda/amia/ina (Mexican Association of Automotive Distributors/Mexican Automotive Industry Association/National Auotparts Industry) (2009), El sector automotriz en México ante la crisis financiera y económica internacional, Mexico City, March.
Arroyo Picard and others (1993), Tratado de Libre Comercio de América del Norte. Análisis, crítica y propuesta, Mexico City, Mexican Network of Action Against Free Trade.
Baer, Delal M. (1991), “North American free trade”, Foreign Affairs, vol. 70, No. 4, Council on Foreign Affairs.
Bancomext (Banco Nacional de Comercio Exterior) (1999), “Análisis sectorial. Computadoras y componentes” [online] http:\\mexico.businessline.gob.mx/espa/sectorial/notas_tec_electrico/.
Blázquez-Lidoy, Jorge, Javier Rodríguez and Javier Santiso (2006), “Angel or demon? China’s trade impact on Latin American countries”, cepal Review, No. 90 (LC/G.2323-P), Santiago, Chile, December.
BLO (Bureau of Labor Statistics) (2009) [online] http://data.bls.gov/PDQ/outside.jsp?survey=ip.
Burfisher, Mary, Sherman Robinson and Karen Thierfelder (2001), “The impact of nafta on the United States”, Journal of Economic Perspectives, vol. 15, No. 1, Nashville, Tennessee, American Economic Association.
Caballero Urdiales, Emilio (coord.) (1991), El Tratado de Libre Comercio. México, Estados Unidos, Canadá, Mexico City, Faculty of Economics, National Autonomous University of Mexico.
canacintra (National Chamber of Manufacturing Industries) (1994), La nueva política industrial, Mexico City.
Cárdenas Castro, Lorena and Enrique Dussel Peters (2011), “El comercio intraindustrial en México: Un comparativo entre China y Estados Unidos”, Comercio Exterior, vol. 61, No. 4, Mexico City, Banco Nacional de Comercio Exterior (Bancomext).
_____ (2007), “México y China en la cadena hilo-textil-confección en el mercado de Estados Unidos”, Comercio Exterior, vol. 57, No. 7, Mexico City, Banco Nacional de Comercio Exterior (Bancomext).
cbo (Congressional Budget Office) (1993), “A Budgetary and Economic Analysis of the North American Free Trade Agreement”, Washington, D.C. [online] http://www.cbo.gov/publication/20871.
dof (Diario Oficial de la Federación) (2003), “Decreto para el apoyo de la competitividad de la industria automotriz terminal y el impulso al desarrollo del mercado interno de automóviles”, 31 December [online] http://diariooficial.segob.gob.mx/nota_detalle.php?codigo=5121961&fecha=30/11/2009.
Donahue, Thomas R. (1991), “Statement of T.R. Donahue, Secretary-Treasurer, American Federation of Labor and Congress of Industrial Organizations before the Committee on Finance, United States Senate on the Proposed U.S.-Mexico Free Trade Negotiations”, 6 February.
Dussel Peters, Enrique (2010a), Políticas e instrumentos para profundizar la integración regional de la industria del vestido en la zona

c e p a l r e v i e w 1 1 0 • a u g u s t 2 0 1 3108
nafta’s uninvited guest: China and the disintegration of north ameriCan trade • EnriquE DussEl PEtErs anD KEvin P. GallaGhEr
del tlcAN, Mexico City, National Chamber of the Apparel Industry (cniv)/Center for Chinese-Mexican Studies/Faculty of Economics/National Autonomous University of Mexico.
_____ (2010b), “¿Cooperación o competencia en la cadena autopartes-automotriz entre China y México?”, Hacia un diálogo entre México y China. Dos y tres décadas de cambios socioeconómicos, Enrique Dussel Peters and Yolanda Trápaga Delfín (eds.), Mexico City, Senate of the Republic.
_____ (2004), “La competitividad de la industria maquiladora de exportación en Honduras. Condiciones y retos ante el cafta” (LC/MEX/R.853), Mexico City, eclac subregional headquarters in Mexico.
_____ (2000), Polarizing Mexico. The Impact of Liberalization Strategy, Boulder, Colorado, Lynne Rienner Publishers.
Dussel Peters, Enrique and Lorena Cárdenas Castro (2011), “El comercio intraindustrial en México: Un comparativo entre China y Estados Unidos”, Comercio Exterior, vol. 61, No. 4, Mexico City, Banco Nacional de Comercio Exterior (Bancomext).
Dussel Peters, Enrique, Clemente Ruiz Durán and Taeko Taniura (1997), “Changes in industrial organization of the Mexican automobile industry by economic liberalization”, Joint Research Program Series, No. 120, Institute of Developing Economies.
Erzan, Refik and Alexander Yeats (1992), “Free trade agreements with the United States: what’s in it for Latin America?”, Policy Research Working Paper Series, No. 827, Washington, D.C., World Bank.
Feenstra, Robert (2007), “Trade liberalisation and export variety: a comparison of Mexico and China”, World Economy, vol. 30, No. 1, Wiley Blackwell, January.
Fishlow, Albert, Sherman Robinson and Raúl Hinojosa-Ojeda (1991), "Proposal for a North American regional development bank and adjustment fund", Proceedings, Dallas, Federal Reserve Bank of Dallas.
Frederick, Stacey and Gary Gereffi (2009), “Review and analysis of protectionist actions in the textile and apparel industries”, paper prepared for the World Bank and the Centre for Economic and Policy Research.
Gallagher, Kevin P., Juan Carlos Moreno-Brid and Roberto Porzecanski (2008), “The dynamism of Mexican exports: lost in (Chinese) translation?”, World Development, vol. 36, No. 8, Amsterdam, Elsevier.
Grinspun, Ricardo and Maxwell Cameron (1993), The Political Economy of North American Free Trade, New York, St. Martin’s Press.
Hufbauer, Gary and Jeffrey Schott (2005), nafta Revisited: Achievements and Challenges, Washington, D.C., Institute for International Economics.
_____ (1993), nafta: An Assessment, Washington, D.C., Peterson Institute for International Economics.
inegi (National Institute of Statistics and Geography) (2010a), La industria textil y del vestido en 2009, Mexico City.
_____ (2010b), La industria automotriz en México, Mexico City.inforum (Interindustry Economic Research Fund) (1991), “Industrial
Effects of a Free Trade Agreement between Mexico and the USA”, Washington, D.C., Department of Labor.
Kehoe, Timothy (1994), “Assessing the economic impact of North American free trade”, The nafta Debate: Grappling with
Unconventional Trade Issues, M.D. Baer and S. Weintraub (eds.), Boulder, Colorado, Lynne Rienner Publishers.
Kopinak, Kathy (1993), “The maquiladorization of the Mexican economy”, The Political Economy of North American Free Trade, Ricardo Grinspun and Max Cameron (eds.), New York, St. Martins.
Lall, Sanjaya and John Weiss (2005), “China’s competitive threat to Latin America: an analysis for 1990–2002”, Oxford Development Studies, vol. 33, No. 2, Taylor & Francis.
Lande, Stephen L. (1991), “Textiles: U.S. perspective”, U.S.-Mexican Industrial Integration: The Road to Free Trade, Sidney Weintraub, Luis Rubio F. and Alan D. Jones (eds.), Boulder, Colorado, Westview Press.
Lederman, Daniel, Marcelo Olarreaga and Eliana Rubiano (2008), “Trade specialization in Latin America: the impact of China and India”, Review of World Economics, vol. 144, No. 2, Springer.
Monitor de la Manufactura Mexicana (2012), vol. 8, No. 9, Mexico City.Piore, Michael (1991), “Los estándares sociales en México y las
estrategias empresariales de Estados Unidos en un mercado integrado de América del Norte”, México ante el libre comercio con América del Norte, Gustavo Vega Cánovas (coord.), Mexico City, El Colegio de México/Universidad Tecnológica de México.
Piore, Michael and Ch. Sabel (1984), The Second Industrial Divide, New York, Basic Books.
Rodrik, Dani (2010), “The return of industrial policy”, Project Syndicate.SE (Secretariat of Economic Affairs) (2011), Industria automotriz.
Monografía, Mexico City, Dirección General de Industrias Pesadas y de Alta Tecnología.
_____ (2008), Agenda para la competitividad de la industria automotriz en México, Mexico City.
secofi (Secretariat of Commerce and Industrial Development) (1992), “¿Qué es el tlc? Extractos del mensaje del C. Presidente de la República, Carlos Salinas de Gortari, al pueblo de México con motivo de la conclusión de las negociaciones del Tratado de Libre Comercio”, Mexico City, 12 August.
Shelburne, Robert C. (1991), “The North American Free Trade Agrement: comparisons with and lessons from Southern EC enlargement”, Economic Discussion Paper, No. 39, Washington, D.C., Department of Labor.
Sturgeon, Timothy, Johannes Biesebroeck and Gary Gereffi (2008), “Value chains, networks and clusters: reframing the global automotive industry”, Working Paper Series, Cambridge, Industrial Performance Center.
usitc (United States International Trade Commission) (1992), “Economy wide modeling of the economic implications of a fta with Mexico and a nafta with Canada and Mexico”, usitc Publication, No. 2516, Washington, D.C.
_____ (1990), “Review of trade and investment liberalization measures by Mexico and prospects for future United States-Mexico relations”, usitc Publication, vol. 2326, Washington, D.C.
VanGrasstek, Craig and Gustavo Vega (1992), “The North American Free Trade Agreement: a regional model?”, The Premise and the Promise: Free Trade in the Americas, Sylvia Saborio (ed.), Washington, D.C., Overseas Development Council.
Weintraub, Sidney (1991), “Regionalism and the GATT: The North American initiative”, SAIS Review, vol. 11, No. 1, Baltimore, Project muse.


![[SnTF] Alien Maid (The Uninvited Guest)](https://img.dokumen.tips/doc/110x75/55cf8dfd550346703b8d5873/sntf-alien-maid-the-uninvited-guest.jpg)


