Embed Size (px)
DESCRIPTION
NAFTA and the Small Mexican Farmer. Daryll E. Ray Director, Agricultural Policy Analysis Center Melissa B. Cooney, Graduate Research Assistant University of Tennessee. History of NAFTA. GATT – General Agreement on Tariffs and Trade (1946). Direct result of the 1930s and WWII - PowerPoint PPT Presentation
Citation preview
AAPPCCAA
NAFTA and the Small Mexican Farmer
Daryll E. RayDaryll E. Ray
Director, Agricultural Policy Analysis CenterDirector, Agricultural Policy Analysis Center
Melissa B. Cooney, Graduate Research AssistantMelissa B. Cooney, Graduate Research Assistant
University of TennesseeUniversity of Tennessee

AAPPCCAA
History of NAFTA
GATT – General Agreement on Tariffs and Trade (1946)
Direct result of the 1930s and WWII • Conflicts over trade seen as one cause of war• International interdependence seen as inhibiting
war
Restructuring world economy based on comparative advantage and free trade • Tariffs detrimental to all parties• Tariffs should be eliminated

AAPPCCAA
History of NAFTA 1970s and 1980s
• Economic problems in the U.S.• Stagflation
1980s to early 1990s • U.S. needed new markets to grow economy• Fall of Soviet Union• Mexico’s debt crisis and stagnant economy• Mexico joins GATT in 1986
January 1, 1994 • U.S.-Canada agreement expanded to include
Mexico - NAFTA

AAPPCCAA
NAFTA’s Provisions for Free Trade
Objectives
• Eliminate barriers to trade
• Promote fair competition
• Increase investment opportunities
• Protect intellectual property rights
• Establish a framework for future agreements

AAPPCCAA
The Argument for NAFTA
Economic theory
Adjustment periods
Comparative advantages of U.S. & Mexico
• U.S. in grain production, animals and animal products, and oilseeds
• Mexico in vegetables, fruits, fresh flowers, and beverages

AAPPCCAA
The Argument against NAFTA
Mexico’s “comparative advantage” is only for very specialized products that are capital intensive, few producers, and have higher risk and costs
Not self-sufficient Large, efficient agribusinesses with access
to technological advances benefit from NAFTA
Economic models do not account for social welfare
AAPPCCAA
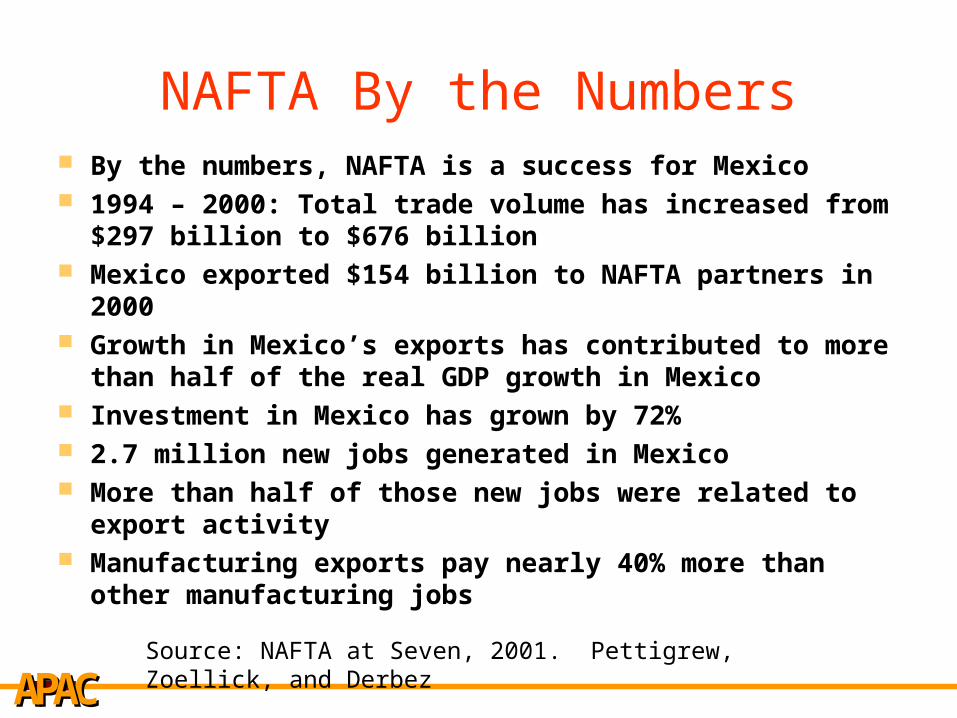
NAFTA By the Numbers By the numbers, NAFTA is a success for Mexico 1994 – 2000: Total trade volume has increased from $297
billion to $676 billion Mexico exported $154 billion to NAFTA partners in 2000 Growth in Mexico’s exports has contributed to more than
half of the real GDP growth in Mexico Investment in Mexico has grown by 72% 2.7 million new jobs generated in Mexico More than half of those new jobs were related to export
activity Manufacturing exports pay nearly 40% more than other
manufacturing jobs
Source: NAFTA at Seven, 2001. Pettigrew, Zoellick, and Derbez

AAPPCCAA
A Growing Dependency
Source: Office of Trade and Analysis, US Department of Commerce
US-Mexico Agricultural trade
0
1
2
3
4
5
6
7
8
1995 1996 1997 1998 1999 2000 2001
Valu
e (in
bill
ions
of U
SD)
US Ag Exports
US Ag imports

AAPPCCAA
A Growing Dependency
Source: Office of Trade and Analysis, US Department of Commerce
US - Mexico Agricultural Balance of Trade
-0.50
0.00
0.50
1.00
1.50
2.00
2.50
1995 1996 1997 1998 1999 2000 2001
Val
ue
in B
illi
on
s o
f U
SD

AAPPCCAA
NAFTA and Agricultural Trade
Agricultural exports from Mexico to US totaled ~ $4.7 billion in 1998, up from a stagnant $2.5 billion prior to NAFTA.
Mexican agricultural exports have grown about 11.5% per year.
Vegetables ~ 13% annual increase
Fruits ~ 17% annual increase
Beverages~ 28% annual increaseSource: US-Mexico Chamber of Commerce, 1999

AAPPCCAA
Agriculture under NAFTA Immediately eliminated most non-tariff
barriers and many tariffs Phasing out all tariffs and Tariff Rate Quotas
(TRQs) over 10-15 years
i.e. Between US and Mexico:
Wheat 2004
Sugar 2007
Corn 2008

AAPPCCAA
Take Corn: What NAFTA was Supposed to do?
Reduce domestic price of corn
Output will decrease
Labor, land and capital are reallocated
Marginal lands left fallow

AAPPCCAA
The Importance of Corn in Mexico
Originated in Mexico over 7000 years ago Pre-NAFTA:
Over 3 million producers =
8% of population
40% of people in agriculture
60% of cultivated land
Nearly 60% of output by value
Source: The Environmental and Social Impacts of Economic Liberalization on Corn Production in Mexico.Alejandro Nadal, 2000.
AAPPCCAA
Corn Diversity
41 landraces, thousands of varieties
Poor producers with low yields could
compete in the Mexican domestic market.
1.8 million corn producers use locally
adapted varieties (80 % of the corn
cultivation)

AAPPCCAA
Failure to impose the TRQ
2-level pricing: Low tariff up to a certain quota, high tariff after passing the quota
15-year transition period shortened to three years because Mexican government never implemented the TRQ

AAPPCCAA
Mexico imports of US corn
Imports increased
14-fold
Corn production and Imports from US
0
3
5
8
10
13
15
18
20
1992
1993
1994
1995
1996
1997
1998
1999
2000
Mill
ions
of m
etric
tons
Domesticproduction
Importsfrom US
Source: APAC, Centro de Estadistica Agropecuaria

AAPPCCAA
Area under corn cultivation
Source: Centro de Estadística Agropecuaria Sistema de Información Agropecuaria de Consulta
Planted area of Corn in Mexico
0123456789
10
1980
1981
1982
1983
1984
1985
1986
1987
1988
1989
1990
1991
1992
1993
1994
1995
1996
1997
1998
1999
2000
Hec
tare
s, in
Mill
ions
AAPPCCAA
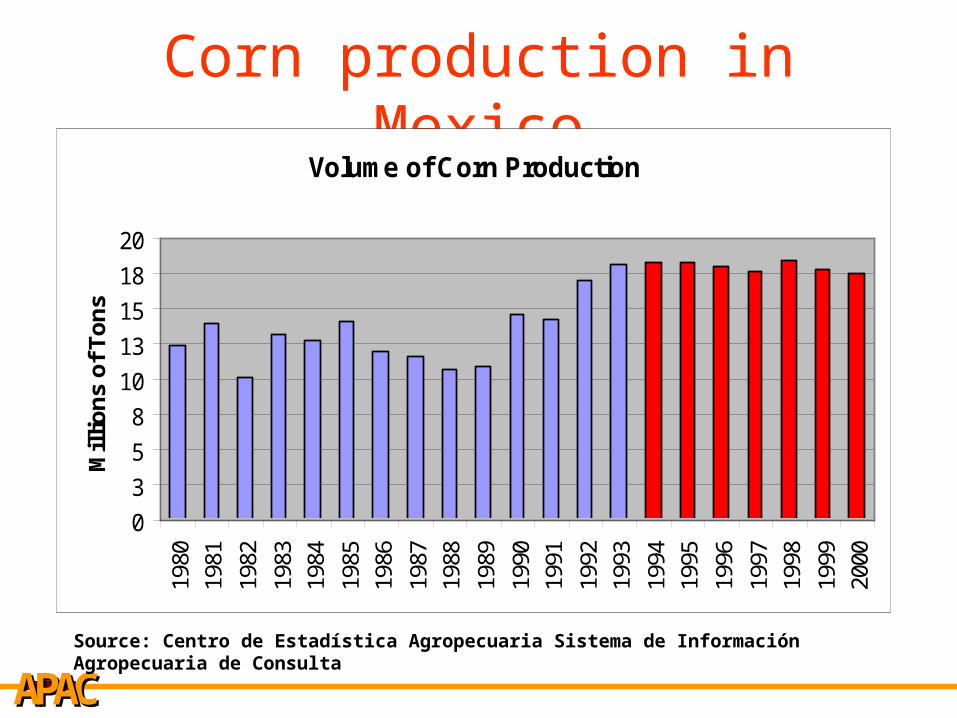
Corn production in Mexico
Source: Centro de Estadística Agropecuaria Sistema de Información Agropecuaria de Consulta
Volume of Corn Production
0
3
5
8
10
13
15
18
20
1980
1981
1982
1983
1984
1985
1986
1987
1988
1989
1990
1991
1992
1993
1994
1995
1996
1997
1998
1999
2000
Mil
lio
ns
of
To
ns

AAPPCCAA
What has happened
Corn production has remained fairly stable but area under cultivation has increased.
Went from 60% of cultivated land yielding 60% of Agricultural output value to 67% yielding 36% of value of output.
Environmental damage by both large and small farmers.

AAPPCCAA
What has happened Tortilla prices increased
Elimination of guaranteed price floor subsidy
Urban migration
Further Dependency
Source: Down on the Farm: NAFTA’s Seven-Year’s War on Farmers and Ranchers in the US, Canada and Mexico. Public Citizen 2001

AAPPCCAA
Conclusions NAFTA has obviously benefited
Mexico’s overall economy
GDP levels from $314.5 billion in 1991 to $617.8 billion
Small farmers lose out big time
GDP is not only measure of well-being
– Access to food & adequate housing
– Health services and education, etc.

AAPPCCAA
To receive an electronic version of our weekly ag policy column send an email to: [email protected] to be added to APAC’s Policy Pennings listserv
Weekly Policy ColumnWeekly Policy Column

AAPPCCAA
For More Information …For More Information … www.agpolicy.orgwww.agpolicy.org
AAPPAAPPCCAACCAA
Agricultural Policy Analysis CenterThe University of TennesseeDept. of Agricultural Economics310 Morgan HallKnoxville, TN 37996-4519
[email protected](865) 974-7407 phone(865) 974-7298 fax

AAPPCCAA
Maquiladoras in Mexico
Source: Maquila online directory

AAPPCCAA
Maquiladora map
As of Jan. 2001
> 601 (1280)
251 – 600
101 - 250
76 – 100
26 – 75
1 – 25
0
Source: Instituto Nacional de Estadistica, Geografia, e Informacion

AAPPCCAA
Maquiladora working conditions
Discrimination against women Poor working conditions Low wages No union representation Slum communities

AAPPCCAA
The Link between Corn Producers and Maquiladoras
Pre-NAFTA: ~3 million corn producers
2002 ~ 2 million corn producers
Pre-NAFTA (1990): 449,519 maquila workers
(1995): 629,481
(2000): 1,277,727 Source: Border Maquiladoras, an Overview. Frontera Norte Sur, Sept 2000
As of Feb 2003: 1,047,587Source: Maquila Online Directory