Embed Size (px)
Citation preview

J. theor. Biol. (1992) 154, 455-473
Network Analysis of Intermediary Metabolism using Linear Optimization.
II. Interpretation of Hybridoma Cell Metabolism
JOANNE M. SAVINELL't AND BERNHARD O. PALSSON~
Department of Chemical Engineering, The University of Michigan, Ann Arbor, MI 48109-2136, U.S.A.
(Received on 12 November 1990, Accepted on 13 September 1991)
The reaction network of intermediary metabolism in the mammalian cell has been studied using linear optimization. Experimental measurements of metabolite fluxes entering and leaving hybridoma cell line 167.4G5.3 have been used to interpret the interactions of nutrients and the demand for intermediates for growth. We have ascertained the effects of waste production and energy loads on the cell growth rate using linear optimization. This analysis has shown that neither the maintenance demand for ATP nor the antibody production rate limit growth rate at normal experimental conditions. In addition, the cell uses its nutrients for growth with only 57-78% efficiency, due to the large secretion of alanine. The sensitivity of the growth rate with respect to the demand for cofactors and the supply of nutrients is given by the shadow price for each constraint. The shadow prices have shown that amino acids are the limiting nutrients at experimental conditions, The sensitivities of the growth rate to flux through reactions, given by the reduced costs, have shown that flux through the reaction glutamate dehyrogenase may actually slow down cell growth. We have also found that intermediates with lower shadow prices, and thus with lower value to the cell, are the precursors to compounds secreted from the cell. The shadow prices are also a means for comparing the costs of synthesizing various intermediates in terms of the two major nutrients, glucose and glutamine. At anaero- bic conditions, glucose and glutamine have similar values to the cell, and the cost to synthesize most intermediates in terms of glucose is identical to the cost in terms of glutamine. At aerobic conditions, glucose is nearly twice as valuable to the cell as glutamine,
Introduction The uses of linear optimization theory to calculate and interpret fluxes in metabolic networks have been discussed previously (Savinell & Palsson, 1991). A general sto- ichiometric matrix describing the intermediary metabolism in the mammalian cell was developed and used to gain insight into metabolic physiology. This stoichiometric matrix was used to provide information about the interactions between nutrients, the comparative value of these nutrients in terms of meeting the cell's requirements
t Present address: Department of Chemical Engineering, Cleveland State University, Cleveland, OH 4115, U.S.A. J; Author to whom correspondence should be addressed.
455 0022-5193/92/040455 + 19 $03.00/0 ~) 1992 Academic Press Limited

456 J . M . S A V I N E L L A N D B. O . P A L S S O N
for growth, and the sensitivity of growth to various metabolic loads. Two parameters that result from linear optimization, shadow prices and reduced costs, were inter- preted as the sensitivity of the objective function to either relaxing a constraint or altering a flux, respectively. The goal was to obtain a general understanding of the role that metabolic stoichiometry plays in limiting cellular activities. We will now use these same techniques to analyze the metabolic behavior of a hybridoma cell line under experimentally determined conditions.
A large amount of information about the uptake and production rates of hybrid- oma cell line 167.4G5.3 has been obtained under a variety of well-controlled experi- mental conditions (Ozturk & Palsson, 1990; Ozturk & Palsson, 1991a, b). This information was gathered in order to understand better how the environment affects the cell's metabolism and product secretion. A systematic analysis of this data, which gives an understanding of the interactions between the various pathways in the cell, is not a simple task and we will employ the techniques involving linear optimization, developed previously (Savinell & Palsson, 1991), to provide such interpretation.
Linear optimization, in its most basic application, is an accounting tool which allows one to calculate the extent to which the secretion of waste products, increase in metabolic loads, such as ATP and antibody production, and uptake of the nutri- ents glucose and glutamine, diminish or improve cell growth. Linear optimization applied to the hybridoma cell stoichiometric matrix was used to examine the capabili- ties of the t67.4G5.3 hybridoma cell line in terms of these factors. The limiting nutrients for the cell and the intermediates which are most costly to synthesize were identified for conditions of varying metabolic loads and varying supply rates of nutrients, by means of the shadow prices. The reactions that cause the cell to be inefficient in terms of cell growth were identified by means of the reduced costs.
Methods
l=or all the simulations presented in this paper, the stoichiometric matrix was modified from that shown in (Savinell & Palsson, 1991), as described here. The glutamate dehydrogenase reaction in the direction of glutamate synthesis was removed. This reaction allows the cell to incorporate free ammonium ions into cell material. Since it has been shown that most cultured cells will not use free ammonia as a nitrogen source (Levintow et al., t957; Salzman et al., 1957; Meister, 1962), it is unlikely that this reaction is operational in the hybridoma cell. The uptake rates of the essential amino acids were not set to the measured values, since in general, these essential amino acids are consumed in amounts just sufficient for protein synthesis, so that their catabolic fluxes are negligible. Consequently, the catabolic pathways of the essential amino acids were removed from the network, in order to prevent an unbounded solution.
The data set analyzed here (Ozturk & Palsson, 1991b) was obtained for the murine hybridoma cell lille 167.4G5.3, growing in a pH- and dissolved oxygen concentration (DO)-controlled batch bioreactor. Tile measurements made included the uptake and secretion fluxes of the key metabolites (glucose, lactate, oxygen, ammonia, and all amino acids except proline, cysteine, and tryptophan), the antibody production rate,

N E T W O R K A N A L Y S I S O F M E T A B O L I S M . II 457
and growth rate. The fluxes were calculated from the changes in media concentrations of the compounds and the viable cell concentration. These measurements were made over 2-3 days, during steady exponential growth. The specific (per cell) uptake rate of each compound was nearly constant during this time period, so that it could be assumed that the cells were in the state of balanced growth and that the metabolic network was in a quasi-steady state.
Two systems were examined in this work--one called thefi'ee output system, and the other the constrained output system. Both of these systems are composed of the same stoichiometric matrix described above, but differ in the number of constraints imposed. In the free output system, the fluxes of glucose, glutamine, and oxygen uptake were set equal to the experimental values measured at 20% DO, listed in Table I, by means of additional equations (or constraints) appended to the stoichi- ometric matrix. The measured uptake rates of aspartate and asparagine were also placed as constraints, since they are the only non-essential amino acids consumed by the cell. The constrained output system includes the production rates of lactate,
TABLE I Fluxes measured at 20% DO in a batch reactor, fi'om ( Ozturk & Palsson, 1991b). A (+) signifies that the numerical value of the flux was placed as a constraint in the
simulation Value
Flux (nmol/106 cells hr ~) Free Constrained
Uptake rates Glucose 224 Oxygen 90 Aspar ta te 0-75 Glu tamine 47.4
Production rates Lactate 377 Alanine 33"8 Glu tamate 3.42 Serine 2.46 Glycine 0.94
+ + + + + + + +
gluamate, alanine, and serine in addition to the constraints in the free output system. The free output system results represent what the cell is able to achieve, given a
certain amount of nutrients and. neglecting limitations on growth rate imposed by DNA replication and other events. On the other hand, the constrained output results represent what the cell is able to achieve, given the same amount of nutrients, if the cell is forced to secrete a significant amount of the available carbon and nitrogen as waste products. For example, the kinetic properties of the cellular metabolism, such as the relative sensitivities of certain branch point enzymes and the design of the control loops, may be such that the cell must secrete the large amount of lactate and alanine that is observed. Thus, the constrained output system represents what the celt is capable of achieving, given these kinetic considerations.

458 J. M . S A V I N E L L A N D B. O. P A L S S O N
The objective function of maximizing growth rate was used in most of the calcula- tions presented here. For a unicellular organism, the ability to maximize growth rate may be a necessary trait for survival in specific circumstances, such as in a bioreactor. On the other hand, the mammalian cell, since it is part of a large organism, must perform specific duties, and hence may grow only slowly. A tumor cell, unlike its normal counterpart, has lost its growth regulation, and thus tends to grow uncontrol- lably. When tumor cells are cultivated for their ability to secrete a desired product, it is often desirable that the cells grow as fast as possible. Their in vitro growth rate has been found to be sensitive to a number of environmental factors, e.g. concentration of serum, oxygen, glucose, glutamine, and type of sugar source, and from years of research, different media have been formulated which provide a mix of these nutrients that are optimal for growth. Presumably, then, there exists combinations of fluxes into the cell that are optimal for growth. Increases in some of these fluxes may have no effect on cell growth, either because the excess cannot be used by the cell since the cell may still be limited by another component, or because the cell simply cannot grow any faster due to limitations outside of energy and mass metabolism considera- tions, such as limitations to the rate of DNA replication. Calculations using the objective function of maximizing growth rate result in the determination of the fluxes which optimize growth rate, and also give information about which fluxes it would be desirable to increase. However, all calculated results must be interpreted cau- tiously, since even though an increase in a particular flux is predicted to improve growth rate, if the growth rate is already so fast as to be limited by the DNA replication rate, then an increase in the predicted flux would be futile. Similarly, an increase in a flux may not be physically achievable, due to limitations in transport or enzyme concentration.
The original stoichiometric matrix (Savinell & Palsson, 1991) had 20 degrees of freedom. The number of degrees of freedom is reduced by one for each flux that is set exactly equal to its measured value. To account for experimental error, each flux that was measured was set equal to a range, specified by the mean value ± 10%, rather than to an exact value. Mathematically, the stoichiometric matrix was modified by adding two inequalities, specifying the upper and lower bounds, for each measured flux. The addition of inequalities moved the boundaries of the solution space so that the size of the solution space was considerably smaller than that of the original matrix, but an infinite number of flux patterns is still possible.
Results and Discussion
(A) E N E R G Y D E M A N D
The concept of "mainlenance energy" was originally developed because of the observation that total energy production of the bacterial cell, when extrapolated to zero growth rate, did not drop to zero (Pirt, 1965). The energy produced during zero growth rate was assumed to be used for maintenance duties, such as transport, maintenance of membrane potentials, and turnover of structural components. The

N E T W O R K A N A L Y S I S O F M E T A B O L I S M . II 459
exact partition of this energy among these demands is unknown. We will first deter- mine the extent to which these maintenance duties affect hybridoma cell growth given limited rates of nutrient uptake.
The calculated maximum growth rate as a function of maintenance energy demand is shown in Fig. 1 (a), for both the free and constrained output systems. The maximum growth rate for the free output system was independent of ATP demand until the demand was increased to 250 nmol/106 cells hr -~, and this cut-off value doubled when the uptake rate of oxygen was raised by 50%. Maintenance energy coefficients have been reported to be 400-600 nmol/106celis hr -t for mammalian cells (Fleis- chaker, 1986; Miller et al., 1986; Kilburn et al., 1969). From the data of (Ozturk & Palsson, 1991b), the estimated maintenance energy for hybridoma cell line 167.4G5.3 is 500 nmol/106 cells hr -t. The calculated growth rate for the constrained output system was similar to the experimental growth rate, up to the ATP demand of 650 nmol/106 cells hr-~, before growth was affected by the use of metabolic energy for maintenance. These results indicate that a lower maintenance energy term would not result in a higher growth rate for the cell.
This relationship between maintenance energy and growth rate suggests an interest- ing reinterpretation of the role of maintenance energy. The cell appears to produce ATP in amounts similar to that needed for maintenance, as a byproduct of optimal biosynthesis rates and excess nutrient uptake, and with no drain on ability to grow. In other words, the metabolic fluxes may have been adjusted so that the cell is able to satisfy its biosynthetic demands in an optimal fashion while providing a certain amount of metabolic energy that can be used for maintenance purposes without altering the growth pattern.
Figure l(b) shows shadow prices for the constrained output system. At ATP maintenance demand less than 650 nmol/106 cells hr-~, only amino acids had non- zero shadow prices (the shadow price for only glutamine is shown), indicating that the cell was limited for nitrogen under these conditions. Above an ATP maintenance demand of 650 nmol/106 cells hr-~, glutamine was limiting to a much smaller extent. Growth became more sensitive to oxygen, G6P, and ATP availability at this point. As shown from Fig. 1 (a), it is at this point that the ATP maintenance demand begins to limit growth, and the most valuable nutrients are those that provide ATP rather than those that provide mass for biosynthesis. G6P was preferred over glutamine as an ATP source due to oxygen limitation.
Figure l(c) shows the yield of lactate from glucose (YLAC/CLC), and NH~" and alanine from glutamine (YNH2/GLN and YALA/GLN, respectively) obtained from the free value of 1-7 mole/mole. A large fraction of glucose was secreted as lactate due to the excess of glucose uptake, relative to oxygen and glutamine. The calculated Yr~.~' ,'GLN increased with ATP maintenance demand, from 0.6-1.2 mole/mole, com- pared to the experimental value of 0.6 mole/mole. Alanine secretion occured only at ATP demand greater than 600 nmol/106 cells hr-i , at which point the demand for ATP was much greater than the demand for carbon or nitrogen.
The results shown in Fig. 1 (a) and (b) suggest that the maintenance energy require- ment does not necessarily diminish the growth rate, since approximately 50% of the average maintenance requirement was produced simply as a byproduct of optimal

460 ] . M , S A V I N E L L A N D B. O . P A L S S O N
o
o
"G
E
z
3
( o )
I
I I I I " ,
Q.
0-1
0-01
0'0001
( b )
I I I
E
2 ( c )
J J
j / J J . . . . . . J
I I o 200 400
/ ~ _ j /
. ~ f / I 600 8OO I000
ATP demond (nmol/lO 6 cells hr -I)
FIG. I. (a) Effect o f ATP demand on maximum growth rate: ( - - - ) , free output system; ( - - - - ) , free output system with 50% higher qo, ; ( - - -) , constrained output system. The growth rate is normalized to the growth rate measured at 20% DO (0.039 hr ~, or doubl ing time of 17.8 hr). (b) Effect of ATP demand on shadow prices for the constrained output system: ( - - - ) , glutamine; ( . . . . ), G6P and ATP; ( - - - - - ) , oxygen. (c) Effect of ATP demand on metabolic yields, for the free output system: ( ), qLAC,GI t:; ( . . . . ), qNIt,' GIN; (~ ---), qAI.A'GI.N.

N E T W O R K A N A L Y S I S O F M E T A B O L I S M . I I 461
glucose and glutamine catabolism. In the constrained output system, the rate of ATP demand that caused the growth rate to decrease was more than twice as great as the ATP demand in the free output system, because the large secretion of alanine caused the growth to be slower. If we assume the large secretion of alanine is due to reasons external to stoichiometry, e.g. enzyme kinetics, then the constrained output system, which sets the alanine production rate to the measured value, provides a more realistic interpretation of the effect of ATP demand on growth. Hence, Fig. l(a) indicates that the maintenance demand does not limit growth rate at experimental conditions. ATP that is not needed for maintenance may then be dissipated by non-specific ATPases. These results also indicate that at a maintenance demand of 500 nmol/ 106 cells hr-~, the cell growth is limited by glutamine availability.
(B) EFFECT OF GLUTAMINE UPTAKE
It iS a well-known fact that glutamine is necessary for hybridoma cell growth in vitro. The uptake rate of glutamine may be limited by the glutamine concentration in the media, the transport across the membrane, or the capacity of one of the enzymes involved in glutamine metabolism. However, if this uptake rate could be increased through a stimulation of the rate limiting step, it would be useful to know if the growth rate would increase accordingly. In our next set of simulations, we will examine the effect of glutamine uptake rate on growth rate. We will also identify the nutrients or intermediates that are necessary for efficient growth on glutamine.
For these calculations, the system was identical to the free output system described in the previous section, except that the maintenance energy demand was set to 500 nmol/106 cells hr-~, and the glutamine uptake was varied. The maximum growth rate under these conditions, called the "control", is shown in Fig. 2(a). Increases in the growth rate diminished sharply when qGLN was greater than 67% of the observed rate. This result would suggest that at the experimentally determined rates of gluta- mine uptake, glutamine is not limiting for growth. This result is confirmed by Fig. 2(b), in which the shadow price for glutamine is very low at the experimental value of qGLN equal to 53 nmol/106 cells hr- ~. The point of glutamine uptake at which the maximum growth rate was reached was influenced by oxygen, as shown in Fig. 2(a), indicating that oxygen was limiting for growth at high glutamine uptake rates. This same point is illustrated in Fig. 2(b), where the sensitivity to oxygen only became non-zero at qGLN greater than 35 nmol/106 cells hr-~. From Fig. 2(b), we also see that ATP and G6P became limiting, due to the demand for ATP. If either the oxygen uptake rate is raised by 50%, or the ATP demand is lowered by 50%, then we would expect that growth would be sensitive to glutamine even at the observed rate of glutamine uptake.
The yields YLAC/GLC, YNH~ /GLN, and YALA/GLN obtained from the control system are shown in Fig. 2(c). The yield YALA/GLN was much lower than the measured yield, since the calculated growth rate was generally higher than the observed rate. The effect of the secretion of alanine and lactate on the growth rate will be examined more closely in the following two sections.

462 J. M . S A V I N E L L A N D B. O . P A L S S O N
0
J=
0 E 0 Z
(0)
- / /
/
I I I
u "E t~ 3
(11
0.1
0"0I
O" 001
( b )
I
° ° ° °
° l o , o o o ° 0 ~ Q ~ * * * ° . o ° ° ° ° ° , 0 o , °°
\
0 E
0 E
2 (c)
I / /
I I 0 0 " 5 I 2
/ /
I / / r I
1.5
Normal ized GLN uptake rate
FIG, 2, (a) Effect o f glutamine uptake rate on max imum growth rate, for the free output system: ( ), control; ( - - - - ) , 5(Y¼, higher qo: ; ( - - - ) , 50% lower maintenance demand. The growth rate and glutamine uptake rate are normalized to those measured at 20% D O (0.039 hr ~ or doubling time o f 17-8 hr, and qoI.N = 53 nmol /10 ~ cells hr-~) . Effect o f gtutamine uptake rate for the control system on (b) shadow prices: ( ), glutamine; ( - - • - - ) , oxygen; ( - - - - ) , G6P; ( . . . . . . ), OOA, ( - - - ) , ATP; and (c) metabolic yields: ( ). qLAC, G[.C ; ( - - - - ) , qN.2 GLN ; ( - - -) , qALA,'GLN.

N E T W O R K A N A L Y S I S O F M E T A B O L I S M . I I 463
From both Fig. 2(a) and (b), we can conclude that under the given glucose and oxygen uptake rates, the growth rate is sensitive to glutamine uptake rate only when qcLN is less than 35 nmol/106 cells hr-2. However the predicted growth rate is more than 50% greater than the maximum feasible growth rate and the predicted alanine production rate is much lower than the observed rate. Consequently, the result that glutamine is not growth limiting at observed rates of glutamine uptake is only true when alanine secretion does not occur.
(C) E F F E C T O F G L U C O S E U P T A K E
Glucose is generally the primary nutrient for the cell, and can satisfy both energy and carbon mass needs. The effects of glucose uptake on the maximum growth rate, for the same set of conditions described above for glutamine, are shown in Fig. 3(a). The influence of glucose on growth rate differed from that of glutamine, since the growth rate was sensitive to qGLC throughout the range of qGLC tested. The shadow prices shown in Fig. 3(b) show the same results as shown previously at physiological conditions, but this time, shadow prices were constant under the range of glucose uptake studied here. The yields YLAC/GLC, YNH~/GLN. and YALA/GLN [Fig. 3(c)] were essentially insensitive to the uptake rate of glucose, while YALA/GLN increased at lower qCLC due to the lower growth rate.
From both Fig. 3(a) and (b), we can conclude that under the given glutamine and oxygen uptake rates, the growth rate is sensitive to the glucose uptake rate up to rates greater than the experimentally measured glucose uptake rate. However, this interpretation is subject to the same considerations discussed in the previous section. Although the predicted YLAC/CLC yield is similar to the observed value, the calculated growth rate is higher than the physically achievable rate, and the yield YALA/GLN is much lower than the expected value. Consequently, the result that glucose is growth limiting is only true at conditions of low alanine production and higher than normal growth rates. If either the oxygen uptake rate is raised by 50%, or the ATP demand is lowered by 50%, the calculated glucose uptake rate optimal for growth is approxi- mately equal to the experimentally measured glucose uptake rate.
(D) EFFECT OF ANTIBODY PRODUCTION
The amount of resources used by the cell for antibody synthesis is an important consideration for the large-scale production of monoclonal antibodies. For recombi- nant micro-organisms, the instability of the recombinant protein production has been attributed to the metabolic load that the excess plasmid replication and protein synthesis places on the cell (Imanaka & Aiba, 1981). Similarly, the observed instability of antibody production in certain cell lines may occur because the random loss of antibody production confers a growth advantage over the producing cell due to the decreased metabolic load. A relatively simple analysis reveals that very small changes in the growth rate have a major influence on the number of non-producing cells (Lee et aL, 1991).

464 J . M S A V I N E L L A N D B, O. P A L S S O N
o
E z
(0
I 1
t~
o .
o •
t o
O - i
0"01
0"001
( b )
° ° . . . . . o ° ° ° ° . ° ° ° . . o , ° . ~ , , , ~ ° . ° ° ° ° . . ° . . . ° ° . ° °
1 I
2
f
o E
( c )
0 1.5 0"5 t Normalized glucose uptake rote
FIG. 3.(a) Effect of glucose uptake rate on max imum growth rate, for the free ou tpu t system: ( - - - - ) , control : ( - ---), 50'¼, higher qo,; ( - - - ) . 50% lower maintenance demand. The growth rate and glucose uptake rate are normalized to those measured at 20"A, D O (0.039 hr ~, or doubl ing time o f 17-8 hr. and c/c~ c = 224 n m o l / l 0 ~' cells hr ~ ). Effect of glucose uptake rate for the control system on (b) sh adow prices: I - - - - ) , oxygen; ( - - ), G6P; ( . . . . . . ), O O A , ( .......... ), g lutamine: ( . . . . ), ATP; and (c) metabolic yields: ( ), ql.,,,{ G1.c : ( - - ), qNIfg '~;t N ; ( - - -)- q.Xt.A,(';I.N.

N E T W O R K A N A L Y S I S O F M E T A B O L I S M . 1I 465
The effect of antibody production on the cell growth rate will now be examined. Calculations were done with the free output system, in which only the fluxes of glucose, gluamine, aspartate, and oxygen were placed as constraints. The calculations were set up with the same conditions as in the previous sections. The maximum growth rate as a function of antibody production rate (qAb) is shown in Fig. 4(a). Under the control conditions, the growth rate increased by only 2% when qAb decreased from the rate of 0.2 pg cell-, hr- ' (which is the measured production rate for this cell line, Ozturk & Palsson, in 1991b) to 0"0, and a ten-fold increase in antibody production caused the growth rate to decrease by 14%. It has been estimated from actual data that non-producing hybridoma cells grow 7% faster than cells producing antibody (Lee et al., 1991), and this growth rate differential is great enough to cause the non-producing population to overtake the producing population. Consequently, a growth differential of only 2% may also be significant in terms of population dynamics. However, the calculated growth rates shown in Fig. 4(a) are
0
Z
3 t ( ° ) _ - - - . - - .____
2
!
0 IIII I I I i I l l l I I
0"1
0-01 o o
( b )
i ! O O ° ° O O ° ° . O . . ~ . . Q . . . . O O O ° O ° ° , , ° , O ° O , O , , ° ° O ° O O H . , m . . .
0.001 i ~ i P I i , , , i t J , , I t J i o 0.5 I 1-5 2
Ab production rote (pg cell -I hr -# )
FIG. 4.(a) Effect o f an t ibody product ion on m a x i m u m growth rate, for the free o u t p u t s y s t e m : ( - - ) , control ; ( - - - - ) , 50% higher qo. ; ( - - - ) , 50% lower main tenance demand ; constra ined ou tpu t system: ( - - . - - ) ; the growth rate is normalized to the growth rate measured at 20% D O (0.039 hr- ~, or doubl ing time of 17.8 hr). (b) Effect of ant ibody product ion on shadow prices for the control system: ( - - " - - ) , oxygen; ( - - ) , G6P; ( . . . . . ), O O A ; ( - - - - ) , g lutamine; ( - - - ) , ATP.

466 J . M . S A V I N E L L A N D B. O . P A L S S O N
40-60% greater than the observed growth rate, since the free output system does not require the secretion of lactate and alanine. Even with a ten-fold increase in antibody production, the calculated maximum growth rate is at least 36% higher than what is considered to be genetically feasible for the cell. Therefore, the improved growth rate that appears to correspond with loss of antibody productivity is most likely not due to the reduced metabolic load.
On the other hand, if we assume that the secretion rates of alanine and lactate are fixed by the kinetic properties of the enzymes, then our interpretation of the effect of antibody production on growth rate will be different. The effect of antibody production rate on maximum growth rate is also shown in Fig. 4(a) for the con- strained output system, in which the fluxes of lactate and alanine are fixed, along with the fluxes of glucose, glutamine, aspartate, and oxygen. From this figure, we conclude that a complete loss of antibody productivity from an original rate of 0-2 pg cell-~ hr - ~ may allow the growth rate to increase by 3% (similar to the free output system), and this faster growth rate is still within the feasible range for hybridoma cell growth rate.
In summary, the consumption of nutrients by the cell is normally great enough so that the predicted growth rate at even very high rates of antibody production is still much greater than that physically achievable in the cell. However, if the kinetics of key enzymes are such that the ratios of qALA/qGLN and qLAC/qGLC are fixed and are independent of antibody production, then the loss of antibody production may allow a realistic, albeit small, increase in growth rate. In practice, these ratios are flexible, and have been found to be influenced by factors such as DO and pH (Ozturk & Palsson, 1991b). Although the influence of antibody productivity on these ratios is unknown, and most likely difficult to measure, we believe that there is sufficient flexibility in these ratios, so that a change in antibody production would not neces- sarily need to affect the growth rate.
The sensitivity of growth to the intermediates does not change with antibody production rate, as shown in Fig. 4(b).
(E) E F F E C T O F D I S S O L V E D O X Y G E N
When cells are grown in culture, they are placed in an environment from which they must obtain enough nutrients to meet their carbon, nitrogen, and energy require- ments for growth. Most likely, the mixture of nutrients in the media will not exactly balance the cells' requirements, and the lack of a particular nutrient may limit the growth rate. The cell also secretes a large amount of its potential mass and energy in the form of lactate and alanine, for reasons that are unclear, causing the cell to be inefficient with respect to the utilization of its metabolic resources.Linear optimiza- tion allows us to quantify this efficiency, as well as to identify the intermediates and nutrients that are limiting the growth.
The free output and constrained output systems were constructed in the same manner as described in the previous sections, except that the measurements were obtained from hybridoma cells grown at DO concentrations ranging from 1-100% (Ozturk & Palsson, 1991b).

N E T W O R K A N A L Y S I S O F M E T A B O L I S M . II 467
g o .l= 3~
o,
E
( 0 )
0
I I ! I I I I I
0.01E ( c )
k E ~ 0"01211
0.000! ~ J , l | l l l !
_o o
_e
0-6 ( b )
0-4
f 0'2 ~ r ' ~ - ---...
0.0 a J 0
0-1
0"01
0"001
•!~
i I I I I I 0.0001 t i J L a I a t r I 50 I00 0 ,50 I00
% DO
FIG. 5. (a) Effect of DO on maximum growth rate: ( ), free output system; ( - - - - ) , constrained output system: (O), experimental measurements. The growth rate is normalized to the growth rate measured at 20% DO (0"039 hr ', or doubling time of 17-8 hr). (b) The yield Y^'rP/c for the free output ( ), and consrained output ( - - - - ) . Yield Yc/c for the free output (- - - ) and constrained output (-- --). Reduced costs in the (c) free output system: ( ), malic enzyme; ( - - - - ) , PEPCK and ATPase; (-- - --), GLU-DH; and (d) constrained output system: (-- - --), GLU-DH; ( - - - - ) , ATPase. Malic enzyme and PEPCK either had reduced costs equal to zero or these reactions appeared in the solution.
The calculated maximum growth rate for both the constrained and free output systems are shown in Fig. 5(a). From this figure we see that when the cell is forced to secrete lactate and alanine in the observed quantities, given by the constrained output system, it is able to grow at 57-78% o f its theoretical limit given by the free output system. Since lactate secretion occurs even in the free output system, as shown in Figs l(c) , 2(c), and 3(c), the reduction in growth rate is due primarily to alanine secretion.
The shadow prices for both the free and constrained output systems were constant between 5 and 100% D O (Table 2). The shadow prices in both systems for oxygen, ATP, and G6P increased below 1% DO, indicating ATP limitation at the low D O concentration. Conversely, the shadow prices for amino acids decreased below I% DO, indicating that the need for ATP overwhelms the need for nitrogen. Free a m m o n i u m ions always had zero shadow price, since the cell cannot utilize free ammonia . Some o f the TCA intermediates had negative shadow prices at low DO, indicating that the need to reoxidize N A D H caused the addition o f these intermedi- ates to be detrimental, rather than helpful, for cell growth.

468 J. M. S A V I N E L L A N D B. O. P A L S S O N
T A B L E 2
Shadow prices for growth at different DO concentrations, for the free and constrained output systems
Free output Constra ined oulput C o m p o u n d DO 2 5% DO = 1% DO 2: 5% DO = 1%
G6P 0-0090 0-0096 0-0 0-0076 ATP 0-0030 0-0032 0-0 0.0025 Oxygen 0.0170 0- 0208 0.0 0- 0228 N A D H 0-0010 0.0008 0.0 -0 .0025 NH4' 0"0 0"0 0"0 0"0
GLN 0"0031 0.0 0'0435 0.0051 ASP 0-0030 0.0 0'0435 0.0137 A L A 0-0 0.0 0'0435 0.0137
PYR 0-0010 -0-0008 0"0 0-0025 AcCoA 0 ~0021 0-0015 0,0 0.0076 CIT 0.006t 0.0039 0.0 0-0101 A K G 0.0042 -0 .0008 0,0 -0-0061 M A L 0-0030 0,0 0.0 0-0 O O A 0-0040 0.0024 0.0 0-0025
In the free output system, G6P and oxygen were more valuable for growth than the amino acids, while in the constrained output system, the amino acids were more valuable for growth than G6P and oxygen. This nitrogen limitation occurs because the cell secretes much of its nitrogen as alanine. The shadow price for alanine was zero at all DO concentrations in the free output system, indicating that alanine is not as valuable for growth as the other amino acids. This result is consistent with the observation that alanine is secreted.
The reduced costs represent the sensitivity of growth rate with respect to particular fluxes. A number of reactions in the free output system have nonzero reduced costs, as shown in Fig. 5(c), indicating that these reactions are not used, and that flux through these reactions would diminish the growth rate. Consequently, the reactions of malic enzyme, PEPCK, and ATPase are inefficient in terms of growth ability. On the other hand the reactions of MAL-DH and GLU-ASP transport have zero-valued reduced costs, indicating that these reactions may enter the optimal solution, but are not necessary for optimal growth. The reaction GLU-DH occured in each solution, except at 1% DO, at which point it had a non-zero reduced cost. The GLU-ASP transporter also became non-zero at 1% DO.
For the constrained output system, the reduced cost of GLU-DH was always non- zero, [Fig. 5(d)] indicating that the liberation of free ammonia by this reaction caused the cell to grow less efficiently. This difference with the free output system occured because, in the constrained output, the secretion of alanine caused the cell to be limited for nitrogen, while in the free output system the limiting factor was oxygen. This interpretation is consistent with the observations that the activity of GLU-DH is lower than that of the GLU-transaminases in iymphocytes (Ardawi & Newsholme, 1982) and tumor tissue (Glazer et al., 1974; Moreadith & Lehninger, 1984). However, other researchers have found GLU-DH to play an important role

N E T W O R K A N A L Y S I S O F M E T A B O L I S M . 11 469
in glutamine catabolism in tumors (Kovacevic, 1971). The MAL-DH reaction usually occurs in the optimal solutions, but at 1 and 10% DO, it had non-zero reduced costs.
The yields of ATP produced per total number carbons consumed (YArP/c) and the yield of carbon in biomass per total number carbons consumed (Yc/c) are shown in Fig. 5(b). Both yields drop sharply at 1% DO. Since more than half of the energy required by the cell is for maintenance, assumed here to be independent of growth, the total energy needs do not change greatly between the free and constrained output system. Consequently, YA'rP/c is similar for both systems. On the other hand, the carbon required by the cell is proportional to the cell growth rate, so that Yc/c for the free output system is about 50% greater than that of the constrained output, which had a relatively low yield of about 0.2 carbon/carbon.
(F) A L A N I N E SECRETION
One of the drawbacks associated with the previous calculations is that the predicted growth rates were greater than those achievable in the cell, since the limitations on the rates of DNA replication and cell division were not considered. As a result of this limited growth rate, the cell needs to remove the excess glutamine that was consumed. Several end-products from incomplete gluamine oxidation are possible; these are: alanine, aspartate, glutamate, lactate, proline, and ammonia. The hybrid- oma cell has been observed to secrete all of these, but ammonia and alanine are produced at the highest rate. The secretion of alanine may be explained by kinetic effects, such as the relative rates of enzyme activities or sensitivities. However, we have examined the production of alanine to determine whether these results may be explained by stoichiometric considerations as well.
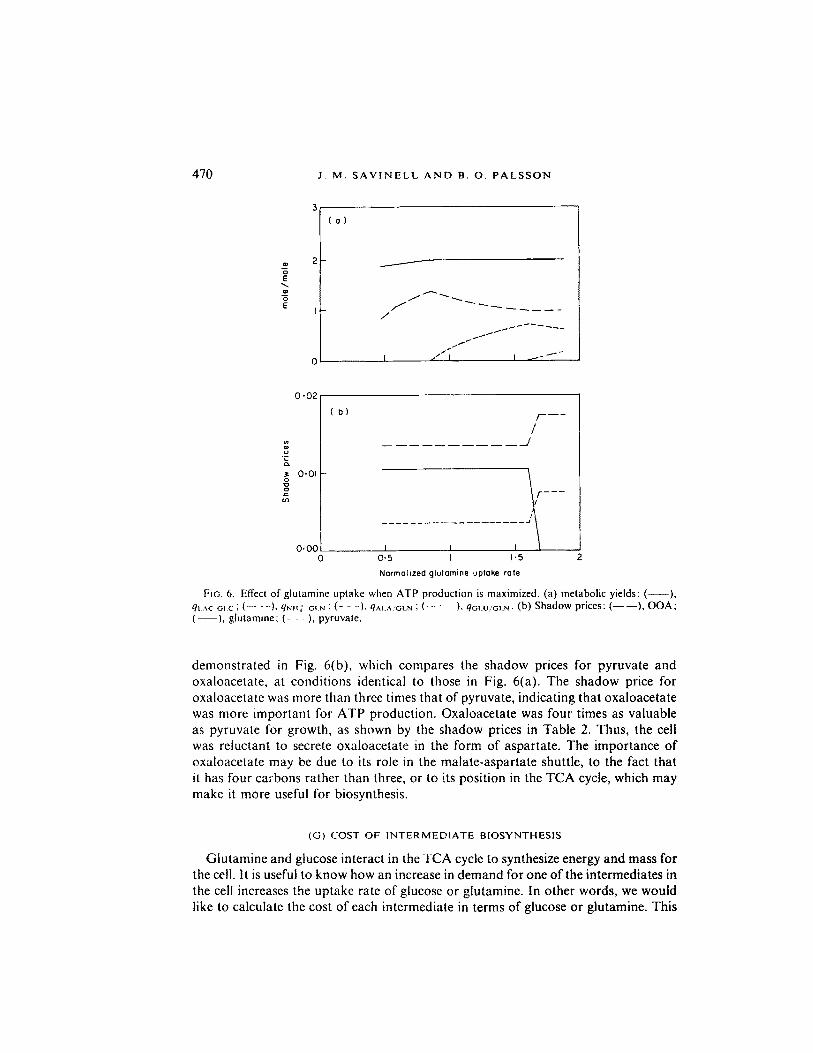
In the previous simulations where the growth rate was maximized, the cell secreted alanine only at extreme conditions, such as ATP demand greater than 600 nmol / l06 cells hr-t , qOLN greater than 60 nmol/106 cells hr-t , or qCLC less than 250 nmol/ 106 cells hr- ~. To take into account the genetic restrictions on the growth rate, the growth rate was set equal to the value observed at 20% DO. Since the growth rate was fixed, another objective function had to be chosen. Secondary objective functions of maximizing and minimizing ATP production were used, and results from maximiz- ing ATP production are shown in Fig. 6(a). Alanine secretion occurred at the experi- mental glutamine uptake rate when excess ATP production was maximized. On the other hand, urea was produced most when excess ATP was minimized (not shown). These results suggest that the cell's physiology is governed by the objective to maxim- ize ATP production. This result also makes intuitive sense, since the ability to synthe- size ATP while discarding excess nitrogen and carbon mass may allow tumor cells to adapt to a variety of environmental stresses, including temporary nutrient and oxygen shortages. During transition to starvation conditions, the excess ATP that was produced may be allowed to accumulate for use for maintenance or biosynthesis rather than be immediately dissipated oia ATPases.
The preference of alanine secretion over aspartate secretion may occur because the regeneration of pyruvate from aKO produces slightly more energy than does the regeneration of oxaloacetate from aKO. This preference for alanine secretion is also
470 J . M . S A V I N E L L A N D B. O . P A L S S O N
E
( o )
/
I / " I I J - -
0 -02
u
• 0 - 0 1
Ib)
0.OO I I I 0 0"5 I 1.5
Normalized glutomine uptake rate
/ D - - - -
/ /
2
FIG. 6, Effect of g lu tamine up take when A T P produc t ion is maximized . (a) metabol ic yields: ( ), qt...xc'GI.c; ( - - - ) , qNH4' 'OI N : ( - - - ) , qAI.A.'GLN ; ( - - " - - ) , qC;LU/OLN. (b) S h a d o w prices: ( - - I ) , O O A ; ( ), g lu t amine ; ( - - - ) , pyruvate .
demonstrated in Fig. 6(b), which compares the shadow prices for pyruvate and oxaloacetate, at conditions identical to those in Fig. 6(a). The shadow price for oxaloacetate was more than three times that of pyruvate, indicating that oxaloacetate was more important for ATP production. Oxaloacetate was four times as valuable as pyruvate for growth, as shown by the shadow prices in Table 2. Thus, the cell was reluctant to secrete oxaloacetate in the form of aspartate. The importance of oxaloacetate may be due to its role in the malate-aspartate shuttle, to the fact that it has four carbons rather than three, or to its position in the TCA cycle, which may make it more useful for biosynthesis.
(G) COST OF INTERMEDIATE BIOSYNTHESIS
Glutamine and glucose interact in the TCA cycle to synthesize energy and mass for the cell. It is useful to know how an increase in demand for one of the intermediates in the cell increases the uptake rate of glucose or glutamine. In other words, we would like to calculate the cost of each intermediate in terms of glucose or glutamine. This

N E T W O R K A N A L Y S I S O F M E T A B O L I S M . I I 471
type of calculation is obvious when the cell has a single major nutrient, and the catabolic pathway is linear. However, when two or more nutrients interact in a cyclic pathway, as do glucose and glutamine in the TCA cycle, with numerous reactions entering and leaving the cycle, the costs are not obvious, and a systems analysis approach is required. The shadow prices, which have been defined as the sensitivity of the objective function to a constraint, can thus be interpreted as the cost of synthesizing an intermediate when the objective function is to minimize qcLc or qGLN.
In the following calculations, the uptake rates of the amino acids, except glutamine, were set equal to the values shown in Table 1. The growth rate was fixed to the measured value, and then either qGLC or qGLN was minimized as the uptake rate of oxygen was varied. Table 3 summarizes the shadow prices for intermediates when either qOLC was minimized (with qGLN fixed at the minimum flux needed for biosyn- thesis), or qGLN was minimized (with qGLC fixed at the minimum flux needed for biosynthesis).
TABLE 3 Shadow prices for intermediates, in terms of glucose and glutamine uptake rates. The oxygen uptake rate was varied from 10-140 nmol/106 cells hr-
Cost in terms of glucose Cost in terms of glutamine Compound qo~ = 10 qo~ = 20-140 qo2 = I 0 qo2 = 20-140
GLC 1-00 1-00 1-00 1-90 PYR I'00 0-18 1-00 0-33 AcCOA 2"00 0" 35 -0"06 0.67
CIT 1.44 1.03 1-44 !-95 AKG - 0 ' 7 0 0.70 -0"70 1-33 MAL 0"50 0'50 0'50 0'95 OOA 1-50 0'68 1-50 1.28
N A D H - 1.00 -0" 18 - 1.00 -0"33 ATP 0'50 0.50 0.50 0.95 NH~' 0'00 0.00 0.00 0-00
GLN I'00 0.53 1-00 1.00 ASP 3"20 0~50 3-20 0-95 A LA 2" 70 0.00 2.70 0-00 PRO 0"00 1.18 0.00 2.23
The cost of ATP under anaerobic conditions is either 0-5 glucose or glutamine, indicating that if the demand for ATP is raised by 1.0 unit, then the uptake of either glucose or glutamine must increase by 0.5 unit. Pyruvate had the cost of 1-0 glucose or glutamine at anaerobic conditions. One might expect that the production of pyruvate would lead to the uptake of 0.5 glucose, but if pyruvate were needed for biosynthesis, another glucose must be catabolized to oxidize the NADH. Proline had zero cost in both glutamine and glucose at low qo2, since proline synthesis is a sink for NADH.
The prices of all the intermediates at anaerobic conditions are the same in terms of both glucose and glutamine. Also, the shadow prices for several intermediates, in particular the amino acids, inreased at low qo~. This increased costs at low DO may

472 J . M . S A V I N E L L A N D B. O . P A L S S O N
explain why the uptake rates rates of both glucose and glutamine have been observed to increase at low DO (Miller et al., 1988; Ozturk & Palsson, 1991b).
Although glucose and glutamine had equal values at anaerobic conditions, at moderate qo2 the value of glucose was nearly twice that of glutamine. The increase in value of glucose relative to glutamine at moderate qo~ is probably related to the high value of ATP in terms of glutamine at moderate qo2.
These costs can also be used to compare the relative values of intermediates. For example, the cost of aspartate was equal to the cost of alanine plus one ATP, in terms of both glutamine and glucose, and at all qo~, indicating that aspartate is always worth one more ATP than alanine. The prices in terms of both glucose and glutamine of the intermediates correlated approximately with their positions in the TCA cycle. The negative value for NADH causes the somewhat unexpected result that oxaloacetate is worth more than malate. The negative value for NADH indicates that even at high qo2, the cell is still limited by NADH oxidation.
Conclusions
Linear optimization is useful for studying characteristics of the cell that result only from the structure of the metabolic network. We have used linear optimization to examine the capabilities of the hybridoma cell, given particular experimental condi- tions, and to study the interactions among nutrients and metabolic loads on the cell. In addition, the properties of shadow prices and reduced costs were explored for information about the limiting nutrients and limiting reactions at different environ- mental conditions.
By calculating the effect of ATP demand on growth rate, we conclude that the maintenance demand does not limit growth at experimental conditions. In other words, the energy for maintenance results from the catabolism of glucose, which is consumed in excess amounts. The shadow prices at the experimental conditions, given by the constrained output system, indicate that the cell is limited for growth by glutamine availability, since much of tlle glutamine is secreted as alanine. However, if the cell did not secrete alanine, then the limiting nutrients would be mostly oxygen, and then glucose, and least of all, glutamine. This information is obtained by the shadow prices for the free output system. The observed secretion rates of waste products by the cell causes the cell to grow at rates equal to 57---78% of its theoretical limit at the different DO concentrations.
On average, the cell obtains about 0.45 ATP per carbon atom consumed, and about 0.2 carbon is used for biosynthesis for every carbon consumed. In anaerobic conditions, glucose and glutamine have nearly the same value as precursors for intermediates, while in aerobic conditions, glucose is nearly twice as valuable as gtutamine.
At physiological conditions, the reduced costs indicate that flux through the gluta- mate dehydrogenase reaction may slow down growth, which corresponds to experi- mental observations that this reaction may not be active in the tumor cell. From the simulations shown here, we determined that the secretion of alanine, not lactate, causes the growth limitation. The cell may choose to secrete alanine, rather than

N E T W O R K A N A L Y S I S OF M E T A B O L I S M . II 473
other amino acids, because alanine synthesis results in more ATP formation than the synthesis of other amino acids. Also, the growth rate is generally less sensitive to pyruvate, which is the precursor to alanine, than to oxaloacetate, which is the precursor to aspartate. Thus, the shadow prices offer explanations for observed phenomena based on the stoichiometry.
The authors thank Sadettin S. Ozturk for the use of his data, and Michael Savageau and Alice Chuck for their reviews of this manuscript. This research was supported by National Science Foundation grant EET-8712756.
R E F E R E N C E S
ARDAWI. M. & NEWSHOLME. E. A. (1982). Maximum activities of some enzymes of glycolysis, the tricarboxylic acid cycle and ketone-body and glutamine utilization pathways in lymphocytes of the rat. Biochenz. J. 208, 743-748.
FLElSCttAKER, R. J. (1986). Practical matters in instrumentation for mammalian cell cultures. In: Mam- malian Celt Technology (Thilly, W. G., ed.) pp. 199-21 I. Oxford, U.K. : Butterworths.
GLAZER, R., VOGEL. C., PO'rEL. I. & AwrHoNY, P. (1974). Glutamate dehydrogenase activity related to histopathological grade of hepatocellular carcinoma in man. Cancer Res. 34, 2975.
IMANAKA. T. & AreA. S. (1981). A perspective on the application of genetic engineering: stability of recombinant plasmid. Ann. N. Y. Acad. Sci. 1-14.
KILaORN. D., LILLY, M. & WERB, F. (1969). The energetics of mammalian cell growth. J. Cell Sci. 4, 645-654.
KOVACEWC, Z. (1971). The pathways of glutamine and glutamate oxidation in isolated mitochondria from mammalian cells. Biochem. J. 125, 757.
LEE, G. M., VARMA, A. & PALSSON, B. O. (1991). Application of population balance model to the loss of hybridoma antibody productivity. Biotechnol. Prog. 7, 72-75.
LEVINTOW. L., EAGLE, H. & PlEa, K. (1957). The role of glutamine in protein biosynthesis in tissue culture. J. biol. Chem. 227, 929.
MEISTER, A. (1962). Amide nitrogen transfer (survey). The Enzymes 16, 247. MILLER. W., WILKE, C. • BLANCH, H. (1988). Transient attdsteady-state responses hz conth~uous hybrid- .
oma ettltttre. Presentation at the American Chemical Society National Meeting, Los Angeles, CA. MWLLER, W., WILKE. C. & BLANCH. H. (1986). Hybridoma responses to nutrient pube and step changes
hi continuous culture, hnplications for metabolic regulation. Presentation at the American Institute of Chemical Engineers national meeting.
MOREADmTH, R. W. & LEW~NINGER. A. L. (1984). The pathways of glutamate and glutamine oxidation by tumor cell mitochondria. Role of mitochondrial NAD(P) ' -dependent malic enzyme. J. biol. Chem. 259(10), 6215-6221.
OZTURK, S. S. & P^LSSON. B. O. (1990). Effects of dissolved oxygen on hybridoma cell growth metabo- lism, and antibody production kinetics in continuous culture. Biotech. Prog. 6, 437-446.
OZTURK, S. S. & PALSSON, B.O. (1991a). Growth, metabolic, and antibody production kinetics of hybridoma cell culture: I. analysis of data from controlled batch reactors. Biotech. Prog. In press.
OZTURK, S. S. & PALSSON, B. O. (1991b). Growth, metabolic, and antibody production kinetics of hybridoma cell culture: I1 effects of serum concentration, dissolved oxygen concentration, and medium pH in a batch reactor. Biotech. Prog. In press.
PSRT, S. (1965). The maintenance energy of bacteria in growing cultures. P. R. Soe. B 163, 224-231. SALZMAN, N., EAGLE, H. & SEARING, E. (1957). The utilization of glutamine, glutamic acid, and
ammonia for the biosynthesis of nucleic acid bases in mammalian cell cultures. J. biol. Chem. 227, 1001~ SAV~NELL, J. M. & PALSSON, B. O. (1991). A network analysis of intermediary metabolism using linear
optimization, i. Development of mathematical formalism. J. theor. Biol. 154, 421-454.