Embed Size (px)
Citation preview

My Life: Personal Outcomes Index™: Summary Report
Community Living British Columbia
Final Report
May 18, 2011
Prepared by:
How ard Research & Management Consul t ing Inc.
Calgary Howard Building, 127 – 1st Avenue West
Box 1110, Cochrane, AB T4C 1B2 Ph: 403.932.0180 Fx: 403.932.7499
E-Mail: [email protected]
Web: www.howardresearch.com

CLBC My Life Final Summary Report May 18, 2011
i
Table of Contents Table of Contents ................................................................................................................... i Highlights of Key Findings .................................................................................................... 1
Survey Administration and Reliability ................................................................................ 1
Quality of Life Results ....................................................................................................... 1
Moving Forward ................................................................................................................ 2
Introduction and Approach ................................................................................................... 3
What is Quality of Life? ..................................................................................................... 3
Data Collection and Analysis ............................................................................................ 4
Presentation of Results ..................................................................................................... 7
Aggregate Quality of Life Results ......................................................................................... 8
Emotional Well-being ........................................................................................................ 9
Interpersonal Relations ..................................................................................................... 9
Material Well-being ..........................................................................................................10
Personal Development ....................................................................................................10
Physical Well-being .........................................................................................................11
Rights ..............................................................................................................................12
Self-Determination ...........................................................................................................12
Social Inclusion ................................................................................................................13
Transportation .................................................................................................................13
Comparison of Aggregate and Service Provider Quality of Life Scores ...............................14
Relationships between Quality of Life Scores and Respondent Demographic Characteristics ............................................................................................................................................15
Impact of Proxy Reporting ...................................................................................................17
Significant Differences between Average Domain Scores by Respondent Type ..............17
Relationships between Domain Scores and Response Type (multiple regression results) ........................................................................................................................................18
Conclusion: Impact of Proxy Reporting ............................................................................18
Internal Consistency Reliability ............................................................................................19
Discussion of Results ..........................................................................................................20
Conclusions .....................................................................................................................20
Recommendations for Moving Forward ...........................................................................20

CLBC My Life Final Summary Report May 18, 2011
1
Highlights of Key Findings
Survey Administration and Reliability
• Surveys were completed by (or by proxies on behalf of) a total of 329 individuals across seven participating service providers, constituting an overall response rate of 67%.
• Surveys for 143 individuals were completed by proxies (44% of the total sample). The proportion of individuals represented by proxies ranged from 28% to 61% across the seven participating service providers.
• Analysis demonstrates that the My Life: Personal Outcomes Index™ is reliable for the CLBC pilot project population, producing internal consistency reliability scores in the acceptable or good ranges for all eight domains.
• Overall, analysis indicates that the My Life instrument is reliable for the two primary respondent groups (self-report respondents and individuals represented by proxies), although it produces higher levels of reliability for self-report respondents when compared to individuals represented by proxies in the areas of emotional well-being and physical well-being.
Quality of Life Results
• As measured on a scale from 0 to 10, where 0 represents low quality of life and 10 represents high quality of life, respondents’ (n=329) average domain scores ranged from 5.93 for social inclusion to 8.68 for emotional well-being.
• Average domain scores for service providers were generally similar to the aggregate average scores. Statistically significant differences (p ≤ .05) from the aggregate domain scores were only observed for three service providers (CISS, Milieu, and Semiahmoo), and across these three providers only five significant differences were observed.
• In the investigation of relationships between quality of life scores and respondent demographic characteristics some significant trends emerged:
o Higher monthly support costs were positively related to emotional well-being but negatively related to rights and self-determination.
o Paid employment was related to higher quality of life in six out of the eight domains.
o Better mobility within one’s community was related to higher quality of life in all domains.
• Statistical analysis indicates that respondent type (self-report or proxy) has an impact on average domain score in at least seven of the eight quality of life domains. At this point it is unclear whether differences are due to real differences in the individuals represented or due to a respondent effect (i.e., due to who is reporting for an individual). Nonetheless, when controlling for other demographic variables:

CLBC My Life Final Summary Report May 18, 2011
2
o Individuals represented by proxy respondents were more likely than self-report respondents to have higher average domain scores for the three domains related to well-being (emotional well-being, physical well-being, and material well-being).
o Self-report respondents were more likely than individuals represented by proxies to have higher average domain scores for the domains personal development, self-determination, interpersonal relations, and rights.
Moving Forward
• Due to the relatively high proportion of proxies participating in the pilot administration of the My Life survey, it is recommended that the process used to determine need for a proxy be reviewed.
• It is recommended that plans for continuing or expanding the pilot project include a detailed sampling plan that takes into account: (a) the overall sampling strategy for the project (e.g., selection of service providers to be included, frequency of sampling), (b) the size of service provider (e.g., how to obtain and present results for very small providers while maintaining confidentiality), and (c) the frequency with which a given individual can be asked to complete the My Life survey.
• Various revisions/improvements to administrative data collection are suggested, including adding “telephone administration” as a checklist option under the survey location variable, increasing standardization of the form used to collect respondent demographic information, and collecting information on the level and/or nature of disability of respondents.

CLBC My Life Final Summary Report May 18, 2011
3
Introduction and Approach Community Living British Columbia (CLBC) is focused on improving the quality of life (QoL) of individuals with developmental disabilities. As such, in 2010 CLBC embarked on a pilot project intended to measure the QoL of the individuals it supports entitled the “CLBC Self-Advocate Quality of Life Interview Project.” For this project CLBC has utilized the My Life: Personal Outcomes Index™ survey tool developed by Persons with Developmental Disabilities Edmonton Region Community Board. This report provides a summary of results of the pilot administration of this tool by CLBC. A more detailed discussion of all components presented here is included in the report: My Life: Personal Outcomes Index™ Technical Report (May 16, 2011).
What is Quality of Life?
Quality of life (QoL) is a complex, multidimensional concept. Its origins are in the very beginnings of western philosophy and it continues to be a popular notion in modern health and social science literature. There are numerous definitions of quality of life in the academic literature. However, two major perspectives on indicators of QoL are offered:
1) Quality of life describes the environment where people live. QoL is indicated through statistics such as average income, air quality, and crime rates. This understanding of QoL is closely related to the concept of standard of living.
2) Quality of life describes how people experience where and how they live. QoL is indicated through statements and statistics that capture perception such as: How would you rate your personal health? How safe do you feel walking in your neighbourhood? Do you feel you have enough resources to meet your basic needs? Do you trust your neighbours? Do you have enough friends? Do you experience enough personal privacy?
The My Life: Personal Outcomes Index™ is based on a theoretical framework for measuring QoL which consists of eight domains that together indicate an individual’s sense of personal well-being. This approach focuses on measuring well-being, rather than standard of living, of individuals receiving services and supports. The eight domains include:1
• Emotional well-being • Interpersonal relations • Material well-being • Personal Development • Physical well-being • Self-determination • Social inclusion • Rights
1 These eight areas are the most commonly cited domains for quality of life. See: (1) Schalock, R. L., Gardner, J. F., & Bradley, V. J. (2007). Quality of life for people with intellectual and developmental disabilities: Application across individuals, organizations, communities, and systems. Washington, DC: American Association on Intellectual and Developmental Disabilities. (2) Schalock, R. L., & Verdugo, M. A. (2002). Handbook on quality of life for human service practitioners. Washington, DC: American Association on Mental Retardation. (3) Schalock, R. L., Verdugo, M. A., Jenaro, C., Wang, M., Wehmeyer, M., Jiacheng, X., & Lachapelle, Y. (2005). Cross-cultural study of quality of life indicators. American Journal on Mental Retardation, 110, 298-311.
CLBC My Life Final Summary Report May 18, 2011
4
Based on the theoretical framework adopted, each of the eight domains is connected to one of three overarching factors:2
• Independence (personal development, self-determination)
• Social participation (interpersonal relations, social inclusion, rights)
• Well-being (emotional well-being, physical well-being, material well-being)
Data Collection and Analysis
Survey administration
The My Life survey was administered by surveyor teams consisting of one interviewer (individual who read the survey questions) and one recorder (individual who recorded the respondent’s answers). Both surveyors had a developmental disability.3 In some cases (typically with proxy respondents4) surveys were administered via telephone, most often due to schedule limitations of the respondent or distance from the project location. When surveys were administered by telephone the survey was administered by an individual with a developmental disability. Service providers offered respondents a choice of where the survey would be administered. The primary locations for survey administration included a central location (i.e., the service provider’s main administrative office), a day service, or, in a small number of cases, the respondent’s home. In all cases attempts were made to administer the survey in a private location free from the presence of other individuals or staff unless otherwise requested by the respondent. Sample selection and response rate
Individuals were invited to participate in the 2010-11 pilot administration of the My Life survey through random sampling procedures. The survey sample was selected from seven service providers supporting adults with developmental disabilities in the Lower Mainland of British Columbia. The number of individuals surveyed from each service provider is presented in Table 1, along with response rate by service provider.
2 Schalock, R. L., Bonham, G. S., & Verdugo, M. A. (2008). The conceptualization and measurement of quality of life: Implications for program planning and evaluation in the field of intellectual disabilities. Evaluation and Program Planning, 31, 181-190. 3 Note that in a small number of cases the Project Manager served as recorder when one of the scheduled surveyors was unable to reach the interview location (e.g., because of poor weather conditions). 4 Proxy respondents are discussed in more detail on page 5.

CLBC My Life Final Summary Report May 18, 2011
5
As indicated in Table 1, surveys were completed by (or by proxies on behalf of) a total of 329 individuals, constituting an overall response rate of 67% (a total of 493 individuals were invited to participate).
Table 1. Proportion of individuals served by each s ervice provider and survey sample sizes
Service Provider Total number of individuals
served
Proportion of total
population
Sample size
Response rate
Burnaby Association for Community Inclusion (BACI) 301 27.4% 88 72.7%
Community Integration Services Society (CISS) 42 3.8% 25 62.5%
Community Living Society (CLS) 228 20.7% 62 66.0%
Healthy Opportunities for Meaningful Experience (H.O.M.E.S)
57 5.2% 25 80.7%
Langley Association for Community Living (LACL)
179 16.3% 49 43.8%
Milieu Family Services, Inc. (Milieu)
91 8.3% 25 86.2%
Semiahmoo House Society (Semiahmoo)
202 18.4% 55 83.3%
Total* 1100 100% 329 66.7% * In some instances proportions may not total exactly 100% due to rounding. Use of proxies
In some instances an individual was willing to participate in the My Life survey but was unable to complete it on his or her own due to an inability to verbally or non-verbally express his/her own views.5 The service providers were responsible for determining need for a proxy. In some cases this decision was based on the provider’s knowledge of the individuals, but in most cases families and/or staff were asked whether a proxy was required. When there was some doubt about proxy need a self-report interview was initiated and the surveyors made the final determination about proxy need as outlined in their training manual. When proxies were required, the service provider’s project lead consulted with families and staff to determine who should serve as proxies for a given individual (in all cases two proxies were requested). Where possible input was sought from the individual on who should serve as proxies. These people were then contacted and asked to complete the My Life survey on behalf of the individual (as proxies for that individual). The responses of the two proxies were then averaged for all survey questions. Proxy interviews were most often conducted in person by QoL surveyor teams. In some cases (n=73) proxy interviews were conducted via telephone by a QoL surveyor, most often to accommodate the respondent’s schedule or distance from project location.6
5 Inability to express one’s own views could be due to either a) the physical and/or cognitive requirements needed to self report or b) the occurrence of anxiety or agitation that prevents a person from expressing his/her views in an interview setting/process. 6 That is, telephone interviews were conducted with 73 separate proxy respondents.

CLBC My Life Final Summary Report May 18, 2011
6
Surveys for 143 individuals were completed by proxies (44% of the total sample). The proportion of individuals represented by proxy respondents for each service provider is outlined in Table 2. Table 2. Proportion of surveys completed by proxies by service provider*
Service Provider Number of respondents
Number of individuals
self-reporting
Number of individuals represented
by proxy
Proportion of
individuals represented
by proxy BACI 88 54 34 38.6%
CISS 25 18 7 28.0%
CLS 62 24 38 61.3%
H.O.M.E.S 25 15 10 40.0%
LACL 49 21 28 57.1%
Milieu 25 11 14 56.0%
Semiahmoo 55 43 12 21.8%
Overall 329 186 143 43.5% * Note: The numbers provided in this table are unweighted7. Data analysis
Survey data were entered in a database and subsequently analyzed. There were six key components to the analysis, the results of which are reported in this document:
1. To examine reliability of each of the QoL indices (i.e., eight domains) measured through the My Life Index, the internal consistency reliability of the items included within each domain was tested (by calculating Cronbach’s Alpha).8
2. Aggregate data were analyzed by survey item (basic frequencies of response were calculated for each survey question).
3. An overall average domain score was calculated for each of the eight domains. Average domain scores were calculated for the aggregate sample and for service provider and respondent type (self-report or proxy) sub-samples.
4. Average domain scores for each service provider were compared with average domain scores for the aggregate sample (statistically significant differences (p ≤ .05) were calculated using independent samples two-tailed t-tests).
5. Average domain scores by respondent type (self-report or proxy) were compared (statistically significant differences (p ≤ .05) were calculated using independent samples two-tailed t-tests).
6. Ordinary Least Squares multiple regression was used to examine relationships between quality of life scores and demographic and respondent type variables.
7 That is, the numbers provided represent the actual number of surveys completed for each service provider. 8 Internal consistency reliability was also investigated separately for self-report and proxy respondents.

CLBC My Life Final Summary Report May 18, 2011
7
Note: For all analyses other than a) internal consistency reliability and b) calculation and comparison of average service provider domain scores, survey results were weighted by service provider proportion to ensure the proportion of individuals served by each service provider represented in the sample corresponded with population proportions as indicated in Table 1.
Presentation of Results
Results are presented and discussed in six parts:
1. Aggregate results of overall quality of life scores and corresponding survey items 2. Comparison of aggregate and service provider quality of life scores 3. Relationships between respondent demographic characteristics and quality of life
scores 4. Impact of proxy reporting 5. Survey reliability of quality of life domains (internal consistency reliability results) 6. Discussion of results
CLBC My Life Final Summary Report May 18, 2011
8
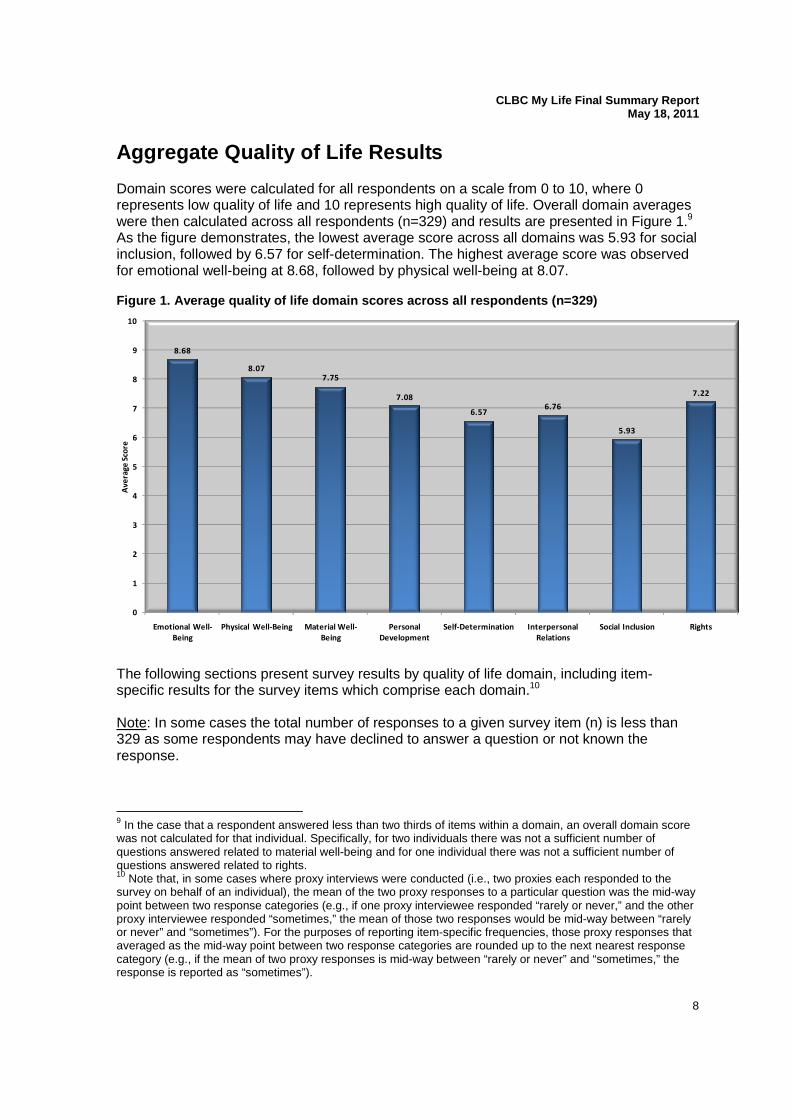
Aggregate Quality of Life Results Domain scores were calculated for all respondents on a scale from 0 to 10, where 0 represents low quality of life and 10 represents high quality of life. Overall domain averages were then calculated across all respondents (n=329) and results are presented in Figure 1.9 As the figure demonstrates, the lowest average score across all domains was 5.93 for social inclusion, followed by 6.57 for self-determination. The highest average score was observed for emotional well-being at 8.68, followed by physical well-being at 8.07. Figure 1. Average quality of life domain scores acr oss all respondents (n=329)
8.68
8.077.75
7.08
6.576.76
5.93
7.22
0
1
2
3
4
5
6
7
8
9
10
Emotional Well-
Being
Physical Well-Being Material Well-
Being
Personal
Development
Self-Determination Interpersonal
Relations
Social Inclusion Rights
Av
era
ge
Sco
re
The following sections present survey results by quality of life domain, including item-specific results for the survey items which comprise each domain.10 Note: In some cases the total number of responses to a given survey item (n) is less than 329 as some respondents may have declined to answer a question or not known the response.
9 In the case that a respondent answered less than two thirds of items within a domain, an overall domain score was not calculated for that individual. Specifically, for two individuals there was not a sufficient number of questions answered related to material well-being and for one individual there was not a sufficient number of questions answered related to rights. 10 Note that, in some cases where proxy interviews were conducted (i.e., two proxies each responded to the survey on behalf of an individual), the mean of the two proxy responses to a particular question was the mid-way point between two response categories (e.g., if one proxy interviewee responded “rarely or never,” and the other proxy interviewee responded “sometimes,” the mean of those two responses would be mid-way between “rarely or never” and “sometimes”). For the purposes of reporting item-specific frequencies, those proxy responses that averaged as the mid-way point between two response categories are rounded up to the next nearest response category (e.g., if the mean of two proxy responses is mid-way between “rarely or never” and “sometimes,” the response is reported as “sometimes”).

CLBC My Life Final Summary Report May 18, 2011
9
Emotional Well-being
Emotional well-being investigates, for example, respondents’ feelings of safety, self-concept, and trust. The average domain score across all respondents for emotional well-being was 8.68 – the highest score observed across all domains. Results for specific survey items are presented in Table 3. Table 3. Emotional well-being item-specific results
Item n Rarely or never Sometimes
Most of the time/
Often 1. Do you feel safe in your neighbourhood? 329 2.3% 10.5% 87.2%
2. Do you feel safe in your home? 329 2.7% 11.8% 85.5%
3. Do you feel good about yourself? 329 3.4% 17.6% 79.0%
4. Do people tell you that you do things well? 329 2.4% 23.6% 74.0%
5. Can you trust the people you are around? 328 5.2% 18.5% 76.3%
6. Do people show you love or caring? 329 4.6% 12.8% 82.6%
Interpersonal Relations
Items related to interpersonal relations focus on relationships, supports, and interactions with others. The average domain score across all respondents for interpersonal relations was 6.76. Results for specific survey items are presented in Tables 4 through 7. Table 4. Interpersonal relations item-specific resu lts: scale 1
Item n Rarely
or never
Sometimes Most of
the time/ Often
8. Is there someone you can ask for help if you need it? 329 2.6% 15.6% 81.8%
11. How often do you go out with friends or attend parties, events, or dances? 329 17.9% 43.8% 38.3%
12. Do you have friends over to visit your home? 329 23.3% 48.0% 28.7%
Table 5. Interpersonal relations item-specific resu lts: scale 2
Item n No Somewhat Yes
7. Do you feel you have enough close friends? 329 9.0% 24.2% 66.8%
Table 6. Interpersonal relations item-specific resu lts: scale 3
Item n Not at
all happy
Somewhat happy
Very happy
9. Are you happy with how you get along with your family? 322 3.8% 15.9% 80.3%

CLBC My Life Final Summary Report May 18, 2011
10
Table 7. Interpersonal relations item-specific resu lts: scale 4
Item n
Very few or none of my
friends
Some of my friends
Most of my
friends
10. How many friends do you have that are not paid staff? 329 18.8% 43.5% 37.7%
Material Well-being
Items related to material well-being focus on such topics as financial status and personal possessions. The average domain score across all respondents for material well-being was 7.75. Results for specific survey items are presented in Tables 8 through 10. Table 8. Material well-being item-specific results: scale 1
Item n Rarely or never Sometimes Most of
the time
37. Do you have money to spend on what you want?
326 5.2% 24.7% 70.1%
38. Can you save some of your money if you want to?
323 6.2% 27.9% 65.9%
40. Do you usually have enough money to pay your bills?
323 11.2% 17.6% 71.2%
41. Do you have enough money for food each week?
325 5.0% 17.5% 77.5%
Table 9. Material well-being item-specific results: scale 2
Item n Nothing Some things Many things
39. Do you own things that are important to you, like a TV, stereo, bicycle, computer, or other things?
327 4.8% 33.0% 62.2%
Table 10. Material well-being item-specific results : scale 3
Item n Rarely or never
Once every couple of
years
At least once a
year
42. How often could you go on vacation if you wanted to? 328 15.3% 20.9% 63.8%
Personal Development
Items related to personal development focus on, for example, opportunities for personal growth/skill development, and feelings of personal value and achievement. The average domain score across all respondents for personal development was 7.08. Results for specific survey items are presented in Tables 11 and 12.

CLBC My Life Final Summary Report May 18, 2011
11
Table 11. Personal development item-specific result s: scale 1
Item n Rarely or never Sometimes
Most of the time/
Often
19. Do you feel you are learning new skills? 328 8.5% 42.7% 48.8%
21. Do you think what you do during the day is important?
328 4.1% 26.6% 69.3%
22. Do you have things that you are looking forward to?
329 3.7% 22.9% 73.4%
23. Do you have the opportunity to go places to learn new skills?
329 13.1% 46.6% 40.3%
24. Are you able to find things to do that you really enjoy doing?
329 5.3% 25.7% 69.0%
Table 12. Personal development item-specific result s: scale 2
Item n No Somewhat Yes 20. Do you have the chance to become what you want? 328 10.2% 41.6% 48.2%
Physical Well-being
Physical well-being investigates, for example, physical health, access to health care, and areas related to a healthy lifestyle. The average domain score across all respondents for physical well-being was 8.07 – the second highest score observed across all domains. Results for specific survey items are presented in Tables 13 and 14. Table 13. Physical well-being item-specific results : scale 1
Item n Rarely or never Sometimes
Most of the time/
Often 31. Can you see a doctor when you need to? 329 1.9% 14.5% 83.6%
32. How often do you feel like you have lots of energy? 328 5.7% 29.8% 64.5%
34. How often are you physically active, like going for a walk, exercising, or playing sports? 329 11.6% 29.2% 59.2%
35. Do you eat foods that are good for you? 328 4.9% 16.0% 79.1%
36. Do you have enough rest and relaxation in your life?
329 5.3% 15.9% 78.8%
Table 14. Physical well-being item-specific results : scale 2
Item n Not so Good Okay Good
33. How do you usually feel when you wake up in the morning?
329 6.7% 25.5% 67.8%

CLBC My Life Final Summary Report May 18, 2011
12
Rights
Survey items associated with the area of rights are concerned with issues related to one’s personal right to make choices and decisions. The average domain score across all respondents for rights was 7.22. Results for specific survey items are presented in Tables 15 and 16. Table 15. Rights item-specific results: scale 1
Item n Rarely or never Sometimes
Most of the time/ Always
43. Can you lock the bathroom door if you want to? 328 12.0% 23.2% 64.8%
44. Can you make your own choices? 329 5.9% 31.4% 62.7%
45. If you don’t like a decision can you speak up or tell someone?
328 4.9% 28.2% 66.9%
46. Can you be alone if you want to? 327 8.6% 31.4% 60.0%
47. Do people respect the choices you make? 328 5.9% 23.6% 70.5%
Table 16. Rights item-specific results: scale 2
Item n No Not sure Yes
48. Do you have your own key to your home? 329 30.1% 16.2% 53.7%
Self-Determination
Self-determination includes concepts such as perceptions of autonomy and personal control, choices, and ability to express oneself. The average domain score across all respondents for self-determination was 6.57 – the second lowest score observed across all domains. Results for specific survey items are presented in Tables 17 and 18. Table 17. Self-determination item-specific results: scale 1
Item n Little or none Some Lots
25. How much choice do you have over where you live? 329 19.3% 36.0% 44.7%
26. How much choice do you have over who you live with? 327 22.9% 36.7% 40.4%
30. How much control do you have over how your money is spent? 329 16.9% 39.6% 43.5%
Table 18. Self-determination item-specific results: scale 2
Item n Rarely or never Sometimes Most of
the time 27. Can you do the things you really want to do? 329 5.3% 34.5% 60.2%
28. Do you get to choose your activities? 329 6.3% 33.3% 60.4%
29. Do you get to choose what you are going to wear each day? 329 7.6% 23.9% 68.5%

CLBC My Life Final Summary Report May 18, 2011
13
Social Inclusion
Social inclusion is concerned with such areas as community integration and participation. The average domain score across all respondents for social inclusion was 5.93 – the lowest score observed across all domains. Results for specific survey items are presented in Tables 19 and 20. Table 19. Social inclusion item-specific results: s cale 1
Item n Rarely or never Sometimes
Most of the time/
Often 14. Do you help others when they need your help? 329 12.2% 33.3% 54.5%
15. Do you talk or visit with your neighbours? 329 32.9% 42.7% 24.4%
16. Do you volunteer for things? 329 35.8% 32.6% 31.6%
18. Do you do things in your community like shopping, going to movies, or eating out?
329 4.2% 29.1% 66.7%
Table 20. Social inclusion item-specific results: s cale 2
Item n No Somewhat Yes
13. Do you feel you are part of your community, like belonging to clubs, teams or church groups?
329 19.8% 33.9% 46.3%
17. Do you feel people in your community know you?
329 8.9% 35.0% 56.1%
Transportation
While not part of a quality of life domain, respondents were asked a question related to access to transportation as this variable has been shown to be a predictor of quality of life (i.e., can influence one’s quality of life). Seventy-eight percent (78%) of respondents indicated that most of the time they were able to get around their community easily and 18% were sometimes able to (see Table 21). Only 4% stated that they were never able to get around their community easily. Table 21. Transportation item-specific results
Item n Never Sometimes Most of the time
49. Are you able to get around your community easily?
328 4.2% 17.6% 78.2%

CLBC My Life Final Summary Report May 18, 2011
14
Comparison of Aggregate and Service Provider Qualit y of Life Scores Quality of life scores for the eight domains were calculated not only for the aggregate sample but also for each of the seven participating service providers. Statistically significant differences (p ≤ .05) between each service provider’s scores and the aggregate scores were calculated using independent samples two-tailed t-tests. Results are presented by domain in Table 22. Where the difference between a service provider’s domain score and the aggregate score is statistically significant (p ≤ .05), the service provider’s score is marked with an asterisk (*). Table 22. Summary of significant differences (p ≤ .05) between service provider and aggregate domain scores
Em
otio
nal w
ell-
bein
g
Inte
rper
sona
l re
latio
ns
Mat
eria
l wel
l-be
ing
Per
sona
l de
velo
pmen
t
Phy
sica
l wel
l-be
ing
Rig
hts
Sel
f-de
term
inat
ion
Soc
ial
incl
usio
n
Aggregate 8.68 6.76 7.75 7.08 8.07 7.22 6.57 5.93
BACI 8.62 6.97 7.47 6.77 7.75 7.19 6.73 5.94
CISS 7.28* 6.05 6.60* 6.28 7.30* 7.18 6.12 5.98
CLS 8.88 6.50 8.12 6.97 8.37 7.10 6.36 5.59
H.O.M.E.S 8.97 7.13 7.45 7.45 8.62 7.23 6.62 5.55
LACL 9.12 6.53 7.85 6.85 8.18 7.28 6.15 6.00
Milieu 8.63 6.92 8.17 7.22 8.23 6.28* 6.32 6.03
Semiahmoo 8.41 6.92 7.78 7.86* 8.03 7.77 7.12 6.27 * Statistically significant difference from the aggregate score (p ≤ .05). Table 22 illustrates that average domain scores for service providers were generally similar to the aggregate average scores. Statistically significant differences from the aggregate domain scores were only observed for three service providers: CISS, Milieu, and Semiahmoo:
• In the three domains related to well-being (emotional well-being, material well-being, and physical well-being) CISS’s average scores were lower than the aggregate scores.
• In the area of rights Milieu’s score was lower than the aggregate score.
• In the area of personal development Semiahmoo’s score was higher than the aggregate score.

CLBC My Life Final Summary Report May 18, 2011
15
Relationships between Quality of Life Scores and Respondent Demographic Characteristics Multiple regression analyses were used to determine which demographic variables had a significant relationship (p ≤ .05) with quality of life scores for each domain. The overall domain score served as the dependent variable, while the independent variables included in the regression models were as follows:
• Respondent age • Respondent gender • Legal status (whether there was either committee representation or a representation
agreement in place, or whether neither were in place) • Monthly support costs11 • Employment status (whether respondent had paid employment or not) • Access to transportation (survey question: Are you able to get around your
community easily?) As Table 23 illustrates, three variables were significantly associated with three or more domain scores: monthly support costs, employment status, and access to transportation. Table 23. Summary of significant relationships* of demographic variables with QoL domains
Em
otio
nal
wel
l-bei
ng
Inte
rper
sona
l re
latio
ns
Mat
eria
l wel
l-be
ing
Per
sona
l de
velo
pmen
t
Phy
sica
l wel
l-be
ing
Rig
hts
Sel
f-de
term
inat
ion
Soc
ial
incl
usio
n
To
tal #
of
sig
nifi
can
t re
lati
ons
hip
s
Age 0
Gender 0
No committee or representation agreement 0
Monthly support costs � � � 3
Employed � � � � � � 6
Able to get around community easily
� � � � � � � � 8
Adjusted R2 score� .14 .11 .20 .15 .15 .28 .19 .18 - * p ≤ .05 � Proportion of the total variance explained by the model, adjusted for the number of regressors.
11 As noted earlier in this report, administrative data were only supplied for services provided by the seven participating service providers for the individuals included in their own survey sample, and did not account for services provided to each respondent by other providers. As such, the variable “monthly support costs” includes only those costs accrued by the primary service provider under which the respondent was interviewed, not all monthly support costs that may be attributed to an individual across the entire service system.

CLBC My Life Final Summary Report May 18, 2011
16
Specifically, the following relationships were observed:
• Monthly support costs: As monthly support costs increased, respondents became more likely to have higher scores related to emotional well-being and lower scores related to rights and self-determination.
• Employment status: Having paid employment was related to higher quality of life scores in the areas of interpersonal relations, material well-being, personal development, rights, self-determination, and social inclusion.
• Ability to get around the community easily: As their ease of getting around the community increased, respondents became more likely to have higher overall scores in all domains.
In conclusion, among the eight quality of life domains:
• Higher monthly support costs were positively related to emotional well-being but negatively related to rights and self-determination.
• Paid employment was related to higher quality of life in six out of the eight domains.
• Better mobility within one’s community was related to higher quality of life in all domains.

CLBC My Life Final Summary Report May 18, 2011
17
Impact of Proxy Reporting In order to assess the degree to which the use of proxies has an impact on average domain scores the following analyses were conducted:
• T-tests for independent samples were used to determine whether differences between average domain scores of self-report respondents and individuals represented by proxies were statistically significant (p ≤ .05).
• Regression analyses were conducted to explore the effect of having proxies complete the survey on an individual’s behalf while controlling for other demographic variables.
Significant Differences between Average Domain Scor es by Respondent Type
Statistical analyses were used to determine whether there were significant differences in average domain scores for self-report respondents compared to individuals represented by proxy respondents. As illustrated in Figure 2, differences between average domain scores were statistically significant (p ≤ .05) for all eight domains. Proxies tended to produce higher average scores for the three domains related to well-being (emotional well-being, physical well-being, and material well-being), while self-report respondents tended to produce higher average scores for the remaining five domains (personal development, self-determination, interpersonal relations, social inclusion, and rights). Figure 2. Average domain scores by respondent type
8.14
7.657.49 7.51 7.38
7.04
6.51
7.72
9.36
8.59
8.06
6.54
5.55
6.41
5.2
6.6
0
1
2
3
4
5
6
7
8
9
10
Emotional well-
being*
Physical well-
being*
Material well-
being*
Personal
development*
Self-determination* Interpersonal
relations*
Social inclusion* Rights*
Av
era
ge
do
ma
in s
core
Quality of life domain
Self-report (n=183) Proxy (n=146)
* Difference between domain scores is statistically significant (p ≤ .05)

CLBC My Life Final Summary Report May 18, 2011
18
Relationships between Domain Scores and Response Ty pe (multiple regression results)
It is difficult to determine whether the differences between average domain scores are due to different characteristics of the individual (real individual differences) or differences in reporters (e.g., a respondent effect). In an attempt to account for differences in individual characteristics, respondent type (self-report or proxy) was added to the regression equation for each domain as an independent variable.12 Note, however, that these analyses are limited by the fact that there are no data directly available for level or type of disability, which should be directly related to use of proxy respondents. Rather, it was hoped that total monthly support costs would provide some indication of level of disability, although it is recognized that it is certainly an imperfect indicator. Results suggest that whether the survey was completed via self-report or proxy was significantly related (p ≤ .05) to average domain scores for seven of the eight domains (all but social inclusion). Specific findings suggest that, when controlling for other demographic variables:
• Individuals represented by proxy respondents were more likely than self-report respondents to have higher average domain scores for the three domains related to well-being (emotional well-being, physical well-being, and material well-being).
• Self-report respondents were more likely than individuals represented by proxies to have higher average domain scores for the domains personal development, self-determination, interpersonal relations, and rights.
Conclusion: Impact of Proxy Reporting
Results suggest that respondent type (self-report or proxy) does have an impact on average domain score in at least seven of the eight quality of life domains. In domains related to well-being proxies tend to produce higher domain scores while in the other domains (with the exception of social inclusion) higher scores are observed for self-report respondents. At this point it is unclear whether differences are due to real differences in the individuals represented or due to a respondent effect (i.e., due to who is reporting for an individual). Further data on level or nature of disability may help to untangle this question, although it is likely that a targeted research study would be necessary to more fully understand the reason for the differences in domain scores by respondent type.
12 See section: “Relationships between Demographic Characteristics and Quality of Life Scores” for further discussion on the regression equations.

CLBC My Life Final Summary Report May 18, 2011
19
Internal Consistency Reliability Testing the psychometrics of a survey instrument essentially enables one to determine how “good” a survey is – that is, whether the survey will produce data that are reliable (can be reproduced and are stable) and valid (measure what the instrument intends to measure).13 The items that comprised each domain (n=6) were subjected to internal consistency reliability analysis (calculating Cronbach’s Alpha) to test the degree to which survey items in a given domain measured the same construct. Index reliability scores can be interpreted as follows:
• less than 0.60 = needs work • 0.60 – 0.69 = acceptable • 0.70 – 0.79 = good • 0.80 or higher = very good
Of the eight indices subjected to internal consistency reliability analysis:
• all domains produced reliability scores at the acceptable level or higher (ranging from 0.63 for interpersonal relations to 0.76 for self-determination);
• five domains produced good reliability scores (emotional well-being, personal development, physical well-being, self-determination, and social inclusion); and
• three domains produced scores in the “acceptable” range (interpersonal relations, material well-being, and rights).
The internal consistency reliability of each domain was also compared by respondent group (self-report or proxy). Results indicate that:
• Reliability scores for self-report respondents (n=186) were very close to those for the aggregate sample (n=329), with some variation either above or below the aggregate score (within 0.05 points).
• Reliability scores for individuals represented by proxy respondents (n=143) had slightly more variation from the aggregate, with two domains (emotional well-being and physical well-being) producing somewhat lower reliability scores (differences of 0.24 and 0.18 points, respectively) and one domain (personal development) producing a somewhat higher score (difference of 0.07 points).
Overall, results for index reliability are very positive and indicate:
� The My Life instrument is reliable for the CLBC pilot project population.
� Overall, the My Life instrument is reliable for the two primary respondent groups (self-report respondents and individuals represented by proxies).
� The My Life instrument produces higher levels of reliability for self-report respondents when compared to individuals represented by proxies in the areas of emotional well-being and physical well-being.
13 Litwin. M. 2003. How to Assess and Interpret Survey Psychometrics. 2nd edition. Thousand Oaks, California: Sage Publications.

CLBC My Life Final Summary Report May 18, 2011
20
Discussion of Results The pilot administration of the My Life: Personal Outcomes Index™ by CLBC was focused on testing the use of the tool in British Columbia, establishing and reviewing associated administrative processes, introducing service providers to the tool and its intended purposes (as well as to the concept of quality of life more generally), and obtaining initial quality of life results for the seven participating service providers.
Conclusions
Based on the results obtained through this pilot project, the following conclusions can be drawn:
� Reliability analysis suggests that the My Life instrument is reliable and suitable for the CLBC population.
� Initial findings suggest that, in general, average domain scores for service providers do not differ significantly from the average aggregate domain scores. There were several exceptions to this finding, with at least one statistically significant difference observed for three service providers (but no more than three statistically significant differences observed for a single provider).
� Transportation, conceptualized as ease of getting around one’s community, was shown to be significantly related to all eight quality of life domains in a positive direction.
� Having paid employment was positively related to quality of life in six of the eight domains investigated.
� Respondent type (self-report or proxy) seems to have an impact on average domain scores, with proxies producing higher scores related to the well-being domains (emotional, physical, and material), and self-report respondents producing higher average scores related to the other domains (with the exception of social inclusion).
Recommendations for Moving Forward
It is recommended that the following items be considered when moving forward:
1. Review the process used to determine need for a proxy. A relatively high proportion of surveys were completed via proxy respondents (44% of the total sample). It is recommended that the process used to determine need for a proxy be reviewed in an attempt to discern why the proportion of individuals represented by proxy respondents was so high in the pilot. It may also be helpful to include in this review a discussion with service providers related to how proxy need was determined and which situations typically resulted in the use of proxy reporting.
2. Add “telephone administration” as a checklist op tion under the survey location variable. It is recommended that “telephone administration” be added as a checklist option under the survey location variable. Where the telephone call was made from is not of

CLBC My Life Final Summary Report May 18, 2011
21
great interest, but the fact that the interview was completed via telephone is important.
3. Increase standardization of the form used to col lect respondent demographic information. To increase consistency of reporting of respondent demographic characteristics across service providers, it is recommended that a form be developed with drop-down menus or checklists from which providers can select from a set list of categories for demographic characteristics (e.g., gender, legal status, service type, etc.). More controlled entry of demographic data will reduce: a) the use of differing terminology, b) different interpretation of variable categories, and c) the degree to which blank fields mean data are missing as opposed to being left blank to indicate a variable value (e.g., leaving a field blank rather than selecting “neither” for the legal status variable).
4. Consider collecting information on the level of supports required and/or level of disability. Consider collecting information on the level of supports required and/or level of disability as this may be an important value to include in future regression models to examine relationships between demographic characteristics and quality of life scores.
5. Plans for continuation or expansion of the pilot project should include a detailed sampling plan. When developing any plans for moving forward with additional quality of life surveying of the CLBC population an overall sampling strategy should be developed that takes into account:
a. An overall sampling strategy for the project: That is, whether a small selection of service providers will be included in the project each year, whether all service providers will be included in data collection over a multi-year cycle, etc. Decisions related to sampling strategy will also determine the frequency with which service providers will be sampled. Depending upon the strategy chosen, the frequency of surveying may be influenced by size of provider, with larger providers surveyed more frequently, for example.
b. Size of the service provider: It is not recommended that very small providers be included in the data collection as an independent unit for reasons related to confidentiality. Smaller providers could, however, be combined into a single sampling unit.
c. The frequency with which a given individual can be asked to complete the My Life survey: It is recommended that a minimum time frame during which an individual who has completed the My Life survey cannot be surveyed again as part of the project be established (e.g., one year, three years, etc.).


![Organic Spectroscopy - [IT Services] Personal Pages Index](https://img.dokumen.tips/doc/110x75/613d7160736caf36b75d635c/organic-spectroscopy-it-services-personal-pages-index.jpg)


