Embed Size (px)
Citation preview

VOL. 8, NO. 2, FEBRUARY 2013 ISSN 1819-6608
ARPN Journal of Engineering and Applied Sciences
©2006-2013 Asian Research Publishing Network (ARPN). All rights reserved.
www.arpnjournals.com
136
MV ELECTRICAL NETWORK MAINTENANCE STRATEGY: A NEW MANAGEMENT APPROACH
Mahmoudi Morad1, 2, El barkany Abdellah2 and El khalfi Ahmed2
1National Electricity Office (ONE), Morocco 2Department of Mechanical Engineering, Faculty of Science and Technology/Mechanical Engineering Laboratory,
Road Imouzzer, Sidi Mohamed Ben Abdellah University, Fez, Morroco E-Mail: [email protected]
ABSTRACT
Today’s power electric distribution networks in Morocco are operated in a market sector or liberation is gradual. Managers the public electricity distribution networks are required to provide a number of reliability criteria, while minimizing the total cost spent for efforts made in ensuring the assets and maintain facilities in a proper condition to avoid degradation of the infrastructure. Nevertheless, the availability of this energy for a national emergent economy is very critical, seen the geographical extent of the heritage of strategic assets of networks throughout the country. However the network implements important technical assets that were built and developed over time that we can’t their reserve all the same attention. The MV network asset maintenance activities need to be prioritized as budget and planned maintenance work time is often limited for all work to be carried out. Therefore we must identify that need priority action for reduces the number of operations while not compromising safety and efficiency and focus efforts on the minority elements which cause the majority of the harmful effects of the maintenance. However, the purpose of this paper is to present the deployment of an efficient management in order to establish a policy of optimizing maintenance resources, and to develop an approach for prioritizing maintenance work, to optimize spending, and improve the Key Performance Indicators (KPI’s) of quality of electricity supply (System Average Interruption Duration Index (SAIDI), System Average Frequency Duration Index (SAIFI) and Energy Not Supplied (ENS)). A statistical methodology is adopted to develop a systematic approach based on a multicriteria prioritization matrix, in the objective to optimize the operational management of the maintenance works. Keywords: maintenance, electrical network distribution, optimization, work management, operation, medium voltage. 1. INTRODUCTION Today, in a globalized economy context and facing of increasingly unstable environment or the major and dominant preoccupation of the power electric distribution industry is to have an allowing performance exploitation to guarantee to the better the quality of the supply to end customers [16], permanence and the continuity of the returned service to the clientele and to contribute to simplify the challenges [1, 2]. Indeed the Medium Voltage (MV) networks distribution are undergoing currently an important evolution and are more than ever in full technological, economical and conceptual mutation. The performance of a network depends on the reliability presented by the various constituents, by the way by the way to design them, to build them and maintain them. The patrimony of MV distribution network by these essential components (Haut Voltage (HV)/ Medium Voltage (MV) primary substations, MV Circuit Breakers (CBs), MV overhead lines or feeders and underground cables, MV/Low Voltage (LV) transformation substations, Remote controlled overhead switches or sectionalizes (RCSO), etc.), constitute the most important part of fixed assets and that represent the expensive and complex works for which the degree of reliability of every component is generally raised regardless of technical level used [3]. On the other hand, some practices of exploitation, certain technical decisions or policies of maintenance can weaken the asset and reduce its contribution to the achievement of quality
objectives. The system of the electric distribution network [4, 5] is one of the most critical systems; the most complex and largest of a country, its complexity is mainly owed to the following factors [2]: The network elements are geographically dispersed
and hierarchically interrelated among themselves in non-optimal environmental conditions.
High number and types of distributed strategic assets. Hierarchical structure in the networks of elements
with the levels of accumulation of service to the customers.
The network is dynamic and sudden the configuration and of the operational changes.
Very demanding in human resources and spare parts. However, many factors, such as new regulations, the scarce capital resources, the ageing of the assets distribution network, the reduction of the qualified labor, and the increasing demand of the market in electric power [5, 6]. All these reasons lead public managers to pay more attention for the problems of the maintenance and operations management related to them. The present study was conducted in an Exploitation Maintenance Service (EXMS), in charge of operation and maintenance of MV distribution network at a large metropolitan area of the east of Morocco (province of Oujda in the Oriental Region of Morocco).

VOL. 8, NO. 2, FEBRUARY 2013 ISSN 1819-6608
ARPN Journal of Engineering and Applied Sciences
©2006-2013 Asian Research Publishing Network (ARPN). All rights reserved.
www.arpnjournals.com
137
2. STRATEGY MAINTENANCE OF THE DISTRIBUTION NETWORK, CASE OF MV LINES 2.1. Strategy of maintenance network distribution
The maintenance policy [17] of the distribution network is a complex action, made up of a large number of activities, moving different equipment. It is carried out within a strict regulation framework and must satisfy with the requirements of quality and traceability. Even, if these activities can be grouped into recurring phases (removal, maintenance, etc.) [6, 7]. The Maintenance consists in inspecting in a periodic way the network in order to control his state and his performance level. The network maintenance can be preventive (conditional and systematic) on the basis of a periodic visit in order to ensure a good performance and to reach a technical life span beforehand established, or curative showing itself by repairs with the occurrence of breakdowns and events unforeseen [8].
Indeed the optimal operation of electrical distribution networks is functions of several factors and parameters which influence directly or indirectly the sustainability of service and the operational reliability. Further, the expenditure which generates maintenance work is recorded like Operational Expenditure (OPEX), charged to the operating budget for EXMS. The work of renewal and upgrade involves a heavy investment, from where the need for programming them in the time and for giving off the budget appropriations necessary to their realization. The generated expenditures are registered as an investment budget or Capital Expenditure (CAPEX). With up to 792 MV lines (an overall length of 70417 km) installed on the National Office of Electricity (ONE) distribution network at the end of 2011, it is necessary to establish a standard philosophy of maintenance to make it possible to keep an asset in good state. Thus this asset will be able to carry out effectively and in full safety the service for which it is used. It results a minimization from it from the unforeseen stops caused by breakdowns of equipment. The ONE identifies several types of maintenance to maintain MV lines in good state of walk and to preserve a good quality of service. This one must be well periodically maintained according to a planned maintenance which is translated into different types of visit as an example: Systematic ground inspection and hardware live
control by a visual inspection (insulators, leaks, general condition, etc).
• Visiting line along the corridor on the ground and assembled (checking of the solid mass, of the armaments visits visual lines, checking of the insulators and Manually Controlled Overhead Switch (MCOS), these visits are paid according to a frequency according to the criticality of each line.
The maintenance follows the scheduled unavailability: maintenance of the Auto Recloser and the Sectionaliser (RCS’s), replacement of the defective MCOS (Air break switches manually, Load Break Switches, or Overhead manual switch), MV insulators
replacement over insulation, replacement of the drivers, refurbishment or replacement of connection.
Pruning the hallways of lines and nocturnal visit by using infrared thermo graphic used for systematic control of connection points overheating.
2.2. Planning of the preventive maintenance work The planning of the activities and maintenance work constitutes an important step if the ONE wishes to optimize and synchronize the maintenance interventions. Indeed, it aims at organizing as well as possible the operation activity with upstream the forecasts of work with to make on each asset (action of conditional and systematic preventive maintenance) and downstream the logistics (supplies, stocks and exchanges of parts) and the management of technical and human capacities. The objective is to minimize the duration of fixed asset of the assets and the cost of operation [9, 10]. A program and maintenance process performance, reaching world class standards, constitute today for the public managers an essential lever to increase their productivity. In this context, the expectations of the maintenance function are high and quite thin, the failures, the stops not planned, the rework, and interventions without added-value, on-maintenance and all the other sources of loss of productivity. To know to answer such expectations poses for maintenance managers of the unprecedented challenges. However, the planning of the preventive maintenance is an important subject for any company exploiting a park of equipment when it has a great quantity of strategic and different natures of assets. In other the planning of work constitutes the crossroads of the maintenance management. The objective is to optimize spending commitments both in terms of CAPEX and OPEX, also it aims at increasing the time reserved for the effective realization of work. The annual program of the distribution network maintenance seeks to identify and schedule work in time, to realize on the network asset, while estimating the needs, resources and required constraints. The goal is to improve the reliability and the network operation. This programming is done through a process of decision making which takes account of a set of variables dependant on the network and its environment, the operating conditions, the technical and financial constraints [8, 18]. it is very well known that the fact of not make a scheduled work in time envisaged creates a vicious cycle by the deterioration of the fixed assets, the increase in urgent work and the increase in the costs as shows it the following synoptic diagram in the Figure-1. The realization of the work related to maintenance is essential to ensure the preservation of reliability and the asset performance. However a policy of not-realization in time the work has its limits [7]: • Risk of catastrophic failure involving a major and
prolonged cut due the coincidence of several incidents or failures in cascade (the probability of this phenomenon increases to the general ageing of the network).

VOL. 8, NO. 2, FEBRUARY 2013 ISSN 1819-6608
ARPN Journal of Engineering and Applied Sciences
©2006-2013 Asian Research Publishing Network (ARPN). All rights reserved.
www.arpnjournals.com
138
Need for starting a program of rehabilitation urgently when the equipment is failing and not requires programmed investments.
Degradation of the image of the company as service providers and an electrical network manager.
The costs of emergency repairs are increased.
Figure-1. The vicious cycle. 2.3. Planning by the asset management
Asset management (AM) is an approach that allows following the evolution of a patrimony and to anticipate the work to be realized for its preservation in service and the management of these physical resources throughout its lifetime. It considers the whole of the life cycle (LC) of a good design, installation, exploitation/maintenance and disposal [19]. It takes into account of all that ensures the profit of a good such as the production capacity, the market rates, the conduct of the operations and maintenance. Applied to the maintenance, it is presented in the form of an attempt at unification of various methods and techniques to help the managers to make decisions in an often uncertain context. This uncertainty appears, as well on the economic plan, with the fluctuation of the markets on long run, as on the technical plan with increasingly growing old installations letting plane the doubt about their operating times. [10, 21] described, in his introduction, the assets management as an optimization problem of the capital which seeks to ensure a substantial growth in the long run incomes and benefit all while maintaining lower operational costs and at the same time, by exploiting the system with an elevated level of safety and reliability. According to [11], the problem of AM is a problem of maintenance management in the broad sense (maintenance management) where new information technologies take an important place in the data capture of functioning, of equipments degradation, in their treatment (analyzes and forecast) and in decision making. The author also draws up a portrait of the models of total maintenance management. 2.4. Optimization of the maintenance planning
Obviously, when confronted with an optimization problem, we wish to find the best feasible solution, and
moreover, to have the certainty that there wasn’t the best. A method guaranteeing this fact is known as exact. It was shown [12] that this wish cannot be granted in the general case. The exact methods can be defined only if the optimization problem has a sufficiently rich and exploitable structure. In this paper, ONE studied the possibility to optimize the scheduling of the preventive maintenance interventions based on a new tool for decision support.
The objective aimed in this article is to present, through a study, the deployment of a strategy and to provide an effective and efficient comprehensive management approach seeking the best possible decisions relating to the management of the installations and in order to contribute to the creation of the value and to sit an optimal policy and organizational resources of the maintenance function for the teams in charge of the operation, supervision and maintenance of the MV networks, the principle is that the effective deployment of the resources must be where it is most necessary from an emergency point of view (criticality) and of effectiveness taking account of relative specificities in terms of the available resources, of the procedures and standards in force [20]. 3. APPROACH PROPOSED FOR THE OPTIMIZATION OF MAINTENANCE WORK 3.1. General description
The method that we will present in this article can be defined as a global approach searching the best decisions concerning the operational management of the maintenance works of electric installations, as well as the identification of the causes of non-productivity or lost revenue, for to remedy it.
VOL. 8, NO. 2, FEBRUARY 2013 ISSN 1819-6608
ARPN Journal of Engineering and Applied Sciences
©2006-2013 Asian Research Publishing Network (ARPN). All rights reserved.
www.arpnjournals.com
139
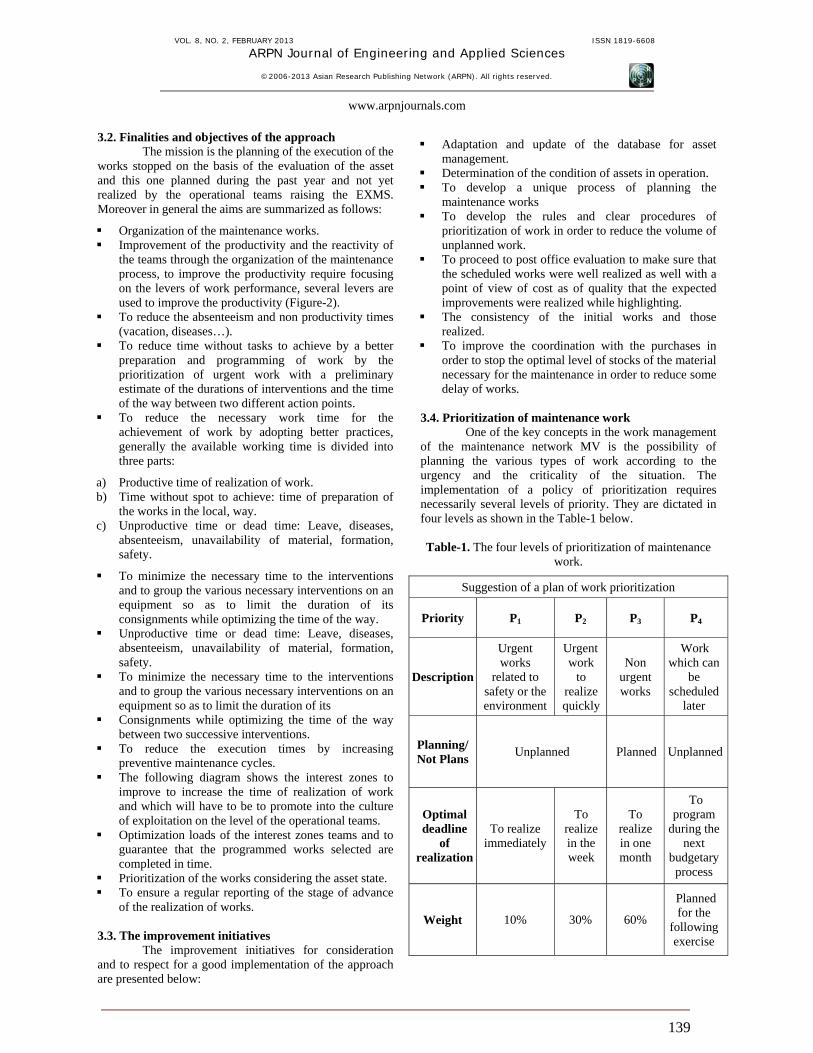
3.2. Finalities and objectives of the approach The mission is the planning of the execution of the works stopped on the basis of the evaluation of the asset and this one planned during the past year and not yet realized by the operational teams raising the EXMS. Moreover in general the aims are summarized as follows:
Organization of the maintenance works. Improvement of the productivity and the reactivity of
the teams through the organization of the maintenance process, to improve the productivity require focusing on the levers of work performance, several levers are used to improve the productivity (Figure-2).
To reduce the absenteeism and non productivity times (vacation, diseases…).
To reduce time without tasks to achieve by a better preparation and programming of work by the prioritization of urgent work with a preliminary estimate of the durations of interventions and the time of the way between two different action points.
To reduce the necessary work time for the achievement of work by adopting better practices, generally the available working time is divided into three parts:
a) Productive time of realization of work. b) Time without spot to achieve: time of preparation of
the works in the local, way. c) Unproductive time or dead time: Leave, diseases,
absenteeism, unavailability of material, formation, safety.
To minimize the necessary time to the interventions and to group the various necessary interventions on an equipment so as to limit the duration of its consignments while optimizing the time of the way.
Unproductive time or dead time: Leave, diseases, absenteeism, unavailability of material, formation, safety.
To minimize the necessary time to the interventions and to group the various necessary interventions on an equipment so as to limit the duration of its
Consignments while optimizing the time of the way between two successive interventions.
To reduce the execution times by increasing preventive maintenance cycles.
The following diagram shows the interest zones to improve to increase the time of realization of work and which will have to be to promote into the culture of exploitation on the level of the operational teams.
Optimization loads of the interest zones teams and to guarantee that the programmed works selected are completed in time.
Prioritization of the works considering the asset state. To ensure a regular reporting of the stage of advance
of the realization of works. 3.3. The improvement initiatives The improvement initiatives for consideration and to respect for a good implementation of the approach are presented below:
Adaptation and update of the database for asset management.
Determination of the condition of assets in operation. To develop a unique process of planning the
maintenance works To develop the rules and clear procedures of
prioritization of work in order to reduce the volume of unplanned work.
To proceed to post office evaluation to make sure that the scheduled works were well realized as well with a point of view of cost as of quality that the expected improvements were realized while highlighting.
The consistency of the initial works and those realized.
To improve the coordination with the purchases in order to stop the optimal level of stocks of the material necessary for the maintenance in order to reduce some delay of works.
3.4. Prioritization of maintenance work
One of the key concepts in the work management of the maintenance network MV is the possibility of planning the various types of work according to the urgency and the criticality of the situation. The implementation of a policy of prioritization requires necessarily several levels of priority. They are dictated in four levels as shown in the Table-1 below. Table-1. The four levels of prioritization of maintenance
work.
Suggestion of a plan of work prioritization
Priority P1 P2 P3 P4
Description
Urgent works
related to safety or the environment
Urgent work
to realize quickly
Non urgent works
Work which can
be scheduled
later
Planning/Not Plans Unplanned Planned Unplanned
Optimal deadline
of realization
To realize immediately
To realize in the week
To realize in one month
To program
during the next
budgetary process
Weight 10% 30% 60%
Planned for the
following exercise

VOL. 8, NO. 2, FEBRUARY 2013 ISSN 1819-6608
ARPN Journal of Engineering and Applied Sciences
©2006-2013 Asian Research Publishing Network (ARPN). All rights reserved.
www.arpnjournals.com
140
3.5. Process of the approach The process [13] that we will adopt for the work
maintenance management includes a set of sub-process formalizes the main activities to be implemented in an earnings target. We find globally three types of process maintenance as shown in Figure-3, the fundamental
processes, (1 until 6), the support process (8) and the process of progress (7), Every process is a set of activities using resources (materials, people, information, procedures…) and producing results (well reconditioned, updated document, respect for deadlines safety of use).
Figure-2. Levers to improve the work and teams productivity.
Figure-3. Approaches proposed for the optimization of maintenance work.

VOL. 8, NO. 2, FEBRUARY 2013 ISSN 1819-6608
ARPN Journal of Engineering and Applied Sciences
©2006-2013 Asian Research Publishing Network (ARPN). All rights reserved.
www.arpnjournals.com
141
3.6. The implementation strategy of initiatives for concerning the approach In this article we will discuss mainly the first draft of all phases involved in the different steps of the approach relative to the maintenance work management. In a general way to attain the principal objective of the strategy, it is necessary to respect the following guidelines:
An exhaustive and reliable database of work management during all the lifetime is fundamental to better understand the nature of disturbances and to make the gathered information readily available to the utility for the installation of an effective asset management.
Prioritization based on the expected gain, (i.g. prioritize actions where the expected gain is the highest in the short term), and to respect the availability of the resources.
Two basic assumptions underpin the study and takings into account namely: The study does not address OPEX options. The study assumes that networks are reasonably
maintained and operated normally. 3.7. Stages of the approach of maintenance works management The mission of the entities in charge of this shutter is planning the execution of work orders based on the valuation of assets and planned work during the past year and not yet realized. The proposed target process suggested is centered on the exhaustive identification of the requirements in maintenance by proceeding to a visit of the asset managed by EXMS, before the launch of the preparation of the Annual Plan for Preventive Maintenance Project (APPMP). In what follows we pass to identify the various stages constituting the approach namely:
a) To diagnose and evaluate the existing maintenance process.
b) To diagnose and set up a detailed and thorough analysis of the network status: a global physical inspection of the network during a predefined period of the N-1 year for a period of 3 months.
c) To identify the volume of the estimated work load necessary on the basis of the total inspection of the network.
d) Confrontation of the available resources with those necessary for the realization of the totality of identified works.
e) To identify of capacity and potential existing and available at EXMS level: To develop and determine the potential available in HMO (Heure Main d'Oeuvre or Man x Hour Worked) on the basis of operational. This valorization enabled us to release the available potential for each team during one year of exercise.
f) To identify the potential target for the realization of the totality of the projected works, it will be calculated for each team on the basis:
A timing and standard normative durations for to make each operation of maintenance.
The Frequency of each operation, and the travel time.
g) To develop the projected maintenance plan. h) To release and identify the eventual gap for analysis
with an interpretation of the results with regional staff to ensure a comprehension of the influences of maintenance and exploitation and the difficulties.
i) To post the gap between the needed and existing HMO.
j) To propose recommendations on the basis the noted gaps with the implementation of tools and necessary methods to fill the gap.
k) To develop the rules and the procedures for prioritizing works, and MV asset by criticality.
l) To size and modernize operational logistics. m) To define the operating ranges by electrical
installations (HV/MV and MV/LV substations, MV Lines).
n) To optimize the program and the preventive maintenance plan (deadlines and resources).
o) To finalize the optimized preventive maintenance plan and introduced ranges maintenance in a CMMS (Computerized maintenance management system), to automate creation, the edition and the follow-up of the works orders [18].
p) To formalize the monitoring of execution of the maintenance program.
4. CASE STUDY: THE MAINTENANCE OF THE MV LINES
The studied example constitutes the first sketch of a work carried out within EXMS Oujda. Its objective is to show the importance of the method proposed in this article, in the ground and to really concretize it in industry. 4.1. The stages of the optimization approach of the maintenance plans The steps are as follows:
(i) Identification of the necessary works: In order to know the state of the networks and to identify the requirements for estimated maintenance work, census initiatives and data collection relating to the networks were led within the framework of preparation of the annual preventive maintenance plan of 2011.
(ii) Identification of the available capacity:
a) Identification of the operational teams: 3 teams’ maintenance MV lines, each team is in charge of the exploitation and maintenance of a number of lines on a well determined territory according to administrative national territorial cutting.
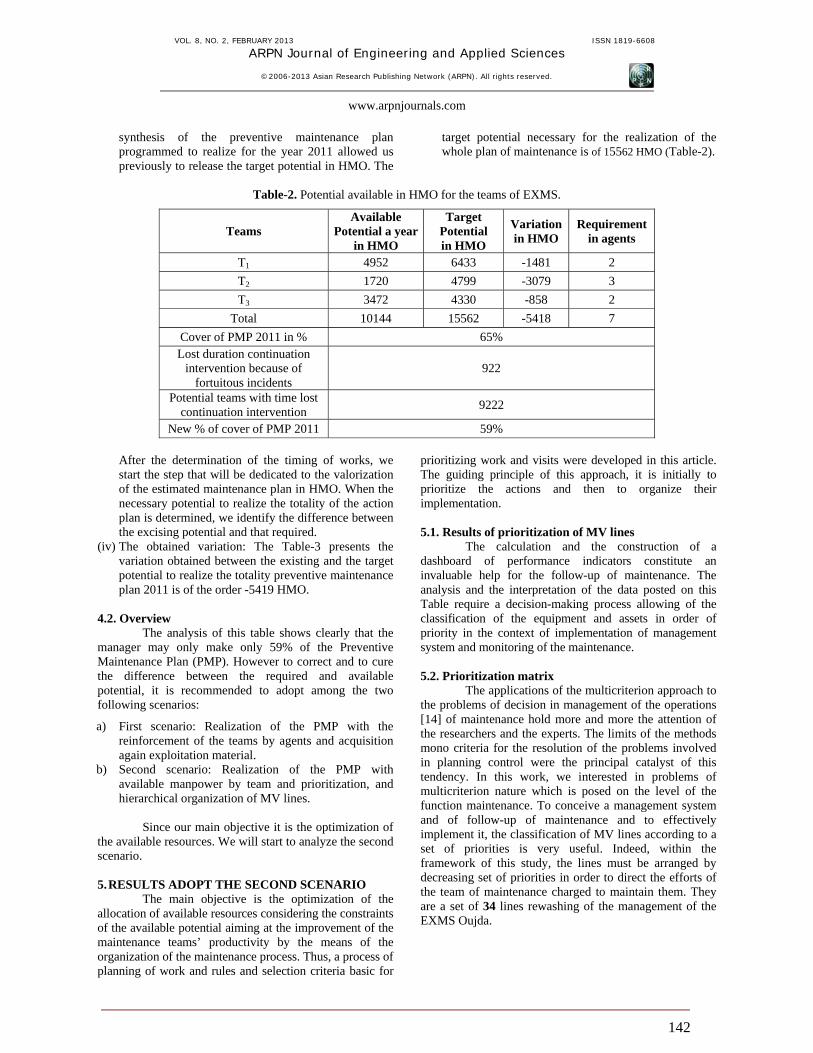
b) The available global potential is about 10144 HMO, is presented in Table-2.
(iii) Identification of the target potential and valorization of the plan of preventive maintenance plan. The identification of potential is based on a separation between the necessary needs for the preventive works and those for the systematic visits (Visit on the ground, the gone up visit and night visits). The
VOL. 8, NO. 2, FEBRUARY 2013 ISSN 1819-6608
ARPN Journal of Engineering and Applied Sciences
©2006-2013 Asian Research Publishing Network (ARPN). All rights reserved.
www.arpnjournals.com
142
synthesis of the preventive maintenance plan programmed to realize for the year 2011 allowed us previously to release the target potential in HMO. The
target potential necessary for the realization of the whole plan of maintenance is of 15562 HMO (Table-2).
Table-2. Potential available in HMO for the teams of EXMS.
Teams Available
Potential a year in HMO
Target Potential in HMO
Variationin HMO
Requirement in agents
T1 4952 6433 -1481 2 T2 1720 4799 -3079 3 T3 3472 4330 -858 2
Total 10144 15562 -5418 7 Cover of PMP 2011 in % 65% Lost duration continuation
intervention because of fortuitous incidents
922
Potential teams with time lost continuation intervention 9222
New % of cover of PMP 2011 59%
After the determination of the timing of works, we start the step that will be dedicated to the valorization of the estimated maintenance plan in HMO. When the necessary potential to realize the totality of the action plan is determined, we identify the difference between the excising potential and that required.
(iv) The obtained variation: The Table-3 presents the variation obtained between the existing and the target potential to realize the totality preventive maintenance plan 2011 is of the order -5419 HMO.
4.2. Overview The analysis of this table shows clearly that the manager may only make only 59% of the Preventive Maintenance Plan (PMP). However to correct and to cure the difference between the required and available potential, it is recommended to adopt among the two following scenarios:
a) First scenario: Realization of the PMP with the reinforcement of the teams by agents and acquisition again exploitation material.
b) Second scenario: Realization of the PMP with available manpower by team and prioritization, and hierarchical organization of MV lines.
Since our main objective it is the optimization of the available resources. We will start to analyze the second scenario. 5. RESULTS ADOPT THE SECOND SCENARIO
The main objective is the optimization of the allocation of available resources considering the constraints of the available potential aiming at the improvement of the maintenance teams’ productivity by the means of the organization of the maintenance process. Thus, a process of planning of work and rules and selection criteria basic for
prioritizing work and visits were developed in this article. The guiding principle of this approach, it is initially to prioritize the actions and then to organize their implementation. 5.1. Results of prioritization of MV lines
The calculation and the construction of a dashboard of performance indicators constitute an invaluable help for the follow-up of maintenance. The analysis and the interpretation of the data posted on this Table require a decision-making process allowing of the classification of the equipment and assets in order of priority in the context of implementation of management system and monitoring of the maintenance. 5.2. Prioritization matrix
The applications of the multicriterion approach to the problems of decision in management of the operations [14] of maintenance hold more and more the attention of the researchers and the experts. The limits of the methods mono criteria for the resolution of the problems involved in planning control were the principal catalyst of this tendency. In this work, we interested in problems of multicriterion nature which is posed on the level of the function maintenance. To conceive a management system and of follow-up of maintenance and to effectively implement it, the classification of MV lines according to a set of priorities is very useful. Indeed, within the framework of this study, the lines must be arranged by decreasing set of priorities in order to direct the efforts of the team of maintenance charged to maintain them. They are a set of 34 lines rewashing of the management of the EXMS Oujda.
VOL. 8, NO. 2, FEBRUARY 2013 ISSN 1819-6608
ARPN Journal of Engineering and Applied Sciences
©2006-2013 Asian Research Publishing Network (ARPN). All rights reserved.
www.arpnjournals.com
143
5.3. Methodology of classification and priorisation of MV lines: multicriteria matrix of the classification
The approach that we adopted to address this problem articulates, as it is besides the case for most multicriteria approaches, around eight principal stages. We can couple this method with that of Pareto [15]. Indeed, we can determine the Pareto classes using as a classification criterion, the statistical data, the balanced total notes obtained by the multicriteria matrix. Due to the great
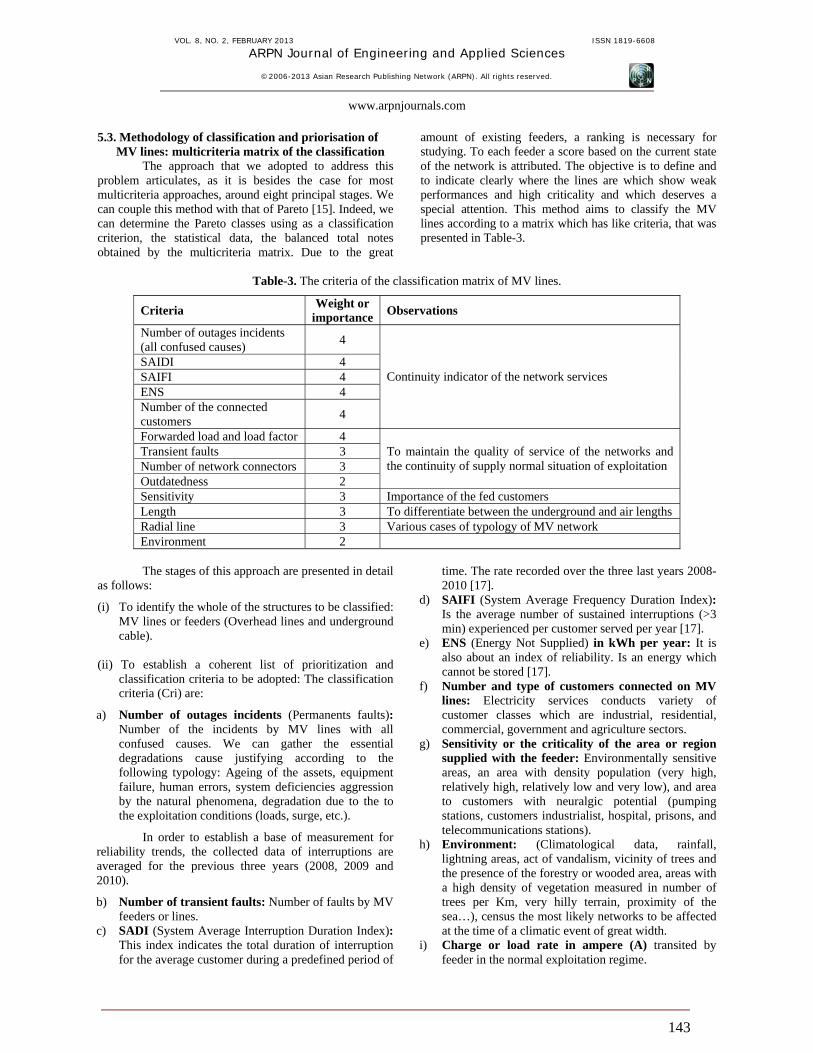
amount of existing feeders, a ranking is necessary for studying. To each feeder a score based on the current state of the network is attributed. The objective is to define and to indicate clearly where the lines are which show weak performances and high criticality and which deserves a special attention. This method aims to classify the MV lines according to a matrix which has like criteria, that was presented in Table-3.
Table-3. The criteria of the classification matrix of MV lines.
Criteria Weight or importance Observations
Number of outages incidents (all confused causes) 4
SAIDI 4 SAIFI 4 ENS 4 Number of the connected customers 4
Continuity indicator of the network services
Forwarded load and load factor 4 Transient faults 3 Number of network connectors 3 Outdatedness 2
To maintain the quality of service of the networks and the continuity of supply normal situation of exploitation
Sensitivity 3 Importance of the fed customers Length 3 To differentiate between the underground and air lengths Radial line 3 Various cases of typology of MV network Environment 2
The stages of this approach are presented in detail as follows:
(i) To identify the whole of the structures to be classified: MV lines or feeders (Overhead lines and underground cable).
(ii) To establish a coherent list of prioritization and
classification criteria to be adopted: The classification criteria (Cri) are:
a) Number of outages incidents (Permanents faults): Number of the incidents by MV lines with all confused causes. We can gather the essential degradations cause justifying according to the following typology: Ageing of the assets, equipment failure, human errors, system deficiencies aggression by the natural phenomena, degradation due to the to the exploitation conditions (loads, surge, etc.).
In order to establish a base of measurement for reliability trends, the collected data of interruptions are averaged for the previous three years (2008, 2009 and 2010).
b) Number of transient faults: Number of faults by MV feeders or lines.
c) SADI (System Average Interruption Duration Index): This index indicates the total duration of interruption for the average customer during a predefined period of
time. The rate recorded over the three last years 2008-2010 [17].
d) SAIFI (System Average Frequency Duration Index): Is the average number of sustained interruptions (>3 min) experienced per customer served per year [17].
e) ENS (Energy Not Supplied) in kWh per year: It is also about an index of reliability. Is an energy which cannot be stored [17].
f) Number and type of customers connected on MV lines: Electricity services conducts variety of customer classes which are industrial, residential, commercial, government and agriculture sectors.
g) Sensitivity or the criticality of the area or region supplied with the feeder: Environmentally sensitive areas, an area with density population (very high, relatively high, relatively low and very low), and area to customers with neuralgic potential (pumping stations, customers industrialist, hospital, prisons, and telecommunications stations).
h) Environment: (Climatological data, rainfall, lightning areas, act of vandalism, vicinity of trees and the presence of the forestry or wooded area, areas with a high density of vegetation measured in number of trees per Km, very hilly terrain, proximity of the sea…), census the most likely networks to be affected at the time of a climatic event of great width.
i) Charge or load rate in ampere (A) transited by feeder in the normal exploitation regime.

VOL. 8, NO. 2, FEBRUARY 2013 ISSN 1819-6608
ARPN Journal of Engineering and Applied Sciences
©2006-2013 Asian Research Publishing Network (ARPN). All rights reserved.
www.arpnjournals.com
144
j) Number of connectors (connected MV/LV stations, connections network): The full number of connections installed on a fedeer (to determine and extract starting from the base from the data of software IRD (Software of inventory of MV and LV distribution networks used by the ONE.)) is equal to the sum:
Number of the MV/LV transformer substations, RCS and the MCOS installed on the principal line (Lp), distributed branch (derivations).
Numbers of the sleeves of inking and junction to be crimped (intended to ensure the mechanical stop of the driver, etc) by lines.
Number of MV cable joints, cable terminations, cable joint boxes and Heat shrinkable pothead by feeders.
l) Radial line: With few or not alternative options of supply in the event of breakdowns of the network. We determine is what the fedeer is guaranteed by one in the case of helps interruption of electrical energy at the time of incidents, or in the case of unavailability.
m) Outdatedness or the rate of out datedness: It is a measurement of the ageing of the network. It characterizes the state of out datedness of the network [7], plus this rate is high, better is the state of the network.
n) Length by MV line (Overhead lines and underground cable): For various types of networks going of short urban networks or longer rural overhead grids, the number of the incidents increases with the length resulting in a reduction from the performances from the rural networks compared to the urban networks.
(iii) Attribution a weighting coefficient Pi from 0 to 4 to each of those criteria to give an account of the relative importance of the one compared to the other. The second phase consisted in distributing a set of 4 points between the various criteria by respecting the preceding classification.
0: Not taken into account 1: Low importance 2: Medium importance 3: High importance 4: Very high importance
(iv) Attribution for each line (j), from classification (i), a
note (Aij), this note goes from 1 to 4. (v) Calculate balanced note which is equal to the given
note multiplied by the corresponding weighting factor and to inform the multicriterion matrix. The values of the classification criteria will be treated by the law of PARETO and the quartile method to make it possible to classify MV lines in 4 categories.
(vi) Attribution annotations of the lines for the criteria related to the continuity of service:
The note 4 is allotted to the lines which return in the slice of the first 80% of the sum of the values of the concerned classification criterion.
The note 3 is attributed to the lines which return in the slice [80%; 90%] of the sum of the values of the concerned classification criterion.
The note 2 is attributed to the lines which return in the slice [90%; 95%] of the sum of the values of the concerned classification criterion.
The note 1 is attributed to the departures which return in the slice [95%; 100%] of the sum of the values of the concerned classification criterion.
For the two following criteria (Outdatedness and Sensitivity) we proceeded to the following notation:
⇒ Outdatedness and sensitivity
Attribution of note 4 to the MV lines whose age exceeds 20 years, and that supply the nerve centers: Palace, seat of province… etc.
Attribution of note 3 with the lines HTA whose age is between 15 and 20 years, and that supply the important urban centers and the industrial sites.
Attribution of note 2 to the MV lines whose age is between 10 and 15 years, and which feed from the urban centers.
Attribution of note 1 to the MV lines whose age is lower than 10 years, and that supply the rural regions.
(vii) Calculate, for each line, the total balanced note Vj which is equal to the sum of the balanced notes relating to all the adopted criteria of classification.
In conclusion for each work, a balanced note is calculated as the watch the following in equation (1):
( )∑=
=×=
ji
1iAijPiV j
(1)
With:
Aij: the attributed note for line Lj of the classification criterion i.
Pi: the weight of the classification criterion of i.
(viii) Classification of the MV lines in decreasing order of their total balanced note Vj.
(ix) Determination of the groups of MV lines criticizes whose total balanced note is higher or equal to the already selected threshold. In continuation the MV lines will be classified according to the method of the quartiles for the Vj notes which form a statistical series. This statistical method used to classify the lines in four parts. The MV lines are classified in four families on the basis the final notation. These notations are given on the basis of quartile (Q1, Q2, Q3) of the statistical series consisted the results of the balanced notes obtained by MV lines:
a) F1: The note 4 is attributed to this family which includes the lines which have a very high criticality (Most Perturbed Lines) which requires a technical particular follow-up in time. This note is attributed to family whose balanced note is in the slice [Value min-Q1].

VOL. 8, NO. 2, FEBRUARY 2013 ISSN 1819-6608
ARPN Journal of Engineering and Applied Sciences
©2006-2013 Asian Research Publishing Network (ARPN). All rights reserved.
www.arpnjournals.com
145
b) F2: The note 3 is attributed to this family which includes the lines which have a high criticality. This note is attributed to family whose balanced note is in the slice [Q1-median].
c) F3: The note 2 is attributed to this family which includes the lines which have an average or semi-stable criticality. This note is attributed to family whose balanced note is in the slice [median-Q3].
d) F4: The note 1 is attributed to this family which includes the lines which have a low or stable criticality. This note is attributed to family whose balanced note is in the slice [Q3-value max].
5.4. Classification result of MV lines
The Table-4 summarizes the classification or feeders ranking results that we obtained for the 34 MV lines managed by EXMS of Oujda after prioritization and optimization made.
This classification of MV lines allowed us to highlight the total lengths by family of criticality for each team. This ranking of the lines was established to identify the frequency and the periodicity to be redefined for each visit. They got results one adopting this prioritization of the lines and by frequency of visits given to each line according to the criteria of criticality, enabled us to obtain HMO after priorisation of MV lines. The result shows that the necessary target potential in HMO for the realization of the whole maintenance plan after the priorisation is of 12228 HMO (Table-5).
An approach is adopted to modernize the operational logistics of the teams’ uses benchmarking studies with other managers either nationally or internationally. We could improve the team’s productivity
by gaining 1100 HMO at the end of 2011; this time was calculated on the basis of timing on the ground of various maintenance actions by using these new materials by the exploiting. The following table summarizes these results. In recapitulates, the principal obtained results with the implement of this approach of work maintenance management of MV lines in the 2011 financial year are: a) The percentage of realization of the PMP obtained
after prioritization of the lines is about 85%. Thus from performance point of view and with the existing potential, the adoption of this prioritization with made it possible to improve the capability of execution of PMP of 25% on the level of EXMS province of Oujda.
b) The approach of work maintenance management implementation beyond an increase of the system reliability measured by the full number of the incident and interruptions provided a reduction of 33% of the number of incidents at the end of 2011 financial year comparing the 2010 result.
c) The reduction of 25% of the HMO with worked in the maintenance activities which generated a reduction of 20% of the OPEX.
d) Improvement on the indicators of performance SAIDI and SAIFI respectively by 30% and 40%.
e) On the other hand, the achieved result was a reduction of 25% in ENS comparing the 2010 and 2009.
f) For the second scenario which is based on the recruitment of 7 agents, the performance of realization of the PMP is estimated with the order of 100%.
Table-4. Classification result of MV lines.
MV Line Cumulated notation % Final classification Family Criticality
1 140 4.5 4 2 134 4.3 4 3 129 4.1 4 4 128 4.1 4 5 128 4.1 4 6 125 4.0 4 7 115 3.7 4 8 114 3.6 4 9 107 3.4 4
F1
Very high criticality (or must
perturbed lines)
10 105 3.3 3 11 103 3.3 3 12 102 3.3 3 13 100 3.2 3 14 99 3.2 3 15 99 3.2 3 16 99 3.2 3 17 96 3.1 3
F2 High
Criticality

VOL. 8, NO. 2, FEBRUARY 2013 ISSN 1819-6608
ARPN Journal of Engineering and Applied Sciences
©2006-2013 Asian Research Publishing Network (ARPN). All rights reserved.
www.arpnjournals.com
146
18 95 3.0 2 19 86 2.7 2 20 83 2.6 2 21 81 2.6 2 22 81 2.6 2 23 78 2.5 2 24 72 2.3 2 25 69 2.2 2 26 68 2.2 2
F3 Medium or semi stable criticality
27 67 2.1 1 28 67 2.1 1 29 66 2.1 1 30 66 2.1 1 31 64 2.0 1 32 63 2.0 1 33 61 1.9 1 34 45 1.4 1
F4 Low or stable
criticality
Total 3135
Table-5. The obtained earnings after the priorisation of the visits by line.
Teams Total duration in
HMO visits with prioritization
Total duration in HMO visits without
prioritization
Earnings in HMO visits
Time to recover by use again material
in HMO T1 4541 5277 736 T2 1874 3875 2001 T3 3186 3783 597
1100
Total 9600 12934 3334 1100 6. FUTURE PROSPECTS
The approach outlined in this paper supports the assessment of a new optimization maintenance strategy as applied to MV lines distribution networks. Outcomes are measured in terms of OPEX, energy not supplied, cost of un-served energy and reliability measurement indices such as SAIDI and SAIFI. The approach is pragmatic using readily available network information, and a range of inputs relating to network. Indeed, the successful completion and implementation of the approach summarized in this paper are intended to make a quantum step change in the quality and effectiveness of ONE Distribution Network maintenance. The approach was being validated by the Top management of the ONE distribution and will be generalized and will be demonstrated on other assets of the ONE distribution network (LV lines, MV/LV transformation substations) for a number of investment scenarios with the intention to inform strategies to ensure appropriate investment that balances the costs and benefits of improving network performance (Provides input into the forecasting of OPEX and CAPEX budgets). To further illustrate the application of the model we construct two scenarios and investigate the impact of the approach on network Key performance
indicators (SAIDI and SAFI) as follows: First we investigate the reliability implications of operational improvements, and lastly, we investigate infrastructure (CAPEX) interventions applied with the sole objective of reducing SAIDI and SAFI for the other MV distribution assets. CONCLUSIONS
Today, reducing operations and maintenance costs and preserving service reliability are the top priorities for managers of utility distribution systems. In the present study, we have proposed a methodological approach aiming for planning maintenance actions sound and should provide utilities with a structured approach to a maintenance program with an optimum balance between cost of maintenance and reliability improvement, and to maintain functionality under safe and efficient conditions of the distribution network. Evident that a coordinated and integrated approach is required to balance operational improvements, capital expenditure, optimize the maintenance work. On the basis of the results we can formulate general conclusion Overall value obtained as follows.
VOL. 8, NO. 2, FEBRUARY 2013 ISSN 1819-6608
ARPN Journal of Engineering and Applied Sciences
©2006-2013 Asian Research Publishing Network (ARPN). All rights reserved.
www.arpnjournals.com
147
New optimal strategy has been found that decreases the OPEX, SAFI and SADI.
Reduction of the component failure rates for major components of MV lines, and improvement the rate of realization of the PMP (in practice this could be achieved through. better execution of maintenance).
Reduction of the man x hour worked in the MV line maintenance activities and reduction on operational expenditures
Demonstrated the practical application of our proposed approach to a real-world section of the ONE distribution network (MV lines).
Demonstrated that alternative scenarios and strategies can have very different outcomes and implications (costs and benefits as well as equipment / logistics requirements).
Finally, for a better enclosing this stage of this work, one is brought to propose simple recommendations for better encircling and reinforcing this classification.
This approach of prioritization must be dynamic and
revise each time a variation of at least selection criteria taken into account is observed.
The approach developed is generic; it can be applied to other Distribution Network Service Providers (DNSP) and with only a modest investment in terms of resources and with limited technical information (such as gas, water, telecommunications companies, etc.).
ACKNOWLEDGEMENTS
The authors are indebted to the many colleagues at the National Electricity Office of Morocco who have contributed significantly to the development of this approach. This approach only works if there is effective collaboration between all those who share knowledge and experience of the assets.
REFERENCES [1] L. Bertling. 2002. Reliability Centered Maintenance
for electric power distribution systems. Ph.D. thesis, Department of Electrical Power Engineering, Rotal Institue of Technologie KTH, Stockholm, Sweden.
[2] Energies. 2007. Human development in rural areas-Animator Handbook-Field: Electricity-version of February 22. Available at: (http://www.energies.ma).
[3] M. Hamadache. 2010. Détermination des besoins pour
l'élaboration d'une stratégie de maintenance des équipements automatisés du réseau aérien de distribution d'électricité à moyenne tension. M.S. thesis, Department of Automated Production Engineering, ETS, Montréal, Canada.
[4] P. Hilber. 2008. Maintenance Optimization for Power
Distribution Systems. Ph.D. thesis, Department of Electrical Power Engineering, Rotal Institue of Technologie KTH, Stockholm, Sweden. pp. 1-12.
[5] Küssel R and V. Liestmann. 2000. Tele Service a customer oriented and efficient service. Journal of Materials Processing Technology. 107(1): 363-371.
[6] A. Orcesi. 2008. Étude de la performance des réseaux
d’ouvrages d’art et détermination des stratégies de gestion optimales. Ph.D. dissertation, Paris XII University, Paris, French.
[7] Service de l’électricité de Lausanne (SEL). 2005. Plan
de renouvellement du réseau de distribution électrique du SEL, Planification des investissements. Lausanne, Switzerland. Available at http://www.lausanne.ch/UploadedAsp.
[8] A. Nafi. 2006. La programmation pluriannuelle du
renouvellement des réseaux d’eau potable. PhD thesis, Louis Pasteur Strasbourg I Univesity, Strasbourg, France.
[9] M. Masmoudi and A. Haït. 2010. Planification sous incertitudes de la maintenance des Hélicoptères. Proceedings at 11th Annual Congress of ROADEF, February 24-26, Toulouse, France.
[10] Z. Schreinerm. 2004. Asset management optimization, a new approach to protection maintenance. In IET Conference Publications, Proceedings of the 8th IEE International Conference on Developments in Power System Protection, Amsterdam, April, 5-8. 1: 289-294.
[11] D. Sherwin. 2000. A review of overall models for
maintenance management. Newspaper of Quality in Maintenance Engineering. 6(3): 138-164.
[12] W. Baritompa. 1998. Total optimization requires total information. Newspaper of Optimization Theory and Applications. 96(3): 575-588.
[13] H. El Aoufir and D. Bouami. 2007. Proposition d’un schéma d’évolution des structures maintenance. Paper presented at the 5th International Conference on Integrated Design and Production (CPI'2007), 22-24 Octobre, Rabat, Morocco.
[14] A. Chelbi and D. Ait-kadi. 2002. Classification of the equipment by set of priorities for maintenance: a multicriterion approach. Journal of decision systems. 11(1): 91-108.
[15] B. Herrou and M. Elghorba. 2005. Démarche
d’optimisation du plan d’action maintenance, étude de cas d’une PME marocaine. Proceedings at the 4th International Conference on Integrated Design and Production (CPI'2005), November 09-11, Casablanca, Morocco.
[16] J. Setreus 2011. Identifying critical components for system reliability in power transmission systems.

VOL. 8, NO. 2, FEBRUARY 2013 ISSN 1819-6608
ARPN Journal of Engineering and Applied Sciences
©2006-2013 Asian Research Publishing Network (ARPN). All rights reserved.
www.arpnjournals.com
148
Ph.D. thesis, Department of Electrical Power Engineering, Royal Institue of Technologie KTH, Stockholm, Sweden.
[17] O. Opeyemi and F. Al Hassan. 2012. Energy Systems Maintenance. Journal of Energy and Power Engineering. Vol.4, No11. pp 8-18. doi:10.4236/epe.2012.41002.
[18] A. Salonen. 2011. Strategic maintenance development in manufacturing industry. Ph.D. thesis, Department of Electrical Power Engineering, School of Innovation, Design and Engineering, Mälardalen University, Västerås, Sweden.
[19] G. Haifeng. 2010. Maintenance Optimization for Substations with Aging Equipment. Ph.D. thesis, Department of Electrical Engineering, University of Nebraska, Lincoln, Nebraska, USA.
[20] K. Komonen. 2009. Asset management: capacity, operation and and maintenance. Promaint. Vol. 6. Helsinki Finland.


![Electrical Machines Laboratory - Terco [Swedish] · electrical machines with 60 Hz ratings. MV 1026-225 Electric Torque Meter System As MV 1036-225, but the drive motor has a double](https://img.dokumen.tips/doc/110x75/5e68f9af6eb6c136d81cb8d6/electrical-machines-laboratory-terco-swedish-electrical-machines-with-60-hz.jpg)