Embed Size (px)
Citation preview
Mutual Fund ScreenerFor the quarter ended Mar-17
ICRA Online LtdA Group ICRA company

Mutual Fund Screener – What’s Inside
01
Industry
QAAUM
02
Inflow Outflow
Analysis
03
Sector
Update
05
Industry
Insights
06
SEBI Investor
Survey 2015
04
Category
Performance
07
Regulatory
Update

INDUSTRY QAAUM
Section I

Industry QAAUM hits another high, Rs. 136,244 cr
added in Q4FY17
Industry QAAUM grew for the 14th consecutive period in Q4FY17
The 8.05% Q-o-Q growth in QAAUM was driven by strong participation by retail investors, robust inflow in
equity schemes through SIP, and mark to market gains
Growth in QAAUM for the Quarter Ended Mar-17
AMCs Range
Top 5 6% to 12%
Next 10 4% to 18%
Rest -20% to 37%Source: AMFI; ICRA Online Research. AMC list based on Mar-17 QAAUM
ICRA Online Limited 41AMFI
AUM of the mutual fund industry has increased five
times in the last decade1 and is expected to touch the
magical figure of Rs. 20 trillion in CY17
Mar-17,
1,829,583 Dec-16,
1,693,339
Mar-16,
1,353,443
0
500,000
1,000,000
1,500,000
2,000,000
Mar-17 Dec-16 Mar-16
QA
AU
M (
n R
s. C
rore
)
Mutual Fund Industry (QAAUM)
Source: AMFI, ICRA Online Research; QAAUM – Quarterly Average
Assets Under Management
Q-o-Q
8%
Y-o-Y
35.2%

Top 10 AMCs account for ~81% of QAAUM
ICRA Online Limited 5
0%
3%
6%
9%
12%
15%
0
50,000
100,000
150,000
200,000
250,000
ICICI
Prudential
Mutual Fund
HDFC
Mutual Fund
Reliance
Mutual Fund
Birla Sun Life
Mutual Fund
SBI Mutual
Fund
UTI Mutual
Fund
Kotak
Mahindra
Mutual Fund
Franklin
Templeton
Mutual Fund
DSP
BlackRock
Mutual Fund
IDFC Mutual
Fund
Q-o
-Q G
row
th (
In %
)
AU
M (
in R
s. C
rore
)
Top Ten AMCs
Mar-17 Dec-16 Q-o-Q
Source: AMFI, ICRA Online Research
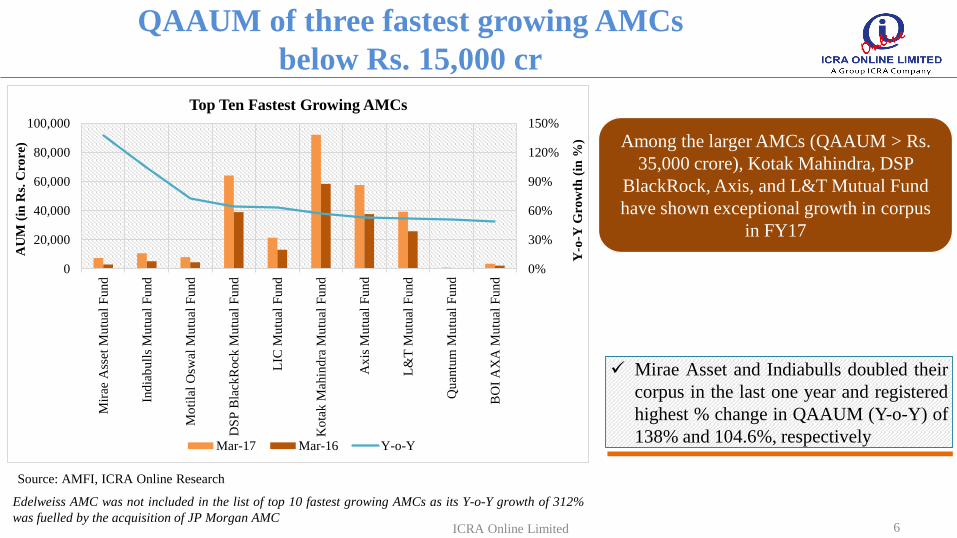
QAAUM of three fastest growing AMCs
below Rs. 15,000 cr
Edelweiss AMC was not included in the list of top 10 fastest growing AMCs as its Y-o-Y growth of 312%
was fuelled by the acquisition of JP Morgan AMC
Mirae Asset and Indiabulls doubled their
corpus in the last one year and registered
highest % change in QAAUM (Y-o-Y) of
138% and 104.6%, respectively
Among the larger AMCs (QAAUM > Rs.
35,000 crore), Kotak Mahindra, DSP
BlackRock, Axis, and L&T Mutual Fund
have shown exceptional growth in corpus
in FY17
ICRA Online Limited 6
0%
30%
60%
90%
120%
150%
0
20,000
40,000
60,000
80,000
100,000
Mir
ae A
sset
Mu
tual
Fun
d
Ind
iab
ull
s M
utu
al F
und
Mo
tila
l O
swal
Mu
tual
Fu
nd
DS
P B
lack
Rock
Mu
tual
Fun
d
LIC
Mu
tual
Fu
nd
Ko
tak
Mah
ind
ra M
utu
al F
un
d
Ax
is M
utu
al F
un
d
L&
T M
utu
al F
un
d
Qu
antu
m M
utu
al F
und
BO
I A
XA
Mutu
al F
un
d
Y-o
-Y G
row
th (
in %
)
AU
M (
in R
s. C
rore
)
Top Ten Fastest Growing AMCs
Mar-17 Mar-16 Y-o-Y
Source: AMFI, ICRA Online Research
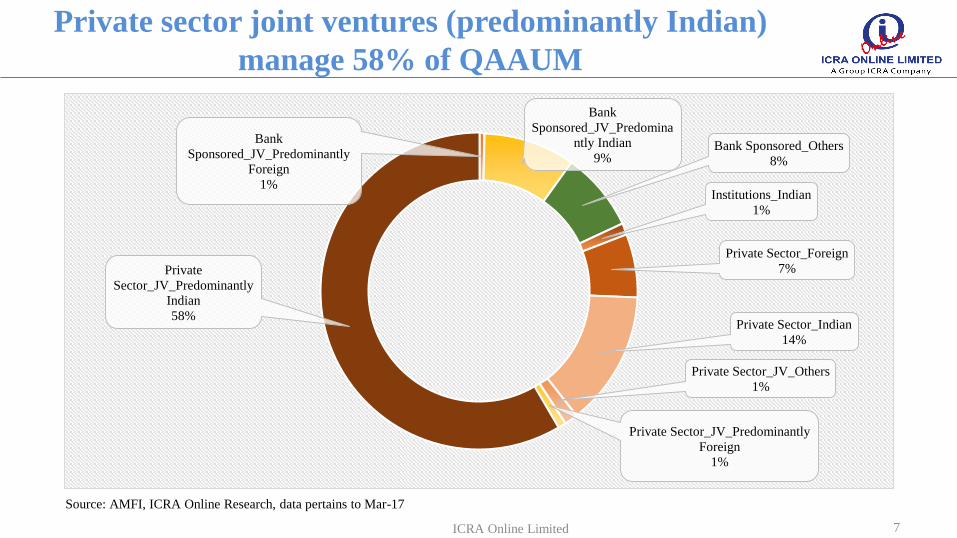
Private sector joint ventures (predominantly Indian)
manage 58% of QAAUM
ICRA Online Limited 7
Bank
Sponsored_JV_Predominantly
Foreign
1%
Bank
Sponsored_JV_Predomina
ntly Indian
9%Bank Sponsored_Others
8%
Institutions_Indian
1%
Private Sector_Foreign
7%
Private Sector_Indian
14%
Private Sector_JV_Others
1%
Private Sector_JV_Predominantly
Foreign
1%
Private
Sector_JV_Predominantly
Indian
58%
Source: AMFI, ICRA Online Research, data pertains to Mar-17
INFLOW OUTFLOW ANALYSIS
Section II
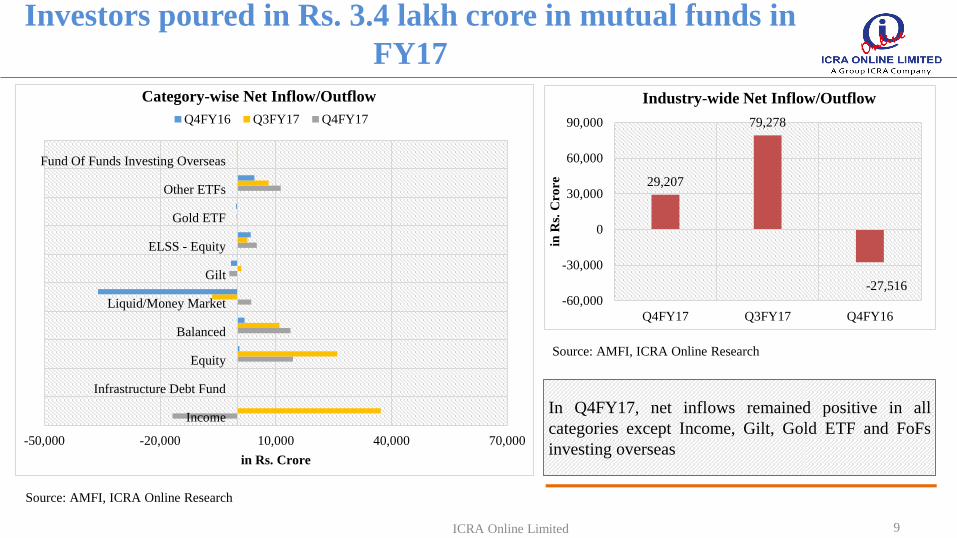
Investors poured in Rs. 3.4 lakh crore in mutual funds in
FY17
In Q4FY17, net inflows remained positive in all
categories except Income, Gilt, Gold ETF and FoFs
investing overseas
ICRA Online Limited 9
29,207
79,278
-27,516-60,000
-30,000
0
30,000
60,000
90,000
Q4FY17 Q3FY17 Q4FY16
in R
s. C
rore
Industry-wide Net Inflow/Outflow
Source: AMFI, ICRA Online Research
-50,000 -20,000 10,000 40,000 70,000
Income
Infrastructure Debt Fund
Equity
Balanced
Liquid/Money Market
Gilt
ELSS - Equity
Gold ETF
Other ETFs
Fund Of Funds Investing Overseas
in Rs. Crore
Category-wise Net Inflow/Outflow
Q4FY16 Q3FY17 Q4FY17
Source: AMFI, ICRA Online Research
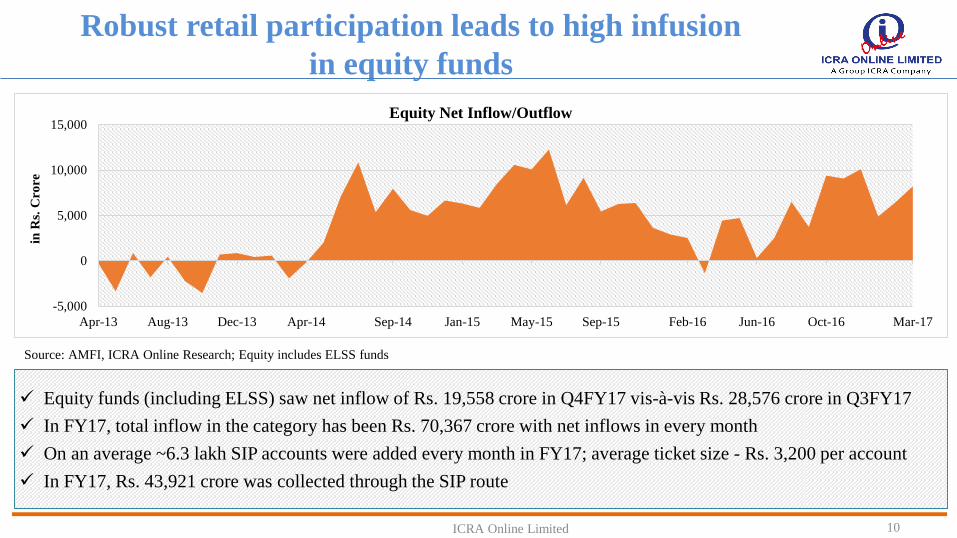
Robust retail participation leads to high infusion
in equity funds
Equity funds (including ELSS) saw net inflow of Rs. 19,558 crore in Q4FY17 vis-à-vis Rs. 28,576 crore in Q3FY17
In FY17, total inflow in the category has been Rs. 70,367 crore with net inflows in every month
On an average ~6.3 lakh SIP accounts were added every month in FY17; average ticket size - Rs. 3,200 per account
In FY17, Rs. 43,921 crore was collected through the SIP route
ICRA Online Limited 10
-5,000
0
5,000
10,000
15,000
Apr-13 Aug-13 Dec-13 Apr-14 Sep-14 Jan-15 May-15 Sep-15 Feb-16 Jun-16 Oct-16 Mar-17
in R
s. C
rore
Equity Net Inflow/Outflow
Source: AMFI, ICRA Online Research; Equity includes ELSS funds

SECTOR UPDATE
Section III
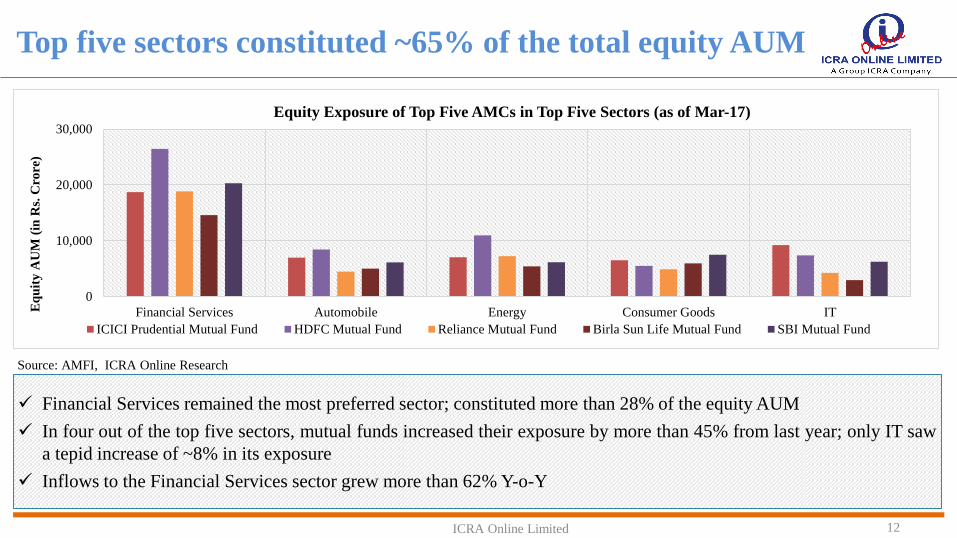
Top five sectors constituted ~65% of the total equity AUM
ICRA Online Limited 12
Source: AMFI, ICRA Online Research
Financial Services remained the most preferred sector; constituted more than 28% of the equity AUM
In four out of the top five sectors, mutual funds increased their exposure by more than 45% from last year; only IT saw
a tepid increase of ~8% in its exposure
Inflows to the Financial Services sector grew more than 62% Y-o-Y
0
10,000
20,000
30,000
Financial Services Automobile Energy Consumer Goods ITEq
uit
y A
UM
(in
Rs.
Cro
re)
Equity Exposure of Top Five AMCs in Top Five Sectors (as of Mar-17)
ICICI Prudential Mutual Fund HDFC Mutual Fund Reliance Mutual Fund Birla Sun Life Mutual Fund SBI Mutual Fund
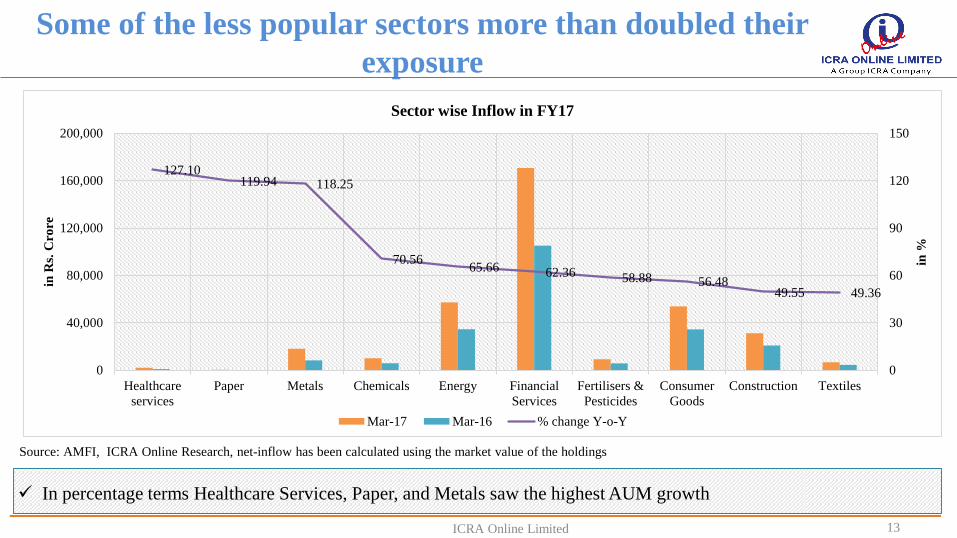
Some of the less popular sectors more than doubled their
exposure
ICRA Online Limited 13
Source: AMFI, ICRA Online Research, net-inflow has been calculated using the market value of the holdings
In percentage terms Healthcare Services, Paper, and Metals saw the highest AUM growth
127.10119.94 118.25
70.5665.66 62.36 58.88 56.48
49.55 49.36
0
30
60
90
120
150
0
40,000
80,000
120,000
160,000
200,000
Healthcare
services
Paper Metals Chemicals Energy Financial
Services
Fertilisers &
Pesticides
Consumer
Goods
Construction Textiles
in %
in R
s. C
rore
Sector wise Inflow in FY17
Mar-17 Mar-16 % change Y-o-Y
CATEGORY PERFORMANCE
Section IV

All Equity-Oriented categories posted positive returns
Key drivers:
Benchmark indices, Sensex and Nifty, surpassed the 29,000 and 9,000 marks, respectively
Outcome of state assembly elections held in five states
Government moving closer towards launching the long-awaited GST
ICRA Online Limited 15
26
.99
20
.81
17
.47
12
.64
13
.76
10
.65
11
.82
26
.01
19
.97
15
.63
12
.52
25
.44
19
.71
17
.23
12
.17
20
.62
12
.18
12
.52
8.7
1
0.00
10.00
20.00
30.00
1 Year 3 Year 5 Year 10 Year
Ret
urn
s (i
n %
)
Performance* of Equity-Oriented Mutual Fund Categories
Diversified Funds Global Funds Sector Funds ELSS Index Funds
Source: ICRA Online Research; Data as of Mar-17
*Compound Annualized returns
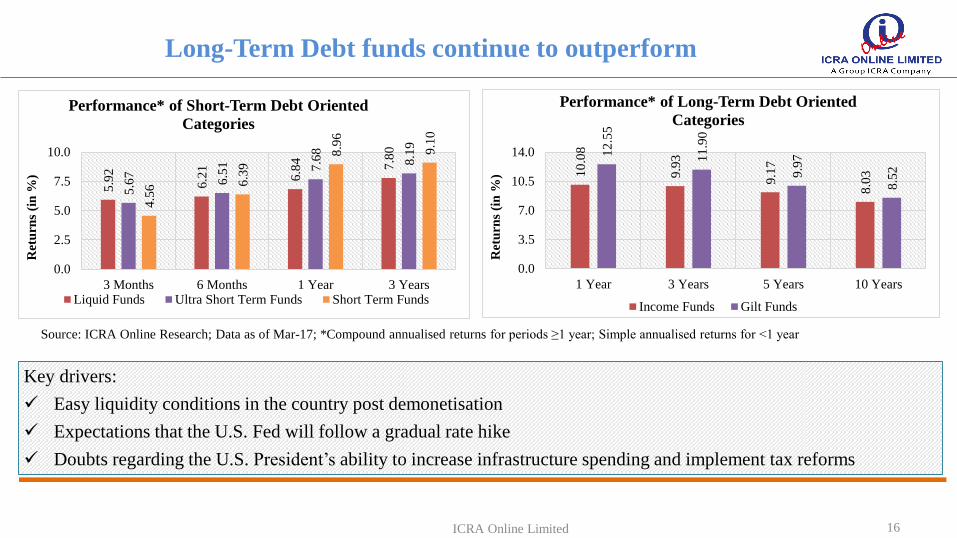
Long-Term Debt funds continue to outperform
Key drivers:
Easy liquidity conditions in the country post demonetisation
Expectations that the U.S. Fed will follow a gradual rate hike
Doubts regarding the U.S. President’s ability to increase infrastructure spending and implement tax reforms
ICRA Online Limited 16
5.9
2
6.2
1
6.8
4 7.8
0
5.6
7
6.5
1 7.6
8
8.1
9
4.5
6 6.3
9
8.9
6
9.1
0
0.0
2.5
5.0
7.5
10.0
3 Months 6 Months 1 Year 3 Years
Ret
urn
s (i
n %
)
Performance* of Short-Term Debt Oriented
Categories
Liquid Funds Ultra Short Term Funds Short Term Funds
Source: ICRA Online Research; Data as of Mar-17; *Compound annualised returns for periods ≥1 year; Simple annualised returns for <1 year
10
.08
9.9
3
9.1
7
8.0
3
12
.55
11
.90
9.9
7
8.5
2
0.0
3.5
7.0
10.5
14.0
1 Year 3 Years 5 Years 10 Years
Ret
urn
s (i
n %
)
Performance* of Long-Term Debt Oriented
Categories
Income Funds Gilt Funds

INDUSTRY INSIGHTS
Section V

Mar-17 witnesses highest monthly folio addition in FY17
As per SEBI data,10.1 lakh folios were added in Mar-17; total folio count reached 5.54 crore, 1.9% higher than Feb-17
The ELSS category drove the increase; 3.2 lakh folios were added in the month
The folio count for the Liquid category more than doubled in FY17, suggesting retail investors are looking at this route
for surplus cash deposit
ICRA Online Limited 18
0 100 200 300 400
Liquid/ Money Market
Gilt
Income
ELSS
Equity
Balanced
GOLD ETF
Other ETFs
Fund of funds investing overseas
Category-wise Folio Count (in Lakhs)
Mar-16 Feb-17 Mar-17
Source: AMFI, ICRA Online Research
48
0.7
48
4.5
48
9.2
49
2.4
49
8.0 50
5.6
51
2.9 52
0.5 52
8.2 53
7.8
54
3.9 55
4.0
470
500
530
560
Ap
r-1
6
May
-16
Jun
-16
Jul-
16
Au
g-1
6
Sep
-16
Oct
-16
No
v-1
6
Dec
-16
Jan
-17
Feb
-17
Mar
-17
Fo
lio
(in
La
kh
s)
Folio Growth in FY17
Source: SEBI, ICRA Online Research
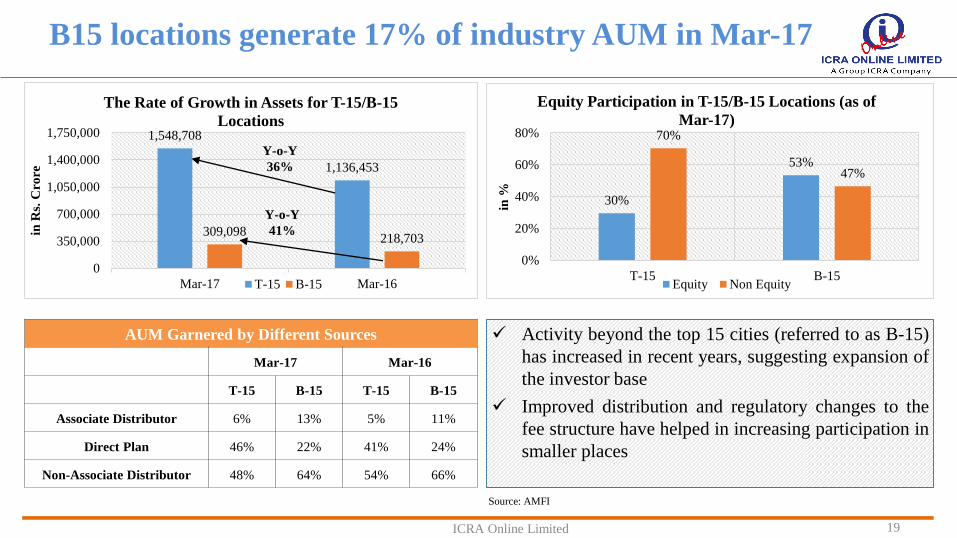
B15 locations generate 17% of industry AUM in Mar-17
Activity beyond the top 15 cities (referred to as B-15)
has increased in recent years, suggesting expansion of
the investor base
Improved distribution and regulatory changes to the
fee structure have helped in increasing participation in
smaller places
ICRA Online Limited 19
Source: AMFI
1,548,708
1,136,453
309,098218,703
0
350,000
700,000
1,050,000
1,400,000
1,750,000
Mar-17 Mar-16
in R
s. C
rore
The Rate of Growth in Assets for T-15/B-15
Locations
T-15 B-15
30%
53%
70%
47%
0%
20%
40%
60%
80%
T-15 B-15
in %
Equity Participation in T-15/B-15 Locations (as of
Mar-17)
Equity Non Equity
AUM Garnered by Different Sources
Mar-17 Mar-16
T-15 B-15 T-15 B-15
Associate Distributor 6% 13% 5% 11%
Direct Plan 46% 22% 41% 24%
Non-Associate Distributor 48% 64% 54% 66%
Y-o-Y
41%
Y-o-Y
36%
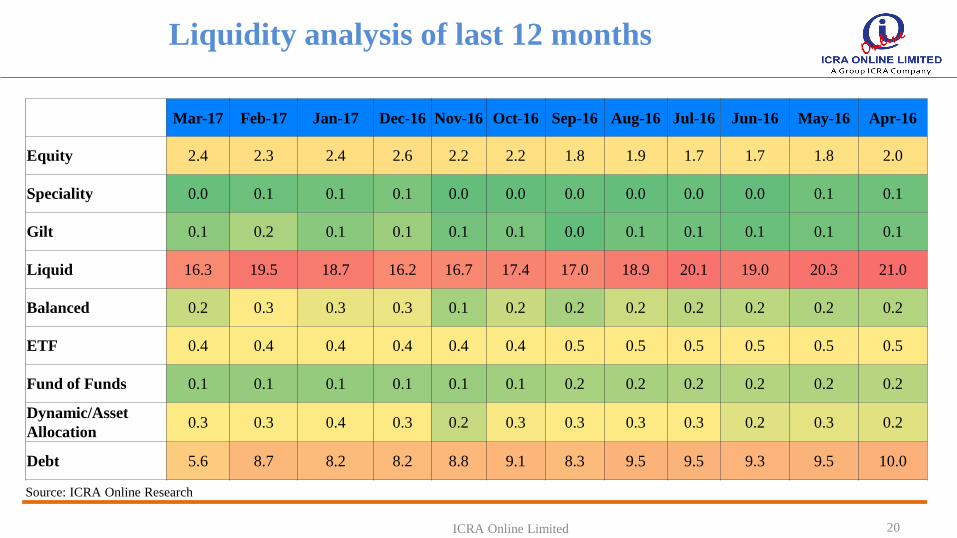
Liquidity analysis of last 12 months
ICRA Online Limited 20
Source: ICRA Online Research
Mar-17 Feb-17 Jan-17 Dec-16 Nov-16 Oct-16 Sep-16 Aug-16 Jul-16 Jun-16 May-16 Apr-16
Equity 2.4 2.3 2.4 2.6 2.2 2.2 1.8 1.9 1.7 1.7 1.8 2.0
Speciality 0.0 0.1 0.1 0.1 0.0 0.0 0.0 0.0 0.0 0.0 0.1 0.1
Gilt 0.1 0.2 0.1 0.1 0.1 0.1 0.0 0.1 0.1 0.1 0.1 0.1
Liquid 16.3 19.5 18.7 16.2 16.7 17.4 17.0 18.9 20.1 19.0 20.3 21.0
Balanced 0.2 0.3 0.3 0.3 0.1 0.2 0.2 0.2 0.2 0.2 0.2 0.2
ETF 0.4 0.4 0.4 0.4 0.4 0.4 0.5 0.5 0.5 0.5 0.5 0.5
Fund of Funds 0.1 0.1 0.1 0.1 0.1 0.1 0.2 0.2 0.2 0.2 0.2 0.2
Dynamic/Asset
Allocation0.3 0.3 0.4 0.3 0.2 0.3 0.3 0.3 0.3 0.2 0.3 0.2
Debt 5.6 8.7 8.2 8.2 8.8 9.1 8.3 9.5 9.5 9.3 9.5 10.0

Instrument allocation pattern in debt segment
Source: ICRA Online Research
ICRA Online Limited 21
2.1
56.2
17.2
6.34.9
7.9
0.4 0.3
4.62.1
49.9
20.9
6.28.8
7.5
0.41.8 2.42.1
45.0
22.3
1.8
16.6
9.5
0.1 0.52.2
0
15
30
45
60
Equity Bond/Debentures GILT Money Market CD CP Cash Current Assets Others
in %
Mar-17 Dec-16 Mar-16

Average maturity increased post demonetisation on
rate-cut expectations; eased as RBI maintained status-quo
ICRA Online Limited 22
Source: ICRA Online Research
0
4
8
12
16
Mar-16 Apr-16 May-16 Jun-16 Jul-16 Aug-16 Sep-16 Oct-16 Nov-16 Dec-16 Jan-17 Feb-17 Mar-17
in y
rs
Average Maturity Trends in Income, GILT Long-Term & GILT Short-Term Funds
Average Maturity_Income Funds Average Maturity_GILT LT Average Maturity_GILT ST

FY17 saw mutual funds match FII inflows
ICRA Online Limited 23
Source: ICRA Online Research
140,033
79,723
110,540
-14,171
52,977
-22,678 -20,925
40,281
65,04154,912
-50,000
0
50,000
100,000
150,000
FY13 FY14 FY15 FY16 FY17
in R
s. C
rore
FPI/FII & Mutual Fund Investment Trends in Equity Markets
FPI/FII MF

Large Caps command the largest share of assets
ICRA Online Limited 24
Source: ICRA Online Research
0%
20%
40%
60%
80%
100%
Apr-16 May-16 Jun-16 Jul-16 Aug-16 Sep-16 Oct-16 Nov-16 Dec-16 Jan-17 Feb-17 Mar-17
in %
Investment Across Market Caps*
Large Cap Mid Cap Small Cap Debt & Others
*On the basis of MFI market cap classification, only equity diversified funds were considered for analysis
SEBI INVESTOR SURVEY (SIS) 2015
Section VI

SEBI conducted its fourth investor survey
ICRA Online Limited 26Source: ICRA Online Research
SEBI Investor Survey 2015 (SIS 2015) is the fourth in a series of periodic
studies conducted/sponsored by SEBI to quantify actions and perceptions of
retail investors
The survey aims to collect information on socio-economic parameters, savings
and investment behavior, reasons for non-investment in securities market and
relation of risks with investment behavior
This iteration of the study has the largest breadth and depth, covering more
than 200,000 households in the listings exercise and more than 50,000
households in the final survey across cities and villages in all states and Union
Territories (except Lakshadweep)
Total number of respondents were 50,453, of which 36,756 were urban
respondents and 13,697 were rural respondents

Bank deposits remain the most preferred investment and
savings vehicle among urban respondents
ICRA Online Limited 27Source: ICRA Online Research
Household Awareness of Investment Instruments
Mutual Funds Equities DebenturesEquity/Currency
Derivatives
Commodity
Futures
Awareness 28.4% 26.3% 13.1% 10.4% 9.5%
Investor
Awareness84.6% 79.4% 48.2% 33.6% 29.2%
Non-Investor
Awareness18.7% 17.1% 7.0% 2.4% 6.1%
95.0%
61.7%
30.3%
30.1%
16.5%
9.7%
8.1%
8.1%
4.3%
3.5%
1.4%
1.0%
0% 20% 40% 60% 80% 100%
Bank Deposits
Life Insurance
Precious Metals
Post Office Saving Schemes
Real Estate
Mutual Funds/SIPs
Equity/Stocks/Shares
Pension Schemes
Company Deposits
Debentures/Bonds
Derivatives (Equity/Currency)
Commodities Futures
Investment and Savings Vehicles Used by Survey
Respondents
N1 = 36,756 (all urban respondents); Respondents could check multiple options
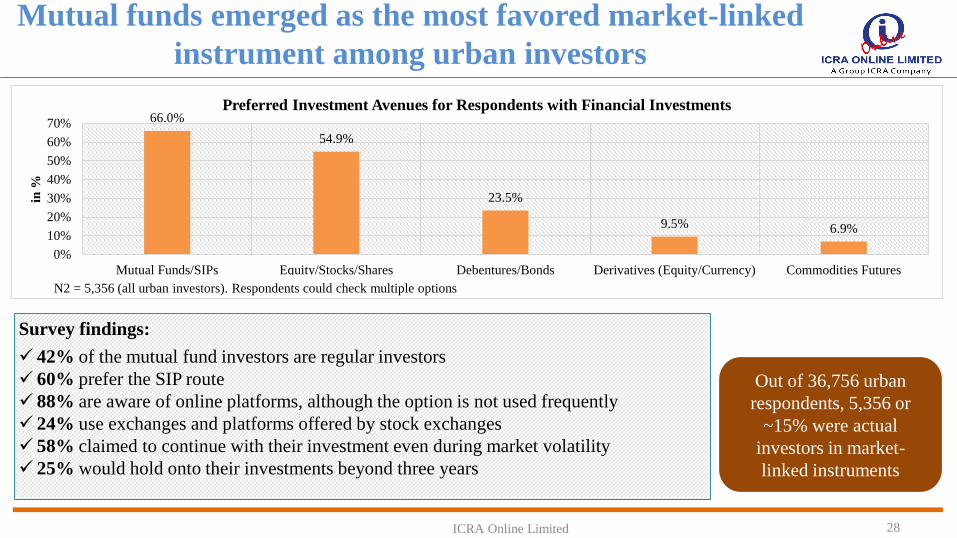
Mutual funds emerged as the most favored market-linked
instrument among urban investors
ICRA Online Limited 28
Out of 36,756 urban
respondents, 5,356 or
~15% were actual
investors in market-
linked instruments
66.0%
54.9%
23.5%
9.5% 6.9%
0%
10%
20%
30%
40%
50%
60%
70%
Mutual Funds/SIPs Equity/Stocks/Shares Debentures/Bonds Derivatives (Equity/Currency) Commodities Futures
in %
Preferred Investment Avenues for Respondents with Financial Investments
N2 = 5,356 (all urban investors). Respondents could check multiple options
Survey findings:
42% of the mutual fund investors are regular investors
60% prefer the SIP route
88% are aware of online platforms, although the option is not used frequently
24% use exchanges and platforms offered by stock exchanges
58% claimed to continue with their investment even during market volatility
25% would hold onto their investments beyond three years

Risk aversion and inadequate returns keep urban
investors away from mutual funds
ICRA Online Limited 29
Not sure about
safety of
investments
33%
Inadequate returns
26%
Inadequate
information
14%
Lack of expertise
13%
Investment not
very liquid
8%
others
6%
Why Do Households not Invest in Mutual Funds?
N2 = 5,356 (all urban investors). Respondents could check multiple options
Sustained and widespread mutual fund
information dissemination in India has
ensured that information availability is no
longer a concern
Potential investors are not aware of the
superior risk adjusted returns of mutual
funds and seem to consider savings and
investment instruments independently
instead of calculating their optimal weights
in a diversified portfolio
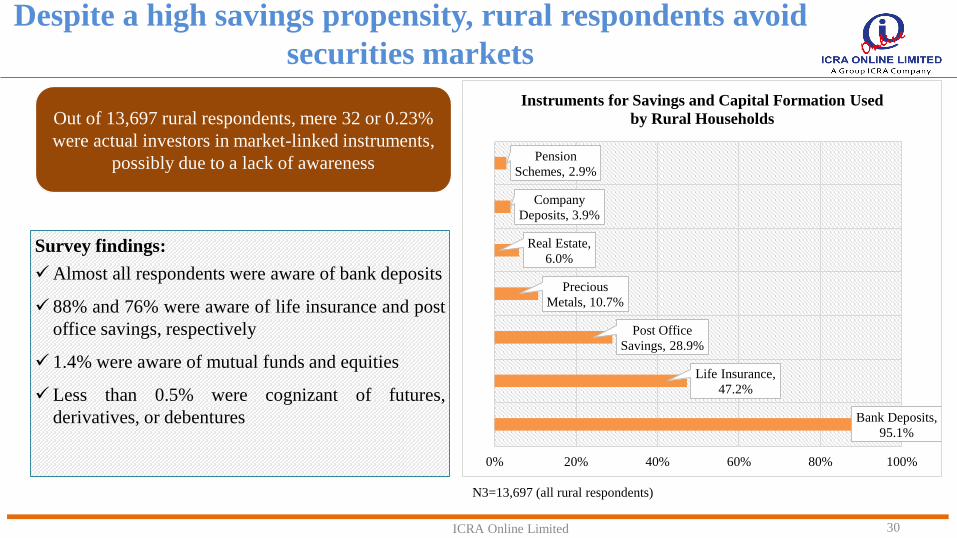
Despite a high savings propensity, rural respondents avoid
securities markets
ICRA Online Limited 30
Bank Deposits,
95.1%
Life Insurance,
47.2%
Post Office
Savings, 28.9%
Precious
Metals, 10.7%
Real Estate,
6.0%
Company
Deposits, 3.9%
Pension
Schemes, 2.9%
0% 20% 40% 60% 80% 100%
Instruments for Savings and Capital Formation Used
by Rural Households
N3=13,697 (all rural respondents)
Out of 13,697 rural respondents, mere 32 or 0.23%
were actual investors in market-linked instruments,
possibly due to a lack of awareness
Survey findings:
Almost all respondents were aware of bank deposits
88% and 76% were aware of life insurance and post
office savings, respectively
1.4% were aware of mutual funds and equities
Less than 0.5% were cognizant of futures,
derivatives, or debentures

REGULATORY UPDATE
Section VII

Regulator remains pro-active during the quarter
SEBI allows mutual funds to
invest in REITs and InvITs
SEBI reviews advertisement
guidelines of mutual funds
SEBI has allowed mutual funds to invest in Real Estate
Investment Trusts (REITs) and Infrastructure Investment Trusts
(InvITs) to make these investment tools more attractive for
investors. As per the norm, no mutual fund under all its schemes
shall own more than 10% of units issued by a single issuer of
REIT and InvIT
Regarding advertisement of the mutual fund scheme
performance, SEBI has instructed asset management companies
to advertise their returns in terms of Compounded Annualized
Growth Rate (CAGR) for the past one year, three years, five
years, and since inception. However, where the scheme has been
in existence for less than one year, past performance shall not be
provided. A point-to-point returns chart on a standard investment
of Rs. 10,000 must be given to help investors understand the
scheme better
ICRA Online Limited 32
Source: Media Reports
Disclaimer:
All information contained in this document has been obtained by ICRA Online Limited from sources believed by it to be accurate and reliable. Although reasonable
care has been taken to ensure that the information herein is true, such information is provided ‘as is’ without any warranty of any kind, and ICRA Online Limited or
its affiliates or group companies and its respective directors, officers, or employees in particular, makes no representation or warranty, express or implied, as to the
accuracy, suitability, reliability, timelines or completeness of any such information. All information contained herein must be construed solely as statements of
opinion, and ICRA Online Limited, or its affiliates or group companies and its respective directors, officers, or employees shall not be liable for any losses or injury,
liability or damage of any kind incurred from and arising out of any use of this document or its contents in any manner, whatsoever. Opinions expressed in this
document are not the opinions of our holding company, ICRA Limited (ICRA), and should not be construed as any indication of credit rating or grading of ICRA for
any instruments that have been issued or are to be issued by any entity.
Contact Information
Saugat Acharya
+91 98209 74940
Atul Sharma
+91 96191 12544
Eshna Basu
+91 98318 27490