Embed Size (px)
Citation preview

MURKY WATERS? Corporate Reporting
on Water RiskA Benchmarking Study of 100 Companies
February 2010A Ceres Report
Authored byBrooke Barton, Ceres
With scoring and analysis byShirley Morgan-Knott,
UBS Investment Research
With data support byBloomberg, LP
Ceres99 Chauncy Street
Boston, MA 02111
T: 617-247-0700
F: 617-267-5400
www.ceres.org
©2010 Ceres

Ceres is a national coalition of investors, environmental groups, and other public interest
organizations working with companies to address sustainability challenges such as water scarcity
and climate change. Ceres directs the Investor Network on Climate Risk, a group of more than 80
institutional investors and fi nancial fi rms from the U.S. and Europe managing over $8 trillion in assets.
UBS is a global fi rm providing fi nancial services to private, corporate, and institutional clients. Th e
UBS Investment Research SRI & Sustainability research team was formally established as part of
the Investment Bank at the end of 2004, in response to steady demand from UBS clients for such
research. SRI & Sustainability Investment is an active asset management approach, that takes
fi nancial, fundamental, and also environmental, social, ethical, and governance issues into account in
the implementation of investment decisions.
Bloomberg, LP provided the water-related data for this report. Bloomberg’s Environmental, Social
and Governance (ESG) Data Service provides multi-year, as reported data on over 3,500 companies
as well as supporting news, research, and analytics integrated into the core system functionality.
As the premier fi nancial information provider for banks, corporations, governments and others,
Bloomberg leverages its distribution platform to provide ESG data to improve transparency,
liquidity and asset valuations.
Acknowledgements
Th is report was made possible through support from the Park Foundation and
Compton Foundation. Th e opinions expressed in this report are those of the authors
and do not necessarily refl ect the views of the sponsors.
UBS and Ceres would especially like to thank Shilpa Salian for her assistance
on this report. Shilpa Salian is not an employee of UBS.
Ceres wishes to thank the Bloomberg analysts who collected data for this report:
Emil Efthimides, Jacob Gladstone, Rina Levy, Melissa Reville, and Andrew Snow.
Ceres also wishes to thank the Investor Network on Climate Risk members who helped
develop this report, and members of the Ceres team who provided valuable insight and
suggestions: Jim Coburn, Peyton Fleming, Andrea Moff at, Roseann Casey,
Warren Paul Anderson, Matt Fisher, Dan Mullen, Meg Crawford, Lauren Wolpin,
Courtney Queen, and Kara Oberg.
Graphic design by Maggie Powell Designs.
Copyright 2010 by Ceres.
For more information, contact:
Th e views and opinions expressed in this article are those of
the author and are not necessarily those of UBS Limited. UBS
Limited accepts no liability over the content of the article. It
is published solely for informational purposes and is not to
be construed as a solicitation or an off er to buy or sell any
securities or related fi nancial instruments.
Brooke Barton
Senior Manager, Corporate Programs
Ceres
99 Chauncy Street
Boston, MA 02111
www.ceres.org
Shirley Morgan-Knott
Analyst, SRI and Sustainability Research
UBS Investment Research
1 Finsbury Avenue
London EC2M 2PP
www.ubs.com
Emil Efthimides
ESG Data Product Manager
Bloomberg, LP
100-101 Business Park Drive
Skillman, NJ 08558
www.bloomberg.com

1Detailed Findings: Beverage Sector
Table of ContentsForeword by Ceres . . . . . . . . . . . . . . . . . . . . . . . . . . . . . . . . . . . . . . . . . . . . . . . . . . . . . . . . 3
Foreword by UBS . . . . . . . . . . . . . . . . . . . . . . . . . . . . . . . . . . . . . . . . . . . . . . . . . . . . . . . . . 5
Foreword by Bloomberg . . . . . . . . . . . . . . . . . . . . . . . . . . . . . . . . . . . . . . . . . . . . . . . . . . 6
Executive Summary . . . . . . . . . . . . . . . . . . . . . . . . . . . . . . . . . . . . . . . . . . . . . . . . . . . . . . . 7
Introduction: Water Matters . . . . . . . . . . . . . . . . . . . . . . . . . . . . . . . . . . . . . . . . . . . . . 15
Approaches to Corporate Water Reporting . . . . . . . . . . . . . . . . . . . . . . . . . . . . . . 20
Investor Demand for Water Disclosure . . . . . . . . . . . . . . . . . . . . . . . . . . . . . . . . . . . 22
Report Methodology . . . . . . . . . . . . . . . . . . . . . . . . . . . . . . . . . . . . . . . . . . . . . . . . . . . . 25
Key Findings & Recommendations . . . . . . . . . . . . . . . . . . . . . . . . . . . . . . . . . . . . . . . 30
Detailed FindingsBeverage Sector . . . . . . . . . . . . . . . . . . . . . . . . . . . . . . . . . . . . . . . . . . . . . . . . . . . . . . . . . . . . . .43
Chemicals Sector . . . . . . . . . . . . . . . . . . . . . . . . . . . . . . . . . . . . . . . . . . . . . . . . . . . . . . . . . . . . .49
Electric Power Sector . . . . . . . . . . . . . . . . . . . . . . . . . . . . . . . . . . . . . . . . . . . . . . . . . . . . . . . . . .55
Food Sector . . . . . . . . . . . . . . . . . . . . . . . . . . . . . . . . . . . . . . . . . . . . . . . . . . . . . . . . . . . . . . . . . .62
Homebuilding Sector . . . . . . . . . . . . . . . . . . . . . . . . . . . . . . . . . . . . . . . . . . . . . . . . . . . . . . . . .69
Mining Sector . . . . . . . . . . . . . . . . . . . . . . . . . . . . . . . . . . . . . . . . . . . . . . . . . . . . . . . . . . . . . . . . .75
Oil & Gas Sector . . . . . . . . . . . . . . . . . . . . . . . . . . . . . . . . . . . . . . . . . . . . . . . . . . . . . . . . . . . . . . .82
Semiconductor Sector . . . . . . . . . . . . . . . . . . . . . . . . . . . . . . . . . . . . . . . . . . . . . . . . . . . . . . . .89

3Foreword
FOREWORD FROM CERESFull corporate disclosure of material business issues is a core foundation for smart
investment decision-making. Emerging risks and opportunities that will impact
corporate bottom-lines – including those associated with environmental, social, and
governance (ESG) issues – must be included in fi nancial fi lings. We need to learn
from the recent fi nancial meltdown where hidden subprime mortgages and credit
default swaps destroyed trillions of dollars of wealth. Material business issues should
not be glossed over or ignored.
Global water scarcity is one emerging risk that all companies should be focused
on – and one about which investors need information. Th e combination of rising
global populations, rapid economic growth in developing countries, and climate
change is triggering enormous water availability challenges around the world. Electric
power generators, food producers, and other water-intensive industries are especially
vulnerable, both in their operations and their extensive supply chains.
Th e U.S. Securities and Exchange Commission recently highlighted the water issue
in its new “interpretive guidance” that clarifi es what public companies need to
disclose to investors about the climate-related risks and opportunities that they
face. “Changes in the availability or quality of water…can have material eff ects on
companies,” wrote the SEC, which issued the guidance on January 27, 2010 at the
request of leading institutional investors.
We’re already seeing tangible impacts from this issue. In the past two years, water
shortages in California have shuttered new housing developments and forced farmers
to abandon or leave unplanted more than 100,000 acres of agricultural land, resulting
in more than $1 billion in lost revenue. At the same time, chemical companies like
Dow and DuPont see vast opportunities in providing products that can help ensure
adequate freshwater supplies globally. Dow, for example, is pushing to achieve a 35
percent reduction in the cost of water reuse and desalination technologies by 2015.
Th is report is the fi rst comprehensive assessment and ranking of water disclosure
practices of 100 publicly-traded companies in eight key sectors exposed to water-
related risks: beverage, chemicals, electric power, food, homebuilding, mining, oil and
gas, and semiconductors.
With data support from Bloomberg and analytical support from UBS Limited,
the report evaluates the quality, depth, and clarity of water risk disclosure in both
voluntary and mandatory corporate reporting through June 30, 2009. We considered
fi ve key categories of disclosure: water accounting, risk assessment, direct operations,
supply chain, and stakeholder engagement.
Th e report provides some basis for encouragement. It fi nds evidence that most
companies are providing basic disclosure on overall water use and water scarcity
risks, with mining and beverage companies in the forefront. We also saw various
examples of strong governance, water accounting, and reduction strategies. A few
specifi c highlights:
Alcoa is the only mining company that disclosed a wastewater reduction goal,
reporting a target of zero process water discharges by 2020.
4 Murky Waters: Corporate Reporting on Water Risk
Danone has an incentive system for senior managers that integrates
environmental and social criteria – including water objectives – into
compensation.
Pinnacle West / APS, an Arizona-based utility, is using treated sewage to cool
its electric power plants in Phoenix, preserving enough potable water for
approximately 75,000 homes.
Still, overall governance and disclosure by the 100 companies falls well short of what
investors expect and need. For example, only six of the 100 companies reported any water
risks or performance data in their fi nancial fi lings. Only 17 companies report local-level
water data and only a handful provide this information in the context of operations in
water-stressed regions. And no companies are providing comprehensive data on their
suppliers’ water performance – an especially glaring omission when one considers that
a vast majority of many corporations’ water footprint is in the supply chain.
Th e disclosure to date is the tip of the iceberg of actions that are needed. Th e report
recommends that companies:
Include material water risk factors and performance data in fi nancial fi lings.
Provide data broken down to the facility level for operations in water-stressed
regions, and disclose the percentage of facilities operating in areas of water-stress.
Outline actions and policies for assessing and managing water risks, including
quantifi ed targets for reducing wastewater and water use.
Disclose how they are collaborating with stakeholders and suppliers on water
risks, including setting performance goals for key supply chains.
Outline strategies for developing water-related products with strong market
potential in a water-constrained world.
Th e report recommends that investors:
Engage the companies they own in water-intensive sectors about how they are
assessing and disclosing water risks and related performance information.
Ask their asset managers to assess and engage companies on water and other
ESG risks and opportunities – and make this a stipulation in requests for
proposals (RFPs) and annual performance reviews.
Support investor and corporate initiatives, such as the Carbon Disclosure
Project, and the United Nations’ Principles for Responsible Investment’s work
with the CEO Water Mandate, to achieve increased water disclosure.
Ensuring safe and adequate freshwater water supplies for future generations – and the
global economy – is more important than ever. Businesses have an integral role to play
in this global challenge – and will help ensure their future prosperity by doing so.
Mindy S. Lubber
President, Ceres
Director, Investor Network on Climate Risk

5Foreword
FOREWORD BY UBSTo make informed investment decisions, investors require robust corporate
disclosure of the material risks and opportunities to businesses. In the view of the
UBS Investment Research SRI & Sustainability research team, environmental, social,
and governance (ESG) issues are embedded in any fi rm’s corporate strategy. Anything
that aff ects a fi rm’s business model can also aff ect the fi rm’s fi nancial performance
and valuation, and ESG issues are no exception.
We believe that wasteful uses of water are likely to become increasingly frowned
upon and subject to increased regulatory intervention. Th ere appear to be growing
expectations on the part of shareholders and other key stakeholders that fi rms
should handle ESG issues proactively, and we see the profi le of issues such as water
availability, quality, and usage as generally on the rise.
In this report, we focus on sectors where water security concerns are likely to have a
material impact on business either because water, or water-intensive commodities,
are major inputs, because the sector uses water-intensive industrial processes, or
because the sector depends on an adequate water supply to support the growth
of its business: mining, chemicals, beverages, food, oil, electric power generators,
semiconductors, and homebuilding. It is clear that any threat to water security could
have a signifi cant impact on the bottom-line of such companies. For companies
with operations and/or markets in emerging economies, issues of access to water
and responsible management of the resource could potentially have an impact on a
company’s very “license to operate” in those regions.
Th e fi duciary duty of institutional investors is to protect the value of its investments
for its members. Th e increasing number of asset owners (i.e. pension funds) and
institutional investors signing the Principles for Responsible Investment indicates
that the integration of ESG factors is increasingly being seen as an essential part of
this duty. In our view, fulfi lling this duty requires companies to disclose material ESG
information in the 10-K fi ling in the United States and in annual fi nancial reports in
the rest of the world.
Julie Hudson, CFA
Global Head of SRI and Sustainability Research
UBS Investment Bank
6 Murky Waters: Corporate Reporting on Water Risk
FOREWORD BY BLOOMBERGAstute long-term investors understand that markets require more than fi nancial
statements to value an investment. Intangible assets such as quality of management,
brand recognition, and market penetration are equally important. And while
conventional fi nancial analysis already accounts for such intangibles as goodwill –
environmental, social and governance (ESG) measures are three further intangibles
that can have signifi cant eff ect on company valuation.
While climate change and carbon emissions have recently dominated both public
and investor attention, Bloomberg sees an increasing interest in water issues and the
associated risks – operational, reputational, and larger ecosystem services impacts –
posed to a wide range of market participants.
Th e Bloomberg water data used in this report was collected from company-sourced
fi lings such as corporate social responsibility reports, annual reports, fi nancial fi lings,
and company websites. None of the data is estimated or derived.
Moving beyond collecting data and comparing it, Bloomberg seeks to be a standard-
setter in this area. Th rough relationships with leading non-governmental and not-for-
profi t organizations such as Ceres, we are working towards increasing the number of
companies disclosing ESG data and towards improving the quantity and quality of
this data.
Even though many corporations have improved their ESG reporting in recent years
and asset managers integrate ESG to pitch for investment mandates, many fi nance
practitioners have been slow in including ESG factors into their analysis and decision-
making.
Bloomberg can, and should be, at the forefront of helping mainstream investors
both to better understand and to incorporate ESG factors into their investment
processes. By providing this data free with our standard off ering and enabling users to
integrate it seamlessly into their investment analysis and processes alongside fi nancial
information, the fi nancial community can begin to gain a better understanding of
how ESG metrics may aff ect the value of a company.
Emil Efthimides, CFA
ESG Data Product Manager
Bloomberg, LP
7Executive Summary
EXECUTIVE SUMMARYOur global economy runs on water. Freshwater powers industrial production, is the
essential ingredient in many products, and is perhaps the most important natural
resource for human survival.
Pressures related to water availability are growing in the U.S. and abroad, making
numerous industries vulnerable to water disruption throughout their operations
and supply chains. Water demand is increasing worldwide, especially in developing
countries where economic and population growth is overburdening already
inadequate water and sanitation infrastructure. Th e eff ects of climate change,
including drought, heat waves, and reduced water fl ows from melting glaciers, are
creating additional pressures on scarce water supplies.
Th ese pressures can directly threaten a company’s production levels, profi t margins,
and even “license to operate” in water-stressed areas. In 2009, water shortages in
California devastated the state’s agriculture industry, leading to an estimated loss
of 21,000 jobs and $1 billion in revenues.1,2 For mining company Newmont, protests
by thousands of local residents due to water concerns near its gold mine in Peru
led the company to relinquish access to 3.9 million ounces of gold reserves in 2004.3
During the 2007-2008 drought in Georgia, electric power fi rm Southern Company
was forced to buy $33 million in fossil fuels to replace lost power in Atlanta when
hydropower generation declined by half due to low water levels.4
In light of these impacts, institutional investors are increasingly seeking information
from companies on how they are addressing and managing material water risks and
opportunities. In August 2009, Norges Bank Investment Management (NBIM), which
runs the $415 billion Norwegian Government Pension Fund, announced that it
would begin evaluating water risk management practices of 1,100 companies it holds.
In November 2009, the Carbon Disclosure Project launched a new investor-driven
water disclosure initiative backed by European and U.S. investors focused on 300 of
the world’s largest companies.
Th ese eff orts refl ect the growing appetite from investors for broader corporate
environmental, social, and governance (ESG) disclosure. Th rough Ceres’ Investor
Network on Climate Risk, over 40 institutional investors have asked regulators,
including the U.S. Securities and Exchange Commission (SEC), to provide better
guidance to companies on disclosure of key ESG issues, including climate change and
water scarcity. In January 2010, the SEC acted on these requests, issuing guidance
that clarifi es what publicly-traded companies need to disclose to investors in terms
of material climate-related risks and opportunities, including physical risks like
water.5 Th e guidance mentions water risks related to climate change that should be
1. “California’s Drought: Water Conditions & Strategies to Reduce Impacts,” California Department of Water
Resources, March 30, 2009. See: http://gov.ca.gov/index.php?/fact-sheet/11951/
2. Lester A. Snow, “California’s Drought Update 2009,” California Department of Water Resources, press release,
September 30, 2009. See: http://www.water.ca.gov/drought/
3. Tania Mellado, “Peru farmers threaten strike over gold mine, water,” Planet Ark, September 9, 2004.
4. Justin Rubner, “Drought hits Hydropower,” Atlanta Business Chronicle, November 16, 2007. See: http://atlanta.
bizjournals.com/atlanta/stories/2007/11/19/story2.html
5. “Commission Guidance Regarding Disclosure Related to Climate Change,” Release Nos. 33-9106; 34-61469; FR-82,
U.S. Securities and Exchange Commission, February 2, 2010. See: http://www.sec.gov/rules/interp/2010/33-9106.pdf

8 Murky Waters: Corporate Reporting on Water Risk
disclosed where material, including “decreased agricultural production capacity in
areas aff ected by drought or other weather-related changes.”6 Th e SEC also notes
that “signifi cant physical eff ects of climate change, such as eff ects on the severity of
weather (for example, fl oods or hurricanes), sea levels, the arability of farmland, and
water availability and quality, have the potential to aff ect a registrant’s operations
and results.”7
Clearing the Waters: Assessing the State of Water DisclosureTh is purpose of this report is to help investors and companies understand how
companies in vulnerable sectors are evaluating, managing, and disclosing water risks
in their operations, supply chains, and products. With data support from fi nancial
information provider Bloomberg and analytical support from the fi nancial services
fi rm UBS Limited, the report evaluates and ranks the water disclosure practices of
100 publicly-traded companies in eight key sectors exposed to water-related risks:
beverage, chemicals, electric power, food, homebuilding, mining, oil and gas, and
semiconductors.
To be helpful for investors, company disclosure requires more than just a mention
of water and its risks. Measuring and reporting water-related risks and opportunities
is complex, and the methodologies and standards for doing so are still nascent.
Nevertheless, there is growing consensus in business and investor circles regarding
the most critical elements of water reporting. What is central to useful water
reporting is its inclusion in company fi nancial fi lings – annual 10-Ks (or 20-Fs or
40-Fs for non-U.S. companies) – rather than just sustainability reports. Also critical
is discussion of relevant management systems and strategies, provision of water
accounting data that puts performance in geographic context, and inclusion of
supply chain water risks in the analysis.
Report MethodologyCompanies from eight sectors were reviewed and benchmarked against their peers:
beverage, chemicals, electric power, food, homebuilding, mining, oil and gas, and
semiconductors.8 Th ese industries are known to require signifi cant quantities of
water, or to have signifi cant wastewater discharges, with respect to their direct
operations, raw material supplies, or use of their products.
One-hundred of the largest publicly-traded companies from these eight sectors were
selected on the basis of their 2008 annual revenues and market capitalization, while
also considering geographic exposure. With the exception of those in the electric
power and homebuilding sectors, the companies reviewed represent fi rms with
global operations.
Th e report uses a systematic method for evaluating the quality, depth, and clarity
of water risk disclosure in both voluntary and mandatory corporate reporting of
publicly-traded companies during the 2008 fi scal year.
6. Ibid, pp. 27.
7. Ibid, pp. 26
8. For the purposes of this study, the sectors reviewed were defi ned using the Industry Classifi cation Benchmark
(ICB) codes, a classifi cation structure maintained by Dow Jones Indexes and FTSE Group. For more information,
see: http://www.icbenchmark.com

9Executive Summary
Researchers studied the companies’ most recent voluntary corporate disclosures
such as sustainability or CSR reports, company websites, and mandatory fi nancial
disclosures such as 10-K fi lings. Only company disclosures made publicly available
before June 30, 2009 were included in this assessment.
For the purposes of this study, company disclosures were divided into fi ve categories:
“Water Accounting,” “Risk Assessment,” “Direct Operations,” “Supply Chain,” and
“Stakeholder Engagement.” Within each category, sub-elements were evaluated
to produce a fi nal scored assessment based on the depth and clarity of corporate
disclosures.
For the beverage, electric power, food, oil and gas, mining, and semiconductor
sectors, companies were scored on a 100-point scale. A 112-point scale was
used for the chemical and homebuilding sectors because an additional category,
“Opportunities,” was evaluated.
Key FindingsTh e study found that even for companies operating in sectors and regions of
the world facing signifi cant water risk, disclosure of risk and corporate water
performance was surprisingly weak. Although the scoring scale ranged from 0-100
(or 0–112 in the case of the chemicals and homebuilding sectors), no single company
surpassed 43 points (Exhibits 1 and 2).
Diageo, the UK-based alcoholic beverage company, received the highest score in the
study.
Leading and lagging sectors. Th e mining sector scored highest overall,
followed by the beverage industry. Companies in the homebuilding sector
received the lowest overall scores.
Limited disclosure in fi nancial fi lings. Th e majority of the companies
evaluated in this report disclose exposure to water risks in their 10-Ks or
annual reports – for example, 73 percent report some level of physical risk.
Nevertheless, the vast majority of these disclosures consist of vague, boilerplate
language. Th ey fail to reference specifi c at-risk operations or supply chains, and
do not attempt to quantify or monetize risk. Only six companies report any
water accounting data within their fi nancial fi lings.
Many companies face exposure to key water risks. Th e majority of the
companies surveyed (73 percent) report some exposure to water-related
physical risks such as drought. Only nine companies report reputational risks
related to water – these included companies in the beverage, mining, and oil
and gas sectors. Sixty-seven percent of companies disclose some level of water-
related regulatory risk, with the highest exposure in the mining, electric power,
and oil and gas sectors. Nearly half (48 percent) report some level of litigation
risk. Although the majority of companies disclosed key water risk factors in
their fi nancial fi lings or annual reports, some restricted this discussion to
their sustainability reports, refl ecting an ongoing lack of integration between
voluntary reports and regulated fi nancial fi lings.
Few companies provide performance data at the local-level. Nearly two-
thirds of the reviewed companies report total water use data, but only 17
percent report this data down to the site or regional level. Only a handful of

10 Murky Waters: Corporate Reporting on Water Risk
companies put their water use in context by noting the number or percent
of facilities operating in water-stressed regions. Th ese included BP, Diageo,
Heineken, Nestlé, and SABMiller.
Water-related policies and management systems for some. Twenty-four
percent of companies detail specifi c policies, standards, or management
systems to reduce water-related risks and costs.
Relatively few reduction targets. Only 21 companies disclose quantifi ed
targets to reduce water use. Just three of these companies – Diageo, DuPont,
and Xstrata – had reduction targets that were diff erentiated by the level of
water stress facing specifi c facilities. Even fewer – 15 companies – had goals to
reduce wastewater discharge.
Supply chain data scant. No companies provided comprehensive data on
their suppliers’ water performance. A few – including Danone, SABMiller, and
Unilever – provide estimates of the water use embedded in their supply chains.
Twelve companies disclose working with their suppliers to help them reduce
water use or wastewater discharge. Companies in sectors with a signifi cant
proportion of their water footprint embedded in the supply chain – food,
beverage, electric power, and oil and gas – largely did not report engaging their
suppliers on water management.
Stakeholder engagement weak. Just under one-third of companies report
collaborating in some way with local stakeholders on eff orts to protect
or restore watersheds and ecosystems near their operations. And despite
reputational risks linked to siting water-intensive projects or facilities, only
fi ve companies – all in the mining or oil and gas sector – disclose engaging
or consulting with stakeholders on the water impacts of siting or expanding
operations.

11Executive Summary
Exhibit 1. Water Disclosure Scores:Beverage, Electric Power, Food, Mining, Oil and Gas, and Semiconductors
(scored on a 1–100 point scale)
Beverage Mining
Diageo 43 Xstrata 42
Anheuser-Busch InBev 34 Barrick 38
Th e Coca-Cola Company 34 Rio Tinto 37
SABMiller 30 Alcoa 35
PepsiCo 29 Anglo American 33
Heineken 25 Freeport-McMoRan 31
Pernod Ricard 18 BHP Billiton 30
Brown-Forman 14 Teck 27
Constellation Brands 9 Vale 27
Dr Pepper Snapple 8 Newmont 25
Consol Energy 15
Electric Power Massey Energy 15
Pinnacle West/ Arizona Public
Services (APS)
38 Peabody Energy 8
American Electric Power (AEP) 36
PG&E 26 Oil & Gas
Exelon 21 BP 35
Southern Company 18 Suncor Energy 27
Dominion Resources 17 Total 27
Entergy 16 Nexen 26
Xcel Energy 16 Royal Dutch Shell 25
Constellation Energy 14 Exxon 23
Duke Energy 14 Chevron 16
AES Corporation 12 ConocoPhillips 16
NRG Energy 11 Devon Energy 16
Florida Power & Light Group 8 Canadian Natural Resources 12
Chesapeake Energy 7
Food Range Resources 7
Unilever 34 EnCana 4
Nestlé 29
Smithfi eld Foods 25 Semiconductors
Danone 20 Toshiba 35
General Mills 19 Intel 34
Tyson Foods 17 Samsung 29
Kellogg 15 United Microelectronics 27
Kraft Foods 15 Taiwan Semiconductors 25
ConAgra 12 ST Microelectronics 22
Dean Foods 12 Advanced Micro Devices 17
Sara Lee 12 Analog Devices 15
Archer Daniels Midland 9 Texas Instruments 15
Bunge 9 Infi neon Technologies 8
Micron 1
Exhibit 2. Water Disclosure Scores:Chemicals & Homebuilders
(scored on a 1–112 point scale)
Chemicals
Mitsui 33
Sumitomo Chemical 32
PotashCorp 31
DuPont 23
Monsanto 23
Syngenta 22
Dow 21
BASF 20
Reliance Industries 17
Mosaic 15
Praxair 13
PPG Industries 11
Air Liquide 10
Linde 10
Saudi Basic 5
Homebuilding
KB Home 15
Pulte 13
Toll Brothers 13
Beazer Homes 11
Lennar 10
Centex 6
D.R. Horton 4
Hovnanian 4
NVR 4
Ryland 4

12 Murky Waters: Corporate Reporting on Water Risk
Recommendations for CompaniesTh is report highlights a number of opportunities for companies to dramatically
improve the relevance, depth, and clarity of their reporting on water:
Inclusion in fi nancial fi lings. Financial fi lings are the gold standard for
reporting material information to investors, including material ESG risk factors
like water scarcity. As underscored by the SEC’s new interpretive guidance,
companies should include material water risk factors and performance data in
these fi lings in order to communicate management oversight and awareness of
key risks and opportunities.
More detailed risk assessment. Boilerplate disclosure of material water risks,
even within fi nancial fi lings, is not enough. Companies should assess and
disclose material water risks in ways that provide investors with suffi cient detail
to understand the scale and scope of exposure, ideally referencing specifi c at-
risk operations or supply chains, and attempting to quantify risks wherever
possible.
Water accounting data that puts performance in context. Aggregate data on
corporate-wide water use and discharge is insuffi cient to provide investors with
insight on key areas of risk. Companies should provide data broken down to the
facility level for operations in water-stressed regions, and put the company’s risk
exposure in context by disclosing the percentage of facilities operating in areas
of water stress.
Disclosure of management strategies and systems. Corporate reporting
should provide detailed explanation of how water risks are being assessed,
addressed by key policies, and integrated into governance and management
systems from the boardroom to the facility-level.
Setting and disclosing reduction targets. Disclosing quantifi ed water use and
wastewater reduction targets communicates commitment, and helps investors
gauge a company’s capacity to minimize risks and prepare itself for a more
water-constrained future. Targets are more credible when articulated with
respect to high-risk operations, and when backed by detailed management
plans.
Addressing water risks in the supply chain. For many large companies, water
use embedded in the supply chain accounts for the largest portion of the total
water footprint. Companies should disclose how they are collaborating with
and evaluating suppliers on water risks and impacts, and should set goals to
improve water performance in key supply chains.
Engaging critical stakeholders. Even a company with the most responsible
and effi cient water management practices can face risks if communities
surrounding its operations lack access to clean water, or if other water users
deplete or pollute shared water resources. Given this, companies should
provide investors with an understanding of how they are working to mitigate
these risks by engaging critical stakeholders to preserve essential water
resources, and maintain a social license to operate across varied geographies.
Seizing opportunities. Increasingly companies are developing water-related
product strategies that present signifi cant market opportunities in an
increasingly water-stressed world. Information on these strategies, including
relevant product goals and investments are of growing interest to investors.
13Executive Summary
Recommendations for InvestorsInvestors should pursue the following steps to help drive better corporate water
disclosure:
Engage companies. Investors should engage the companies they own in key
water-intensive sectors about how they are assessing and disclosing water risks
and related performance information.
Ask asset managers to assess and engage companies on water and other ESG risks and opportunities. Institutional investors should stipulate this to asset
managers in requests for proposals (RFPs) and in annual performance reviews
to ensure that the fi rms managing their money are giving water, climate, and
other sustainability risks the attention they deserve.
Support investor and corporate initiatives to achieve increased water disclosure. Among initiatives that investors should consider supporting are the
Carbon Disclosure Project’s water disclosure initiative and the United Nations’
Principles for Responsible Investment’s eff orts to encourage more companies to
sign on to the CEO Water Mandate and to meet key Mandate commitments,
including increased water reporting.

15Introduction
INTRODUCTION: WATER MATTERSWater is the world’s most critical resource.
More vital than oil, water sustains life, and thus the global food chain. Water sustains
industry, and thus the global economy. Vast quantities of ultra clean water are used
to make the silicon chips that help power our computers, servers, and cell phones.
Electric power plants depend heavily on water, and account for a staggering 40
percent of freshwater withdrawals in the United States.
It could be said without exaggeration that our economy runs on water. And that
economy is increasingly at risk.
In recent years, news stories of droughts in California, Texas, Georgia, as well
as eastern Australia, India, and northern China have dominated the headlines.
Economic growth in the western U.S. is slowing due to reduced water supplies from
melting snowcaps and ongoing drought. Between November 2008 and July 2009,
Texas suff ered drought-related agricultural losses reaching over $3.6 billion, with that
number expected to mount to $4.1 billion by year-end 2009.1 Water shortages in
California in 2009 led to an estimated 21,000 lost agricultural jobs and revenue losses
of $1 billion.2,3 Meanwhile, power plant production has been cut back due to more
frequent and intense heat waves in California and the southeastern United States.
A recent study by the U.N. Environment Program found that mountain glaciers in
Asia are melting at a rate that will eventually threaten the drinking water, irrigation
supplies, and hydropower of up to 25 percent of the world’s population.4
Despite its critical role and growing scarcity, water continues to be an undervalued
resource. Freshwater is thought of as free – or nearly so – in many places. It is an asset
that appears on few balance sheets, yet without it most industries would grind to a
halt. Nevertheless, there is some evidence that this is changing. A recent survey of
global water providers found that water prices worldwide rose by 10 percent last year,
well above infl ation.5
A range of studies, including the Intergovernmental Panel on Climate Change’s 2008
Climate Change and Water report, have concluded that climate change is likely to
further exacerbate water scarcity.6 In fact, climate change – coupled with a swelling
global population, economic development, and more water-intensive consumption
patterns in emerging markets – will further aff ect water availability, quality, and
demand in ways that present material risks for many companies and their investors
(see Exhibit 1).
1. Blair Fannin and Dr. Carl Anderson, “Texas drought related losses reach $3.6 billion,” AgriLife News, Texas A&M
University, press release, July 20, 2009. See: http://agnews.tamu.edu/showstory.php?id=1311
2. “California’s Drought: Water Conditions & Strategies to Reduce Impacts,” California Department of Water
Resources, March 30, 2009. See: http://gov.ca.gov/index.php?/fact-sheet/11951/
3. Lester A. Snow, “California’s Drought Update 2009,” California Department of Water Resources, press release,
September 30, 2009. See: http://www.water.ca.gov/drought/
4. “Climate Change Science Compendium 2009,” United Nations Environment Programme, 2009
5. “No Let Up in Pressure on Water Tariff s,” Global Water Intelligence, Vol 10, Issue 9, September 2009.
6. B.C. Bates, Z.W. Kundzewicz, S. Wu and J.P. Palutikof, Eds., “Climate Change and Water,” Technical Paper VI of the
Intergovernmental Panel on Climate Change, IPCC Secretariat, Geneva, June 2008.
A recent study by the U.N.
Environment Program found that
mountain glaciers in Asia are
melting at a rate that will eventually
threaten the drinking water,
irrigation supplies, and hydropower
of up to 25 percent of the world’s
population.

16 Murky Waters: Corporate Reporting on Water Risk
Exhibit 1. Global Water Trends and Climate Change
Water Trends Climate Impacts Business Implications
INCREASING DEMAND
Population growth. By 2030, the earth’s projected
eight billion inhabitants will need 25 percent more
freshwater.1 Th e majority of this population growth will
take place in developing countries, where demands on
water resources are already high and supplies limited.
Economic development and changing consumption patterns. Th e rise in the world’s population and
improvement in living standards will drive increased
manufacturing of water-intensive goods and services,
and will require signifi cantly more food production.
Already, the consumption of water-intensive red meat in
large developing countries like India and China has risen
33 percent in the last decade and is expected to double
globally between 2000 and 2050.2
Increased water demand by agriculture
due to higher temperatures – up to a 40
percent increase in additional irrigated
land by 2080.3
Increased hydration demand by farm
animals due to higher temperatures.
Increased quantities of water needed
for industrial cooling due to higher
atmospheric and water temperatures.4
Uncertain availability in water-stressed
regions
Higher costs for water
Regulatory caps on use
Confl icts with communities and other
water users
Growing demand for water-effi cient
products
INSUFFICIENT SUPPLY
Over appropriation. More than one-third of the world’s
population – roughly 2.4 billion people – lives in water-
stressed regions. By 2025, that number is expected to
rise to two-thirds.5
Decreased natural water storage capacity
due to glacier/snow cap melt aff ecting key
regions including China, India, Pakistan,
and the western United States.
Drought and groundwater declines
expected for many sub-tropical and mid-
latitudes due to changes in precipitation
patterns.
Ecosystem damage due to temperature
increases, changes in precipitation
patterns, severe weather events, and
prolonged droughts.
Decreased amounts of water available for
industrial and agricultural activities
Operational disruptions and associated
fi nancial loss
Disruptions to operations of key suppliers
and critical value chain partners
Impacts on future growth and license to
operate
DECLINING WATER QUALITY
Rapid industrialization. In China, many rivers are so
badly polluted that industry cannot use the water.
Nearly two-thirds of the country’s largest cities have no
wastewater treatment facilities.6
Millions globally lack safe drinking water. Increases in
agricultural and industrial production, coupled with a
lack of adequate wastewater treatment inhibit access
to safe drinking water for almost 900 million people
worldwide. Five million die each year from water-related
illness.7
Contamination of coastal surface and
groundwater resources due to sea level
rise and resulting saltwater intrusion.
More algal and bacterial blooms due to
increased water temperatures.
Higher erosion rates and increased infl ux
of soil-based pollutants into waterways
due to extreme precipitation and
fl ooding.
Increased pre-treatment costs for water
Increased costs for wastewater treatment
to meet regulatory standards
New regulatory restrictions on specifi c
industrial activities and investments
Increased responsibility to implement
community water infrastructure and
watershed restoration projects
Productivity impacts on the workforce
linked to water-related illness
Notes:
1. Daniel Wild et al., “Water: a market of the future – Global trends open up new investment opportunities,” Sustainability Asset Management (SAM) Study, Zurich,
December 2007.
2. Elizabeth Rosenthal, “As More Eat Meat, Bid to Reduce Emissions,” Th e New York Times, December 3, 2009. See: http://www.nytimes.com/2008/12/04/science/
earth/04meat.html
3. Günther Fischer et al., “Climate change impacts on irrigation water requirements: Eff ects of mitigation, 1990–2080,” Technological Forecasting and Social Change, 74, no. 7
(September 2007): 1083-1107.
4. B.T. Smith et al., “Climate and Th ermoelectric Cooling Linkages: Potential Eff ects of Climate Change in Th ermoelectric Cooling Systems,” Oak Ridge National Laboratory,
Oak Ridge, Tennessee, 2005.
5. “Making Every Drop Count,” UN-FAO, press release, February 14, 2007.
6. Daniel Wild et al., “Water: a market of the future – Global trends open up new investment opportunities,” Sustainability Asset Management (SAM) Study, Zurich,
December 2007.
7. Ibid.
17Introduction
Water-Related Business Risks7
Current water trends translate into a set of material business risks that fall into
four broad categories: physical, reputational, regulatory, and litigation risk. Th e
signifi cance of these water-related risks varies by sector and by company.
Physical RisksA lack of freshwater can limit business activities, raw material supply, and product
use in a variety of ways. Declines or disruptions in water supply can undermine
industrial operations where water is needed for production, irrigation, material
processing, cooling, and cleaning.
Clean water is critical to many industrial processes, and lack of it can present a
range of costs to companies. A contaminated water supply often requires additional
investment and costs for pre-treatment. When alternative source water or treatment
options are not physically or fi nancially feasible, operations may be disrupted or
require relocation. Industrial expansion may also be constrained in regions where the
water supply is already contaminated or at risk of contamination.
Water scarcity also directly aff ects power generation, putting large electricity users at
risk. Hydropower yields in the Colorado River, the Great Lakes, and in China’s Yangtze
River are expected to decrease signifi cantly due to climate change.8, 9 In California,
under a moderate climate change scenario, analysts project that the state could
lose between 10 to 20 percent of its total hydropower at a cost of $440-$880 million
annually.10
Many businesses fail to recognize water demands embedded across their supply
chain. For example, water supply risks are often hidden in companies’ raw material
inputs or in the inputs of intermediate suppliers. In a recent study of its agricultural
supply chain, the brewing company SABMiller found that the water footprint of its
grain procurement in South Africa accounted for 98 percent of the total water used
to produce a single liter of beer, or the equivalent of 152 embedded liters.11
Reputational RisksConstraints on water resources make companies more susceptible to reputational
risks. Declines in water availability and quality can increase competition for clean
water, giving rise to tensions between businesses and local communities, particularly
in developing countries where local populations often lack access to safe and reliable
drinking water. Community opposition to industrial water withdrawals and perceived
or real inequities in use can emerge quickly and aff ect businesses profoundly. Local
confl icts can damage brand image or even result in the loss of the company’s license
7. Parts of this section were excerpted from Morrison et al., “Water Scarcity and Climate Change: Growing Risks for
Businesses and Investors,” Ceres and the Pacifi c Institute, February 2009.
8. Brent M. Lofgren et al., “Evaluation of Potential Impacts on Great Lakes Water Resources Based on Climate
Scenarios of Two GCMs,” Journal of Great Lakes Research, 28, no. 4 (2002): 537-554.
9. Niklas S. Christiansen et al., “Th e Eff ects of Climate Change on the Hydrology and Water Resources of the
Colorado River Basin,” Climatic Change, 62, no. 1-3 (January 2004): 337-363.
10. Guido Franco and Alan H Sanstad, “Climate Change and Electricity Demand in California. California Energy
Commission,” PIER Energy-Related Environmental Research (February 2006): CEC-500-2005-201-SF.
11. “Water Footprinting: Identifying and Addressing Water Risk in the Value Chain,” SABMiller, 2008. See: http://
www.sabmiller.com/fi les/reports/water_footprinting_report.pdf
In California, under a moderate
climate change scenario, analysts
project that the state could lose
between 10 to 20 percent of its total
hydropower at a cost of $440–$880
million annually.
18 Murky Waters: Corporate Reporting on Water Risk
to operate. For example, after years of organized and well-publicized opposition by
local residents and advocacy groups concerned about the environmental impacts of
a proposed water bottling plant, Nestlé Waters announced in September 2009 that it
had decided to scrap plans entirely to bottle spring water in McCloud, California.12
Reputational risks increase as people become more aware of their right to access
water. Th e concept of “access to clean water as a human right” is gaining more
recognition globally, with multinational companies like PepsiCo adopting a company-
wide policy in support of the human right to water. Th e failure of governments
around the world to provide water services to local communities may exacerbate
scrutiny by local and international advocacy organizations towards companies with
access to secure water supplies.
Regulatory RisksPhysical and reputational pressures are increasingly resulting in more stringent local
and national water policies that, if unanticipated, can raise costs and limit industrial
activity.
Water scarcity, coupled with increased concern among local communities about
corporate water withdrawals and water pollution, puts pressure on local authorities
to consider changes in water allocations or caps on water use, increase water prices,
set new permit standards, reduce permit availabilities, and develop more stringent
wastewater quality standards.
In the United States, regulations to protect water resources are growing stronger.
In September 2009, the U.S. EPA announced that it intends to widen its rules for
coal-fi red power plants to include limits on toxic metal discharges such as mercury
and arsenic, which are released in power plant wastewater streams and can seep
into waterways.13 In the same month, the Obama administration announced new
principles to guide Congress in updating the Toxic Substances Control Act, the law
that governs environmental regulation of many of the toxic chemicals present in U.S.
surface and groundwater.
Companies operating in the European Union are also facing growing pressure to
reduce water pollution in response to the EU’s Water Framework Directive. Enacted in
2000, the directive takes an integrated, water basin-based approach, and commits EU
member states to achieving high water quality conditions for all water bodies by 2015.
Th ere is also evidence that Chinese authorities are increasingly willing to enforce
water regulations. Th e November 2005 release of 100 tons of benzene into the
Songhua River after an explosion at a petrochemical plant – which left nearly four
million people without water for four days – triggered a revision of China’s Water
Pollution Control Law.14 Th e new act, announced in February 2008, raised penalties,
12. Associated Press, “Nestle pulls plug on controversial bottling plant,” MercuryNews.com, September 10, 2009. See:
http://www.mercurynews.com/news/ci_13310768
13. Taryn Luntz, “EPA to Limit Metal Discharge From Coal Plants,” Th e New York Times, September 15, 2009. See:
http://www.nytimes.com/gwire/2009/09/15/15greenwire-epa-to-limit-metal-discharges-from-coal-plants-62391.
html
14. China Business, “Northeast cleans up after chemical blast,” Asia Times, November 30, 2005. See: http://www.
atimes.com/atimes/China_Business/GK30Cb06.html
Th e U.S. EPA has announced that
it intends to widen its rules for
coal-fi red power plants to include
limits on toxic metal discharges
such as mercury and arsenic,
which are released in power plant
wastewater streams and can seep
into waterways.
Th e concept of “access to clean
water as a human right” is gaining
more recognition globally, with
multinational companies like
PepsiCo adopting a company-wide
policy in support of the human right
to water.

19Introduction
eliminated some loopholes and introduced environmental regulation as a measure of
local government performance.15
In the summer of 2009, the Beijing Development and Reform Commission, the
city’s economic planning agency, put 12 international and local brewers, beverage
producers, and dairy companies on its “List of Major Water-Polluting Enterprises.”
Th e Commission announced that the beverage producers on the list are subject to
increased supervision and required to submit plans to reduce energy use and water
emissions.16
Litigation RisksWith increased attention from regulators and communities on water scarcity,
companies face growing risks stemming from lawsuits or other legal actions
responding to the impacts of a company’s operations or products on water supplies.
In the United States, the widespread leakage into groundwater supplies of methyl
tertiary butyl ether (MTBE), a gasoline additive and suspected carcinogen alleged
to cause numerous health impacts, has given rise to hundreds of lawsuits against oil
companies. Estimates place oil companies’ payments at over $423 million over 30
years on settlements related to MTBE suits involving the contamination of 153 public
U.S. water systems.17
Th e chemicals industry also faces signifi cant litigation risks linked to water-related
impacts from their facilities and products. For example, 43 water systems in six U.S.
states – Illinois, Iowa, Indiana, Kansas, Mississippi, and Ohio – recently sued the
makers of Atrazine (a weed killer banned by the EU in 2004) to force them to pay for
removing the chemical from drinking water supplies.18
15. Nadya Ivanova, “China’s Dirty Water Leads to Protests, Some Reform,” Circle of Blue Water News, September
9, 2009. See: http://www.circleofblue.org/waternews/2009/world/chinas-dirty-water-leads-to-protests-some-
reform/
16. “PepsiCo, Coca-Cola reject Beijing environmental watch list,” LiveMint.com, August 20, 2009. See: http://www.
livemint.com/2009/08/20154213/PepsiCo-CocaCola-reject-Beij.html
17. “Weitz & Luxenberg P.C. Secures $423 Million MTBE Settlement Against Oil Giants,” Weitz & Luxenberg, press
release, May 8, 2008.
18. Charles Duhigg, “Debating How Much Weed Killer Is Safe in Your Water Glass,” Th e New York Times, August 22,
2009. See: http://www.nytimes.com/2009/08/23/us/23water.html
In the summer of 2009, the
Beijing Development and
Reform Commission, the city’s
economic planning agency, put 12
international and local brewers,
beverage producers, and dairy
companies on its “List of Major
Water-Polluting Enterprises.”

20 Murky Waters: Corporate Reporting on Water Risk
APPROACHES TO CORPORATE WATER REPORTINGTh e process of measuring and reporting water-related risks and opportunities can
be complex, and many of the methodologies and standards for doing so are still
nascent.19 Nevertheless, there is growing consensus in business, investor, and NGO
circles regarding the most critical elements of water reporting.
Because most water impacts and risks play out at the local level, the geographic
component of water measurement and reporting is essential. At the moment,
however, most companies still tend to disclose basic water use and wastewater
discharge data in aggregated form as corporate-wide numbers – an approach that
obscures local-level impacts and performance. Th ese metrics are further limited
in failing to communicate water use and discharge embedded in the supply chain,
which for many companies is where the majority of their water footprint lies.
Key Aspects of Water ReportingTh e impacts of corporate water use vary enormously with geography. Th e
implications – on water supplies, ecosystems, and communities – of using 100,000
gallons of water are not the same in Boston as they are in Beijing.
Th e sort of indicators important to investors include a company’s sources of water
– drawing water from a depleted aquifer poses diff erent physical, reputational, and
regulatory risks than using water captured from recent rainfall. Similarly, disposing
of effl uent to a municipal treatment plant poses diff erent impacts and risks than
discharging it untreated to a nearby river or lake. Th e timing of water withdrawals
and discharge from and into water bodies also matters greatly, as waterways face
greater stress depending on the time of year.
Rather than reporting on local operations and considerations, however, companies
have traditionally disclosed company-wide indicators such as total water withdrawal
or consumption, and total wastewater discharge volume and contaminant load.
Th ese metrics correspond to the Global Reporting Initiative’s core water-related
reporting indicators.
In addition, most companies disclose their impacts on water with a focus on their
direct, majority-owned operations. While this is a natural focus in the early stages
of measurement and reporting, supply chain risks linked to water also require
attention, especially for companies sourcing water-intensive inputs or raw materials.
Without information on supply chain exposure, companies cannot fully manage or
communicate associated water risks.
19. For an in-depth review of existing and emerging water accounting methodologies and tools being used by the
private sector, see “Corporate Water Accounting: An Analysis of Methods and Tools for Measuring Water Use
and Its Impacts – Public Draft,” Jason Morrison, Peter Schulte, Rita Schenck, Th e CEO Water Mandate, November
16, 2009. Available at: http://www.unglobalcompact.org/docs/issues_doc/Environment/ceo_water_mandate/
UNEP_Corporate_Water_Accounting_Public_Draft.pdf
Water & the Global Reporting Initiative
Th e Global Reporting Initiative’s
(GRI) most recent sustainability
reporting framework – known as the
G3 Guidelines – includes fi ve water-
related indicators:
• Total water withdrawal by
source (EN8)
• Water sources signifi cantly aff ected
by withdrawal of water (EN9)
• Percentage and total volume of
water recycled and reused (EN10)
• Total water discharge by quality and
destination (EN21)
• Identity, size, protected status, and
biodiversity value of water bodies
and related habitats signifi cantly
aff ected by the organization’s
discharge of water and runoff (EN25)
Because most water impacts and
risks play out at the local level, the
geographic component of water
measurement and reporting is
essential.
21Approaches to Corporate Water Accounting
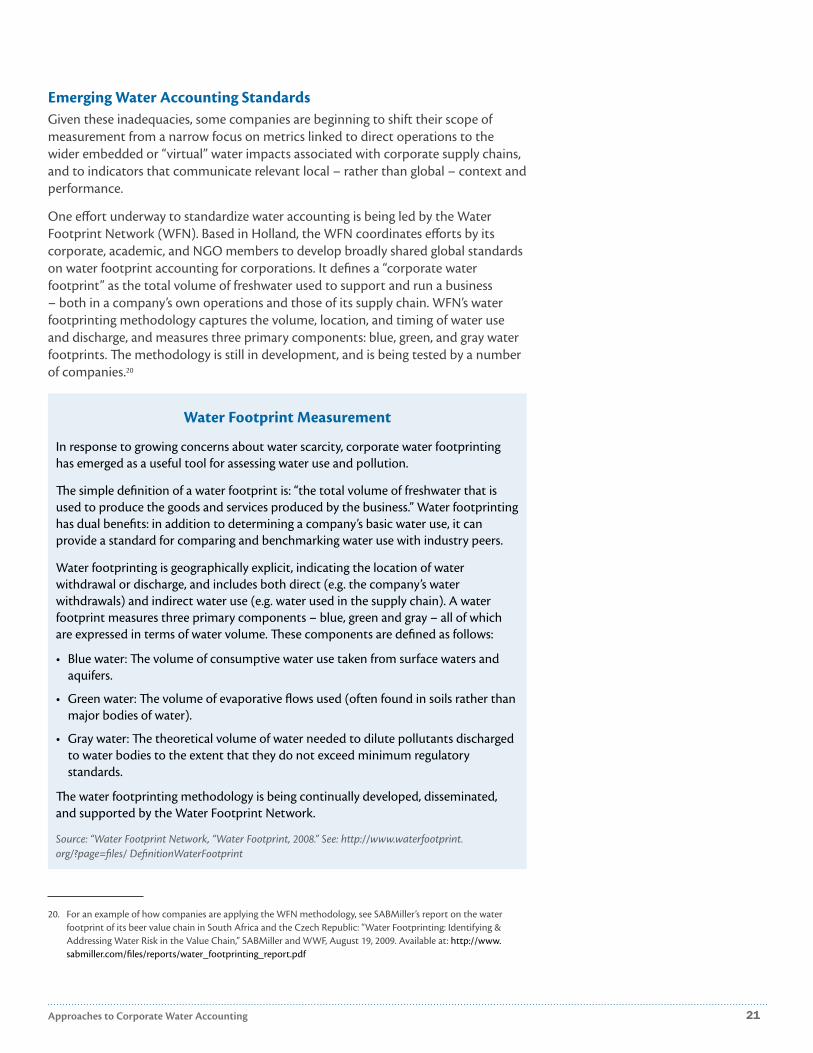
Emerging Water Accounting StandardsGiven these inadequacies, some companies are beginning to shift their scope of
measurement from a narrow focus on metrics linked to direct operations to the
wider embedded or “virtual” water impacts associated with corporate supply chains,
and to indicators that communicate relevant local – rather than global – context and
performance.
One eff ort underway to standardize water accounting is being led by the Water
Footprint Network (WFN). Based in Holland, the WFN coordinates eff orts by its
corporate, academic, and NGO members to develop broadly shared global standards
on water footprint accounting for corporations. It defi nes a “corporate water
footprint” as the total volume of freshwater used to support and run a business
– both in a company’s own operations and those of its supply chain. WFN’s water
footprinting methodology captures the volume, location, and timing of water use
and discharge, and measures three primary components: blue, green, and gray water
footprints. Th e methodology is still in development, and is being tested by a number
of companies.20
20. For an example of how companies are applying the WFN methodology, see SABMiller’s report on the water
footprint of its beer value chain in South Africa and the Czech Republic: “Water Footprinting: Identifying &
Addressing Water Risk in the Value Chain,” SABMiller and WWF, August 19, 2009. Available at: http://www.
sabmiller.com/fi les/reports/water_footprinting_report.pdf
Water Footprint Measurement
In response to growing concerns about water scarcity, corporate water footprinting
has emerged as a useful tool for assessing water use and pollution.
Th e simple defi nition of a water footprint is: “the total volume of freshwater that is
used to produce the goods and services produced by the business.” Water footprinting
has dual benefi ts: in addition to determining a company’s basic water use, it can
provide a standard for comparing and benchmarking water use with industry peers.
Water footprinting is geographically explicit, indicating the location of water
withdrawal or discharge, and includes both direct (e.g. the company’s water
withdrawals) and indirect water use (e.g. water used in the supply chain). A water
footprint measures three primary components – blue, green and gray – all of which
are expressed in terms of water volume. Th ese components are defi ned as follows:
• Blue water: Th e volume of consumptive water use taken from surface waters and
aquifers.
• Green water: Th e volume of evaporative fl ows used (often found in soils rather than
major bodies of water).
• Gray water: Th e theoretical volume of water needed to dilute pollutants discharged
to water bodies to the extent that they do not exceed minimum regulatory
standards.
Th e water footprinting methodology is being continually developed, disseminated,
and supported by the Water Footprint Network.
Source: “Water Footprint Network, “Water Footprint, 2008.” See: http://www.waterfootprint.
org/?page=fi les/ Defi nitionWaterFootprint

22 Murky Waters: Corporate Reporting on Water Risk
INVESTOR DEMAND FOR WATER DISCLOSUREFor institutional investors with widely diversifi ed portfolios, water scarcity presents
bottom-line risks. As a result, investors are seeking meaningful information that
allows them to discern which companies are leading and which are lagging in
addressing the risks and opportunities associated with water.
Investors continue to look to fi nancial fi lings (the 10-K or the 20-F report) for
information on material risk factors, including environmental, social, and governance
(ESG) risks such as water scarcity. Although voluntary sustainability reporting by
companies is growing, fi nancial fi lings will remain the gold standard for reporting
material information to investors. Only by inclusion in these fi lings, at needed levels
of specifi city, will water disclosures truly communicate appropriate oversight and
awareness of key risks and opportunities on the part of management.
Investor Requests for Improved SEC Guidance on ESG DisclosureOver the past six years, investors have lobbied the U.S. Securities and Exchange
Commission (SEC) to improve the quality of climate risk disclosure in corporate
fi nancial fi lings, and more recently, disclosure of broader ESG risk. Investors have
asked for enforcement of existing reporting requirements and for guidance on how
these requirements apply in the context of climate change, water scarcity, and other
sustainability-related risks.
In September 2007, 22 institutional investors in the U.S. and Europe managing
$1.5 trillion in assets fi led a petition with the SEC to require publicly-traded
companies to assess and fully disclose their fi nancial risks from climate change.21
In October 2008, 14 of the nation’s largest institutional investors – including
CalPERS, CalSTRS, the Maryland, New Jersey, New York City, and New York
State public pension funds or treasurers – called on the SEC to require
improved disclosure of ESG risks, including water scarcity and climate change.22
In June 2009, 41 institutional investors and asset managers, with $1.4 trillion
under management, sent a follow up letter, calling on SEC Chairman Mary
Schapiro to address the issue of insuffi cient ESG risk disclosure.23
In response to these requests, on January 27, 2010 the SEC issued new interpretive
guidance on climate risk disclosure that clarifi ed what publicly-traded companies need to
disclose to investors in terms of climate-related material eff ects on business operations.
Th e guidance compels companies to disclose a range of material risks related to climate
change, including physical risks like water scarcity. It mentions water risks related
to climate change that should be disclosed where material, including “decreased
agricultural production capacity in areas aff ected by drought or other weather-
21. “Major Investors, State Offi cials, Environmental Groups Petition SEC to Require Full Corporate Climate Risk
Disclosure,” Ceres, press release, September 17, 2007. See: http://www.ceres.org/Page.aspx?pid=445
22. “Investors Call on SEC to Require Better Disclosure on Climate Change and Other Risks,” Ceres, press release,
October 23, 2008. See: http://www.ceres.org/Page.aspx?pid=951
23. “Investors With $1.4 Trillion in Assets Calls on the SEC to Improve Disclosure of Climate Change and Other
Risks,” Ceres, press release, June 12, 2009. See: http://www.ceres.org/Page.aspx?pid=1106
Although voluntary sustainability
reporting by companies is growing,
fi nancial fi lings will remain the gold
standard for reporting material
information to investors.

23Investor Demand for Water Disclosure
related changes.”24 Th e SEC also notes that “signifi cant physical eff ects of climate
change, such as eff ects on the severity of weather (for example, fl oods or hurricanes),
sea levels, the arability of farmland, and water availability and quality, have the
potential to aff ect a registrant’s operations and results.”25
Shareholder Advocacy on WaterSome institutional investors are beginning to turn their attention to the issue
of water risk, and are using shareholder advocacy to advance greater corporate
disclosure.
Norges Bank Investment ManagementIn August 2009, Norges Bank Investment Management (NBIM), which runs the
$415 billion Norwegian Government Pension Fund, announced that it would begin
evaluating the water risk management practices of 1100 companies it holds in the
agriculture, food, manufacturing, power, mining, pharmaceuticals, pulp and paper,
and water supply sectors. NBIM manages the third-largest sovereign wealth fund in
the world, which at the time of the announcement represented approximately one
percent of the global equity market.26
NBIM cited poor disclosure and growing water-related risks as the driver for this
policy shift. “Many companies in risk sectors and regions do not have a proper water
policy with risk assessments and performance reporting. Shortcomings in companies’
water management reporting makes it diffi cult to assess the degree of risk exposure
resulting from their own operations or their supply chains,” said NBIM’s Head of
Governance, Anne Kvam27
Shareholder ResolutionsRecognizing the plethora of risks associated with water, investors are now fi ling
shareholder resolutions asking publicly-held companies for more disclosure on water
practices and performance, including information on water policies, environmental
and social impacts of water use, and water usage throughout the supply chain.
Th e number of shareholder resolutions focusing on water issues has grown in recent
years. Sectors particularly targeted by shareholder advocates on water risks include
food, beverage, oil and gas, and chemicals.
24. Ibid, pp. 27.
25. Ibid, pp. 26
26. “Record-high return in the second quarter,” Norges Bank Investment Management, press release, August 14,
2009.
27. Hugh Wheelan, “Giant Norway fund launches campaign to pressure 1100 companies on water risks, Report
during third quarter will outline fund’s reporting ‘expectations’ from portfolio companies,” Responsible Investor,
August 20, 2009. See: http://www.climateactionprogramme.org/news/article/giant_norway_fund_launches_
campaign_to_pressure_1100_companies_on_water_ris/
“Shortcomings in companies’ water
management reporting makes it
diffi cult to assess the degree of risk
exposure resulting from their own
operations or their supply chains,”
— Anne Kvam, Head of Governance, Norges Bank Investment Management
Shareholder Resolutions
Addressing Water Issues
41
40
39
38
37
36
35
34
33
32
31
39
2008–2009
# o
f re
solu
tio
ns
fi le
d
2004–2005
34
2006–2007
40

24 Murky Waters: Corporate Reporting on Water Risk
Th e Carbon Disclosure Project’s Water InitiativeIn November 2009, the Carbon Disclosure Project (CDP), a UK-based non-profi t,
announced the launch of a new investor-driven water disclosure initiative.28 In 2010,
the organization will send a questionnaire to approximately 300 of the world’s
largest companies in water-intensive sectors, including consumer goods, forestry
and paper products, food, beverage, mining, pharmaceuticals, power generation,
and semiconductor manufacturing. Th e survey will ask companies to disclose key
metrics on water use and wastewater discharge, and to characterize their exposure
to water risks with regard to their direct operations and supply chain. CDP aims to
distribute the questionnaire in future years to an increasing number of companies in
water-intensive sectors and in regions facing water stress. Several European fi nancial
institutions, including NBIM, Schroders, APG Asset Management, and Dexia Asset
Management are supporting this eff ort.
As with the CDP’s carbon survey, the water disclosure survey is expected to shed
signifi cant light on the collective and sector-specifi c water impacts, risks, opportunities,
and management performance of some of the world’s largest companies.
United Nations’ Principles for Responsible InvestmentSixteen members of the Principles for Responsible Investment, an international
alliance of institutional investors, issued a letter in December 2008 urging 100 large
publicly-traded companies to join the United Nations’ CEO Water Mandate as a way
to improve their policies and practices around water use.29
Connecticut State Treasurer Denise Nappier, principal fi duciary of the Connecticut
Retirement Plans and Trust Funds, explained the impetus behind this eff ort, which was
supported by investors collectively managing $1.5 trillion: “Water can not be treated as
merely a casualty of climate change, but rather its rival in its potential to both pose risks
and create opportunities for the companies in which our funds invest.”30
28. “CDP Launches a Global Water Disclosure Project to Raise Business Awareness of Water-Related Risk,” Carbon
Disclosure Project, press release, November 19, 2009.
29. Giovanni Legorano, “Funds call for water sustainability action,” Global Pensions, December 10, 2008. See: http://
www.globalpensions.com/global-pensions/news/1461118/funds-water-sustainability-action
30. Ibid.
Th e CEO Water Mandate & Transparency
Established in 2007 as an initiative
of the UN Global Compact, the CEO
Water Mandate is designed to assist
companies in the development,
implementation, and disclosure
of water sustainability policies
and practices. Endorsement of the
Mandate represents a voluntary
commitment to action, built around
six key pillars: Direct Operations,
Supply Chain and Watershed
Management, Collective Action, Public
Policy, Community Engagement, and
Transparency.
Under the Transparency pillar, the
Mandate provides loose guidelines
for endorsing companies, calling on
them to report annually on policies
and actions undertaken to implement
the Mandate elements. Companies
are also asked to report water-related
outcomes, using broadly accepted
indicators such as those in the Global
Reporting Initiative’s G3 Guidelines.
Source: CEO Water Mandate, “Th e CEO Water
Mandate.” See: http://www.unglobalcompact.
org/Issues/Environment/CEO_Water_
Mandate/
“Water can not be treated as merely
a casualty of climate change, but
rather its rival in its potential
to both pose risks and create
opportunities for the companies in
which our funds invest.”
— Denise Nappier, Connecticut State Treasurer
25Report Methodology
REPORT METHODOLOGYTh e purpose of this report is to assess the current state of water risk disclosure by
companies exposed to key water-related physical, regulatory, reputational, and
litigation risks. It seeks to identify gaps in disclosure, highlight best practices, and
provide recommendations to companies and investors for improving corporate
water reporting.
Th e report uses a systematic method for evaluating the quality, depth, and clarity
of water risk disclosure in both voluntary and mandatory corporate reporting of
publicly-traded companies during the 2008 fi scal year.
How Companies Were SelectedCompanies were included based on their involvement in industries known to require
signifi cant quantities of water for direct operations, raw material supplies, for use
with their products, and/or for their operations’ impacts on water quality in regard
to the size and signifi cance of wastewater discharges. Eight sectors were reviewed:
beverage, chemicals, electric power, food, homebuilding, mining, oil and gas, and
semiconductors.31
One-hundred of the largest publicly-traded companies from these eight sectors were
selected on the basis of their 2008 annual revenues and market capitalization, while
also considering geographic exposure. With the exception of those in the electric
power and homebuilding sectors, the companies reviewed represent fi rms with
global operations.
Documents ReviewedFor each company, the following documents were reviewed as part of this
assessment:
Mandatory fi nancial disclosures such as 10-K fi lings (or 20-F or 40-F fi lings in
the case of non-U.S. companies). In cases where there was no 20-F or 40-F fi ling
for a non-U.S. company, the company’s annual report was reviewed.
Voluntary corporate disclosures such as sustainability or corporate social
responsibility (CSR) reports, and company websites.
Documents reviewed corresponded to the most recent year available, which
was fi scal year 2008 for most companies. In cases where companies had issued
water-specifi c reports or documents before 2008, these materials were also
included in the review.
Any company disclosures made publicly available after June 30, 2009 were not
included in this assessment.
31. For the purposes of this study, the sectors reviewed were defi ned using the Industry Classifi cation Benchmark
(ICB) codes, a classifi cation structure maintained by Dow Jones Indexes and FTSE Group. For more information,
see: http://www.icbenchmark.com
Th e purpose of this report is to
assess the current state of water risk
disclosure by companies exposed
to key water-related physical,
regulatory, reputational, and
litigation risks.

26 Murky Waters: Corporate Reporting on Water Risk
How Companies Were ScoredAnalysis of the companies’ disclosure involved extracting information related to
water and water risk within fi lings, sustainability reports, and on company websites
using Bloomberg’s Environmental, Social and Governance (ESG) Data Service, as
well as keyword searches and manual reviews of each document. Th is disclosure was
then scored by UBS according to an evaluation framework developed by Ceres in
consultation with members of the Investor Network on Climate Risk, and based on a
review of relevant Global Reporting Initiative indicators.
It should be noted that the scoring framework was developed to refl ect investor
expectations about best practice in water disclosure. Rather than creating a normal
distribution or “bell curve” based on small diff erences among the companies,
the scoring framework was designed to stretch beyond current practices with an
understanding that corporate water reporting, while still a relatively nascent activity,
is quickly evolving.
Th e water disclosure framework was designed to be fl exible so as to be applied to a
broad range of industries, with an understanding that companies in diff erent sectors
have diff erent water-related impacts and face diff erent kinds of water-related risks.
Th erefore the scores provided in this report provide meaningful comparison only
within sectors, and not across all 100 companies.
For the purposes of this study, company disclosures were assessed with respect to
fi ve categories: “Water Accounting,” “Risk Assessment,” “Direct Operations,” “Supply
Chain,” and “Stakeholder Engagement.” Within each category, sub-elements were
evaluated to produce a fi nal scored assessment based on the depth and clarity of
corporate disclosures.
For the beverage, electric power, food, oil and gas, mining, and semiconductor
sectors, companies were scored on a 100-point scale (Exhibit 2). A 112-point
scale was used for the chemicals and homebuilding sectors because an additional
category, “Opportunities,” was evaluated. Th is category assessed reporting related to
investments in and research and development (R&D) for water-effi cient products
(Exhibit 3).
Assessment Criteria1. Water accounting. Data on corporate water performance – including metrics
on direct water use and wastewater discharge volume and contaminant load –
is critical to assessing water risk. In this category, more points were given for:
• Multi-year data
• Site- or regional-level data
• Both absolute and normalized data (e.g. total water use and water use per
product made or revenues earned)
• Source and destination data for water withdrawal and wastewater discharge
• Data on the water use and wastewater discharge embedded in the supply
chain
Th e water disclosure framework
was designed to be fl exible so as
to be applied to a broad range of
industries, with an understanding
that companies in diff erent sectors
have diff erent water-related impacts
and face diff erent kinds of water-
related risks.
27Report Methodology
2. Risk assessment. Companies were assessed on their self-reported exposures to
water-related physical, reputational, regulatory, and litigation risks. More points
were given for:
• Specifi c references to at-risk operations or supply chains
• Disclosure that quantifi ed or monetized water-related risks
3. Direct operations. Points were given for disclosure of:
• Water-related management systems, policies, and standards
• Data on compliance with water-related regulations
• Qualitative discussion of eff orts to improve water effi ciency and wastewater
discharge at water-stressed operations
• Quantifi ed water use or wastewater discharge reduction targets, with more
points going to companies that disclosed absolute reduction targets and
targets with respect to water-stressed operations
4. Supply chain. Companies were assessed on the degree to which they disclosed
engaging their suppliers on water management. Points were given for disclosing:
• Collection of water-related data from suppliers
• Assessment or evaluation of suppliers on water management
• Collaboration with or training of suppliers on water management
• Reduction targets for supply chain water use or wastewater discharge
5. Stakeholder engagement. Stakeholder engagement is a critical risk mitigation
strategy for companies with water-intensive operations. Points were given for:
• Engaging with local and national governments, businesses, and communities
to address watershed management or restoration, as well as drinking water
and sanitation issues
• Collaborating with international institutions on issues related to drinking
water, sanitation, or watershed protection
• Describing how the company consults with local communities and civil
society groups on water impacts in the context of siting or expanding
operations
6. Opportunities. Water-related product strategies present signifi cant market
opportunities in an increasingly water-stressed world, and include investment
in products that improve water quality or reduce water use by consumers. For
the purposes of this study, only homebuilding and chemical companies were
evaluated on this aspect of disclosure. Points were given for disclosure of:
• Investments and R&D expenditures in water-effi cient products and
technologies
• Eff orts to improve the water effi ciency of existing products
• Quantitative targets to improve the water effi ciency of products

28 Murky Waters: Corporate Reporting on Water Risk
Exhibit 2. Assessment Methodology for Corporate Water Disclosure: Beverage, electric power, food, mining, oil and gas, and semiconductor sectors
Assessment CriteriaTotal Points
per Category
1. Water Accounting
Data on water withdrawal/consumption, at both the corporate and site-level
36Data on wastewater discharge, at both the corporate and site-level
Data on the water footprint of suppliers
2. Risk Assessment
Disclosure of physical risks
24Disclosure of reputational risks
Disclosure of regulatory risks
Disclosure of litigation risks
3. Direct Operations
Description of water-related policies and management systems
27
Information on non-compliance, violations, or penalties associated with water use
or wastewater discharge
Qualitative description of company eff orts to reduce water use at the corporate
level and with respect to operations in water-stressed regions
Qualitative description of company eff orts to reduce wastewater discharge at the
corporate level and with respect to operations in water-stressed regions
Quantitative targets to improve corporate or site-level water withdrawal or
consumption
Quantitative targets to improve corporate or site-level wastewater discharge
4. Supply Chain
Description of eff orts to assess, evaluate, or train suppliers on water management
7Description of eff orts to gather and track data on suppliers’ water impacts
Quantitative targets to reduce water impacts in the supply chain
5. Stakeholder Engagement
Collaboration with local and national governments, communities, and international
institutions on issues related to drinking water and sanitation
6Collaboration with local and national governments, businesses, NGOs, and
communities on watershed management or restoration
Consultation with local communities and NGOs on water impacts when siting or
expanding operations
Total Possible Points 100

29Report Methodology
Exhibit 3. Assessment Methodology for Corporate Water Disclosure: Chemicals and homebuilding sectors
Assessment CriteriaTotal Points
per Category
1. Chemicals and homebuilding sectors
Data on water withdrawal/consumption, at both the corporate and site-level
36Data on wastewater discharge, at both the corporate and site-level
Data on the water footprint of suppliers
2. Risk Assessment
Disclosure of physical risks
24Disclosure of reputational risks
Disclosure of regulatory risks
Disclosure of litigation risks
3. Direct Operations
Description of water-related policies and management systems
27
Information on non-compliance, violations, or penalties associated with water use
or wastewater discharge
Qualitative description of company eff orts to reduce water use at the corporate
level and with respect to operations in water-stressed regions
Qualitative description of company eff orts to reduce wastewater discharge at the
corporate level and with respect to operations in water-stressed regions
Quantitative targets to improve corporate or site-level water withdrawal or
consumption
Quantitative targets to improve corporate or site-level wastewater discharge
4. Supply Chain
Description of eff orts to assess, evaluate, or train suppliers on water management
7Description of eff orts to gather and track data on suppliers’ water impacts
Quantitative targets to reduce water impacts in the supply chain
5. Stakeholder Engagement
Collaboration with local and national governments, communities, and international
institutions on issues related to drinking water and sanitation
6Collaboration with local and national governments, businesses, NGOs, and
communities on watershed management or restoration
Consultation with local communities and NGOs on water impacts when siting or
expanding operations
6. Opportunities
New investments/R&D in water-effi cient products and technologies
12Descriptions of eff orts to improve water effi ciency and impacts of existing products
Quantitative targets to improve water effi ciency of products
Total Possible Points 112

30 Murky Waters: Corporate Reporting on Water Risk
KEY FINDINGS & RECOMMENDATIONSTh e study found that even for companies operating in sectors and regions of
the world facing signifi cant water risk, disclosure of risk and corporate water
performance was surprisingly weak. Although the scoring scale ranged from 0–100
(or 0–112 in the case of the chemicals and homebuilding sectors), no single company
surpassed 43 points. Th e mining sector scored highest overall, followed by the
beverage industry. Companies in the homebuilding sector received the lowest scores.
Diageo, the UK-based alcoholic beverage company, received the highest score in the
study.
Average Scores & Ranges by Sector
100
80
60
40
20
0Electric
Power
Beverage Chemicals MiningFood Homebuilders Semi-
conductors
Oil &
Gas
24 19 19 89
2819 21
Top Scoring Companies by Sector
Beverage Diageo
Chemicals Mitsui
Electric Power Pinnacle West
Food Unilever
Homebuilding KB Home
Mining Xstrata
Oil & Gas BP
Semiconductors Toshiba
Water Risk Disclosure in Financial FilingsTh e majority of the companies evaluated in this report disclose exposure to water
risks in their 10-Ks or annual reports – for example, 73 percent report some level of
physical risk. Nevertheless, the vast majority of these disclosures consist of vague,
boilerplate language. Th ey fail to reference specifi c at-risk operations or supply
chains, and lack any attempt to quantify or monetize risk.
Some companies were found to disclose water-related risk factors in their
sustainability reports, but did not make corresponding mentions in their 10-K
or annual report, a fi nding that indicates an ongoing lack of integration between
voluntary reports and regulated fi nancial fi lings.
Critical performance data on water was also missing from fi nancial fi lings, with only
six companies disclosing water accounting data in their 10-Ks or annual reports. Th e
vast majority of water accounting and other performance information was found in
voluntary reports – sustainability and CSR reports – rather than in fi nancial fi lings.

31Key Findings and Recommendations
Findings by Disclosure Category
Water AccountingData on corporate water performance – including metrics on water use, and
wastewater discharge volume and contaminant load – is critical to assessing water
risk.
Basic water data missing for some companies. Sixty-three percent of the
companies reviewed disclose corporate-wide data on direct water use; 40
percent report data on total wastewater discharge. Th e best water accounting
disclosures came from the semiconductor, chemicals, and mining sectors.
Few provide local-level data. Only 14 companies provide data on water
withdrawals broken down to the site or regional levels. Because water risk is
geographically dependent, this absence of context makes it nearly impossible
for investors and analysts to assess corporate exposure to water scarcity, or
to understand if corporate actions to mitigate risk are either appropriate or
eff ective.
Little geographic context. Only a handful of companies contextualize their
water use by noting the percent or number of facilities operating in water-
stressed regions. Th ese included BP, Diageo, Heineken, Nestlé, and SABMiller.
Supply chain data scant. No companies provide comprehensive data on their
suppliers’ water performance, although a few – including Danone, SABMiller,
and Unilever – provide estimates of the water use embedded in their supply
chains. For example, Danone reports the water footprint for its Milk and
Water divisions at each stage of the product lifecycle, including raw material
production, processing, packaging, and logistics.
Water Accounting Data: Percentage of Companies Reporting
Total water withdrawal
Site/regional water withdrawal
Total wastewater discharge
Site/regional wastewater discharge
Supply chain water footprint
63
40
3
– 10 20 30 40 50 60 70 80 90 100
(%)
8
14
Top Scores: Water Accounting
American Electric Power
Barrick
BP
Diageo
Mitsui
Samsung
Unilever

32 Murky Waters: Corporate Reporting on Water Risk
Risk AssessmentCompanies reported their exposure to water-related risks in four broad categories:
physical, reputational, regulatory, and litigation.
Physical. Th e majority of the companies surveyed (73 percent) report some
exposure to water-related physical risks such as drought.
Reputational. Only nine companies report reputational risks related to water –
these included companies in the beverage, mining, and oil and gas sectors.
Regulatory. Sixty-seven percent of companies disclose some level of water-
related regulatory risk. Companies in the mining, electric power, and oil and gas
sectors report the highest level of regulatory risk.
Litigation. Nearly half (48 percent) report some level of litigation risk – the
electric power, homebuilding, and mining sectors report the most exposure to
litigation risks.
Water Accounting: Average Scores and Ranges by Sector*
20
15
10
5
–Electric
Power
Beverage Chemicals
*Out of 36 possible points
MiningFood Homebuilders Semi-
conductors
Oil &
Gas
79
4 58
4
9
Self-Reported Exposure to Water-Related Regulatory Risks
100
80
60
40
20
0
Elect
ric P
ower
Bever
age
Chemic
als
Min
ing
Food
Hom
ebuild
ing
Sem
iconduct
ors
Oil
& G
as
%
64
20
10
13
40
69
318
15
30
50
31
69
31
62
Quantifi edSpecifi cGeneral
Self-Reported Exposure to Water-Related Physical Risks
100
80
60
40
20
0
Elect
ric P
ower
Bever
age
Chemic
als
Min
ing
Food
Hom
ebuild
ing
Sem
iconduct
ors
Oil
& G
as
%
40
50
13
20
23
69
23
77
20
60
31
62
8
46
27
36
0

33Key Findings and Recommendations
Direct OperationsWater effi ciency and wastewater management are critical to mitigating water
risk, especially for the water-intensive industries evaluated in this report. For most
companies this begins with direct operations, where they have full control and can
reap the benefi ts of reduced water (and energy) bills and lower operating costs.
Limited information on water policies and management systems. Although
most companies disclose having environmental policies or management
systems, only 24 companies detail water-specifi c policies, standards, plans,
or management systems. Th e mining sector stood out for having the best
disclosure on this topic.
Relatively few report water use reduction targets. Targets were scant, with
only one-fi fth (21) of companies disclosing quantifi ed goals to reduce water
use. Of these, only three companies – Diageo, DuPont, and Xstrata – set
reduction targets that were diff erentiated by the level of water stress facing
specifi c facilities.
Even fewer wastewater targets. Just 15 companies disclose goals to reduce
wastewater discharge.
Supply ChainFor many large companies, water use embedded in the supply chain accounts for
the largest portion of their total water footprint. As investors increasingly seek to
understand a company’s full life-cycle exposure to water risk, information on supply
chain management is becoming essential.
Supplier engagement is weak. Very few companies (12) disclose working with
their suppliers to help them reduce water use or wastewater discharge. Of
these, many anecdotally disclose examples of partnerships or capacity building
with specifi c suppliers, but only a few evidence comprehensive programs to
systematically improve the water performance of their supply chains.
Limited disclosure by exposed sectors. For sectors where a signifi cant portion
of the corporate water footprint is found in the supply chain – food, beverage,
electric power, and oil and gas – there was very little discussion of working with
suppliers to manage water risk.
Stakeholder EngagementEven a company with the most responsible and effi cient water management
practices can face risks if the communities surrounding its operations lack access to
clean water, or if other industrial or agricultural users deplete or pollute shared water
resources. Given the interdependence between companies and their neighbors at the
watershed or basin level, disclosure of eff orts to engage stakeholders on watershed
protection or restoration, as well as on drinking water and sanitation, provides
investors with an understanding of how a company is working to mitigate risk,
preserve essential water resources, and maintain its social license to operate across
varied geographies.
Beverage and mining companies lead on stakeholder engagement. Companies in the beverage and mining sectors disclose the most about how
Top Scores: Direct Operations
Diageo
DuPont
Intel
Nestlé
Pinnacle West / APS
Suncor
Xstrata
Top Scores: Supply Chain
General Mills
Intel
SABMiller
Unilever
Top Scores: Stakeholder Engagement
Exxon
Rio Tinto
Th e Coca-Cola Company
Unilever

34 Murky Waters: Corporate Reporting on Water Risk
they are engaging with stakeholders on water-related issues. Homebuilders and
semiconductors had the least to say on this issue.
Comprehensiveness of stakeholder engagement. For most companies, it was
unclear whether the stakeholder engagement activities disclosed were merely
anecdotal or refl ected comprehensive risk management systems.
Watershed management. Th irty-two percent of companies surveyed report
collaborating in some way with local stakeholders on eff orts to protect or
restore watersheds and ecosystems near their operations.
Siting or expanding operations. Despite reputational risks linked to siting
water-intensive projects or facilities, only fi ve companies – all of which were
in the mining or oil and gas sector – disclose engaging or consulting with
stakeholders on the water impacts of siting or expanding operations.
Opportunities: Products & ServicesWater-related product strategies present signifi cant market opportunities in an
increasingly water-stressed world, and include investment in products that improve
water quality or reduce water use by customers. Only homebuilding and chemical
companies were evaluated on this aspect of disclosure due to the fact that their
products, when used, consume water or aff ect water quality. Both sectors included
some discussion of potential market opportunities stemming from water availability
and quality issues.
Chemicals. Two-thirds of the chemical companies reviewed disclose
investment opportunities related to products that save water or improve water
quality. For example, Dow reports investment in a new Water Technology
Development Center in Tarragona, Spain to support the company’s goal of
driving a 35 percent reduction in the cost of water reuse and desalination
technologies by 2015. Agricultural chemical makers Syngenta and Monsanto
both discuss new product lines aimed at helping farmers produce more crops
with less water.
Homebuilding. Five homebuilding fi rms – Beazer, Centex, KB Home, Pulte, and
Toll Brothers – report information on water-saving features for new homes,
including WaterSense appliances, xeriscaping and moisture sensor irrigation
systems.
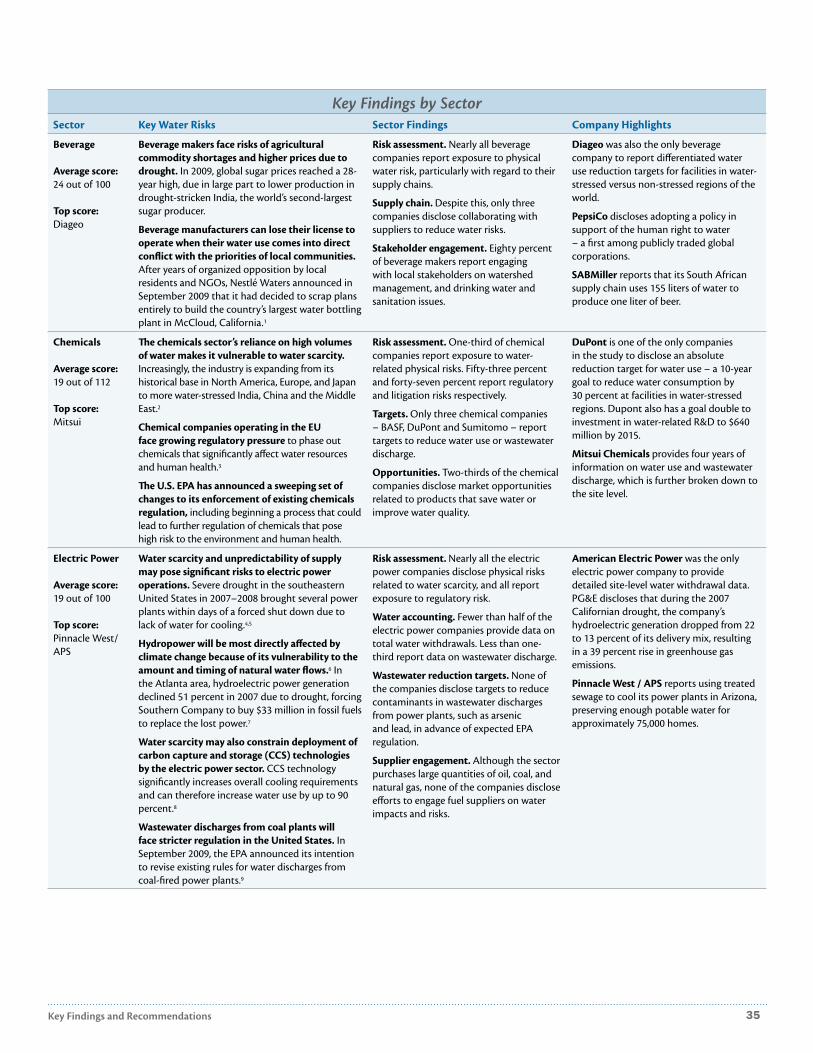
35Key Findings and Recommendations
Key Findings by Sector
Sector Key Water Risks Sector Findings Company Highlights
Beverage
Average score: 24 out of 100
Top score: Diageo
Beverage makers face risks of agricultural commodity shortages and higher prices due to drought. In 2009, global sugar prices reached a 28-
year high, due in large part to lower production in
drought-stricken India, the world’s second-largest
sugar producer.
Beverage manufacturers can lose their license to operate when their water use comes into direct confl ict with the priorities of local communities. After years of organized opposition by local
residents and NGOs, Nestlé Waters announced in
September 2009 that it had decided to scrap plans
entirely to build the country’s largest water bottling
plant in McCloud, California.1
Risk assessment. Nearly all beverage
companies report exposure to physical
water risk, particularly with regard to their
supply chains.
Supply chain. Despite this, only three
companies disclose collaborating with
suppliers to reduce water risks.
Stakeholder engagement. Eighty percent
of beverage makers report engaging
with local stakeholders on watershed
management, and drinking water and
sanitation issues.
Diageo was also the only beverage
company to report diff erentiated water
use reduction targets for facilities in water-
stressed versus non-stressed regions of the
world.
PepsiCo discloses adopting a policy in
support of the human right to water
– a fi rst among publicly traded global
corporations.
SABMiller reports that its South African
supply chain uses 155 liters of water to
produce one liter of beer.
Chemicals
Average score: 19 out of 112
Top score: Mitsui
Th e chemicals sector’s reliance on high volumes of water makes it vulnerable to water scarcity. Increasingly, the industry is expanding from its
historical base in North America, Europe, and Japan
to more water-stressed India, China and the Middle
East.2
Chemical companies operating in the EU face growing regulatory pressure to phase out
chemicals that signifi cantly aff ect water resources
and human health.3
Th e U.S. EPA has announced a sweeping set of changes to its enforcement of existing chemicals regulation, including beginning a process that could
lead to further regulation of chemicals that pose
high risk to the environment and human health.
Risk assessment. One-third of chemical
companies report exposure to water-
related physical risks. Fifty-three percent
and forty-seven percent report regulatory
and litigation risks respectively.
Targets. Only three chemical companies
– BASF, DuPont and Sumitomo – report
targets to reduce water use or wastewater
discharge.
Opportunities. Two-thirds of the chemical
companies disclose market opportunities
related to products that save water or
improve water quality.
DuPont is one of the only companies
in the study to disclose an absolute
reduction target for water use – a 10-year
goal to reduce water consumption by
30 percent at facilities in water-stressed
regions. Dupont also has a goal double to
investment in water-related R&D to $640
million by 2015.
Mitsui Chemicals provides four years of
information on water use and wastewater
discharge, which is further broken down to
the site level.
Electric Power
Average score: 19 out of 100
Top score: Pinnacle West/
APS
Water scarcity and unpredictability of supply may pose signifi cant risks to electric power operations. Severe drought in the southeastern
United States in 2007–2008 brought several power
plants within days of a forced shut down due to
lack of water for cooling.4,5
Hydropower will be most directly aff ected by climate change because of its vulnerability to the amount and timing of natural water fl ows.6 In
the Atlanta area, hydroelectric power generation
declined 51 percent in 2007 due to drought, forcing
Southern Company to buy $33 million in fossil fuels
to replace the lost power.7
Water scarcity may also constrain deployment of carbon capture and storage (CCS) technologies by the electric power sector. CCS technology
signifi cantly increases overall cooling requirements
and can therefore increase water use by up to 90
percent.8
Wastewater discharges from coal plants will face stricter regulation in the United States. In
September 2009, the EPA announced its intention
to revise existing rules for water discharges from
coal-fi red power plants.9
Risk assessment. Nearly all the electric
power companies disclose physical risks
related to water scarcity, and all report
exposure to regulatory risk.
Water accounting. Fewer than half of the
electric power companies provide data on
total water withdrawals. Less than one-
third report data on wastewater discharge.
Wastewater reduction targets. None of
the companies disclose targets to reduce
contaminants in wastewater discharges
from power plants, such as arsenic
and lead, in advance of expected EPA
regulation.
Supplier engagement. Although the sector
purchases large quantities of oil, coal, and
natural gas, none of the companies disclose
eff orts to engage fuel suppliers on water
impacts and risks.
American Electric Power was the only
electric power company to provide
detailed site-level water withdrawal data.
PG&E discloses that during the 2007
Californian drought, the company’s
hydroelectric generation dropped from 22
to 13 percent of its delivery mix, resulting
in a 39 percent rise in greenhouse gas
emissions.
Pinnacle West / APS reports using treated
sewage to cool its power plants in Arizona,
preserving enough potable water for
approximately 75,000 homes.

36 Murky Waters: Corporate Reporting on Water Risk
Food
Average score: 18 out of 100
Top score: Unilever
Food commodity shortages due to drought or changing weather patterns can lead to signifi cant price volatility, as seen by recent spikes in global
rice prices due to drought-induced production
collapses in Australia.
Th ere is growing scrutiny by U.S. regulators of the agricultural sector’s water impacts. For example,
the EPA announced in October 2009 that it would
revaluate the environmental safety of the widely
used pesticide Atrazine.10
Meat producers are particularly vulnerable to lawsuits tied to the environmental impacts of confi ned animal operations. In 2006, a lawsuit
by an environmental advocacy group, alleging
violations of the Clean Water Act against
Smithfi eld Foods, resulted in a settlement in which
the company agreed to implement millions of
dollars in environmental safeguards.11
Risk disclosure. Nearly all the food
companies disclose some level of physical
risk related to water scarcity, particularly
with respect to their supply chains.
Supply chain. Despite the sector’s physical
risk exposure, less than one-third of food
companies report addressing water risk in
their agricultural supply chains.
Reduction targets. Fewer than half report
setting water use reduction targets. Only
one company – Unilever – discloses a
quantifi ed target for reducing wastewater
discharges.
Stakeholder engagement. Nearly half
the companies disclose eff orts to engage
stakeholders on watershed preservation
and drinking water and sanitation issues.
Danone highlights an incentive system
for senior managers that integrates
environmental and social criteria
– including water objectives – into
compensation.
General Mills’ Green Giant division works
with growers to reduce water consumption
and minimize use of agrochemicals for key
crops. Th e company reports a 50 percent
water use reduction goal for its broccoli
growers, and discusses eff orts to help
convert their operations from furrow to
drip irrigation.
Unilever’s Sustainable Agriculture Program
works with agricultural suppliers to
implement water reduction eff orts, and in
Brazil has worked with tomato suppliers to
reduce water use by up to 30 percent.
Homebuilding
Average score: 9
out of 112
Top score: KB Home
Development opportunities for homebuilders may be limited by water availability in several high-growth regions of the United States. Ten of
the 15 fastest-growing metropolitan areas are in
arid western U.S. states.12
Existing or anticipated water shortages may lead regulators to restrict or prohibit housing development in certain regions. In California,
state laws require water agencies to withhold
approvals until determining that suffi cient water
resources exist to serve large new developments for
at least 20 years.13
Homebuilders are increasingly subject to wastewater discharge regulation. In November
2009, the EPA released new guidelines that limit
effl uent discharge for the construction and
development industry.14 Compliance with the new
rule is estimated to cost the industry $1 billion.15
Risk assessment. Eighty percent of the
homebuilders reviewed cite drought or
fl oods as physical risks to their business
and cite regulatory risks linked to storm
and surface water management. Seventy
percent report water-related litigation risks.
Water-related opportunities. Five
companies – Beazer, Centex, KB Home,
Pulte, and Toll Brothers – disclose
investment in and sales of more water-
effi cient homes.
KB Home describes how it is integrating
water-effi cient features into its building
lines, including WaterSense-labeled toilets
and bathroom sink faucets. Th e company is
also partnering with the Southern Nevada
Water Authority and the Southern Nevada
Home Builders Association to create the
fi rst “Water Smart” home, which saves
up to 75,000 gallons of water per year
compared to homes built in the 1990s.
Mining
Average score: 28 out of 100
Top score: Xstrata
Mining operations cannot be relocated, making the sector susceptible to changing local water availability, as well as to pressure from local
communities to reduce water use.
Unaddressed community concerns about the water impacts of mining can lead to loss of social license to operate. In 2004, Newmont relinquished
access to 3.9 million ounces of gold reserves
when thousands of local residents in Cajamarca,
Peru staged protests against the expansion of the
company’s operations over water concerns.16
The Obama administration seeks to curtail mountain top removal by coal miners because of water quality concerns. In October 2009, the
EPA vetoed a water permit for the country’s largest-
ever proposed mountain top coal mine in West
Virginia – the fi rst time the agency has taken such
action since the enactment of the Clean Water Act
in 1972.17
Water accounting. Data reporting in
this sector was relatively strong, with 77
percent reporting water use data and four
mining companies providing site-level data.
Risk disclosure. All the mining companies
report exposure to physical and regulatory
risks, while nearly two-thirds report
litigation risks, and more than one-quarter
report reputational risks.
Direct operations. Th e mining sector had
strong disclosure on water management
eff orts in direct operations, with eight
companies providing information on
water-specifi c management systems,
strategies, or policies.
Stakeholder engagement. Seventy-seven
percent disclose collaborating with local
governments and communities to solve
water-related confl icts and to manage local
water resources.
Alcoa was the only mining fi rm to disclose
a wastewater reduction goal – achieving
zero process water discharge by 2020.
Barrick provides the most comprehensive
water accounting of all the companies
reviewed in this study.
Xstrata discusses the company’s three-
year consultation with communities
surrounding its El Morro project in
northern Chile, an engagement which
infl uenced the mine’s fi nal design and the
decision to build a desalination plant to
supply the site’s entire water needs.
Key Findings by Sector
Sector Key Water Risks Sector Findings Company Highlights
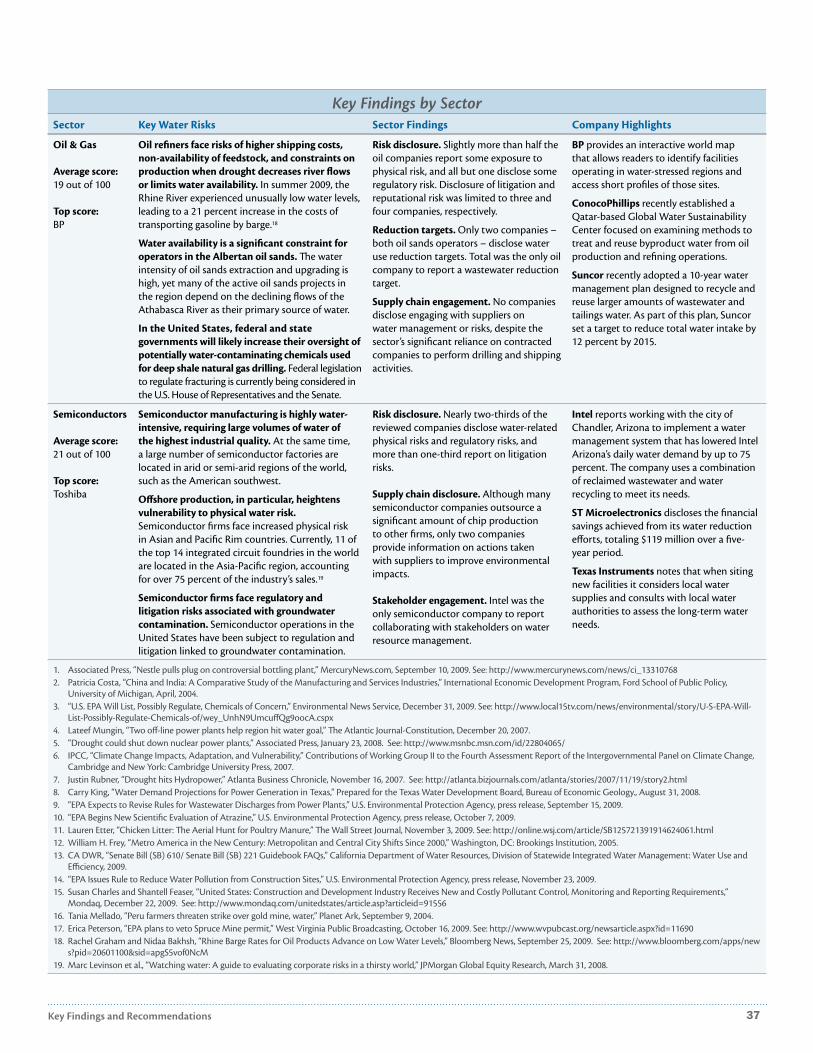
37Key Findings and Recommendations
Oil & Gas
Average score: 19 out of 100
Top score: BP
Oil refi ners face risks of higher shipping costs, non-availability of feedstock, and constraints on production when drought decreases river fl ows or limits water availability. In summer 2009, the
Rhine River experienced unusually low water levels,
leading to a 21 percent increase in the costs of
transporting gasoline by barge.18
Water availability is a signifi cant constraint for operators in the Albertan oil sands. Th e water
intensity of oil sands extraction and upgrading is
high, yet many of the active oil sands projects in
the region depend on the declining fl ows of the
Athabasca River as their primary source of water.
In the United States, federal and state governments will likely increase their oversight of potentially water-contaminating chemicals used for deep shale natural gas drilling. Federal legislation
to regulate fracturing is currently being considered in
the U.S. House of Representatives and the Senate.
Risk disclosure. Slightly more than half the
oil companies report some exposure to
physical risk, and all but one disclose some
regulatory risk. Disclosure of litigation and
reputational risk was limited to three and
four companies, respectively.
Reduction targets. Only two companies –
both oil sands operators – disclose water
use reduction targets. Total was the only oil
company to report a wastewater reduction
target.
Supply chain engagement. No companies
disclose engaging with suppliers on
water management or risks, despite the
sector’s signifi cant reliance on contracted
companies to perform drilling and shipping
activities.
BP provides an interactive world map
that allows readers to identify facilities
operating in water-stressed regions and
access short profi les of those sites.
ConocoPhillips recently established a
Qatar-based Global Water Sustainability
Center focused on examining methods to
treat and reuse byproduct water from oil
production and refi ning operations.
Suncor recently adopted a 10-year water
management plan designed to recycle and
reuse larger amounts of wastewater and
tailings water. As part of this plan, Suncor
set a target to reduce total water intake by
12 percent by 2015.
Semiconductors
Average score: 21 out of 100
Top score: Toshiba
Semiconductor manufacturing is highly water-intensive, requiring large volumes of water of the highest industrial quality. At the same time,
a large number of semiconductor factories are
located in arid or semi-arid regions of the world,
such as the American southwest.
Off shore production, in particular, heightens vulnerability to physical water risk. Semiconductor fi rms face increased physical risk
in Asian and Pacifi c Rim countries. Currently, 11 of
the top 14 integrated circuit foundries in the world
are located in the Asia-Pacifi c region, accounting
for over 75 percent of the industry’s sales.19
Semiconductor fi rms face regulatory and litigation risks associated with groundwater contamination. Semiconductor operations in the
United States have been subject to regulation and
litigation linked to groundwater contamination.
Risk disclosure. Nearly two-thirds of the
reviewed companies disclose water-related
physical risks and regulatory risks, and
more than one-third report on litigation
risks.
Supply chain disclosure. Although many
semiconductor companies outsource a
signifi cant amount of chip production
to other fi rms, only two companies
provide information on actions taken
with suppliers to improve environmental
impacts.
Stakeholder engagement. Intel was the
only semiconductor company to report
collaborating with stakeholders on water
resource management.
Intel reports working with the city of
Chandler, Arizona to implement a water
management system that has lowered Intel
Arizona’s daily water demand by up to 75
percent. Th e company uses a combination
of reclaimed wastewater and water
recycling to meet its needs.
ST Microelectronics discloses the fi nancial
savings achieved from its water reduction
eff orts, totaling $119 million over a fi ve-
year period.
Texas Instruments notes that when siting
new facilities it considers local water
supplies and consults with local water
authorities to assess the long-term water
needs.
1. Associated Press, “Nestle pulls plug on controversial bottling plant,” MercuryNews.com, September 10, 2009. See: http://www.mercurynews.com/news/ci_13310768
2. Patricia Costa, “China and India: A Comparative Study of the Manufacturing and Services Industries,” International Economic Development Program, Ford School of Public Policy,
University of Michigan, April, 2004.
3. “U.S. EPA Will List, Possibly Regulate, Chemicals of Concern,” Environmental News Service, December 31, 2009. See: http://www.local15tv.com/news/environmental/story/U-S-EPA-Will-
List-Possibly-Regulate-Chemicals-of/wey_UnhN9Umcuff Qg9oocA.cspx
4. Lateef Mungin, “Two off -line power plants help region hit water goal,” Th e Atlantic Journal-Constitution, December 20, 2007.
5. “Drought could shut down nuclear power plants,” Associated Press, January 23, 2008. See: http://www.msnbc.msn.com/id/22804065/
6. IPCC, “Climate Change Impacts, Adaptation, and Vulnerability,” Contributions of Working Group II to the Fourth Assessment Report of the Intergovernmental Panel on Climate Change,
Cambridge and New York: Cambridge University Press, 2007.
7. Justin Rubner, “Drought hits Hydropower,” Atlanta Business Chronicle, November 16, 2007. See: http://atlanta.bizjournals.com/atlanta/stories/2007/11/19/story2.html
8. Carry King, “Water Demand Projections for Power Generation in Texas,” Prepared for the Texas Water Development Board, Bureau of Economic Geology., August 31, 2008.
9. “EPA Expects to Revise Rules for Wastewater Discharges from Power Plants,” U.S. Environmental Protection Agency, press release, September 15, 2009.
10. “EPA Begins New Scientifi c Evaluation of Atrazine,” U.S. Environmental Protection Agency, press release, October 7, 2009.
11. Lauren Etter, “Chicken Litter: Th e Aerial Hunt for Poultry Manure,” Th e Wall Street Journal, November 3, 2009. See: http://online.wsj.com/article/SB125721391914624061.html
12. William H. Frey, “Metro America in the New Century: Metropolitan and Central City Shifts Since 2000,” Washington, DC: Brookings Institution, 2005.
13. CA DWR, “Senate Bill (SB) 610/ Senate Bill (SB) 221 Guidebook FAQs,” California Department of Water Resources, Division of Statewide Integrated Water Management: Water Use and
Effi ciency, 2009.
14. “EPA Issues Rule to Reduce Water Pollution from Construction Sites,” U.S. Environmental Protection Agency, press release, November 23, 2009.
15. Susan Charles and Shantell Feaser, “United States: Construction and Development Industry Receives New and Costly Pollutant Control, Monitoring and Reporting Requirements,”
Mondaq, December 22, 2009. See: http://www.mondaq.com/unitedstates/article.asp?articleid=91556
16. Tania Mellado, “Peru farmers threaten strike over gold mine, water,” Planet Ark, September 9, 2004.
17. Erica Peterson, “EPA plans to veto Spruce Mine permit,” West Virginia Public Broadcasting, October 16, 2009. See: http://www.wvpubcast.org/newsarticle.aspx?id=11690
18. Rachel Graham and Nidaa Bakhsh, “Rhine Barge Rates for Oil Products Advance on Low Water Levels,” Bloomberg News, September 25, 2009. See: http://www.bloomberg.com/apps/new
s?pid=20601100&sid=apgS5vof0NcM
19. Marc Levinson et al., “Watching water: A guide to evaluating corporate risks in a thirsty world,” JPMorgan Global Equity Research, March 31, 2008.
Key Findings by Sector
Sector Key Water Risks Sector Findings Company Highlights
38 Murky Waters: Corporate Reporting on Water Risk
Recommendations for CompaniesTh is report highlights a number of opportunities for companies to signifi cantly
improve the relevance, depth, and clarity of their reporting on water:
Inclusion in fi nancial fi lings. Financial fi lings are the gold standard for
reporting material information to investors, including material ESG risk factors
like water scarcity. As underscored by the SEC’s new interpretive guidance,
companies should include material water risk factors and performance data in
these fi lings in order to communicate management oversight and awareness of
key risks and opportunities.
More detailed risk assessment. Boilerplate disclosure of material water risks,
even within fi nancial fi lings, is not enough. Companies should assess and
disclose material water risks in ways that provide investors with suffi cient detail
to understand the scale and scope of exposure, ideally referencing specifi c at-
risk operations or supply chains, and attempting to quantify risks wherever
possible.
Water accounting data that puts performance in context. Aggregate data on
corporate-wide water use and discharge is insuffi cient to provide investors with
insight on key areas of risk. Companies should provide data broken down to the
facility level for operations in water-stressed regions, and put the company’s risk
exposure in context by disclosing the percentage of facilities operating in areas
of water stress.
Disclosure of management strategies and systems. Corporate reporting
should provide detailed explanation of how water risks are being assessed,
addressed by key policies, and integrated into governance and management
systems from the boardroom to the facility-level.
Setting and disclosing reduction targets. Disclosing quantifi ed water use and
wastewater reduction targets communicates commitment, and helps investors
gauge a company’s capacity to minimize risks and prepare itself for a more
water-constrained future. Targets are more credible when articulated with
respect to high-risk operations, and when backed by detailed management
plans.
Addressing water risks in the supply chain. Where water use embedded in
the supply chain accounts for a signifi cant portion of the total water footprint,
companies should disclose how they are collaborating with and evaluating
suppliers on water risks and impacts, and should set goals to improve water
performance in key supply chains.
Engaging critical stakeholders. Companies should provide investors with
an understanding of how they are working to mitigate signifi cant water risks
by engaging critical stakeholders on watershed management and protection,
drinking water and sanitation issues, and on the water impacts of siting and
expanding operations.
Seizing opportunities. Increasingly companies are developing water-related
product strategies that present signifi cant market opportunities in an
increasingly water-stressed world. Information on these strategies, including
relevant product goals and investments are of growing interest to investors.
39Key Findings and Recommendations
Recommendations for InvestorsInvestors should pursue the following steps to help drive better corporate water
disclosure:
Engage companies. Investors should engage the companies they own in key
water-intensive sectors about how they are assessing and disclosing water risks
and related performance information.
Ask asset managers to assess and engage companies on water and other ESG risks and opportunities. Institutional investors should stipulate this to asset
managers in requests for proposals (RFPs) and in annual performance reviews
to ensure that the fi rms managing their money are giving water, climate, and
other sustainability risks the attention they deserve.
Support investor and corporate initiatives to achieve increased water disclosure. Among initiatives that investors should consider supporting are the
Carbon Disclosure Project’s water disclosure initiative and the United Nations’
Principles for Responsible Investment’s eff orts to encourage more companies to
sign on to the CEO Water Mandate and to meet key Mandate commitments,
including increased water reporting.


Detailed Findings by Sector


43Detailed Findings: Beverage Sector
BEVERAGE SECTOR Freshwater is the primary and most important ingredient for the beverage sector,
making beverage companies’ operations especially vulnerable to climate-related risks
aff ecting water availability and quality. In addition, for makers of soda, juice, and
alcoholic beverages, the production of key raw material inputs – sugar, wheat, hops,
corn, grapes, and various fruits – is in many cases water-intensive.1
Overview: Water-Related Risks for the Beverage SectorTh e beverage sector’s operations are especially vulnerable to water-related physical,
reputational, and regulatory risks – as refl ected in many of the fi rms’ disclosures.
Physical RisksFor beverage makers that rely on large, global networks of bottling plants, access
to high quality freshwater is essential to maintaining the quality and safety
of products. Multinational beverage companies like PepsiCo and Th e Coca-Cola
Company are expanding their operations more broadly within emerging markets
such as China and India, where surface and groundwater supplies are often polluted
– or increasingly stressed due to a changing climate and competing water demands
by communities, agriculture, and industry.
Beverage fi rms face risks related to the availability and price of agricultural
inputs to the degree that changing weather conditions and drought aff ect the size
or quality of agricultural production, particularly if crop production cannot be
easily shifted. Global sugar prices have reached a 28-year high, in part due to lower
production in India, which is the world’s second-largest sugar producer. Drought in
India led to a 2008 sugar crop yield 45 percent lower than the previous year, and the
2009-2010 harvest is expected to yield similarly low levels.2
Makers of alcoholic beverages face particular water-related challenges due to
the regional nature of grape- and hop-growing. Th e Australian beverage industry
was exceptionally hard hit by the country’s 2006–2007 drought. Winemakers saw
production losses of 28 percent and in order to meet irrigation demand, several
Australian wine and beer companies purchased water on the open market for the fi rst
time.3 In the United States, a 2006 study by the National Academy of Sciences predicted
that increases in the frequency of days of extreme heat could shrink the premium wine-
grape production area by up to 81 percent by the late 21st century.4 A 2009 study found
that production of Saaz hops — the delicate variety grown in Europe to make pilsner
lager – has decreased in recent years due to rising temperatures.5
1. E. Neville Isdell, Former Chairman and CEO, Th e Coca-Cola Company, “Remarks at the Business for Social
Responsibility Conference,” New York, NY, November 8, 2006. See: http://www.thecoca-colacompany.com/
presscenter/viewpoints_isdell_BSR2006.html
2. Dana Krechowicz, “Environmental Challenges for the Food and Beverage Industry,” World Resources Institute, August 27,
2009. See: http://www.wri.org/stories/2009/08/environmental-challenges-food-and-beverage-industry
3. “Growing Grapes, Not Rice,” Th e New York Times, April 16, 2008. See: http://www.nytimes.com/
imagepages/2008/04/16/business/20080416_WARM2_GRAPHIC.gif.html
4. M.A. White et al., “Extreme heat reduces and shifts United States premium wine production in the 21st century,”
Proc. Natl. Acad. Sci, USA, July 25, 2006 vol. 103 no. 30 11217-11222
5. “Climate change depresses beer drinkers,” New Scientists, September 13, 2009. See: http://www.newscientist.com/
article/mg20327253.400-climate-change-depresses-beer-drinkers.html
“We’re focusing on water because it’s
the main ingredient in nearly every
product we make… because all of
our products are made by local
people in local communities, which
means the success of our business
depends on the availability of local
water resources.”
— E. Neville Isdell, former Chairman
and CEO, Th e Coca-Cola Company1

44 Murky Waters: Corporate Reporting on Water Risk
Reputational RisksBeverage manufacturing requires high quality source water, which can put the
industry’s water use in direct competition with local populations’ water needs
for drinking, food production, and other vital uses. Large water withdrawals – real
or perceived – can result in controversies in regions where water is scarce and local
populations lack access to aff ordable drinking water. Confl ict can also erupt when
community awareness of the ecological value of regional water sources prompts
opposition to the introduction or expansion of beverage or bottling plants. For
example, after years of organized opposition by local residents and environmental
NGOs, Nestlé Waters announced in September 2009 that it had decided to scrap
plans entirely to bottle spring water in McCloud, California.6
Consumer campaigns calling for boycotts against bottled water in certain markets
also present a risk. Consumer demand for bottled water is growing rapidly in many
countries, but fl agging in the United States, as a result of both the recession and
growing consumer concern – prompted by aggressive activist campaigns – about
the environmental impacts of the product. In August 2009, Th e Wall Street Journal
reported that U.S. sales of bottled water dropped six percent, or $7.6 billion, from July
2008 to July 2009.7 In addition, city governments including Seattle, New York, and
San Francisco, responding to activist and citizen pressure, have recently cut contracts
with bottled water companies.8, 9
Regulatory RisksBeverage companies must meet wastewater discharge standards in many regions
of the world, including North America and the European Union. Regulatory
pressure on beverage companies is growing elsewhere, including China. In August
2009, for example, the Beijing Development and Reform Commission, the city’s
economic planning agency, put 12 international and local brewers, beverage
producers, and dairy companies on its “List of Major Water-Polluting Enterprises.”
Th e Commission announced that the beverage producers on the list would be
subject to increased supervision and asked to submit plans to reduce wastewater
discharge and energy use.10
6. Associated Press, “Nestle pulls plug on controversial bottling plant,” MercuryNews.com, September 10, 2009. See:
http://www.mercurynews.com/news/ci_13310768
7. Valerie Bauerlein, “Bottled-Water Price War Heats Up as Demand Falls,” Th e Wall Street Journal, August 31, 2009.
See: http://online.wsj.com/article/SB125167502443470973.html
8. Jennifer Lee, “City Council Shuns Bottle in Favor of Water From Tap,” Th e New York Times, June, 17, 2008.
9. Sandy Bauers, “Th e newest public enemy: bottled water,” Th e Seattle Times, November 12, 2007.
10. “PepsiCo, Coca-Cola reject Beijing environmental watch list,” LiveMint.com, August 20, 2009. See: http://www.
livemint.com/2009/08/20154213/PepsiCo-CocaCola-reject-Beij.html

45Detailed Findings: Beverage Sector
Findings: Water Risk Disclosure in the Beverage Sector
Key FindingsTh e beverage sector demonstrated the second-best water risk disclosure of all the
sectors reviewed, with an average score of 24 out of 100. UK-based Diageo achieved
the highest level of water risk disclosure in the sector, scoring 43 points; Dr Pepper
Snapple demonstrated the weakest disclosure, with a score of eight.
Water accounting. Seventy percent of the beverage companies reviewed disclose
water use data, but only forty percent report data on wastewater discharge.
Water use reduction targets. Sixty percent of beverage companies report
water use reduction targets, while only one company – Diageo – provides a
quantifi ed wastewater discharge goal.
Diff erentiation by region. Diageo was also the only company to report
diff erentiated water use reduction targets for facilities in water-stressed versus
non-stressed regions of the world.
Physical risk from scarcity. Nearly all the beverage companies surveyed disclose
some level of physical risk related to water scarcity, particularly in regard to
their supply chains.
Supply chain. Despite disclosing physical risk in their supply chains, only three
companies report collaborating with suppliers to reduce water risks and impacts.
Stakeholder engagement. Th e beverage sector reports signifi cant engagement
and collaboration with local stakeholders on watershed management, safe
drinking water, and sanitation.
Beverage: Quality of Water Risk Disclosure*
Water accounting Risk assessment Direct operations Supply chainStakeholder engagement Totals**
Potential points per category 36 24 27 7 6 100
Diageo 16 4 21 0 2 43
Anheuser-Busch InBev 12 2 17 0 3 34
Th e Coca-Cola Company 4 6 16 4 4 34
SABMiller 9 4 11 2 4 30
PepsiCo 1 10 11 3 4 29
Heineken 10 4 10 0 1 25
Pernod Ricard 10 0 7 0 1 18
Brown-Forman 4 4 3 0 3 14
Constellation Brands 0 8 1 0 0 9
Dr Pepper Snapple 0 4 4 0 0 8
Evaluation key Water accounting: Data on water use, wastewater discharge, and supplier water use.
Risk assessment: Disclosure of water-related physical, regulatory, reputational and litigation risks.
Direct operations: Disclosure of water-related policies, management systems, non-compliance, conservation activities and reduction targets.
Supply chain: Disclosure of supplier collaboration, assessment, and target-setting related to water risk.
Stakeholder engagement: Disclosure of engagement with local, national and international stakeholders to preserve watersheds and improve access to safe drinking water
and sanitation.
*Based on most recent annual fi nancial fi lings and sustainability reports available as of 6/30/09.
**Companies were scored on an overall scale of 0–100 possible points.
Company Highlights
PepsiCo discloses adopting a policy
in support of the human right
to water – a fi rst among publicly
traded global corporations.
SABMiller profi les its eff orts to
measure the water footprint of its
agricultural supply chain in South
Africa, reporting that an average
of 155 liters of water is used to
produce one liter of beer.

46 Murky Waters: Corporate Reporting on Water Risk
Findings by Indicator
1. Disclosure of Water Accounting
Seven of the 10 surveyed beverage companies report data on their total water
usage for owned and operated facilities. Anheuser-Busch provides a comprehensive
breakdown of water use by product line, as well as by source. Diageo and SABMiller
also break down water use data by the source of withdrawals (municipal, ground or
surface water) and average use by region of the world. Th e Coca-Cola Company’s
water use data extends beyond the typical scope to include data on the water
performance of the company’s bottlers – the majority of which the company does
not control or own.
None of the beverage companies present water use data broken down by the site
or facility level. Diageo stood out, however, for presenting total water use by facilities
in water-stressed versus unstressed regions of the world.
Only four beverage companies report data on wastewater discharge. Of these,
Anheuser-Busch and Diageo also provide data on destination of discharge. None of
the beverage companies reviewed disclose local-level data on wastewater discharge.
SABMiller was the only beverage company to report an estimate of the water use
embedded in the company’s supply chain.
Beverage Sector: Water Accounting Disclosure
Total water withdrawal
Site/regional water withdrawal
Total wastewater discharge
Site/regional wastewater discharge
Supply chain water footprint
70
40
10
0
– 10 20 30 40 50 60 70 80 90 100
Percentage of Companies Reporting
0
SABMiller: Measuring Water Use in the Supply Chain
SABMiller describes its eff ort to
measure the water footprint of its
South African supply chain:
“Undertaken with strategic advice
from WWF, the work identifi ed not
only how much water is used at each
stage of the value chain, but also the
proportion of available local water
resources that this represents… [it
was] determined that a net total of 155
liters of water is used to produce one
liter of beer in South Africa and that
more than 95 percent of this amount is
used in the agricultural phase.”
Source: SABMiller, “SABMiller Sustainable
Development Report 2009.”
See: http://www.sabmiller.com/fi les/
reports/2009_SD_report.pdf

47Detailed Findings: Beverage Sector
2. Disclosure of Risk Assessment
All beverage companies reviewed – with the exception of Pernod Ricard – report
some level of physical risk related to water scarcity. SABMiller, for example,
mentions that scientists anticipate that climatic changes will bring about challenges
in both the sourcing of water as a raw material and the handling of wastewater at the
end of the brewing process.
Only PepsiCo and Heineken report reputational risks specifi c to water and the
environment. PepsiCo, for instance, notes these risks in its 2008 10-K fi ling, stating
that “…water is a limited resource in many parts of the world. Our reputation could
be damaged if we do not act responsibly with respect to water use.”
Th ree companies disclose regulatory risks related to water or wastewater
discharge: Constellation Brands, PepsiCo, and Th e Coca-Cola Company.
Likewise, only three companies disclose litigation risks: Brown-Forman, Dr Pepper
Snapple, and PepsiCo.
PepsiCo: Respecting the Human Right to Water
PepsiCo discloses adopting a policy in support of the human right to water—a fi rst
among publicly traded global corporations.
Th e company notes that “[w]e at PepsiCo respect the human rights recognized by the
countries in which we operate, and will not take any action that would undermine a
state’s obligation to its citizens to protect and fulfi ll the Human Right to Water and,
absent of a country’s Human Right to Water Policy, we commit to operate within the
principles of the Human Right to Water Policy as defi ned by the United Nations.”
PepsiCo’s policy includes commitments to ensure that its activities preserve the
quality, availability, and aff ordability of water resources for local communities. PepsiCo
also agrees to involve communities in its plans to develop water resources.
Source: PepsiCo, “Performance with a Purpose: Water.” See: http://www.pepsico.com/Purpose/
Environment/Water.html
Percentage of Beverage Companies Reporting Water-Related Risks
Physical risks
Reputational risks
Regulatory risks
Litigation risks
40 50
GeneralSpecifi cQuantifi ed
– 10 20 30 40 50 60 70 80 90 100
(%)
20 10
30
20
Anheuser-Busch and Coca-Cola on Water Management
Anheuser-Busch describes its in-
house Water Council: “Anheuser-
Busch works to protect watersheds
within the communities where we do
business through restoration activities,
education and awareness, water-use
reduction measures and innovative
water management techniques.
Formed in 2002, the Anheuser-
Busch Water Council is composed
of representatives throughout the
company with expertise in water policy
who focus on water supply and quality.
Th e Water Council tracks information
regarding water and watershed quality,
water supply, and climate change in
order to identify trends and potential
future impact. Teams throughout the
company then set targets for their
areas to implement programs and align
their policies to achieve the company’s
overall water objectives.”
Coca-Cola reports revising the
company’s Standard for Source Water
Protection, which includes water
source mapping, source vulnerability
assessments, and development and
implementation of source water
protection plans. It expects each plant
in its global system to have a Source
Water Protection Plan in place by
2013. Th e company notes that “[it] will
continue to consider water resources
when planning new manufacturing
sites, deciding on plant closings,
making acquisitions or expanding
production at existing plants.”
Sources: Anheuser-Busch Company, “Anheuser-
Busch Water Council.” See: http://www.
ourpledge.com/Environment/ABWaterCouncil.
html;
Th e Coca-Cola Company, “2007/2008
Sustainability Review.” See: http://www.
theCoca-ColaCompany.com/citizenship/
pdf/2007-2008_sustainability_review.pdf

48 Murky Waters: Corporate Reporting on Water Risk
3. Disclosure of Direct Operations
Only four of the 10 beverage companies surveyed report information on their
water management systems and policies. Of these, Th e Coca-Cola Company and
Anheuser-Busch provide the most comprehensive descriptions.
Six of the 10 beverage companies reviewed disclose water use reduction targets. Of
these, all provide time-bound, effi ciency-based reduction targets on a per-product
basis. None provide absolute reduction targets. Diageo stood out for providing
diff erentiated reduction targets for facilities in water-stressed versus non-stressed
regions of the world. Diageo was also the only beverage company to provide a
quantifi ed wastewater discharge goal: to reduce the “polluting power of effl uent from
our plants by 60 percent between 2007 and 2015.”11
4. Disclosure of Supply Chain
Disclosure on water-related supplier engagement is low with only Th e Coca-Cola
Company, PepsiCo, and SABMiller providing some level of reporting. Coca-Cola
and PepsiCo, for example, both describe how they are working with their bottlers
to improve water effi ciencies in bottling operations. Coke also discusses that it is
working with the World Wildlife Fund to assess the water footprint of its supply
chain for sugar, a crop that requires approximately 180 liters of water to produce the
amount of sugar needed for one liter of Coca-Cola.12
Coca-Cola was the only beverage company to disclose an effl uent target that
extends to its suppliers (bottling partners), as well as to its own plants. Th e
company states a goal “to have 100 percent of our facilities aligned with our stringent
internal wastewater standards by the end of 2010.”13 Th e specifi cs of the wastewater
standard, however, are not reported.
5. Disclosure of Stakeholder Engagement
Seven of the 10 beverage companies reviewed report some level of water-related
stakeholder engagement. A number of companies discuss their involvement with
relevant international multi-stakeholder initiatives, such as the CEO Water Mandate,
as well as their support of drinking water and sanitation projects around the world.
Diageo, for example, highlights its contributions to the UN Millennium Development
Goal to halve the proportion of people without sustainable access to safe drinking
water. Th e company reports that, as of June 2008, it had begun or completed 40
water projects in 10 countries, supporting technologies ranging from rainwater
harvesting to water fi lters to boreholes. An independent evaluation confi rmed that
the projects provided water to an additional 1.18 million people around the world.14
Several beverage companies, including Brown-Forman, SABMiller, Coca-Cola and
PepsiCo discuss specifi c strategies related to preserving or restoring watersheds in
which they operate.
11. Diageo, “Corporate Citizenship Report 2008.”
12. Th e Coca-Cola Company, “2007–2008 Sustainability Review.”
13. Ibid.
14. Diageo, “Corporate Citizenship Report 2008.”
Stakeholder Engagement for Water Resource Management
Coca-Cola reports partnering with the
Environmental Law Institute to build
the capacity of its staff and bottling
partners to more eff ectively engage
with community stakeholders in their
water resource management activities.
Th e project partners are conducting a
series of capacity-building workshops
to provide staff training on stakeholder
engagement in water resources
management. Recognizing the need
for collective action in communities,
the company plans to roll out the
workshops globally in coming years.
PepsiCo reports that its Indian
operations reduced water use in
manufacturing by more than 55
percent over the past fi ve years. In
addition, it discloses that it is working
with rice farmers near its facilities
to reduce water intensity in paddy
cultivation by around 30 percent. In
2007, PepsiCo piloted this program
on 100 acres; it was scaled up to cover
1,000 acres in 2008. Th e company
notes that “[t]he signifi cant impact of
this change can be gauged from the
fact that if only 6,000 acres of paddy
cultivation were shifted to direct
seeding, it would off set the entire
water used in PepsiCo India’s beverage
plants.”
Sources: Th e Coca-Cola Company, “2007/2008
Sustainability Review.” See: http://www.
theCoca-ColaCompany.com/citizenship/
pdf/2007-2008_sustainability_review.
pdf; PepsiCo, “2007 Sustainability Report.”
See: http://www.pepsico.com/Download/
PEPSICO_2007_Sustainability_Report.pdf

49Detailed Findings: Chemicals Sector
CHEMICALS SECTORTh e chemicals sector uses a signifi cant quantity of water for core production
processes such as cooling, cleaning, dissolving, and diluting, as well as generating
steam. Th e industry also has signifi cant impacts on water quality through wastewater
discharges and potential spills associated with the manufacture and storage of
chemicals.
It is the industry’s products, however – the thousands of chemical compounds and
applications sold for use by downstream industries and consumers – that aff ect
water resources the most. Many chemical compounds pose signifi cant risks of
contaminating surface or groundwater and thereby damaging aquatic life and human
health. Chemical fi rms also play a signifi cant role in the global water industry itself,
supplying products that sterilize, purify and desalinate water for residential and
industrial use. In addition, a number of life sciences-based chemical companies are
developing drought-resistant seeds and other agricultural inputs designed for an
increasingly water-stressed world.15
Overview: Water-Related Risks for the Chemicals SectorTh e chemicals sector’s operations are vulnerable to all four water-related risks:
physical, reputational, regulatory, and litigation.
Physical RisksTh e chemicals sector’s reliance on high volumes of water and growing global
presence makes it vulnerable to water scarcity. Increasingly, the industry’s
manufacturing footprint is expanding from its historical base in North America,
Europe and Japan to more water-stressed regions of the world including the Middle
East, India, and China.16
Reputational RisksChemical companies face reputational risks related to accidents, spills, or product
impacts on water resources and the environment. For example, even eight years
after acquiring the assets of Union Carbide, Dow Chemical continues to be under fi re
for failing to remediate water and soil contamination and to provide compensation
to the 150,000 residents of Bhopal, India suff ering from the eff ects of a massive
explosion at a Union Carbide factory over twenty years ago. As recently as February
2009, the state of Maharashstra, India ordered Dow to relocate a proposed research
center after local villagers attacked the construction site and set fi re to an offi ce
and company vehicles over concerns the facility would pollute the area as it had in
Bhopal.17
15. “UN chief urges world to put looming water crisis at top of global agenda,” U.S. Water News Online, February
2008. See: http://www.uswaternews.com/archives/arcglobal/8unxxchie2.html
16. Patricia Costa, “China and India: A Comparative Study of the Manufacturing and Services Industries,”
International Economic Development Program, Ford School of Public Policy, University of Michigan, April, 2004.
17. Rina Chandran and Krittivas Mukherjee, “India State to Shift Dow Site After Protests: Report,” Reuters, February
2, 2009. See: http://www.reuters.com/article/idUSTRE5111D020090202
“Water is today’s issue. It is the oil of
this century — not a question.”
—Andrew Liveris, Chairman and CEO, Dow Chemical Co.15
50 Murky Waters: Corporate Reporting on Water Risk
Reputational risks also exist for new or emerging technologies like nanotechnology,
which may have the potential to aff ect water and aquatic ecosystems. Nanosilver,
known for its antimicrobial properties, can be added to plastics – such as food
containers, water bottles, countertops, shower curtains, and fl oor coverings – as
well as to textiles and building materials. In the United States, numerous consumer,
health, and environmental groups have petitioned the EPA for tighter regulation of
nanosilver, claiming that nanosilver products have novel properties that can leach
into water and may pose unknown risks to human health and the environment.18
Regulatory RisksChemical companies operating in the European Union face growing pressure to
phase out the production of chemicals that signifi cantly aff ect water resources and
human health. Th e EU’s Water Framework Directive, enacted in 2000, is driving the
phase out of 33 priority chemicals with the goal of improving water quality in key
river basins. By June 2011, REACH – the EU regulation that addresses the production
and use of chemicals with potential impacts on human health and the environment
– will require users of “substances of very high concern” to develop plans to replace
these chemicals with safer alternatives.19
In September 2009, the Obama administration announced new principles to
guide Congress in updating the 33-year-old law that governs how the EPA controls
toxic chemicals, saying the current law is inadequate to protect against risks.20 Th e
proposed changes would require manufacturers to supply enough information to
conclude that new and existing chemicals are safe and don’t endanger public health
or the environment.
Th e EPA simultaneously announced a sweeping set of changes to its enforcement
of existing chemicals regulation, noting that it intends to utilize the full array of
regulatory tools under the Toxic Substances Control Act to address risks, including
authority to label, restrict, or ban chemicals.21 In December 2009, for the fi rst time,
the agency used its authority to list four categories of high-risk chemicals, beginning
a process that could lead to further regulation of these chemicals.22
New legislation on chemical plant security is also working its way through the U.S.
Congress. In November 2009, the U.S. House of Representatives passed the Chemical
and Water Security Act of 2009 (H.R. 2868).23 Th is legislation requires high-risk
chemical plants in the United States to switch to “safer processes” such as reducing
production, processing, storage, and use of dangerous chemicals, or changing the
characteristics of chemicals to make them less dangerous.
18. Andrew Schneider, “Experts Explore Risks of Nanotechnology in Clothes,” Sphere, December 4, 2009.
19. “Regulation (EC) No 1907/2006 of the European Parliament and of the Council of 18 December 2006 concerning
the Registration, Evaluation, Authorisation and Restriction of Chemicals,” Offi cial Journal of the European Union,
December 30, 2006. See: http://eur-lex.europa.eu/JOHtml.do?uri=OJ:L:2006:396:SOM:en:HTML
20. Sara Goodman, “Experts Debate Ways to Reform 1976 Toxics Law,” Th e New York Times, October 7, 2009. See:
www.nytimes.com/.../07greenwire-experts-debate-ways-to-reform-1976-toxics-law-83495.html
21. Lisa P. Jackson, “Enhancing EPA’s Chemical Management Program,” U.S. Environmental Protection Agency. See:
http://www.epa.gov/oppt/existingchemicals/pubs/enhanchems.html
22. “U.S. EPA Will List, Possibly Regulate, Chemicals of Concern,” Environmental News Service, December 31, 2009.
See: http://www.local15tv.com/news/environmental/story/U-S-EPA-Will-List-Possibly-Regulate-Chemicals-of/
wey_UnhN9Umcuff Qg9oocA.cspx
23. 11th Congress, 2009-2010, H.R. 2868. See: http://www.govtrack.us/congress/bill.xpd?bill=h111-2868

51Detailed Findings: Chemicals Sector
In China, regulation of the chemicals sector’s water impacts is still weak, but the
country’s environmental regulatory agency, SEPA, faces mounting pressure to
improve oversight of the country’s waterways. A recent government survey of the
Chinese chemicals industry revealed that nearly half of the country’s 21,000 chemical
plants are sited near drinking water supplies along the Yangtze and Yellow Rivers.24
In November 2005, 100 tons of carcinogenic benzene were released into the Songhua
River after an explosion at a petrochemical plant – leaving nearly four million
people without water for four days.25 Th e incident, the largest and most publicized
chemical spill in Chinese history, triggered a revision of the country’s Water Pollution
Control Law. Th e new act, announced in February 2008, raised penalties, eliminated
some loopholes and introduced environmental regulation as a measure of local
government performance.26
Litigation RisksChemical companies face signifi cant litigation risks linked to water-related
impacts from their facilities and products. For example, 43 water systems in six U.S.
states – Illinois, Indiana, Iowa, Kansas, Mississippi and Ohio – are in litigation with the
makers of atrazine (a popular weed killer that the EU banned in 2004) to force the
company to pay to remove the chemical from drinking water.27
24. Jennifer L. Turner, “In Deep Water: Ecological Destruction of China’s Water Resources,” Wilson Center, 2007. Ch. 5.
See: http://wilsoncenter.org/index.cfm?topic_id=1421&fuseaction=topics.documents&group_id=396236
25. “Northeast cleans up after chemical blast,” Asia Times, November 30, 2005.
26. Nadya Ivanova, “China’s Dirty Water Leads to Protests, Some Reform,” Circle of Blue News, September 9, 2009. See:
http://www.circleofblue.org/waternews/2009/world/chinas-dirty-water-leads-to-protests-some-reform/
27. Charles Duhigg, “Debating How Much Weed Killer Is Safe in Your Water Glass,” Th e New York Times, August 22,
2009. See: http://www.nytimes.com/2009/08/23/us/23water.html?_r=2

52 Murky Waters: Corporate Reporting on Water Risk
Findings: Water Risk Disclosure in the Chemicals Sector
Key FindingsTh e chemicals sector showed weak water risk disclosure overall, with an average score
of 19 out of 112. Th e Japanese fi rm Mitsui achieved the highest score in the sector
with 33 points; Saudi Basic provided the weakest disclosure, coming in at fi ve points.
Water accounting. Th e sector showed strong disclosure of water accounting
data. Eighty percent of the companies reviewed report data on water usage and
wastewater discharge, and three companies provide site-level breakdowns of
their water use.
Reduction targets. Only three chemical companies – BASF, DuPont, and
Sumitomo – report targets to reduce water use or wastewater discharge.
Risk disclosure. Only one-third of chemical companies disclose water-related
physical risks, but half disclose some form of regulatory risk.
Market opportunities. Two-thirds of the chemical companies disclose market
opportunities related to products that save water or improve water quality.
Chemicals: Quality of Water Risk Disclosure*
Water
accountingRisk
assessmentDirect
operationsSupply chain
Stakeholder engagement Opportunities Totals**
Potential points per category 36 24 27 7 6 12 112
Mitsui 22 4 5 0 2 0 33
Sumitomo Chemical 20 2 6 0 1 3 32
PotashCorp 21 6 0 0 2 2 31
DuPont 3 8 8 0 2 2 23
Monsanto 11 4 2 0 3 3 23
Syngenta 9 4 3 0 2 4 22
Dow 6 6 4 0 0 5 21
BASF 10 2 4 0 1 3 20
Reliance Industries 10 0 6 0 1 0 17
Mosaic 0 12 3 0 0 0 15
Praxair 6 4 3 0 0 0 13
PPG Industries 0 4 6 0 0 1 11
Air Liquide 10 0 0 0 0 0 10
Linde 7 0 0 0 0 3 10
Saudi Basic 0 0 3 0 1 1 5
Evaluation key Water accounting: Data on water use, wastewater discharge, and supplier water use.
Risk assessment: Disclosure of water-related physical, regulatory, reputational and litigation risks.
Direct operations: Disclosure of water-related policies, management systems, regulatory compliance, conservation activities and reduction targets.
Supply chain: Disclosure of supplier collaboration, assessment, and target-setting related to water risk.
Stakeholder engagement: Disclosure of engagement with local, national and international stakeholders to preserve watersheds and improve access to safe drinking water
and sanitation.
Opportunities: Disclosure of investment in and sales of water-effi cient products.
*Based on most recent annual fi nancial fi lings and sustainability reports available as of 6/30/09.
**Companies were scored on an overall scale of 0-112 possible points.
Company Highlights
Dow reports construction of a new
Water Technology Development Center
to support the company’s goal of
driving a 35 percent reduction in the
cost of water reuse and desalination
technologies by 2015.
DuPont is one of the only companies
in the study to disclose an absolute
reduction target for water use. Th e
company has a 10-year goal to reduce
water consumption by at least 30
percent at company facilities located in
water-scarce or stressed regions.

53Detailed Findings: Chemicals Sector
Findings by Indicator
1. Disclosure of Water Accounting
Th e majority (12 of 15) of the chemical companies surveyed report some data
on water usage. Only Mosaic, PPG Industries, and Saudi Basic failed to provide
information on this indicator. Th ree companies – Mitsui, PotashCorp, and Sumitomo
Chemical – disclose site-level water use data. All 12 companies that report water
usage also report information on wastewater discharge. Only Sumitomo and Mitsui
disclose site-level wastewater discharge data.
2. Disclosure of Risk Assessment
Only one-third (5 of 15) of chemical companies report water-related physical
risks. Th eir disclosures highlight water scarcity, adverse weather conditions, excessive
rainfall and hurricanes as potential water-related risks.
Fifty-three percent of companies disclose some form of regulatory risk,
particularly with respect to changing government legislation related to groundwater
contamination and remediation technologies.
Forty-seven percent present information on litigation risks.
None of the companies disclose any water-related reputational risks.
Chemicals Sector: Water Accounting Disclosure
Total water withdrawal
Site/regional water withdrawal
Total wastewater discharge
Site/regional wastewater discharge
Supply chain water footprint
80
80
13
0
– 10 20 30 40 50 60 70 80 90 100
Percentage of Companies Reporting
20
Percentage of Chemical Companies Reporting Water-Related Risks
Physical risks
Reputational risks
Regulatory risks
Litigation risks
20 13
GeneralSpecifi cQuantifi ed
– 10 20 30 40 50 60 70 80 90 100
(%)
40 13
0
20 27
Mitsui & PotashCorp: Detailed Water Accounting
Both Mitsui Chemicals and
PotashCorp disclose comprehensive
water performance data. Mitsui’s 2008
CSR report provides four years of data
on total water consumption. Th e data
is further broken down to the site
level, allowing the reader to compare
performance across all the company’s
Japanese facilities. Similarly, Mitsui
reports four years of contaminant
discharges to water from each of its
sites, including COD, nitrogen, and
phosphorous. PotashCorp provides
a similar level of detail across its
operating sites, and also breaks down
water use by business segment.
Sources: Mitsui, “CSR Report 2008.” See:
http://www.mitsuichem.com/csr/report/
pdf/csr2008_e.pdf; PotashCorp, “Online
Sustainability Report ’08.” See: http://www.
potashcorp.com/media/pdf/sustainability/
reports/2008/POT_SR2008.pdf
DuPont’s Water Target
DuPont is one of the few companies
in the entire study to disclose an
absolute reduction target for water
use. Th e company has set a 10-year
goal to reduce water consumption
by at least 30 percent at company
facilities located in water-scarce or
stressed regions. In addition to this
goal, DuPont also commits to holding
its company-wide water consumption
fl at on an absolute basis through the
year 2015, off setting any increased
demand from production volume
growth through conservation, reuse,
and recycling.
Source: DuPont, “2008 Sustainability Progress
Report.” See: http://www2.dupont.com/
Sustainability/en_US/assets/downloads/
DuPont_2008_Sustainability_Progess_Report.

54 Murky Waters: Corporate Reporting on Water Risk
3. Disclosure of Direct Operations
Over half (8 of 15) of the reviewed companies report information on general
environmental management systems, but none provided information on water-
specifi c management systems or policies. Only one-third disclose information on
eff orts to reduce water use or recycle water. Disclosure related to water quality is
even poorer, with just three companies reporting on eff orts to reduce wastewater
discharge.
Only two chemical companies – DuPont and Sumitomo – disclose water use
reduction targets. BASF and Sumitomo were the only companies reporting targets
for wastewater discharge.
4. Disclosure of Supply Chain
None of the chemical companies reviewed disclose any programs or initiatives to
engage suppliers on water use or water quality.
5. Disclosure of Stakeholder Engagement
More than half the chemical companies report engaging stakeholders on
water resource management. Four of the 15 companies disclose some form of
international-level stakeholder engagement, fi ve companies discuss collaboration
with local governments to address drinking water and sanitation issues, and three
companies report watershed management eff orts. Monsanto, for instance, reports
partnering with Th e Nature Conservancy to work with farmers in the watersheds of
the upper Mississippi River Basin to identify conservation techniques that best retain
nutrients on-farm.
6. Disclosure of Water-Related Opportunities
Two-thirds (10 of 15) of the chemical companies reviewed disclose market
opportunities related to products intended to save water or improve water
quality. Four companies disclose new investments in R&D to bring more water-
effi cient products to market. For instance, Dow reports construction of a new Water
Technology Development Center at the company’s facilities in Tarragona, Spain to
support the goal of driving a 35 percent reduction in the cost of water reuse and
desalination technologies by 2015. Similarly, DuPont stated that it aims to double
investment in water-related R&D programs to $640 million by 2015.
Agricultural chemical makers Syngenta and Monsanto both discuss new product
lines aimed at helping farmers to produce more crops with less water. BASF highlights
a new plastic used in fi lter membranes for cleaning and treating water. Linde reports
on the company’s CO2-based water treatment technologies.
Syngenta, Monsanto & BASF: Developing Drought-Resistant
Products
Syngenta reports developing crop
varieties that can tolerate drier
conditions, including drought-resistant
corn and sunfl owers, rice strains with
low water needs, and sugar beets
that can grow in tropical climates. It
highlights a new product – Invinsa™ –
developed to protect crop yield during
extended periods of high temperature
and mild-to-moderate drought – in
other words, conditions expected to
result from climate change.
Monsanto has set a goal of reducing
by one-third the amount of irrigated
water needed to produce a metric ton
of corn, cotton, soybeans or spring-
planted canola in 2030, compared
with the base year 2000. Its strategy
is to develop seeds that produce
higher-yielding crops with the same
or fewer resources. To meet this goal,
it has partnered with BASF on a $1.5
billion R&D collaboration in plant
biotechnology focused on increasing
the drought-resistance of these crops.
Sources: Syngenta, “Annual Review 2008.”
See: http://www.syngenta.com/ar2008/
usingNatRes.html; Monsanto, “2008-2009
Responsibility & Sustainability Report.”
See: http://www.monsanto.com/pdf/
responsibility/2008-2009_mon_csr_report.pdf

55Detailed Findings: Electric Power Sector
ELECTRIC POWER SECTORTh e U.S. electric power industry accounts for 41 percent of the country’s total
freshwater withdrawals, requiring an estimated 136 billion gallons a day for
generating and then cooling the steam that drives electric turbines.28 Th e water-
intensiveness of electric power generation varies both by cooling technologies used
(e.g. once-through versus and closed-cycle cooling) and by fuel stock, with fossil
fuels and nuclear power requiring more water for cooling than wind, natural gas, and
photovoltaic solar power.29, 30
Electric power plants – particularly those fueled by coal – are also major sources of
heavy metal pollution in waterways, and account for 94 percent of all water releases
of arsenic in the United States.31 Traditionally power plants have emitted the heavy
metals from combusted fuels into the air via smoke stacks. However, due to stronger
air pollution laws, these contaminants are increasingly collected in air pollution
fi ltering devices and then added to plants’ wastewater effl uent, which is discharged
into lakes and rivers.32
Overview: Water-Related Risks for the Electric Power SectorTh e electric power sector faces signifi cant physical, regulatory, and litigation risks
related to water.
Physical RisksWater scarcity and unpredictability of supply may pose signifi cant risks to electric
power operations. Severe drought in the southeastern United States in 2007-2008
brought several power plants within days of a forced shut down due to lack of water
for cooling.33, 34 Since 2000, ongoing drought conditions in the western United States
have threatened hydroelectric operations at Nevada’s Hoover Dam, jeopardizing a
signifi cant source of power for Los Angeles.35 Scientists predict that by 2025 water
scarcity will result in constraints on electricity production in Arizona, Utah, Texas,
Louisiana, Georgia, Alabama, Florida, California, Oregon, and Washington.36
28. Joan F. Kenny, et. al., “Estimated Use of Water in the United States in 2005,” U.S. Geological Survey Circular 1344.
See: http://water.usgs.gov/watuse/data/2005/
29. “Linking Water, Energy & Climate Change: A proposed water and energy policy initiative for the UN Climate
Change Conference, COP15, in Copenhagen 2009,” DHI, Draft Concept Note, January 2008.
30. Concentrated (as opposed to photovoltaic) solar power systems can be water-intensive, requiring equivalent
amounts of water as some coal plants if water-cooling rather than air-cooling is used.
31. Piper Crowell and John Rumpler, “Wasting Our Waterways: Toxic Industrial Pollution and the Unfulfi lled Promise
of the Clean Water Act,” Environment America Research & Policy Center, Fall 2009.
32. Charles Duhigg, “Cleansing the Air at the Expense of Waterways,” Th e New York Times, October 12, 2009. See:
http://www.nytimes.com/2009/10/13/us/13water.html
33. Lateef Mungin, “Two off -line power plants help region hit water goal,” Th e Atlantic Journal-Constitution,
December 20, 2007.
34. Associated Press, “Drought could shut down nuclear power plants,” January 23, 2008. See: http://www.msnbc.
msn.com/id/22804065/
35. John Lippert and Jim Efstathiou Jr., “Las Vegas Running Out of Water Means Dimming Los Angeles Lights,”
Bloomberg News, February 26, 2009. See: http://www.bloomberg.com/apps/news?pid=20601109&sid=a_
b86mnWn9.w
36. S.R. Bull et al., “Eff ects of climate change on energy production and distribution in the United States,” U.S.
Climate Change Science Program, Washington, DC, 2007, pp. 45-80.
56 Murky Waters: Corporate Reporting on Water Risk
Hydropower is likely to be most directly aff ected by climate change because of its
sensitivity to the amount and timing of natural water fl ows.37 In the Atlanta area,
hydroelectric power generation by the local utility declined 51 percent in 2007 due
to drought, forcing the utility’s parent fi rm, Southern Company, to buy $33 million
in carbon-intensive fossil fuels to replace the lost power.38 In the Pacifi c Northwest,
hydropower accounts for approximately 70 percent of the electrical energy
generated. A recent study projecting the eff ects of climate change on energy supply
in the region found that substantial changes in the amount and seasonality of water
supply would lead to an estimated decrease in regional hydropower production
during summer months of nine to 11 percent by 2020.39
Water scarcity may also constrain deployment of carbon capture and storage
(CCS) technologies by the electric power sector. In the United States, major
investments are already being made in projects to store underground carbon
emissions generated by coal-fi red power plants – three commercial scale CCS
projects are currently underway – and more are expected if federal climate change
legislation is passed.40 However, CCS technology signifi cantly increases overall
cooling requirements and can therefore increase water use by up to 90 percent.41
Th is is particularly problematic for electric power companies operating in regions
of the United States that depend on coal for fuel supplies but face growing water
constraints, such as the southeast.
Regulatory RisksReduced water for cooling and higher temperatures of available water pose
increased regulatory risk for electric utilities. In many countries, including the
United States, regulations limit the temperature of water discharged by power
plants, in order to mitigate heat-related damage to aquatic species. When a heat
wave raises river temperatures, power plants – particularly nuclear plants – may not
achieve suffi cient cooling within permit limits, and may be forced to reduce their
power output. During the 2003 heat wave in France responsible for approximately
15,000 deaths, 17 nuclear reactors had to reduce power output because of the high
temperatures of cooling water.42
37. IPCC, “Climate Change Impacts, Adaptation, and Vulnerability,” Contributions of Working Group II to the Fourth
Assessment Report of the Intergovernmental Panel on Climate Change, Cambridge and New York: Cambridge
University Press, 2007.
38. Justin Rubner, “Drought hits Hydropower,” Atlanta Business Chronicle, November 16, 2007. See: http://atlanta.
bizjournals.com/atlanta/stories/2007/11/19/story2.html
39. Alan F. Hamlet, et. al., “Eff ects of projected climate change on energy supply and demand in the Pacifi c
Northwest and Washington State,” Department of Civil and Environmental Engineering, University of
Washington, 2008.
40. “Secretary Chu Announces $3 Billion Investment for Carbon Capture and Sequestration,” U.S. Department of
Energy, press release, December 4, 2009.
41. Carry King, “Water Demand Projections for Power Generation in Texas,” Prepared for the Texas Water
Development Board, Bureau of Economic Geology, August 31, 2008.
42. Marc Poumadere, et al. “Th e 2003 Heat Wave in France: Dangerous Climate Change Here and Now.” Risk
Analysis, Vol. 25, No. 6. December 2005, pp. 1483-1494.

57Detailed Findings: Electric Power Sector
Regulatory denial of power plant construction permits based on water concerns is
precedented and expected to increase. In 2004, local regulators rejected a proposed
720 MW plant near Kingman, Arizona because of concerns about how much water it
would draw from the local aquifer.43 In 2006, the Idaho state assembly unanimously
passed a moratorium on the construction of new coal-fi red power plants due to
water and other environmental concerns, leading Sempra Energy to scrap its plans to
build a 1,200 MW power plant in the state.44
Wastewater discharges from coal plants contaminate waterways and local
drinking supplies, and will face stricter regulation in the United States. In
September 2009, the EPA announced its intention to revise existing rules for water
discharges from coal-fi red power plants.45 Th e EPA’s decision is driven by the high
level of pollutants in coal plant discharges and the expectation that these discharges
will increase signifi cantly in coming years, as new air pollution equipment is installed.
Th ese rules will for the fi rst time regulate the signifi cant volume of arsenic, mercury,
selenium, lead and similar pollutants released annually in the plants’ wastewater
streams.46
Coal combustion waste is likely to be regulated and coal ash impoundments are
facing heightened scrutiny. Toxic waste from coal-fi red power plants became a
national concern in December 2008 when the Tennessee Valley Authority’s Kingston
plant spilled 1.1 billion gallons of coal ash into a river, an accident heralded as the
biggest environmental disaster of its kind.47 Th e clean-up costs for the spill are
estimated at up to $1.2 billion, not including potential litigation costs or fi nes.48 In
August 2009, the EPA issued a report identifying 584 coal ash dumps across the
country, more than twice the number than had been previously identifi ed.49
Th e EPA is currently considering whether to regulate coal combustion waste as
hazardous waste and/or whether to regulate the structural integrity of coal ash
surface impoundments through wastewater discharge permits.50 A 2007 analysis by
the Department of Energy pegged the industry’s costs of meeting coal ash regulation
based on receiving a “hazardous” designation as high as $11 billion a year.51
43. April Reese, “Western Power Plants Come Under Scrutiny as Demand and Drought Besiege Supplies,” Land Letter,
March 4, 2004.
44. Craig D. Rose, “Sempra Abandons Bid to Build 2 Coal-Fired Electric Plants,” Th e San Diego Union-Tribune, March
30, 2006. See: http://www.redorbit.com/news/science/451070/sempra_abandons_bid_to_build_2_coalfi red_
electric_plants/index.html
45. “EPA Expects to Revise Rules for Wastewater Discharges from Power Plants,” U.S. Environmental Protection
Agency, press release, September 15, 2009.
46. Taryn Luntz, “EPA to Limit Metal Discharges From Coal Plants,” Th e New York Times, September 15, 2009. See:
http://www.nytimes.com/gwire/2009/09/15/15greenwire-epa-to-limit-metal-discharges-from-coal-plants-62391.
html
47. Ibid.
48. “TVA Reports Fiscal Year 2009 Financial Results,” Tennessee Valley Authority, press release, November 25, 2009.
49. Sue Sturgis, “EPA reveals almost twice as many dangerous coal ash dumps as previously known,” Facing South,
Th e Institute for Southern Studies, August 31, 2009. See: http://www.southernstudies.org/2009/08/epa-reveals-
almost-twice-as-many-dangerous-coal-ash-dumps-as-previously-known.html
50. “Coal Combustion Residue: Status of EPA’s Eff orts to Regulate Disposal,” U.S. Government Accountability Offi ce,
press release, October 30, 2009. See: http://www.gao.gov/new.items/d1085r.pdf
51. Shaila Dewan, “Hundreds of Coal Ash Dumps Lack Regulation,” Th e New York Times, January 6, 2009. See: http://
www.nytimes.com/2009/01/07/us/07sludge.html

58 Murky Waters: Corporate Reporting on Water Risk
Litigation RisksElectric power companies face scrutiny and potential legal action from advocacy
groups, communities, and residents over their use of and impacts on freshwater.
In 2009, Virginia Power, a division of Dominion Resources, lost a legal challenge by
an environmental group contesting its right to draw one million gallons of water
per minute per reactor from a man-made lake to cool its plant in Louisa county,
Virginia.52 Th e Richmond Circuit Court ruled that Virginia Power’s water quality
permit violated the Clean Water Act, delaying construction of an additional nuclear
reactor on the site.53
Inter-state legal battles over water rights can aff ect electric power companies.
Georgia, Florida, and Alabama have been fi ghting for nearly 20 years over how
to allocate water from the shared Apalachicola-Chattahoochee-Flint river basin.
All three states have seen signifi cant population and economic growth in recent
decades, and thus increased residential and industrial demand for water. Georgia, in
particular, has been gripped by drought. In July 2009, a federal judge ruled that the
U.S. Army Corps of Engineers had been illegally drawing water from Lake Lanier for
Atlanta’s needs, and that most Atlanta-area counties would have to stop withdrawing
water from the lake within three years unless the U.S. Congress intervenes.54 As a
result, Southern Company, which has power plants in all three states, may be faced
with new constraints on its water withdrawals.
52. Rebecca Smith, “Water Worries Shape Local Energy Decisions,” Th e Wall Street Journal, March 26, 2009. See:
http://online.wsj.com/article/SB123802383042842123.html
53. Carlos Santos, “Judge Rules Against Dominion on North Anna permit,” Richmond Times-Dispatch, February 23,
2009. See: http://www2.timesdispatch.com/rtd/news/state_regional/article/judge_rules_against_dominion_
on_north_anna_permit/213446/
54. Kristi E. Swartz, “Perdue forms team to fi ght water ruling,” Th e Atlanta Journal-Constitution, July 23, 2009. See:
http://www.ajc.com/news/georgia-politics-elections/perdue-forms-team-to-99459.html
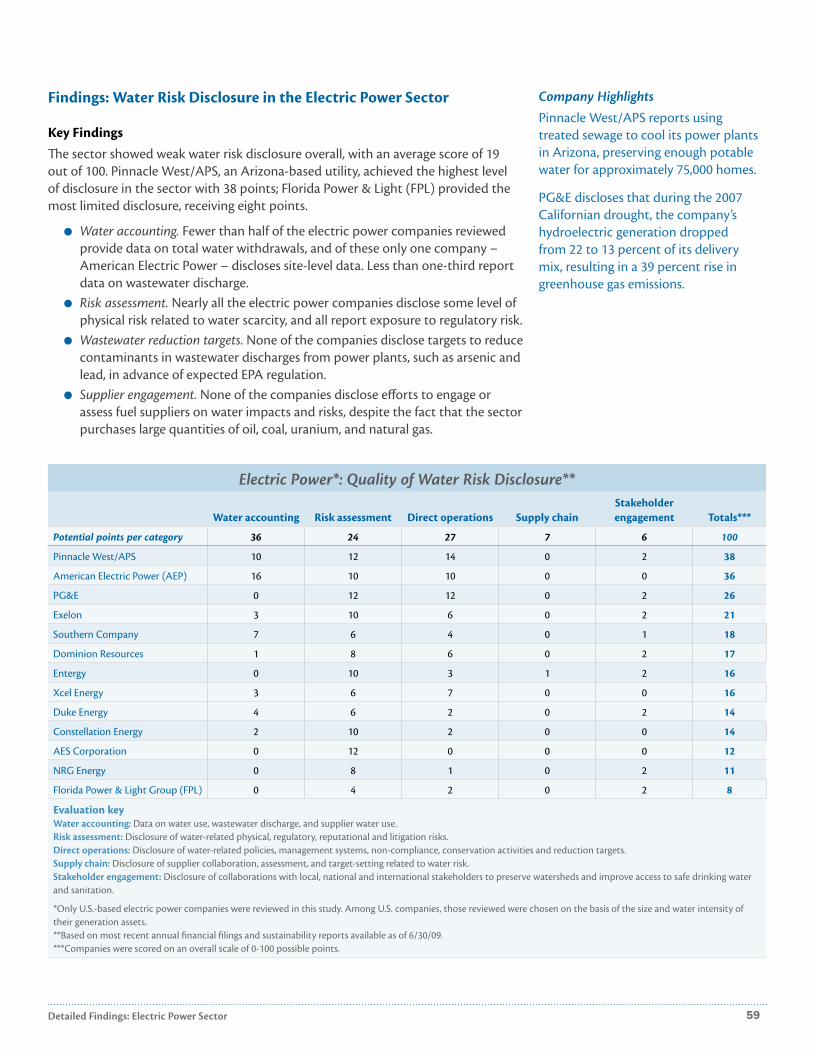
59Detailed Findings: Electric Power Sector
Findings: Water Risk Disclosure in the Electric Power Sector
Key FindingsTh e sector showed weak water risk disclosure overall, with an average score of 19
out of 100. Pinnacle West/APS, an Arizona-based utility, achieved the highest level
of disclosure in the sector with 38 points; Florida Power & Light (FPL) provided the
most limited disclosure, receiving eight points.
Water accounting. Fewer than half of the electric power companies reviewed
provide data on total water withdrawals, and of these only one company –
American Electric Power – discloses site-level data. Less than one-third report
data on wastewater discharge.
Risk assessment. Nearly all the electric power companies disclose some level of
physical risk related to water scarcity, and all report exposure to regulatory risk.
Wastewater reduction targets. None of the companies disclose targets to reduce
contaminants in wastewater discharges from power plants, such as arsenic and
lead, in advance of expected EPA regulation.
Supplier engagement. None of the companies disclose eff orts to engage or
assess fuel suppliers on water impacts and risks, despite the fact that the sector
purchases large quantities of oil, coal, uranium, and natural gas.
Electric Power*: Quality of Water Risk Disclosure**
Water accounting Risk assessment Direct operations Supply chainStakeholder engagement Totals***
Potential points per category 36 24 27 7 6 100
Pinnacle West/APS 10 12 14 0 2 38
American Electric Power (AEP) 16 10 10 0 0 36
PG&E 0 12 12 0 2 26
Exelon 3 10 6 0 2 21
Southern Company 7 6 4 0 1 18
Dominion Resources 1 8 6 0 2 17
Entergy 0 10 3 1 2 16
Xcel Energy 3 6 7 0 0 16
Duke Energy 4 6 2 0 2 14
Constellation Energy 2 10 2 0 0 14
AES Corporation 0 12 0 0 0 12
NRG Energy 0 8 1 0 2 11
Florida Power & Light Group (FPL) 0 4 2 0 2 8
Evaluation key Water accounting: Data on water use, wastewater discharge, and supplier water use.
Risk assessment: Disclosure of water-related physical, regulatory, reputational and litigation risks.
Direct operations: Disclosure of water-related policies, management systems, non-compliance, conservation activities and reduction targets.
Supply chain: Disclosure of supplier collaboration, assessment, and target-setting related to water risk.
Stakeholder engagement: Disclosure of collaborations with local, national and international stakeholders to preserve watersheds and improve access to safe drinking water
and sanitation.
*Only U.S.-based electric power companies were reviewed in this study. Among U.S. companies, those reviewed were chosen on the basis of the size and water intensity of
their generation assets.
**Based on most recent annual fi nancial fi lings and sustainability reports available as of 6/30/09.
***Companies were scored on an overall scale of 0-100 possible points.
Company Highlights
Pinnacle West/APS reports using
treated sewage to cool its power plants
in Arizona, preserving enough potable
water for approximately 75,000 homes.
PG&E discloses that during the 2007
Californian drought, the company’s
hydroelectric generation dropped
from 22 to 13 percent of its delivery
mix, resulting in a 39 percent rise in
greenhouse gas emissions.

60 Murky Waters: Corporate Reporting on Water Risk
Findings by Indicator
1. Disclosure of Water Accounting
Fewer than half (six out of 13) of the electric power companies reviewed provide
data on water withdrawals. Four companies report data on wastewater discharge,
and of these, Pinnacle West was the only company to report site-level discharge data.
AEP was the only electric power company to provide detailed site-level water
withdrawal data. Th e company’s sustainability website names the primary water
sources used by each of its power plants, and indicates which plants account for fi ve
percent or more of the fl ow of a given water body, or are drawing water from rivers or
lakes that are home to rare or endangered species.
2. Disclosure of Risk Assessment
With the exception of NRG Energy, all the electric power companies surveyed
disclose some level of physical risk related to water scarcity.
All the companies report their exposure to water-related regulatory risks and 68
percent provide information on litigation risks. No electric power company reports
water-related reputational risks.
Electric Power Sector: Water Accounting Disclosure
Total water withdrawal
Site/regional water withdrawal
Total wastewater discharge
Site/regional wastewater discharge
Supply chain water footprint
46
31
0
– 10 20 30 40 50 60 70 80 90 100
Percentage of Companies Reporting
8
8
Percentage of Electric Power Companies Reporting Water-Related Risks
Physical risks
Reputational risks
Regulatory risks
Litigation risks
69 23
– 10 20 30 40 50 60 70 80 90 100
(%)
31 69
0
15 38 15
General Specifi c Quantifi ed
PG&E: Th e Water-Energy Nexus in California
In its Corporate Responsibility Report,
PG&E cites drought conditions in
California as posing a threat to the
company’s hydroelectric generation,
as well as its overall climate change
mitigation eff orts:
“Water scarcity is one of the most
complex and pressing issues facing
the western United States and has
become even more acute recently.
California is expected to suff er its
third straight year of drought in 2009,
leading to restrictions on local water
use, rising water bills and economic
losses that could rise to $3 billion.
We are also seeing increased wildfi res
and diminished hydroelectric power
generation…”
“…On the electric supply side,
if PG&E’s future hydroelectric
generation is reduced due to drought
conditions or climate change, PG&E
might have to replace some of this
carbon-free generation with fossil-
fueled generation, typically natural
gas-fi red turbines. Th e ongoing
drought in California illustrates the
possible negative consequences of
climate change to our greenhouse
gas mitigation eff orts: During the
2007 drought, PG&E’s hydroelectric
generation dropped from 22 to 13
percent of our delivery mix, resulting
in a 39 percent increase in our verifi ed
greenhouse gas emissions rate.”
Source: PG&E, “2008 PG&E Corporate
Responsibility Report.” See: http://
www.pgecorp.com/corp_responsibility/
reports/2008/img/pge_crr_2008.pdf

61Detailed Findings: Electric Power Sector
3. Disclosure of Direct Operations
Th e electric power companies provide limited disclosure on water-related
management systems and policies. Only two electric power companies – Entergy
and Xcel – disclose details on water-related non-compliance incidents.
Seven of the 13 companies report actions taken to reduce water withdrawals, with
PG&E and Southern Company providing the most detailed disclosure. Regarding
eff orts or strategies for reducing or treating wastewater discharge, only two
companies – AEP and NRG Energy – provide detailed information.
None of the companies disclose quantifi ed targets to reduce contaminants in
wastewater discharged from power plants. PG&E and Pinnacle West/APS disclose
water use reduction targets for their offi ces, but not for their generation plants.
4. Disclosure of Supply Chain
Only one company – Entergy – provides information on collaboration with its
non-fuel suppliers on water management. Entergy discloses that “[w]e joined
with other investor-owned electric companies to form the Electric Utility Industry
Sustainable Supply Chain Alliance, which is working with the Edison Electric
Institute to improve the environmental performance of non-fuel suppliers. Th e
Alliance is expected to engage suppliers to improve impacts on air emissions, water
consumption, landfi ll reduction and energy effi ciency.”
None of the companies disclose eff orts to engage or assess fuel suppliers on water
impacts or risks, despite the fact that the sector purchases signifi cant quantities of
oil, coal, natural gas, and uranium.
5. Disclosure of Stakeholder Engagement
Eight out of the 13 electric power companies reviewed report engaging with stakeholders
on water management. Duke Energy, for example, highlights its collaboration with
17 public water system owners along the Catawba River basin in the Carolinas to
implement a fi ve-year strategic plan for addressing long-term supply and demand
issues in the region. FPL discusses its participation in the Florida Everglades
Mitigation Bank, a coalition that helps protect 13,500 acres of wetlands while
providing mitigation credits for developers and private landowners.
Pinnacle West/APS: Effi ciencies with Water Reuse
Pinnacle West/APS highlights the use of treated wastewater to cool its power plants in Arizona:
“[Th e company] is one of the largest users of treated effl uent for power generation in the United States… In 2008 over 61 percent of
our total power plant water came from treated effl uent. At the Palo Verde Nuclear Generating Station and our Redhawk natural gas-
powered facility, we use treated effl uent purchased from seven cities in the Phoenix metropolitan area for cooling. A 35-mile pipeline
carries treated wastewater from the City of Phoenix and Tolleson sewage treatment facilities to Palo Verde, where we use an advanced
wastewater treatment process capable of preparing 90 million gallons of water each day for use at both Palo Verde and Redhawk.”
Each year, Palo Verde’s water reclamation facility processes about 21 billion gallons of treated effl uent for power plant use,
preserving enough potable water for about 75,000 homes.”
Source: Pinnacle West/APS, “2008 Corporate Responsibility Report.” See: http://www.pinnaclewest.com/main/pnw/AboutUs/commitments/ehs/2008/ehs/
water/default.html
AEP: Carbon Capture & Storage and Impacts on Water
American Electric Power (AEP) notes
in its 2008 sustainability report that
the EPA has proposed new regulations
for the underground storage of carbon,
a technology designed to help large
carbon emitters sequester greenhouse
gas emissions thousands of feet below
ground. Th e EPA regulations would
add a new category of injection
wells to the Safe Drinking Water Act
regulations and create siting, testing,
and monitoring requirements to
prevent leaks to freshwater aquifers.
AEP states that “[c]arbon dioxide in
water is not necessarily a problem;
but too much can turn water slightly
acidic and allow other heavy metals
and toxic substances to leach into
the water supply more easily. Carbon
dioxide will be separated from drinking
water aquifers by many thousands of
feet. Typically, drinking water supplies
are only a few hundred feet deep in
the Midwest, whereas injection of CO2
would take place at depths of more
than 8,000 feet.”
Source: AEP, “2008 Corporate Sustainability
Report.” See: http://www.aep.com/citizenship/
crreport/
62 Murky Waters: Corporate Reporting on Water Risk
FOOD SECTOR Water plays a fundamental role in the food industry. Agriculture accounts for
roughly 70 percent of water use globally, with this share rising as high as 90 percent
in some developing countries.55 Agricultural water use has doubled over the past
century.56 A number of factors have driven this increased use of water. Global food
consumption has increased dramatically since the 1960s, driven by population
growth and propelled by the Green Revolution and wider use of irrigated agriculture.
As economies develop, people tend to consume more meat, which can require up to
10 times more water than cereal to produce the same calorie content.
Agriculture also has signifi cant impacts on downstream water quality. Surface
and groundwater quality can be severely aff ected by run-off linked to the use
of agricultural inputs such as pesticides, herbicides, and nitrogen fertilizers.
Eutrophication – the over-enrichment of water by fertilizers such as nitrogen
and phosphorus – has created over 415 aquatic “dead zones” around the world,
characterized by oxygen depletion and harmful algal blooms.57 In the United States,
the discharge of nutrients from midwestern farms into the Mississippi River has been
linked to an aquatic dead zone in the Gulf of Mexico the size of New Jersey. Drinking
water impacts are also signifi cant: an August 2009 study by the Natural Resources
Defense Council found that 33 million Americans drink tap water containing
pesticides, with contamination most severe in the agricultural states of Illinois, Iowa,
Indiana, Missouri, and Nebraska.5859
Overview: Water-Related Risks for the Food SectorTh e most signifi cant and relevant water-related risks to the food sector are physical,
regulatory, and litigation risks.
Physical RisksCommodity shortages due to drought or changing weather patterns can lead to
signifi cant price volatility on the global market, as seen by recent spikes in global
rice prices due to drought-induced production collapses in Australia. More recently,
severe drought in India has driven up prices for sugar, contributing to a 28-year high
in the global price for the commodity.60 In California, increasing water prices have
55. UNEP, “Vital Water Graphics, Freshwater by Sector in 2000,” 2000. See: http://www.unep.org/dewa/assessments/
ecosystems/water/vitalwater/15.htm#16
56. Hamed Bakir, “Water Demand Management and Pollution Control: Key to securing and safeguarding the water
supplies of MENA in the 21st Century,” WHO Regional Centre for Environmental Health Activities, Amman,
Jordan, 2001. pp. 2.
57. Mindy Selman et al., “Eutrophication and Hypoxia in Coastal Areas: A Global Assessment of the State of
Knowledge,” World Resources Institute, March 1, 2008. See: http://www.wri.org/publication/eutrophication-
and-hypoxia-in-coastal-areas
58. “U.S. Drinking Water and Watersheds Widely Contaminated by Hormone Disrupting Pesticide, Atrazine,” Natural
Resources Defense Council, press release, August 24, 2009.
59. “A water warning: Peter Brabeck-Letmathe, chairman of Nestlé, argues that water shortage is an even more
urgent problem than climate change,” Th e Economist, November 19, 2008. See: http://www.economist.com/
theworldin/PrinterFriendly.cfm?story_id=12494630
60. Dana Krechowicz, “Environmental Challenges for the Food and Beverage Industry,” World Resources Institute,
August 27, 2009. See: http://www.wri.org/stories/2009/08/environmental-challenges-food-and-beverage-
industry
“I am convinced that, under present
conditions and with the way water
is being managed, we will run out
of water long before we run out of
fuel…Th e decisions of the coming
years will determine whether a
major global crisis of water and
food shortage can be avoided.”
—Peter Brabeck-LetmatheChairman, Nestlé59

63Detailed Findings: Food Sector
led farmers to cut to down to the stump hundreds of healthy, mature avocado trees
that were economical when water was abundant.61 Th e overall lack of water has also
forced the state’s farmers to abandon or leave unplanted more than 100,000 acres of
agricultural land, resulting in more than $300 million in agricultural revenue losses to
date. Th at number is expected to exceed $2 billion by the 2010 season.62
First-generation biofuels production can have an especially large water footprint.63
Th e entire production cycle of corn-based ethanol – from growing irrigated crops
to pumping biofuel into a car – can consume 20 times as much water for every
mile traveled compared to gasoline.64 First-generation biofuel plantations can also
compromise water quality through the leaching of pesticides and nutrients.65
In recent years, some proposed corn-based ethanol plants in the American midwest
have been scuttled due to concerns by communities and regulators about the
plants’ impacts on groundwater. In 2007, backers of a proposed plant in Jamestown,
North Dakota, withdrew their application when it became clear that the plant’s
million-gallons-a-day appetite would drain too much from a local aquifer.66 In
Erskine, Minnesota, a grassroots opposition led by local residents concerned about a
proposed plant’s impact on groundwater eventually led to the project’s demise. 67
Regulatory Risks Th e European Union’s Water Framework Directive places growing pressure on
the agricultural sector to better manage water resources. Enacted in 2000, the
Framework calls for a fundamental change in the management of water in Europe
with a requirement that member states ensure “good ecological status” for all water
bodies by 2015. Agriculture is expected to bear a major share of the directive’s
implementation costs, as farmers are compelled to reduce their release of nutrients
and other emissions into water bodies.68
Th ere is growing scrutiny by U.S. regulators of the agricultural sector’s water
impacts. For example, the EPA announced in October 2009 that it would revaluate
the environmental safety of the widely used pesticide Atrazine.69 Also in 2009, the
61. Julie Small, “Water shortage forces avocado growers to cut down trees,” Southern California Public Radio 89.3
KPCC, April 14, 2009. See: http://www.scpr.org/news/2009/04/14/water-shortage-forces-avocado-growers-cut-
down-tre/
62. “State of Emergency Proclamation on Water Shortage,” Offi ce of the Governor, press release, February, 2009. See:
http://gov.ca.gov/proclamation/11557/
63. ‘First-generation biofuels’ are biofuels made from sugar, starch, vegetable oil, or animal fats using conventional
technology, as opposed to ‘second-generation’ biofuels, such as cellulosic biofuels, which are derived from
nonfood crops.
64. Michael E. Webber, “Energy Versus Water: Solving Both Crises Together,” Scientifi c American, October 2008. See:
http://www.sciam.com/article.cfm?id=the-future-of-fuel
65. Robert B. Jackson et al., “Trading Water for Carbon with Biological Carbon Sequestration,” Science 310, no. 5756
(23 December 2005): 1944-1947. See: http://www.sciencemag.org/cgi/content/full/310/5756/1944
66. “Ethanol’s Water Shortage,” Th e Wall Street Journal, October 17, 2007. See: http://online.wsj.com/article/
SB119258870811261613.html?mod=googlenews_wsj
67. Mike Christopherson, “Agassiz Energy LLC looking to dissolve,” Crookston Times, December 16, 2009. See: http://
www.crookstontimes.com/news/x967378060/Agassiz-Energy-LLC-looking-to-dissolve
68. Kallis, Giorgos and David Butler, “Th e EU water framework directive: measures and implications,” Water Policy,
(2001) 125-142.
69. “EPA Begins New Scientifi c Evaluation of Atrazine.” U.S. Environmental Protection Agency, press release, October
7, 2009.

64 Murky Waters: Corporate Reporting on Water Risk
Obama administration announced that it would set strict new limits to reduce
agricultural nutrients fl owing into waterways in Florida.70
For food processors, increased regulation of agricultural inputs and run-
off could aff ect costs of procurement. For companies that run animal feeding
operations, stronger national regulation could limit expansion in certain regions and
require investments in new treatment technologies, both of which carry fi nancial
implications.
Litigation RisksMeat producers are particularly vulnerable to lawsuits tied to the environmental
impacts of their animal operations. In 2006, a lawsuit by the environmental
advocacy group Waterkeeper Alliance, alleging violations of the Clean Water Act
against Smithfi eld Foods, resulted in a settlement in which the company agreed
to implement millions of dollars in environmental safeguards at 275 hog farms in
North Carolina.71 Th e following year, the state passed a law permanently banning
the construction of new hog waste “lagoons” – large ponds used to store manure.
In another example, the Oklahoma attorney general sued Tyson Foods and 13
other poultry companies in 2005 to pay for cleanup of poultry waste that had
contaminated the Illinois River watershed.72 As of December 2009, the case was still
being litigated.
70. “Our Views: Clean Water Victory,” Florida Today, November 22, 2009. See: http://m.fl oridatoday.com/news.
jsp?key=273022
71. Lauren Etter, “Chicken Litter: Th e Aerial Hunt for Poultry Manure,” Th e Wall Street Journal, November 3, 2009.
See: http://online.wsj.com/article/SB125721391914624061.html
72.. Robert Glennon, Unquenchable: America’s Water Crisis and What to Do About It (Washington, D.C.: Island Press,
2009), 73.

65Detailed Findings: Food Sector
Findings: Water Risk Disclosure in the Food Sector
Key FindingsTh e sector showed limited water risk disclosure overall, with an average score of 18
out of 100. Unilever, based dually in the Netherlands and the UK, ranked highest in
the sector with a score of 34; agribusiness fi rms Archer Daniels Midland (ADM) and
Bunge provided the weakest disclosure, each receiving a score of nine.
Water use data. Eighty-fi ve percent of the food companies reviewed report data
on total water use, but none provide detailed site or regional level data. Less
than one-third report wastewater discharge data.
Reduction targets. Fewer than half report setting water use reduction targets.
Only one company – Unilever – discloses a quantifi ed target for reducing
wastewater discharges.
Risk disclosure. Nearly all the food companies surveyed disclose some level of
physical risk related to water scarcity, particularly with respect to their supply
chains.
Supply chain. Despite the sector’s physical risk exposure, less than one-third of
food companies report addressing water risk in their agricultural supply chains.
Stakeholder engagement. Nearly half the companies disclose eff orts to engage
stakeholders on watershed preservation and drinking water and sanitation issues.
Food: Quality of Water Risk Disclosure*
Water accounting Risk assessment Direct operations Supply chainStakeholder engagement Totals**
Potential points per category 36 24 27 7 6 100
Unilever 12 2 12 3 5 34
Nestlé 9 4 13 1 2 29
Smithfi eld Foods 9 10 3 0 3 25
Danone 7 2 8 0 3 20
General Mills 4 4 7 3 1 19
Tyson Foods 4 6 7 0 0 17
Kellogg 4 4 7 0 0 15
Kraft Foods 3 4 8 0 0 15
ConAgra 2 4 5 1 0 12
Dean Foods 0 8 4 0 0 12
Sara Lee 3 4 5 0 0 12
Archer Daniels Midland (ADM) 0 4 3 0 2 9
Bunge 3 4 2 0 0 9
Evaluation key Water accounting: Data on water use, wastewater discharge, and supplier water use.
Risk assessment: Disclosure of water-related physical, regulatory, reputational and litigation risks.
Direct operations: Disclosure of water-related policies, management systems, non-compliance, conservation activities and reduction targets.
Supply chain: Disclosure of supplier collaboration, assessment, and target-setting related to water risk.
Stakeholder engagement: Disclosure of engagement with local, national and international stakeholders to preserve watersheds and improve access to safe drinking water
and sanitation.
*Based on most recent annual fi nancial fi lings and sustainability reports available as of 6/30/09.
**Companies were scored on an overall scale of 0–100 possible points.
Company Highlights
Danone reports the water footprint
for its Milk and Water divisions at each
stage of the product lifecycle, including
raw material production, processing,
packaging, and logistics.
Nestlé quantifi es the relative levels of
physical water risk facing the company’s
481 factories, 49 of which are located
in the most highly water-stressed
countries in the world.
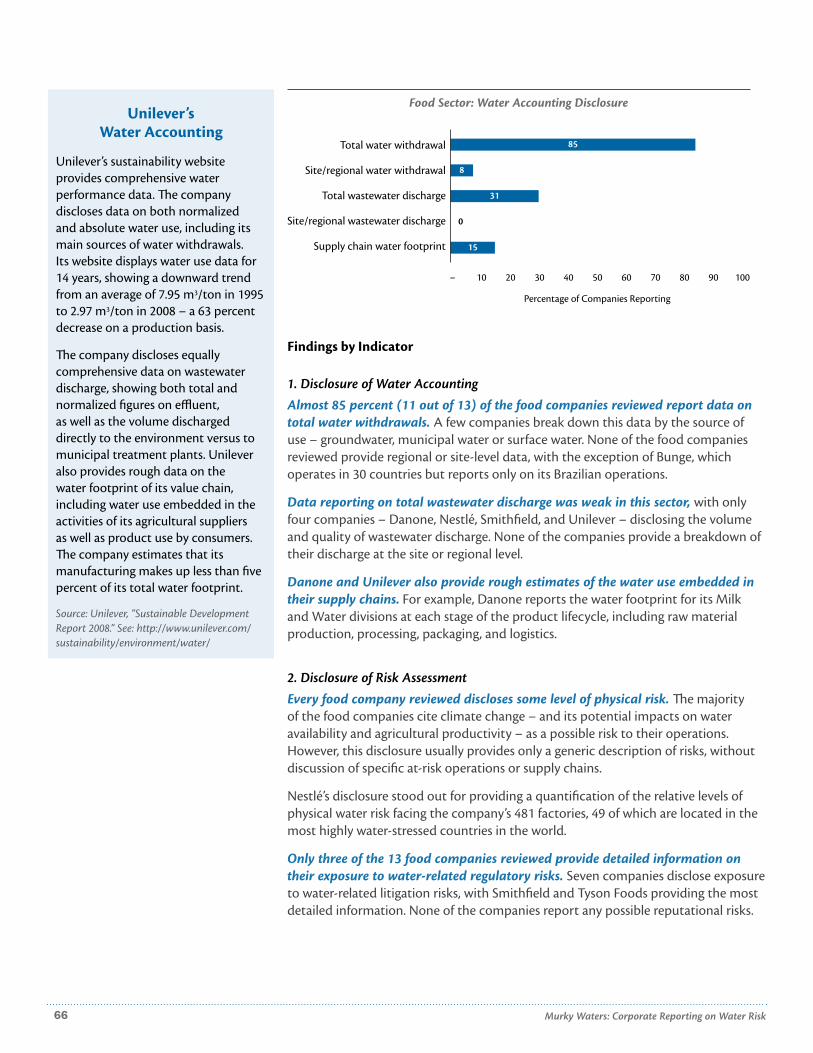
66 Murky Waters: Corporate Reporting on Water Risk
Findings by Indicator
1. Disclosure of Water Accounting
Almost 85 percent (11 out of 13) of the food companies reviewed report data on
total water withdrawals. A few companies break down this data by the source of
use – groundwater, municipal water or surface water. None of the food companies
reviewed provide regional or site-level data, with the exception of Bunge, which
operates in 30 countries but reports only on its Brazilian operations.
Data reporting on total wastewater discharge was weak in this sector, with only
four companies – Danone, Nestlé, Smithfi eld, and Unilever – disclosing the volume
and quality of wastewater discharge. None of the companies provide a breakdown of
their discharge at the site or regional level.
Danone and Unilever also provide rough estimates of the water use embedded in
their supply chains. For example, Danone reports the water footprint for its Milk
and Water divisions at each stage of the product lifecycle, including raw material
production, processing, packaging, and logistics.
2. Disclosure of Risk Assessment
Every food company reviewed discloses some level of physical risk. Th e majority
of the food companies cite climate change – and its potential impacts on water
availability and agricultural productivity – as a possible risk to their operations.
However, this disclosure usually provides only a generic description of risks, without
discussion of specifi c at-risk operations or supply chains.
Nestlé’s disclosure stood out for providing a quantifi cation of the relative levels of
physical water risk facing the company’s 481 factories, 49 of which are located in the
most highly water-stressed countries in the world.
Only three of the 13 food companies reviewed provide detailed information on
their exposure to water-related regulatory risks. Seven companies disclose exposure
to water-related litigation risks, with Smithfield and Tyson Foods providing the most
detailed information. None of the companies report any possible reputational risks.
Food Sector: Water Accounting Disclosure
Total water withdrawal
Site/regional water withdrawal
Total wastewater discharge
Site/regional wastewater discharge
Supply chain water footprint
8
15
85
31
0
– 10 20 30 40 50 60 70 80 90 100
Percentage of Companies Reporting
Unilever’s Water Accounting
Unilever’s sustainability website
provides comprehensive water
performance data. Th e company
discloses data on both normalized
and absolute water use, including its
main sources of water withdrawals.
Its website displays water use data for
14 years, showing a downward trend
from an average of 7.95 m3/ton in 1995
to 2.97 m3/ton in 2008 – a 63 percent
decrease on a production basis.
Th e company discloses equally
comprehensive data on wastewater
discharge, showing both total and
normalized fi gures on effl uent,
as well as the volume discharged
directly to the environment versus to
municipal treatment plants. Unilever
also provides rough data on the
water footprint of its value chain,
including water use embedded in the
activities of its agricultural suppliers
as well as product use by consumers.
Th e company estimates that its
manufacturing makes up less than fi ve
percent of its total water footprint.
Source: Unilever, ”Sustainable Development
Report 2008.” See: http://www.unilever.com/
sustainability/environment/water/
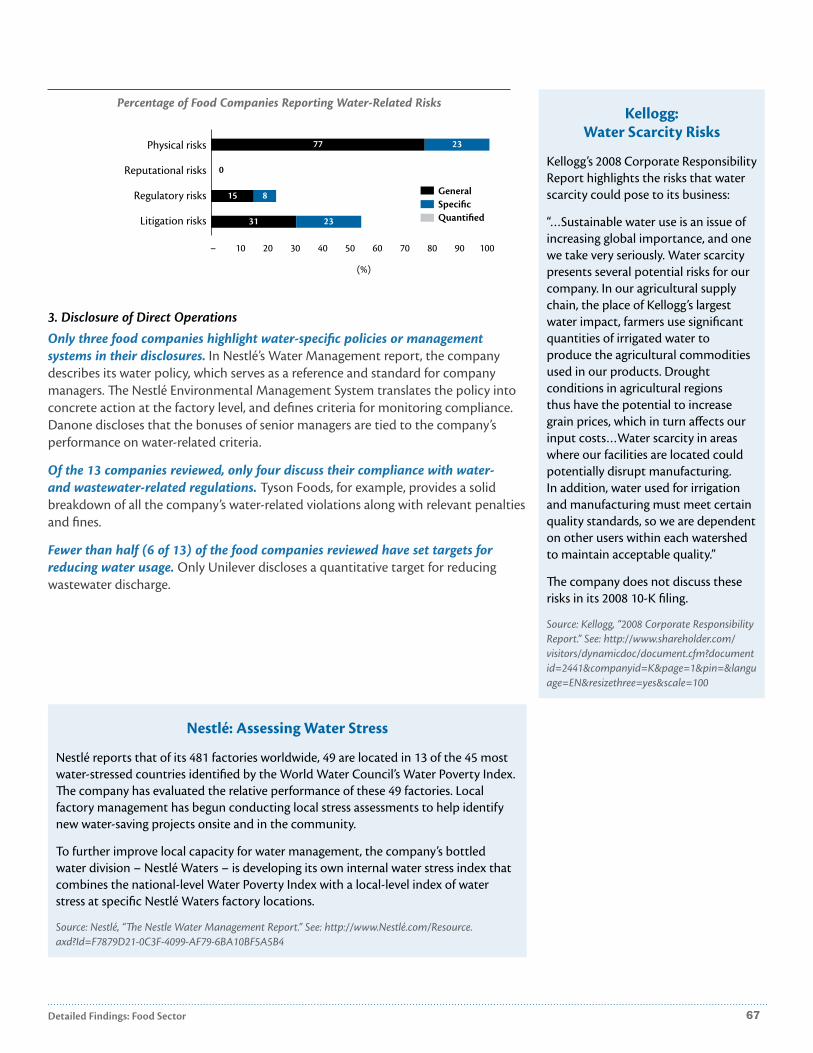
67Detailed Findings: Food Sector
3. Disclosure of Direct Operations
Only three food companies highlight water-specifi c policies or management
systems in their disclosures. In Nestlé’s Water Management report, the company
describes its water policy, which serves as a reference and standard for company
managers. Th e Nestlé Environmental Management System translates the policy into
concrete action at the factory level, and defines criteria for monitoring compliance.
Danone discloses that the bonuses of senior managers are tied to the company’s
performance on water-related criteria.
Of the 13 companies reviewed, only four discuss their compliance with water-
and wastewater-related regulations. Tyson Foods, for example, provides a solid
breakdown of all the company’s water-related violations along with relevant penalties
and fi nes.
Fewer than half (6 of 13) of the food companies reviewed have set targets for
reducing water usage. Only Unilever discloses a quantitative target for reducing
wastewater discharge.
Percentage of Food Companies Reporting Water-Related Risks
Physical risks
Reputational risks
Regulatory risks
Litigation risks
77 23
GeneralSpecifi cQuantifi ed
– 10 20 30 40 50 60 70 80 90 100
(%)
15 8
31 23
0
Nestlé: Assessing Water Stress
Nestlé reports that of its 481 factories worldwide, 49 are located in 13 of the 45 most
water-stressed countries identifi ed by the World Water Council’s Water Poverty Index.
Th e company has evaluated the relative performance of these 49 factories. Local
factory management has begun conducting local stress assessments to help identify
new water-saving projects onsite and in the community.
To further improve local capacity for water management, the company’s bottled
water division – Nestlé Waters – is developing its own internal water stress index that
combines the national-level Water Poverty Index with a local-level index of water
stress at specifi c Nestlé Waters factory locations.
Source: Nestlé, “Th e Nestle Water Management Report.” See: http://www.Nestlé.com/Resource.
axd?Id=F7879D21-0C3F-4099-AF79-6BA10BF5A5B4
Kellogg: Water Scarcity Risks
Kellogg’s 2008 Corporate Responsibility
Report highlights the risks that water
scarcity could pose to its business:
“…Sustainable water use is an issue of
increasing global importance, and one
we take very seriously. Water scarcity
presents several potential risks for our
company. In our agricultural supply
chain, the place of Kellogg’s largest
water impact, farmers use signifi cant
quantities of irrigated water to
produce the agricultural commodities
used in our products. Drought
conditions in agricultural regions
thus have the potential to increase
grain prices, which in turn aff ects our
input costs…Water scarcity in areas
where our facilities are located could
potentially disrupt manufacturing.
In addition, water used for irrigation
and manufacturing must meet certain
quality standards, so we are dependent
on other users within each watershed
to maintain acceptable quality.”
Th e company does not discuss these
risks in its 2008 10-K fi ling.
Source: Kellogg, “2008 Corporate Responsibility
Report.” See: http://www.shareholder.com/
visitors/dynamicdoc/document.cfm?document
id=2441&companyid=K&page=1&pin=&langu
age=EN&resizethree=yes&scale=100

68 Murky Waters: Corporate Reporting on Water Risk
4. Disclosure of Supply Chain
Four food companies disclose eff orts to address water risk in their supply chains,
with Unilever and General Mills providing the most detail. Unilever reports
comprehensively on its evaluation of suppliers on water management as well as
collaborations with suppliers to improve water effi ciency and reduce water usage.
General Mills’ Green Giant division works with growers to reduce water consumption
and minimize use of agrochemicals for key crops. For instance, General Mills reports
a 50 percent water use reduction goal for its broccoli suppliers, and discusses eff orts
to help convert their operations from furrow to drip irrigation, which has reduced
water use by nearly 1.2 billion gallons a year.
5. Disclosure of Stakeholder Engagement
Approximately 46 percent (six out of 13) of the companies report having worked
with governments, NGOs, and local communities on drinking water, sanitation,
or watershed protection activities in regions where they operate. Companies
providing detailed disclosure in this area include Danone, General Mills, Smithfi eld,
and Unilever.
Unilever: Stakeholder Engagement
Unilever discloses a systematic approach to working with suppliers and other
stakeholders on water management to improve effi ciency and reduce water-related
risks.
Suppliers: Unilever’s Sustainable Agriculture Program works with agricultural suppliers
to implement water reduction eff orts such as drip irrigation. In Brazil, the company
worked with tomato suppliers to reduce water use by up to 30 percent.
Local communities: Unilever cites numerous eff orts to improve watersheds and
drinking water quality in regions where it has factories. For example, the company’s
Surabaya, Indonesia factory requires clean water for operations, but is situated near a
river that suff ers from industrial and household pollution. Unilever reports providing
management expertise and equipment to assist local communities in reducing
pollution and developing new industries, such as fi sh farming.
International collaboration: In 2007, Unilever joined the CEO Water Mandate, which
brings together companies, NGOs, governments, and the United Nations to improve
corporate policies and practices related to water. Th e company also played a role in
establishing the Water Footprint Network, a multi-stakeholder group developing a
standard way to measure the impact of water use.
Source: Unilever, ”Sustainable Development Report 2008.” See: http://www.unilever.com/sustainability/
Danone: Incentivizing Water Performance
Danone highlights an incentive
system that integrates environmental
and social criteria – including
water objectives – into executive
compensation:
”In 2008, with a view to instituting
radical changes in behaviour and
harmonising the social, societal and
environmental ambitions of Groupe
Danone with the day-to-day operation
of the enterprise, the Group decided
to change the system of bonuses
distributed to managing directors
and top management (1,000 people
concerned). Th e system is now
comprised of three tiers: …a social,
societal and environmental tier which
includes criteria related to employee
training, workplace safety, reduction in
water consumption, measurement of
the carbon footprint and, from 2009
onwards, the reduction of the carbon
footprint…”
Source: Danone, “2008 Sustainability Report.”
See: http://phx.corporate-ir.net/External.File?ite
m=UGFyZW50SUQ9OTI2OXxDaGlsZElEPS0xfF
R5cGU9Mw==&t=1

69Detailed Findings: Homebuilding Sector
HOMEBUILDING SECTORHomes consume 11 percent of all the freshwater in the United States.73 Many of the
largest homebuilders in the United States are developing homes in regions facing
both rapid population growth and dwindling water resources. A combination of
fast growth, limited water supply, and growing environmental regulation means that
homebuilders face both increased water-related risks and opportunities as they site,
design, construct, and market new homes.
Construction activities like clearing, grading, and excavating, disturb soil and
sediment, which can be washed off construction sites during storms and can pollute
nearby waterways and aquifers. Th e EPA has identifi ed stormwater runoff from
construction sites as one of the most signifi cant threats to water quality nationwide.74
Homebuilders can also play a role in infl uencing residential water use by installing
more water-effi cient appliances, employing xeriscaping (water-sensitive landscaping)
and through appropriate siting of new developments. In December 2009, the EPA
released its WaterSense certifi cation, creating the fi rst voluntary, national water-
effi ciency specifi cation for single-family new homes. WaterSense-labeled new
homes will be 20 percent more effi cient than typical new homes, and will require
independent inspection and certifi cation.75
Overview: Water-Related Risks for the Homebuilding SectorA review of the sector reveals homebuilders to be vulnerable to all four water-related
risks: physical, reputational, regulatory, and litigation.
Physical RisksClimate change will aff ect precipitation patterns and water availability in several
high-growth regions of the United States, potentially limiting development
opportunities for homebuilders. A 2005 Brookings Institution report showed that 10
of the 15 fastest-growing metropolitan areas are in the relatively arid western states of
Nevada, California, Texas, Colorado, Arizona, and Utah.76 A broad consensus among
climate scientists holds that these states are on a trajectory within years or decades
to become even drier, to a level equivalent to the 1930s era Dust Bowl.77
73. “Water Use in the United States,” National Atlas, September 10, 2007. See: http://nationalatlas.gov/articles/
water/a_wateruse.html
74. Lisa Jackson, “Testimony of Lisa P. Jackson, Administrator, U.S. Environmental Protection Agency Before the
Committee on Transportation and Infrastructure,” United States House of Representatives, U.S. Agency for
Environmental Protection, October 15, 2009.
75. “EPA Releases Final Specifi cation for WaterSense New Homes: Th is will help homeowners increase water
effi ciency and save on their utility bills,” U.S. Environmental Protection Agency, press release, December 10, 2009.
76. William H. Frey, “Metro America in the New Century: Metropolitan and Central City Shifts Since 2000,”
Washington, DC: Brookings Institution, 2005.
77. Richard Seager, et. al., “Model Projections of an Imminent Transition to a More Arid Climate in Southwestern
North America,” Sciencexpress, April 5, 2007.
70 Murky Waters: Corporate Reporting on Water Risk
Regulatory RisksExisting or anticipated water shortages may lead regulators to restrict or prohibit
housing development in certain regions. Municipalities may restrict or place
moratoriums on the availability of utilities, such as water and sewer taps. In some
areas, municipalities may enact growth control initiatives, which will restrict the
number of building permits available in a given year. In California, state laws require
water agencies to withhold approvals until it has been determined that suffi cient
water resources exist for at least 20 years to serve large new developments.78 In
2008, the water district in the Los Angeles suburb of Riverside became California’s
fi rst major agency to cite this law in a decision that put on hold seven proposed
commercial and residential developments.79
City governments in drought-stricken areas of the country – including Los Angeles,
Austin, and San Antonio – are also taking measures to encourage homebuilders to
adopt water-effi cient practices.80, 81 Landscaping practices – which represent as much
as 70 percent of total household water use in some regions – are a particular focus. In
Las Vegas, for example, building codes now prohibit new homes from having a lawn
in the front yard.82
Homebuilders are increasingly subject to wastewater discharge regulation. In
November 2009, the EPA released new guidelines that limit effl uent discharge for
the construction and development industry.83 Th e fi nal rule requires construction
site owners and operators that disturb one or more acres to implement erosion
and sediment control and pollution prevention measures in order to control
pollutants in discharges from construction sites. When 10 or more acres of land
are aff ected by construction activities at one time, site owners and operators will
be required to monitor and sample discharges, and to comply with a numeric
standard. Compliance with the new rule is estimated to cost the industry $1
billion.84
78. CA DWR, “Senate Bill (SB) 610/ Senate Bill (SB) 221 Guidebook FAQs,” California Department of Water
Resources, Division of Statewide Integrated Water Management: Water Use and Effi ciency, 2009.
79. Robert Glennon, Unquenchable: America’s Water Crisis and What to Do About It. (Washington D.C.: Island Press,
2009), 1-20.
80. Sara Schaefer Munoz, “Homeowners, Builders Tackle Water Scarcity,” Th e Wall Street Journal, February 23, 2007.
See: http://online.wsj.com/article/SB117210858915115606.html
81. Robert Glennon, Unquenchable: America’s Water Crisis and What to Do About It. (Washington D.C.: Island Press,
2009), p. 171.
82. Gwendolyn Bounds, “Turf Battle Heats Up Over Limits on Water-Guzzling Landscapes,” Th e Wall Street Journal,
September 18, 2009. See: http://online.wsj.com/article/SB10001424052970203278404574416990861394378.html
83. “EPA Issues Rule to Reduce Water Pollution from Construction Sites,” U.S. Environmental Protection Agency,
press release, November 23, 2009.
84. Susan Charles and Shantell Feaser, “United States: Construction and Development Industry Receives New and
Costly Pollutant Control, Monitoring and Reporting Requirements,” Mondaq, December 22, 2009. See: http://
www.mondaq.com/unitedstates/article.asp?articleid=91556
71Detailed Findings: Homebuilding Sector
Reputational RisksHomebuilders may be subject to campaigns by environmental groups if they
perceive proposed developments as damaging to freshwater resources. In Florida,
for example, environmental groups have targeted Lennar Corporation, seeking to
halt its development of a proposed 7,000-unit planned community in a region of the
Florida wetlands previously off limits to development.85 Despite the incorporation of
green building standards into the development’s design, local activists continue to
oppose its siting.86
Litigation RisksHomebuilders face the risk of having permits overturned in court because of water
availability considerations. In 2007, the California Supreme Court overturned a
permit for an 18,000-unit home development under construction at the southern
edge of Sacramento due to uncertainties about the project’s long-term water
supply.87 Th is case set new state standards for analyzing the water supply of proposed
real estate developments, including the requirement that environmental impact
assessments consider the impacts of providing water throughout the entire existence
of the project, not just in the fi rst phase of development.88
85. “Call to Action,” Clean Water Action, press release, May 6, 2009.
86. Paul Brinkmann, “Lennar concept isn’t so green, detractors say,” South Florida Business Journal, November 21,
2008. See: http://southfl orida.bizjournals.com/southfl orida/stories/2008/11/24/story3.html
87. Robert Glennon, Unquenchable: America’s Water Crisis and What to Do About It. (Washington D.C.: Island Press,
2009).
88. Ibid.

72 Murky Waters: Corporate Reporting on Water Risk
Findings: Water Risk Disclosure in the Homebuilding Sector
Key FindingsTh e homebuilders studied in this report provided the most limited disclosure on
water risk of all the sectors reviewed, with an average score of nine out of 112.
Los Angeles-based KB Home scored the highest of the group, with 15 points; D.R.
Horton, Hovnanian, NVR and Ryland came in at the bottom, each scoring four points.
Risk assessment. Eighty percent of the homebuilders reviewed cite drought or
fl oods as physical risks to their business and cite regulatory risks linked to storm
and surface water management. Seventy percent report water-related litigation
risks; none report reputational risks.
Water-related opportunities. Th ere was some disclosure from homebuilders
on investment in and sales of more water-effi cient homes. Five companies –
Beazer, Centex, KB Home, Pulte, and Toll Brothers – provide some level of detail
on this topic.
Disclosure gaps. None of the companies report any data on water use or
wastewater discharge, nor do they discuss engaging suppliers or stakeholders
on water issues.
Homebuilding: Quality of Water Risk Disclosure**
Water accounting
Risk assessment
Direct operations
Supply chain
Stakeholder engagement Opportunities Totals**
Potential points per category 36 24 27 7 6 12 112
KB Home 0 8 6 0 0 1 15
Pulte 0 10 2 0 0 1 13
Toll Brothers 0 12 0 0 0 1 13
Beazer Homes 0 10 0 0 0 1 11
Lennar 0 10 0 0 0 0 10
Centex 0 2 3 0 0 1 6
D.R. Horton 0 4 0 0 0 0 4
Hovnanian 0 4 0 0 0 0 4
NVR 0 4 0 0 0 0 4
Ryland 0 4 0 0 0 0 4
Evaluation key Water accounting: Data on water use, wastewater discharge, and supplier water use.
Risk assessment: Disclosure of water-related physical, regulatory, reputational and litigation risks.
Direct operations: Disclosure of water-related policies, management systems, non-compliance, conservation activities and reduction targets.
Supply chain: Disclosure of supplier collaboration, assessment, and target-setting related to water risk.
Stakeholder engagement: Disclosure of engagement with local, national and international stakeholders to preserve watersheds and improve access to safe drinking water and
sanitation.
Opportunities: Disclosure of investment in and sales of water-effi cient products.
*Based on most recent annual fi nancial fi lings and sustainability reports available as of 6/30/09.
**Companies were scored on an overall scale of 0-112 possible points.
Company Highlights
KB Home describes how it is integrating
water-effi cient features into its building
lines, including WaterSense-labeled
toilets and bathroom sink faucets. Th e
company is also partnering with the
Southern Nevada Water Authority and
the Southern Nevada Home Builders
Association to create the fi rst Water
Smart home, which saves up to 75,000
gallons of water per year compared to
homes built in the 1990s.

73Detailed Findings: Homebuilding Sector
Findings by Indicator
1. Disclosure of Water Accounting
None of the homebuilders surveyed report data on their water use or wastewater
discharge in their direct operations.
2. Disclosure of Risk Assessment
Eighty percent of the reviewed homebuilders disclose exposure to water-related
physical risks. Seven companies provide general discussion of the fact that droughts
and fl oods – as well as increasing impacts of climate change – could aff ect the
availability of water. For example, KB Home notes in its sustainability report that
“[r]estrictions on water use are already quite common in many areas…In addition,
climate changes aff ect precipitation patterns and water availability, which may
impact new development opportunities.”
Eighty percent of reviewed companies also disclose water-related regulatory risks.
Common risks cited by these companies include federal and state level laws relating
to storm and surface water management, water usage, and disposal.
Seventy percent of the companies disclose their litigation risks, with several
detailing consent decrees with the EPA involving potential civil penalties related to
effl uent discharge and stormwater management practices.
None of the homebuilders disclose any reputational risks.
3. Disclosure of Direct Operations
Only three homebuilders disclose actions implemented to reduce water usage. For
example, both KB Home and Pulte report measures taken in water-stressed regions
such as Arizona, Nevada, and California to install rain sensors that monitor and limit
irrigation of landscaping on unsold properties and at offi ce buildings.
4. Disclosure of Supply Chain
None of the homebuilders disclose any information on eff orts to engage or
collaborate with suppliers on water impacts or risks in their supply chain.
Percentage of Homebuilders Reporting Water-Related Risks
Physical risks
Reputational risks
Regulatory risks
Litigation risks
60 20
– 10 20 30 40 50 60 70 80 90
(%)
100
50 30
0
30 20 20
General Specifi c Quantifi ed
Regulatory Risks: KB Home and Toll Brothers
In their 2008 10-Ks, KB Home and Toll
Brothers provide brief descriptions of
key water-related regulatory risks:
KB Home: “We are also subject
to a variety of local, state and
federal statutes, ordinances, rules
and regulations concerning the
environment, and recently entered
into a consent decree with the EPA
and certain states concerning our
storm water pollution prevention
practices. Th ese laws and regulations
and the consent decree may cause
delays in construction and delivery
of new homes, may cause us to incur
substantial compliance and other
costs, and can prohibit or severely
restrict homebuilding activity in
certain environmentally sensitive
regions or areas.”
Toll Brothers: “Municipalities may
restrict or place moratoriums on
the availability of utilities, such
as water and sewer taps. In some
areas, municipalities may enact
growth control initiatives, which
will restrict the number of building
permits available in a given year. If
municipalities in which we operate
take actions like these, it could have
an adverse eff ect on our business by
causing delays, increasing our costs or
limiting our ability to operate in those
municipalities.”

74 Murky Waters: Corporate Reporting on Water Risk
5. Disclosure Stakeholder Engagement
None of the companies disclose any specifi c strategies or activities for collaborating
with local or regional stakeholders on water management.
6. Disclosure of Water-Related Opportunities
Only fi ve of the 10 companies – Beazer, Centex, KB Home, Pulte, and Toll Brothers
– report information on investment in and sales of more water-effi cient homes.
Key water-saving features discussed include WaterSense appliances, xeriscaping, and
moisture sensor irrigation systems. KB Home provides the most detailed disclosure
on this topic.
KB Home: Water-Effi cient Homes
KB Home describes how it is integrating water-effi cient features into its building lines:
“In 2008, we introduced WaterSense labeled toilets and bathroom sink faucets to our
line of My Home. My Earth. environmentally friendly options and continue to expand
our commitment to this EPA water-effi ciency designation, which recognizes products
that provide signifi cant water savings.”
“In 2008, we began installing only ENERGY STAR qualifi ed appliances in our newly
built homes. Th ese appliances incorporate advanced technologies that use 10–50%
less energy and water than standard models. . . In 2008 alone, we estimate that
installing ENERGY STAR qualifi ed appliances rather than standard models reduced…
water consumption by up to 21 million gallons of water.”
“[We are] partnering with the Southern Nevada Water Authority and the Southern
Nevada Home Builders Association to create the fi rst Water Smart home, which saves
up to 75,000 gallons of water per year compared to homes, built in the 1990s. Since
2005, we have built 6,800 Water Smart homes in the greater Las Vegas area.”
Source: KB Home, “2009 Sustainability Report.” See: http://www.kbhome.com/pdf/KB_Home_
Sustainability_Report_2009.pdf

75Detailed Findings: Mining Sector
MINING SECTOR89
Water plays an essential role in the mining of metals and minerals that serve as key
industrial inputs. Consequently, many confl icts between local communities and
mining companies revolve around water. Th e majority of large-scale mines today use
open-pit methods, where water plays a vital role in cooling and lubricating cutting
and drilling equipment, transporting and processing ore, managing waste tailings,
and suppressing dust.90
Ore mining and processing can contaminate surface and groundwater. Acid runoff
– formed in a mine when air and water come in contact with sulfi de-bearing rock –
aff ects water quality directly by reducing pH levels and increasing concentrations of
toxic metals in mine drainage water. In addition, spills of coal sludge or cyanide can
severely aff ect freshwater resources.
Many minerals sector operations extract ore from below the water table, requiring
them to manage fl ows in mines by extensive groundwater pumping, which can aff ect
local hydrology and ecosystems.
Finally, closed mines can pose signifi cant long-term environmental liabilities, as they must
be pumped and treated indefi nitely to prevent contamination of surface and ground
waters. For example, the total liability to the Canadian government of acid rock drainage
from former mine sites is estimated to be between $2 billion and $5 billion CAD.91
Overview: Water-Related Risks for the Mining SectorTh e mining sector’s operations are especially vulnerable to all four risks: physical,
reputational, regulatory, and litigation – as refl ected in many of the fi rms’ disclosures.
Physical RisksTh e mining sector’s reliance on high volumes of water makes it vulnerable to water
scarcity. Mining operations cannot be relocated, making the sector susceptible to
changing local water availability, as well as to pressure from local communities to
reduce water use.
Aluminum processing can be extremely energy-intensive, and particularly
susceptible to reductions in energy production due to drought. In 2008, Rio Tinto
cut output at its New Zealand smelter by fi ve percent, or 1,400 metric tons a month,
because of power constraints caused by drought.92 In 2003, the company’s operations
in Gladstone, Queensland, Australia faced a 50 percent reduction in their water
allocation, before rain replenished supplies.93 In Brazil (which is 90 percent dependent
on hydroelectric power production), drought conditions in 2001 sharply curtailed
89. “Rio Tinto and Water,” Rio Tinto. See: http://www.riotinto.com/documents/RTandWater.pdf
90. Bell, Fred G. and Laurance J. Donnelly, Mining and its Impact on the Environment, London: Taylor and Francis, 2006.
91. Natural Resources Canada, “Biotechnology, chemical and physical treatment of mining effl uents,” See: http://
www.nrcan-rncan.gc.ca/mms-smm/tect-tech/ser-ser/met-tem-eng.htm
92. Saijel Kishan and Gavin Evans, “Chilean Drought, Power Shortages Drive Up World Metal Prices,” Th e
Washington Post, May 11, 2008. See: http://www.washingtonpost.com/wp-dyn/content/article/2008/05/10/
AR2008051000151.html
93. “Rio Tinto and Water,” Rio Tinto. See: http://www.riotinto.com/documents/RTandWater.pdf
“Companies, including Rio Tinto,
cannot aff ord to regard water as
an inexpensive commodity… Tough
economic times reinforce the need
to recognize there is a cost to using
water. Beyond the broader social
and environmental benefi ts of
conserving our water resources,
it makes good business sense not
to waste water and to reduce our
water use.”
— Tom Albanese, CEO, Rio Tinto89

76 Murky Waters: Corporate Reporting on Water Risk
electricity supply, prompting extensive energy rationing. Aluminum smelters –
including those owned by Alcoa and Vale – were forced to reduce production by 25
percent.94
Mining operations may be disrupted by severe rain or fl ooding, and climate
change is expected to increase the frequency and severity of such extreme weather
events. Cyclonic rains in 2007 fl ooded the pit of Energy Resources of Australia’s (a
subsidiary of Rio Tinto) Ranger uranium mine, halting operations. Th e fl ooding
reduced the company’s fi rst-half net profi ts 71 percent below the previous year’s
performance,95 and sparked fears about the company’s ability to contain run-off that
could contaminate the adjoining Kakadu National Park.96
Reputational RisksUnaddressed community concerns and protests about the water impacts of mining
can lead to the loss of social license to operate. In 2004, thousands of local residents
in the Cajamarca area of Peru staged protests against the expansion of Newmont’s
Yanacocha mine into nearby Cerro Quilish, a mountain that supplies water to local
farmers.97 As the protests over water resources wore on, Newmont’s stock price
plunged seven percent in two weeks.98 In response to the public outcry, the company
announced that further exploration would be suspended. Newmont relinquished
its drilling permit and was forced to reclassify the 3.9 million ounces of gold at
Cerro Quilish from “proven and probable reserves” to “mineralized material not in
reserves.”99 Th e 3.9 million ounces reclassifi ed would have yielded an approximate
valuation of $1.6 billion if realized (given an average market price of gold in 2004
of $409.72 per ounce).100 Present day, mark to market valuations of these potential
reserves (assuming current prices of $1100 per ounce) equate to roughly $4.3 billion.
Campaigns by advocacy groups and aff ected industries over water impacts also
create reputational risks for the mining sector. For example, the proposed Pebble
Mine in Alaska, a joint venture between Anglo American and Northern Dynasty, has
created unprecedented levels of opposition from a broad coalition of environmental
groups, the fi shing industry, and even retail jewelers such as Tiff any & Company.101
Th e proposed copper and gold mine would be sited at the headwaters of Bristol
Bay in Alaska, which produces 50 percent of the world’s commercial supply of wild
sockeye salmon.102 Critics claim that the mine poses a signifi cant and unacceptable
risk to water quality and downstream fi sh stocks.103
94. Patricia A. Plunkert, “Aluminum,” U.S. Geological Survey Minerals Yearbook, 2001.
95. “Miner misses out on uranium boom,” Nuclear Territory News, July 26, 2007. See: http://ntne.ws/articles/article.php?id=1913
96. Giles Parkinson, “Peak water threatens Australian industry,” Climate Change Corp, March 6, 2009. See: http://
www.climatechangecorp.com/content.asp?ContentID=6007
97. Tania Mellado, “Peru farmers threaten strike over gold mine, water,” Planet Ark, September 9, 2004.
98. Michael Riley and Greg Griffi n, “Fighting Back,” Denver Post, December 13, 2004. See: http://www.wman-info.org/
news/newmont%20part%202
99. Newmont, 2005 10-K fi ling.
100. Gold 2004 London PM Fix – U.S. Dollars. Website: www.kitco.com
101. Steve Herz and Bonnie Gestring, “Reputational Risks, Regulatory Challenges and Legal Uncertainties,” Anglo
American’s Pebble Mine Investor Advisory, October 29, 2009.
102. Alaska Department of Fish and Game, Division of Sportfi sh, Research and Technical Services. “Fishery
Management Report no. 06-37. Annual Management Report 2005 Bristol Bay Area,” June 2006.
103. Steve Herz and Bonnie Gestring, “Reputational Risks, Regulatory Challenges and Legal Uncertainties,” Anglo
American’s Pebble Mine Investor Advisory, October 29, 2009.

77Detailed Findings: Mining Sector
Regulatory RisksTh ere is growing support in the United States for tighter regulation of mining impacts
on water resources. In 2009, the U.S. Senate and House of Representatives introduced
legislation to reform the country’s dominant mining legislation, the 1872 Mining Law.
Provisions in these new bills would create stricter standards for mining operations’
impacts on water quality and for ongoing water treatment at closed operations.104
Th e Obama Administration seeks to curtail mountain top removal by coal miners
because of water quality concerns. Mountain top removal is a form of strip mining
that blasts ridge tops to expose coal deposits, sometimes resulting in unused rock
and dirt being dumped into valleys and streams. In October 2009, the EPA vetoed a
water permit for the country’s largest-ever proposed mountain top coal mine in West
Virginia – the fi rst time the agency has taken such action since the enactment of the
Clean Water Act in 1972.105 Also in October 2009, the EPA announced it was delaying
up to 79 permit applications for coal mining projects in Central Appalachia due to
concerns that the projects would damage water quality in nearby streams.106
Governments in emerging economies are increasingly responsive to community
demands to reject mining projects because of water concerns. In 2002, after several
years of community opposition to a proposed gold mine by the Canadian fi rm
Manhattan Minerals in the agricultural region of Tambogrande, Peru, 94 percent of the
population voted against permitting the mine.107 Opposition to the project was based
primarily on the mine’s expected impact on water resources central to the local economy.
Peru’s Ministry of Mining upheld the referendum and stopped the project, preventing the
company from developing an ore body with a projected value of $1.33 billion.108 Similarly,
Nevada-based Meridian Gold had to halt development of an open-pit gold mine
upstream from the tourist town of Esquel, Argentina in 2006, when less than 20 percent
of the town supported the project in a referendum. In response, the government
passed a law imposing a three-year moratorium on mining activity in the region.109
Litigation RisksReliance on water rights, in combination with increased advocacy attention and
growing competition from other water users, can lead to litigation risks for the
mining sector. Th e mining sector regularly faces legal proceedings in pursuing or
maintaining water rights – loss of those rights can curtail operations.
104. EWG, “Environmental Working Group Statement on S. 796, the Hardrock Mining and Reclamation Act of 2009,” July 2009.
105. Erica Peterson, “EPA plans to veto Spruce Mine permit,” West Virginia Public Broadcasting, October 16, 2009. See:
http://www.wvpubcast.org/newsarticle.aspx?id=11690
106. Kris Maher, “Mining Companies Hit Wall on Mountaintop Blasting,” Th e Wall Street Journal, October 8, 2009. See:
http://online.wsj.com/article/SB10001424052748703298004574459363401191286.html
107. “Tambogrande Speaks Out,” Oxfam America, June 20, 2002. See: http://fr.oxfamamerica.org/en/
newsandpublications/news_updates/archive2002/art2763.html
108. “Manhattan Minerals still fi ghting for Tambogrande,” Engineering and Mining Journal, January 1, 2003.
109. “ Meridian Gold Comments on the Decision to Suspend Mining in Chubut,” Meridian Gold press release, July 21, 2006.

78 Murky Waters: Corporate Reporting on Water Risk
Findings: Water Risk Disclosure in the Mining Sector
Key FindingsTh e mining sector demonstrated the strongest water risk disclosure of all the sectors
surveyed, with an average score of 28 out of 100. Th e Swiss miner Xstrata ranked
highest in the sector with a score of 42; coal miner Peabody Energy came in at the
bottom, receiving eight points.
Water accounting. Data reporting in this sector was relatively strong, with 77
percent reporting water use data and four of these companies providing site-
level data.
Risk disclosure. All the mining companies report physical and regulatory risks,
while nearly two-thirds report litigation risks, and more than one-quarter
report reputational risks.
Reduction targets. Six of the 13 mining companies report setting quantitative
targets to improve their water use effi ciency.
Direct operations. Th e mining sector had strong disclosure on water
management eff orts in direct operations, with eight companies providing
information on water-specifi c management systems, strategies or policies.
Stakeholder engagement. Seventy-seven percent of companies disclose
collaborating with local governments and communities to solve water-related
confl icts and manage local water resources.
Mining: Quality of Water Risk Disclosure*
Water accounting Risk assessment Direct operations Supply chainStakeholder engagement Totals**
Potential points per category 36 24 27 7 6 100
Xstrata 14 4 21 0 3 42
Barrick 22 6 8 0 2 38
Rio Tinto 8 10 14 0 5 37
Alcoa 8 8 18 0 1 35
Anglo American 11 6 12 0 4 33
Freeport-McMoRan 3 16 9 0 3 31
BHP Billiton 11 10 9 0 0 30
Teck 9 8 10 0 0 27
Vale 5 4 13 1 4 27
Newmont 9 4 11 0 1 25
Consol Energy 0 12 3 0 0 15
Massey Energy 0 10 5 0 0 15
Peabody Energy 0 4 4 0 0 8
Evaluation key Water accounting: Data on water use, wastewater discharge, and supplier water use.
Risk assessment: Disclosure of water-related physical, regulatory, reputational and litigation risks.
Direct operations: Disclosure of water-related policies, management systems, non-compliance, conservation activities and reduction targets.
Supply chain: Disclosure of supplier collaboration, assessment, and target-setting related to water risk.
Stakeholder engagement: Disclosure of engagement with local, national and international stakeholders to preserve watersheds and improve access to safe drinking water
and sanitation.
*Based on most recent annual fi nancial fi lings and sustainability reports available as of 6/30/09.
**Companies were scored on an overall scale of 0-100 possible points.
Company highlights
Alcoa was the only mining fi rm to
disclose a wastewater reduction goal,
reporting a target of zero process water
discharge by 2020.
Anglo American details its open-source
Socio-Economic Assessment Toolbox
(SEAT), a community assessment and
engagement tool for minimizing local
sustainability (including water-related)
impacts.
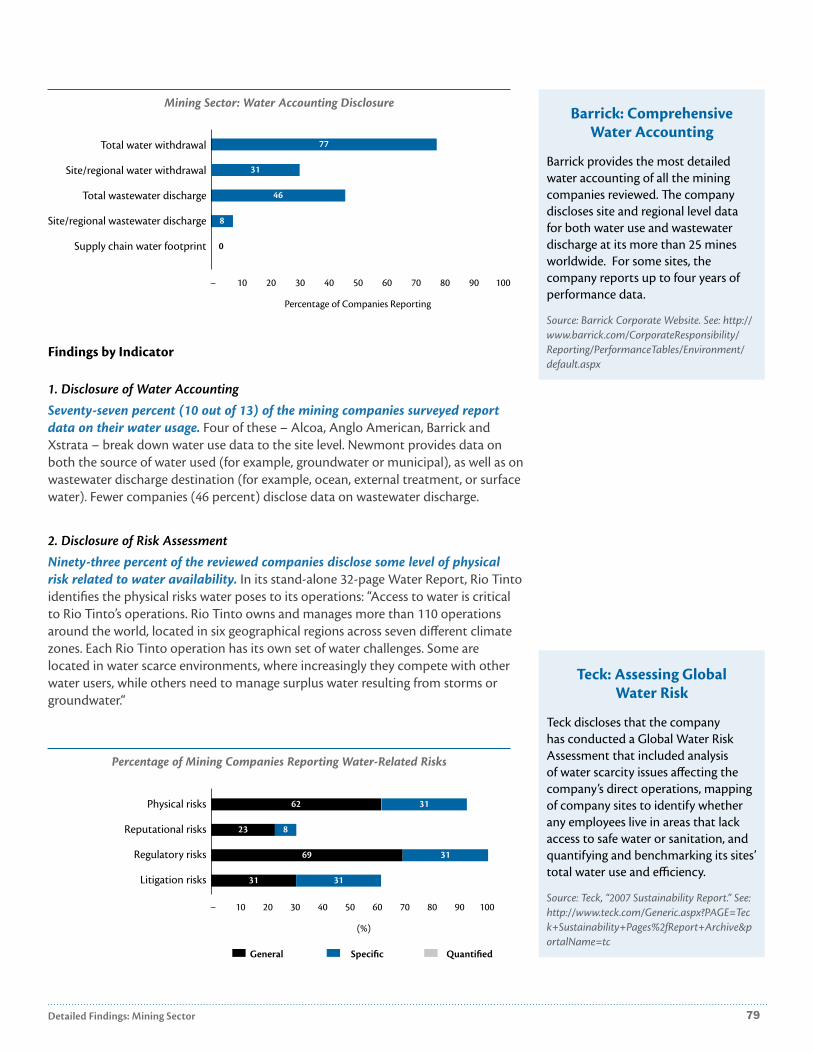
79Detailed Findings: Mining Sector
Findings by Indicator
1. Disclosure of Water Accounting
Seventy-seven percent (10 out of 13) of the mining companies surveyed report
data on their water usage. Four of these – Alcoa, Anglo American, Barrick and
Xstrata – break down water use data to the site level. Newmont provides data on
both the source of water used (for example, groundwater or municipal), as well as on
wastewater discharge destination (for example, ocean, external treatment, or surface
water). Fewer companies (46 percent) disclose data on wastewater discharge.
2. Disclosure of Risk Assessment
Ninety-three percent of the reviewed companies disclose some level of physical
risk related to water availability. In its stand-alone 32-page Water Report, Rio Tinto
identifi es the physical risks water poses to its operations: “Access to water is critical
to Rio Tinto’s operations. Rio Tinto owns and manages more than 110 operations
around the world, located in six geographical regions across seven diff erent climate
zones. Each Rio Tinto operation has its own set of water challenges. Some are
located in water scarce environments, where increasingly they compete with other
water users, while others need to manage surplus water resulting from storms or
groundwater.“
Mining Sector: Water Accounting Disclosure
Total water withdrawal
Site/regional water withdrawal
Total wastewater discharge
Site/regional wastewater discharge
Supply chain water footprint
77
46
8
0
– 10 20 30 40 50 60 70 80 90 100
Percentage of Companies Reporting
31
Percentage of Mining Companies Reporting Water-Related Risks
Physical risks
Reputational risks
Regulatory risks
Litigation risks
69 31
– 10 20 30 40 50 60 70 80 90 100
(%)
23 8
31 31
62 31
General Specifi c Quantifi ed
Barrick: Comprehensive Water Accounting
Barrick provides the most detailed
water accounting of all the mining
companies reviewed. Th e company
discloses site and regional level data
for both water use and wastewater
discharge at its more than 25 mines
worldwide. For some sites, the
company reports up to four years of
performance data.
Source: Barrick Corporate Website. See: http://
www.barrick.com/CorporateResponsibility/
Reporting/PerformanceTables/Environment/
default.aspx
Teck: Assessing Global Water Risk
Teck discloses that the company
has conducted a Global Water Risk
Assessment that included analysis
of water scarcity issues aff ecting the
company’s direct operations, mapping
of company sites to identify whether
any employees live in areas that lack
access to safe water or sanitation, and
quantifying and benchmarking its sites’
total water use and effi ciency.
Source: Teck, “2007 Sustainability Report.” See:
http://www.teck.com/Generic.aspx?PAGE=Tec
k+Sustainability+Pages%2fReport+Archive&p
ortalName=tc
80 Murky Waters: Corporate Reporting on Water Risk
All of the surveyed companies disclose exposure to water-related regulatory risks.
Four companies provide detailed descriptions of these risks and the likely impacts on
their operations.
Sixty-two percent of mining companies report water-related litigation risks,
with several highlighting water rights as a risk factor. For example, in its 2008 10-
K, Freeport-McMoRan notes that “…we cannot predict the potential outcome of
pending or future legal proceedings on our water rights, claims and uses. Th e loss
of some or all water rights for any of our mines, in whole or in part, or shortages
of water to which we have rights could require us to curtail or shut down mining
production and could prevent us from pursuing expansion opportunities.”
Four of the 13 mining companies (31 percent) discuss reputational risks related
to impacts on water or the environment. In its 2008 20-F fi ling, Rio Tinto reports
that “[s]ome of the Group’s current and potential operations are located in or near
communities that may regard such an operation as having a detrimental eff ect
on their environmental, economic or social circumstances. Th e consequences
of community reaction could also have a material adverse impact on the cost,
profi tability, ability to fi nance or even the viability of an operation.”
3. Disclosure of Direct Operations
Th e mining sector had strong disclosure of water management eff orts in direct
operations, with eight companies providing information on water-specifi c
management systems, plans, or policies. Rio Tinto details its water management
system, as does Vale, which notes in its 2008 20-F fi ling that “[t]he Hydrological
Resources Management System implemented throughout Vale includes evaluation
of the availability of water in the areas where we operate and programs to rationalize
and control water use.” BHP Billiton was the only mining company reviewed to
disclose a policy banning the disposal of waste rock or tailings into rivers.
Eighty-fi ve percent of the surveyed companies (11 of 13) report information on
their water-related regulatory compliance, and fi ve companies – Alcoa, Xstrata,
Consol Energy, Freeport and Newmont – also disclose relevant fi nes and eff orts
undertaken to remediate cases of non-compliance.
Six of the 13 mining companies report setting quantitative targets to improve their
water effi ciency. Alcoa was the only mining fi rm to set a wastewater reduction goal,
reporting a target to achieve zero process water discharge by 2020.
Rio Tinto: Water Management Systems
Rio Tinto discloses the company’s
water management system and
standards:
“Th e water standard was developed
in 2003 and sets down Rio Tinto’s
minimum expectations for water
management. It applies to all Rio Tinto
operations – from the exploration
stage right through to closure – as
part of a series of environmental
standards that help deliver consistent
performance wherever we operate.
To meet the water standard, each
operation is required to have:
• A water balance and water
management plan that helps to
prepare for all water needs and
challenges.
• Skilled water personnel who
understand how to assess water risk
manage water in their operations
and engage with the community.
• Appropriately designed water
infrastructure, such as water storages
and borefi elds, which refl ect leading
practice.
Operations are audited against the
standard every two years. Audit results
show that while some operations
are meeting the standard, others are
still working to improve their water
balances and water management plans.”
Source: Rio Tinto, “Rio Tinto and Water.”
See: http://www.riotinto.com./documents/
RTandWater.pdf

81Detailed Findings: Mining Sector
4. Disclosure of Supply Chain
None of the mining companies reviewed disclose engaging with their suppliers on
water-related risk – with the exception of Vale, which mentions that it assesses its
suppliers regularly on environmental performance.
5. Disclosure of Stakeholder Engagement
Ten of the 13 surveyed companies (77 percent) report engaging with stakeholders
on water management issues. Most of the companies disclose collaborating with
local governments and communities to solve water-related confl icts and to manage
local water resources more effi ciently. Xstrata discusses specifi c negotiations with
communities concerned about the company’s water impacts and Anglo American
details its open-source Socio-Economic Assessment Toolbox (SEAT), a community
assessment and engagement tool for minimizing local sustainability (including water-
related) impacts.
Xstrata: Stakeholder Engagement in Chile
Xstrata discusses the company’s
engagement with local communities
on water concerns at its El Morro
project in northern Chile:
“Th ree years of intense consultation
with the communities in the Huasco
Valley and surrounding areas enabled
local people to express their concerns
to the company and participate in
the fi nal mine design. Th e potential
strain on water supplies was the main
concern expressed. As a result, Xstrata
Copper plans to build a desalination
plant on the coast to supply the mine’s
entire water needs during construction
and operation, at a cost of $500
million, or 20% of our total estimated
investment in the project. Th e site
will also use technology to reduce
both water consumption and waste
deposited in the tailings dam.”
Source: Xstrata, “Corporate Sustainability
Report 2008.” See: http://www.xstrata.com/
assets/pdf/x_sustainability_2008.pdf

82 Murky Waters: Corporate Reporting on Water Risk
OIL & GAS SECTOROil and water don’t mix. But water risk management is certainly a factor for
companies across the oil and gas sector. Oil refi ning uses large quantities of water –
one to two-and-a-half gallons of water for every gallon of product – for processing
and cooling.110 Oil sands extraction and upgrading is particularly water-intensive,
with water usage ranging on average from two to four-and-a-half barrels of water per
barrel of synthetic crude oil – in an area of Canada where water scarcity is a growing
concern.111
Water contamination is also a signifi cant risk, particularly in areas where oil and gas
operations intersect with drinking water supplies. Pumping oil and gas out of the
ground can produce large volumes of low-quality water known as “produced water.”
As oil fi elds age, water production increases. According to U.S. Department of Energy
fi gures, the global oil industry produces more water than oil, with water extraction
exceeding oil extraction by two to three times.112
Oil and gas refi ning operations can also negatively aff ect freshwater quality through
uncontrolled spills or wastewater discharge. Unconventional forms of natural gas
extraction, like coal-bed methane, tight sands, and shale gas use drilling technologies
with the potential to contaminate drinking water aquifers.113
Overview: Water-Related Risks for the Oil & Gas SectorA review of the oil and gas sector reveals the industry to be vulnerable to all four
risks: physical, reputational, regulatory, and litigation.
Physical RisksOil refi ners face risks of higher shipping costs, non-availability of feedstock, and
constraints on production when drought decreases river fl ows or limits water
availability. Oil refi neries require large volumes of process steam and cooling water
and are frequently sited near navigable rivers, lakes or seaports. In the summer of
2009, the Rhine River – the main waterway for refi neries in Germany and Switzerland
– experienced unusually low water levels, leading to a 21 percent increase in the costs
of transporting gasoline by barge.114
Water availability is a signifi cant constraint for operators in the Albertan oil
sands, which represent 95 percent of Canada’s estimated petroleum reserves of 174
billion barrels and 50-70 percent of the remaining investible oil assets for Western
110. EPA Region 9, “Sustainable Water Infrastructure, Water Effi ciency by Sectors.” See: http://www.epa.gov/region09/
waterinfrastructure/oilrefi neries.html
111. Alberta EII, “Water Use In Alberta,” Water Innovation in the Oil Patch Forum, Alberta Employment, Immigration
and Industry, PTAC, May 29, 2007.
112. NETL, “Produced Water Management Information System: Introduction to Produced Water,” National Energy
Technology Laboratory. See: http://www.netl.doe.gov/technologies/pwmis/intropw/index.html
113. Alex Barrett et al., “Water: Th e Real Liquidity Crisis,” Standard Chartered Bank, March 20, 2009.
114. Rachel Graham and Nidaa Bakhsh, “Rhine Barge Rates for Oil Products Advance on Low Water Levels,” Bloomberg
News, September 25, 2009. See: http://www.bloomberg.com/apps/news?pid=20601100&sid=apgS5vof0NcM
“…Oil sands production requires an
extremely large quantity of water…
While much of this water is recycled
and used many times over, the oil
sands use more water per year
than the entire city of Calgary. Th e
amount of water consumed per
barrel of oil produced has been
declining, but a 2006 Government
of Alberta report warned that there
simply may not be enough available
water to meet the needs of all
planned oil sands projects.”
—Standard Chartered Bank, “Water: Th e Real
Liquidity Crisis”112

83Detailed Findings: Oil & Gas Sector
companies.115 Th e water intensity of oil sands extraction and upgrading is high, yet
many of the active oil sands projects in the region depend on the declining fl ows of
the Athabasca River as their primary source of water. Between 1970 and 2005, the
Athabasca saw its average summer fl ow decline by 29 percent, and climate scientists
predict that average fl ow could decline by 24-68 percent by the end of this century.116
Current regulations do not take into account the ecological limits of the Athabasca,
let alone future constraints on water supply, meaning that future projects could face
signifi cant risks.
Oil shale production, which has emerged in recent years as a signifi cant new focus
for oil industry R&D investment, requires two to fi ve gallons of water per gallon
of refi nery-ready oil.117 In the United States, oil shale resources are predominantly
located in states such as Colorado, Utah, and Wyoming, which already face relative
water scarcity. Predictions call for these states to become more water-stressed in the
future due to climate change – leading to concerns by regulators and governments
about the industry’s long-term impacts on local water supplies.118
Reputational RisksOil spills that pollute surface and groundwater can pose signifi cant reputational
risks to energy companies. Major oil spills in the past – including Exxon’s Valdez spill
and the alleged contamination of Ecuadorean waterways by Texaco (now owned
by Chevron) – have garnered high public visibility and generated some of the most
sustained levels of environmental protest and fi nancial liability.
Community concerns about wastewater can aff ect the siting and expansion of oil
and gas processing facilities. In 2007, BP made headlines with its application for a
permit to discharge additional pollutants into Lake Michigan from its oil refi nery
in Whiting, Indiana. Th e company sought the permit in order to process oil sands
crude. Local environmental groups and concerned citizens coordinated an aggressive
campaign that ultimately led BP to pledge to invest in technology that would allow it
to restrict its wastewater discharges to pre-expansion levels.119
Regulatory RisksIn the United States, federal and state governments will likely increase their
oversight of potentially water-contaminating chemicals used for deep shale
natural gas drilling. Shale gas drillers use a technology known as “hydraulic
fracturing” to tap into deep underground deposits to release natural gas. Th e
process involves injecting a mix of water, chemicals and sand or plastic beads into
compressed rock to open cracks and release trapped gas. But environmentalists and
115. “Alberta’s Energy Reserves 2008 and Supply/ Demand Outlook 2009-2018”, ERCB 2009 ST-98 Report and
“Worldwide Look at Reserves and Production. Special Report,” Oil & Gas Journal, December 22, 2008, Vol. 106,
Issue 48.
116. University of Alberta, “Running Out of Steam: Oil Sands Development and Water Use in the Athabasca-
Watershed: Science and Market Based Solutions,” Environmental Research & Studies Center, May 2007.
117. James T. Bartis, “Oil Shale Development in the United States: Prospects and Policy Issues,” Rand Corporation,
2005.
118. Jeremy Miller, “Water Scarcity and the Western Oil Shales,” Th e New York Times, June 9, 2009. See: http://
greeninc.blogs.nytimes.com/2009/06/09/water-scarcity-and-the-western-oil-shales/
119. “BP Pledges No Increase in Lake Michigan Discharge Limits at Whiting Refi nery,” BP, press release, August 23,
2007.

84 Murky Waters: Corporate Reporting on Water Risk
some lawmakers are concerned that fracturing has contaminated water supplies
with the chemicals used in the drilling process, and could disturb underground rock
formations, releasing naturally occurring substances like arsenic or mercury into
aquifers.120 Th ere are also concerns about disposal of the drilling fl uid mixture after
it is pumped back out of the well. Investors and environmentalists have asked that
energy companies disclose the specifi c chemicals used in the fl uids that are injected
into wells and then later stored in pools before undergoing treatment.
Federal legislation to regulate fracturing is currently being considered in the
U.S. House of Representatives and the Senate. Th e legislation would require
drilling companies to comply with the Safe Drinking Water Act and disclose the
chemicals used in their hydraulic fracturing processes.121 Th e threat of legislation led
ExxonMobil to include a clause that would allow it to back out of the $41 billion off er
it made in December 2009 to buy natural gas producer XTO Energy if Congress made
fracturing illegal or “commercially impracticable.”122
Regulators in New York State, which sits above the massive Marcellus Shale
gas deposit, are also increasing scrutiny of the water impacts of fracturing. In
September 2009, the New York State Department of Environmental Conservation
released draft permit conditions that would require disclosure of chemicals used,
specifi c well construction protocols, and baseline pre-testing of surrounding drinking
water wells.123 In December 2009, the City of New York, worried that gas drilling in
New York state could threaten the city’s watershed, called for a ban on the practice,
and the U.S. EPA also weighed in, urging New York State regulators to undertake
a broader study of the potential environmental and human health impacts of
drilling.124
New regulatory requirements for managing tailings ponds in Alberta will increase
the costs to oil sands operators. Oil sands extraction processes generate tailings
as a waste by-product generally composed of water, sand, silt, clay, and residual
bitumen. Numerous cases document leakage of toxic fl uids from tailings ponds into
the Athabasca River or into groundwater, and to date, no tailings ponds have been
fully reclaimed.125 In February 2009, the Alberta Energy Resources Conservation Board
released a directive requiring operators to reclaim existing tailings ponds and reduce
disposal to new ponds on an aggressive timeline.126 A recent investor study of the oil
sands sector found that no oil sands companies disclose the cost of tailings reclamation
120. Katie Howell, “More Oversight Sought for Hydraulic Fracturing,” Th e New York Times, November 4, 2009. See: http://
www.nytimes.com/gwire/2009/11/04/04greenwire-more-oversight-sought-for-hydraulic-fracturing-35961.html
121. Ibid.
122. Russell Gold, “Exxon Can Stop Deal if Drilling Method Is Restricted,” Th e Wall Street Journal, December 16, 2009.
See: http://online.wsj.com/article/SB10001424052748703581204574600111296148326.html
123. Fritz Mayer, “Rules versus permit conditions,” Th e River Reporter, November 12-18, 2009. See: http://www.
riverreporter.com/issues/09-11-12/news-rules.html
124. Mireya Navarro, “E.P.A., Concerned Over Gas Drilling, Questions New York State’s Plans,” Th e New York Times,
December 30, 2009. See: http://www.nytimes.com/2009/12/31/science/earth/31drill.html
125. Michelle de Cordova and Jamie Bonham, “Drawing Lines in the Sands: Oil Sands Benchmarking,” Ethical Funds,
November 2009.
126. Shawn Denstendt and Jessica Ng, “New Oil Sands Tailings Requirements Increase Regulatory Scrutiny,” Osler,
February 5, 2009. See: http://www.osler.com/resources.aspx?id=16840

85Detailed Findings: Oil & Gas Sector
– which is likely to be substantial – in easily understandable form, and none provide
detail on how they determine how much money to set aside each year.127
Litigation RisksEnergy companies face litigation risks for spills and contamination of freshwater
resources. Th e widespread contamination of groundwater linked to methyl tertiary
butyl ether (MTBE), a gasoline additive and suspected carcinogen, has given rise to
over 70 lawsuits fi led against major oil companies in the United States. Estimates
place oil companies’ payments at over $423 million on settlements over 30 years
related to MTBE suits involving the contamination of 153 public water systems.128
In October 2009, a federal jury awarded $104.7 million in compensatory damages
against ExxonMobil for MTBE contamination of New York City’s groundwater and
drinking water supply.129
127. Michelle de Cordova and Jamie Bonham, “Drawing Lines in the Sands: Oil Sands Benchmarking,” Ethical Funds,
November 2009.
128. Weitz & Luxenberg, “Weitz & Luxenberg P.C. Secures $423 Million MTBE Settlement Against Oil Giants,” Weitz &
Luxenberg, press release, May 8, 2008.
129. Jonathan Fitzgarrald, “Greenberg Glusker’s Robert Chapman Secures $105M Damage Award in Exxon
Groundwater Contamination Trial,” Reuters, October 19, 2009. See: http://69.63.131.239/news/releases/Exxon

86 Murky Waters: Corporate Reporting on Water Risk
Findings: Water Risk Disclosure in the Oil & Gas Sector
Key FindingsTh e sector showed relatively weak water risk disclosure overall, with an average score of
19 out of 100. BP achieved the highest level of disclosure in the sector with 35 points;
Canadian natural gas producer EnCana came in at the bottom with four points.
Water accounting data. Nearly two-thirds of the oil and gas companies reviewed
report total water usage, with only two – BP and Royal Dutch Shell – providing
access to site and regional data. Fewer than half provide any wastewater
discharge data.
Risk disclosure. Slightly more than half the oil companies report some level of
physical risk. All but one disclose some regulatory risk. Litigation and reputational
risk disclosure was limited to three and four companies, respectively.
Reduction targets. Only two companies – both oil sands operators – disclose water
use reduction targets; only one – Total – reports a wastewater reduction target.
Supply chain engagement. No companies disclose engaging with suppliers
on water management or risks, despite the sector’s signifi cant reliance on
contracted companies to perform drilling services.
Stakeholder engagement. Over half the companies report stakeholder
engagement with local communities on water management issues.
Oil & Gas: Quality of Water Risk Disclosure*
Water accounting Risk assessment Direct operations Supply chainStakeholder engagement Totals**
Potential points per category 36 24 27 7 6 100
BP 19 6 10 0 0 35
Suncor Energy*** 10 4 13 0 0 27
Total 10 4 10 0 3 27
Nexen 7 8 8 0 3 26
Royal Dutch Shell 5 10 8 0 2 25
ExxonMobil 5 8 6 0 4 23
Chevron 3 6 5 0 2 16
ConocoPhillips 2 10 4 0 0 16
Devon Energy 4 4 6 0 2 16
Canadian Natural Resources 2 2 8 0 0 12
Chesapeake Energy 0 2 3 0 2 7
Range Resources 0 4 3 0 0 7
EnCana 0 2 1 0 1 4
Evaluation key Water accounting: Data on water use, wastewater discharge, and supplier water use.
Risk assessment: Disclosure of water-related physical, regulatory, reputational and litigation risks.
Direct operations: Disclosure of water-related policies, management systems, non-compliance, conservation activities and reduction targets.
Supply chain: Disclosure of supplier collaboration, assessment, and target-setting related to water risk.
Stakeholder engagement: Disclosure of engagement with local, national and international stakeholders to preserve watersheds and improve access to safe drinking water
and sanitation.
*Based on most recent annual fi nancial fi lings and sustainability reports available as of 6/30/09.
**Companies were scored on an overall scale of 0-100 possible points.
***Suncor’s data was evaluated prior to the company’s merger with Petro-Canada.
Company Highlights
BP provides an interactive world map
that allows readers to identify facilities
operating in water-stressed regions and
access short profi les of those sites.
ConocoPhillips recently established a
Qatar-based Global Water Sustainability
Center focused on examining methods
to treat and reuse by-product water
from oil production and refi ning
operations.

87Detailed Findings: Oil & Gas Sector
Findings by Indicator
1. Disclosure of Water Footprint
Eight out of the 13 oil and gas companies evaluated report their total water usage.
Of these, BP and Royal Dutch Shell provide access to site and regional level water use
data through dedicated facility reports. Th e reviewed companies were weaker with
respect to disclosing wastewater discharge, with only six companies (46 percent)
providing some level of data in this area. BP was the only oil company to report site-
specifi c wastewater discharge data. None of the oil companies provide information
on their suppliers’ water footprint.
2. Disclosure of Risk Assessment
Fifty-four percent of the reviewed companies provide some disclosure on water-
related physical risks. Most of the companies provide very high-level information,
noting that water scarcity and water quality may possibly constrain their direct
operations. For example, Shell states: “By 2025, two-thirds of the world’s population
could be living in areas where fresh water supplies are under serious stress…Our
industry is not a big water user, compared for example, to agriculture. But growing
crops to make biofuels and mining bitumen from oil sands can be water intensive;
and some oil and gas operations use (and produce) quantities of water that can be
signifi cant in water stressed areas.” Nexen notes more pronounced water scarcity
and quality risks in the Albertan oil sands region, where multiple users draw on the
Athabasca River, the region’s main water resource.
Oil & Gas Sector: Water Accounting Disclosure
Total water withdrawal
Site/regional water withdrawal
Total wastewater discharge
Site/regional wastewater discharge
Supply chain water footprint
62
46
8
0
– 10 20 30 40 50 60 70 80 90 100
Percentage of Companies Reporting
15
Percentage of Oil & Gas Companies Reporting Water-Related Risks
Physical risks
Reputational risks
Regulatory risks
Litigation risks
46 8
– 10 20 30 40 50 60 70 80 90
(%)
100
62 31
23 8
23
General Specifi c Quantifi ed
BP: Mapping Water Risk
In addition to providing detailed water
use and wastewater discharge data,
BP’s sustainability website features
an interactive world map that allows
readers to access short profi les of
facilities operating in water-stressed
regions. Of the 49 BP sites on the map,
the company highlights four that
are in areas where local community
freshwater supplies have been assessed
as under stress. Th ese sites include BP’s
Castellon refi nery in Spain, production
facilities in Pakistan and exploration
and production facilities in the Gulf of
Suez and the U.A.E.
Source: BP, “Environmental Mapping
Tool.” See: http://www.bp.com/hsetool.
do?categoryId=9027867&issueId=3

88 Murky Waters: Corporate Reporting on Water Risk
ConocoPhillips’s Global Water Sustainability Center
ConocoPhillips reports on the company’s investment in R&D for water technologies:
“ConocoPhillips’ Global Water Sustainability Center opened in early 2009 with the mission of examining methods to treat
and reuse byproduct water from oil production and refi ning operations and conduct other projects relating to industrial and
municipal water sustainability. Th e center is located in the Qatar Science and Technology Park (QSTP) in Doha…[and] aims to
develop innovative, effi cient and cost-eff ective technologies to treat byproduct water for potential use in applications such as crop
irrigation, livestock watering, wildlife habitats, or industrial cooling and recycling within the operation facility…ConocoPhillips
intends for the facility to become a center of excellence for key water-related technologies in the petroleum and water industries.”
Source: ConocoPhillips, “2008 Sustainable Development Report.” See: http://www.conocophillips.com/EN/susdev/documents/6280095SustainableDev_web.pdf
All the oil and gas companies reviewed – with the exception of ExxonMobil –
provide some description of their exposure to water-related regulatory risks. Only
four companies – Chevron, ExxonMobil, Shell and ConocoPhillips – disclose water-
related litigation risks.
Th ree of the oil companies reviewed – BP, Nexen, and Shell – disclose some
information on reputational risks. Nexen, for example, notes in its 2008 10-K fi ling that
“the public may react negatively to certain water disposal practices related to water
saturated CBM [coal-bed methane] projects, even though these water disposal practices
are regulated to ensure public safety and water conservation. Negative public perception
around water saturated CBM production could impede our access to the resource.”
3. Disclosure of Direct Operations
Five oil and gas companies report water-related policies or standards. All the
companies in the sector disclose eff orts towards reducing water consumption or
reusing/recycling existing water resources. Most discuss steps taken to increase the
use of brackish/saline water in their operations, thereby recycling “produced” water
and reducing the use of freshwater.
Only two of the 13 oil and gas companies reviewed disclose water use reduction
targets. Suncor reports a company-wide target to reduce total water withdrawals by
12 percent by 2015 with a 2007 baseline. Canadian Natural Resources discloses a water
effi ciency target for one site, Primrose, where it aims to reduce freshwater intake by
73 percent by 2013 compared to 2006 levels. Total was the only company to disclose a
target to reduce hydrocarbon contamination levels in wastewater discharges.
4. Disclosure of Supply Chain
None of the oil companies reviewed disclose engaging with their suppliers on
water-related impacts or risks, despite the industry’s signifi cant reliance on service
companies for drilling and shipping activities, among others.
5. Disclosure of Stakeholder Engagement
Fifty-four percent of companies report engaging with stakeholders on water
management issues. Companies disclose a range of engagement activities with local
communities to solve water-related issues such as watershed management (ExxonMobil),
clean drinking water projects (Chevron), and groundwater protection (Nexen).
Suncor: Reducing Water Use in the Oil Sands
In its 2008 sustainability report, Suncor
discloses reducing its absolute water
use by 22 percent over the past six
years, with most of these gains made
at the company’s oil sands operations.
In 2008, it used 3.1 m3 of water to
produce 1 m3 of oil – a 37 percent
reduction in water use intensity since
2002. Suncor realized these savings
through increased reuse and recycling.
For example, the company recycles
approximately 90 percent of the water
used to make steam at its in situ
operation through a continuous loop
system, eliminating the need for fresh
surface or groundwater.
Suncor recently adopted a 10-year
water management plan designed
to recycle and reuse larger amounts
of wastewater and tailings water,
reducing its need to withdraw river
water. Th e budgeted costs to execute
this plan exceed $500 million. As part
of this plan, Suncor set a company-
wide target to reduce total water
intake by 12 percent by 2015 from a
2007 baseline.
Source: Suncor, “2009 Summary Report
on Sustainability.” See: http://www.suncor.
com/pdf/2009_Report_on_Sustainability_
Summary.pdf

89Detailed Findings: Semiconductor Sector
SEMICONDUCTOR SECTORWithout semiconductors, the data systems running our computers, cell phones, and
automobiles would come to a halt. Yet semiconductor manufacturing is a thirsty
process. Th e silicon wafers must be rinsed after each of several dozen semiconductor
layers is applied and etched, requiring massive amounts of water. To make a single
300-millimeter wafer, a typical semiconductor plant requires approximately 2,000
gallons of water.130 Th is translates to between two to four million gallons of water per
day at a typical fabrication plant or “fab,” roughly the equivalent of the daily water
requirements for a city of 50,000 people.131
In addition to the massive quantity of water required, water quality is a key concern.
Semiconductor manufacturing plants need water thousands of times purer than
drinking water. Th is ultrapure water is fi ltered and refi ned through expensive and
sophisticated processes, resulting in the cleanest water found on earth. Because
numerous chemicals are used to etch silicon wafers, however, wastewater from
semiconductor plants can contain a range of contaminants including arsenic,
antimony, phosphorous, hydrogen peroxide, nitric acid, sulphuric acid, and
hydrofl uoric acid. 132
Overview: Water-Related Risks for the Semiconductor SectorA review of the sector reveals the most salient water risks for semiconductor makers
are physical and litigation risks.
Physical RisksSemiconductor manufacturing is highly water-intensive, requiring large volumes
of water of the highest industrial quality. At the same time, a large number of
semiconductor factories are located in arid or semi-arid regions of the world, such as
the American southwest, where rapid population growth and longer-term climate
change impacts will likely heighten existing stress on water resources.
Off shore production, in particular, heightens vulnerability to physical water risk.
Semiconductor fi rms face increased physical risk in Asian and Pacifi c Rim countries.
Rapid population and economic growth is already stressing water resources –
trends further exacerbated by the increasing number of manufacturing facilities
moving to the region. In Beijing, the water supply situation is so problematic that
chipmakers must truck water to their facilities several weeks out of each year. Th e
large Semiconductor Manufacturing International Corp. facility outside Beijing, for
130. “Pure water, semiconductors and the recession,” Global Water Intelligence, Vol. 10, Issue 10, October 2009. See:
http://www.globalwaterintel.com/archive/10/10/market-insight/pure-water-semiconductors-and-the-recession.
html
131. IEEE Interview (Transcript) with Laurie Howell, Ting Sun and Farhang Shadman, “Semiconductor Manufacturing
Plants can use as much water as a small city,” Engineers of the New Millennium: Th e Global Water Challenge
Special Report from IEEE.
132. Marc Levinson et al., “Watching water: A guide to evaluating corporate risks in a thirsty world,” JPMorgan Global
Equity Research, March 31, 2008.
According to analysis by JPMorgan,
a water-related shutdown at
a semiconductor fabrication
facility operated by Intel or Texas
Instruments could result in
$100–$200 million in missed
revenue during a quarter, or $0.02
or $0.04 per share.131
90 Murky Waters: Corporate Reporting on Water Risk
example, maintains its own backup reservoirs, in addition to the backup reservoirs of
the Beijing and Tianjin water utilities.133
Currently, 11 of the top 14 integrated circuit foundries in the world are located in the
Asia-Pacifi c region, accounting for over 75 percent of the industry’s sales.134
Litigation RisksSemiconductor fi rms face litigation risks associated with groundwater
contamination. Historically, semiconductor operations in the United States
have been subject to litigation and Superfund obligations linked to groundwater
contamination. Perhaps the most signifi cant historical example is Fairchild
Semiconductor Corporation’s 56-acre San Jose plant in Silicon Valley, which was
offi cially listed as a Superfund site in 1989.135 Motorola has two Superfund sites where
solvents used in the manufacture and cleaning of semiconductors contributed to
groundwater contamination. Th e company is expected to pay the EPA’s oversight
costs, estimated at over $1.5 million.136
133. “Water: Th e Emerging Business Concerns,” Travel Daily News, January 4, 2007. See: http://www.traveldailynews.
com/pages/show_page/20520-Water:-Th e-Emerging-Business-Concerns
134. Marc Levinson et al., “Watching water: A guide to evaluating corporate risks in a thirsty world,” JPMorgan Global
Equity Research, March 31, 2008.
135. Weitz & Luxenberg P.C. See: http://www.weitzlux.com/environmentallawsuit/california/
fairchildsemicondu_145457.html#report
136. “Phoenix superfund site enters next phase of clean up,” Environmental Protection Agency, press release,
September 29, 2009.

91Detailed Findings: Semiconductor Sector
Findings: Water Risk Disclosure in the Semiconductor Sector
Key FindingsTh e sector showed relatively poor water risk disclosure overall, with an average score
of 21 out of 100.
Toshiba ranked highest in the sector with a score of 35. Micron provided the weakest
disclosure, receiving only one point.
Water accounting data. Th e majority of the semiconductor makers report data
on water use, but relatively few provide data on wastewater discharge.
Risk disclosure. Nearly two-thirds of the reviewed companies disclose water-
related physical risks and regulatory risks, while less than one-third report on
litigation risks.
Supply chain disclosure. Only two companies provide information on actions
taken with suppliers to improve environmental impacts, and water-specifi c
information was limited. Th is lack of discussion was notable in light of the fact
that many semiconductor companies outsource a signifi cant amount of chip
production to other fi rms.
Stakeholder engagement. Only one company, Intel, reports on eff orts to
collaborate with stakeholders on water resource management.
Semiconductors: Quality of Water Risk Disclosure*
Water accounting Risk assessment Direct operations Supply chainStakeholder engagement Totals**
Potential points per category 36 24 27 7 6 100
Toshiba 20 4 11 0 0 35
Intel 11 6 14 1 2 34
Samsung 21 2 6 0 0 29
United Microelectronics 15 6 6 0 0 27
Taiwan Semiconductors 10 6 8 1 0 25
ST Microelectronics 12 2 8 0 0 22
Advanced Micro Devices (AMD) 5 6 6 0 0 17
Analog Devices 4 2 9 0 0 15
Texas Instruments 4 4 7 0 0 15
Infi neon Technologies 0 4 4 0 0 8
Micron 0 0 1 0 0 1
Evaluation key Water accounting: Data on water use, wastewater discharge, and supplier water use.
Risk assessment: Disclosure of water-related physical, regulatory, reputational and litigation risks.
Direct operations: Disclosure of water-related policies, management systems, non-compliance, conservation activities and reduction targets.
Supply chain: Disclosure of supplier collaboration, assessment, and target-setting related to water risk.
Stakeholder engagement: Disclosure of engagement with local, national and international stakeholders to preserve watersheds and improve access to safe drinking water
and sanitation.
*Based on most recent annual fi nancial fi lings and sustainability reports available as of 6/30/09.
**Companies were scored on an overall scale of 0-100 possible points.
Company Highlights
ST Microelectronics discloses the total
fi nancial savings achieved from its water
reduction eff orts, totaling $119 million
over a fi ve-year period.
Texas Instruments notes that all its
facilities maintain a water management
system that is ISO 14001-compliant.

92 Murky Waters: Corporate Reporting on Water Risk
Findings by Indicator
1. Disclosure of Water Accounting
Th e majority (82 percent) of the semiconductor makers reviewed report
information on water use, and of these nine companies, three break down this data
to the site or regional level. Only four companies provide data on their wastewater
discharge, with Samsung, Taiwan Electronics, and United Microelectronics presenting
facility-level data on these indicators. None of the companies report water
performance data on their suppliers.
2. Disclosure of Risk Assessment
Sixty-three percent (seven out of 11) of the reviewed companies disclose water-
related physical risks. For example, Intel in its 2008 10-K states that, “Many of our
operations are located in semi-arid regions, such as Israel and the southwestern
United States. Some climate change scenarios predict that such regions can become
even more vulnerable to prolonged droughts due to climate change.” Taiwan
Semiconductors in its 2008 20-F fi ling also cites the location of its Taiwanese
operations as a physical risk: “Th e semiconductor manufacturing processes also
use extensive amounts of fresh water. Due to the growth of the semiconductor
manufacturers in the Hsinchu Science Park and Tainan Science Park, and the
droughts that Taiwan experiences from time to time, there is concern regarding
future availability of suffi cient fresh water and the potential impact insuffi cient water
supplies may have on our semiconductor production.”
While seven of the 11 companies (64 percent) disclose regulatory risks, only
three companies disclose water-related litigation risks: AMD, Infi neon, and Texas
Instruments. No companies mention reputational risks.
3. Disclosure of Direct Operations
Only Texas Instruments and Toshiba discuss water-related management systems.
For example, Texas Instruments discloses an ISO-14001 certifi ed water management
system and related facility siting policy. Intel and Texas Instruments describe their
water conservation actions in water-stressed regions in detail. In its CSR report, Intel
discusses the company’s water management plan in Arizona, which has lowered its
plant’s daily water demand by up to 75 percent.
Semiconductor Sector: Water Accounting Disclosure
Total water withdrawal
Site/regional water withdrawal
Total wastewater discharge
Site/regional wastewater discharge
Supply chain water footprint
82
36
0
– 10 20 30 40 50 60 70 80 90 100
Percentage of Companies Reporting
27
27
ST Microelectronics: Putting a Price on Water Savings
Geneva-based ST Microelectronics
discloses the total costs versus savings
for three key inputs associated with
its semiconductor manufacturing:
water, energy, and chemical use. Th e
company monetized savings for each
of these inputs, and reports that
its water conservation eff orts have
resulted in cumulative water-related
savings of US$119 million between
2004 to 2008.
Source: ST Microelectronics, “2008 Corporate
Responsibility Report.” See: http://www.st.com/
stonline/company/sd/report08/cr08.pdf

93Detailed Findings: Semiconductor Sector
Six of the semiconductor companies reviewed disclose quantifi ed targets to reduce
water use. AMD reports (and has achieved) a target to cut water use by 40 percent
on an effi ciency basis by 2007, relative to a baseline year of 2002. Only one company
– Toshiba – discloses a target for reducing wastewater discharge.
4. Disclosure of Supply Chain
Only two companies – Intel and Taiwan Semiconductors – provide some
information on actions in their supply chains to improve environmental impacts,
but water-specifi c information was limited. Th is lack of discussion was notable
in light of the fact that many semiconductor companies outsource a signifi cant
amount of chip production to other fi rms.137 Intel discloses that, since 1998, it has
conducted the Supplier Continuous Quality Improvement (SCQI) Program, which
includes supplier training, assessments, and continuous improvement plans. Taiwan
Semiconductor reports that it similarly conducts surveys and site audits of its
suppliers on environmental protection and hazardous materials reduction.
5. Disclosure of Stakeholder Engagement
Disclosure was limited on stakeholder engagement eff orts related to water. Only
one company – Intel – reports on eff orts to collaborate with stakeholders on water
resource management. In its 2008 CSR report, the company mentions collaborations
with local communities towards water conservation, including funding and
partnering on projects that replenish rivers and tributaries, and protect wetlands and
native species near the company’s facilities in Massachusetts, Oregon, and Ireland.
137. “Industry Data: Semiconductor & Fabless Facts,” Global Semiconductor Alliance. See: http://www.gsaglobal.org/
resources/industrydata/facts.asp
Percentage of Semiconductor Companies Reporting Water-Related Risks
Physical Risks
Reputational risks
Regulatory risks
Litigation risks
36 27
GeneralSpecifi cQuantifi ed
– 10 20 30 40 50 60 70 80 90 100
(%)
27
64
0
Texas Instruments’ Water Management Systems
Texas Instruments describes the
company’s management system for
water conservation and discloses
how it takes water availability into
consideration when siting new
facilities:
“Our environmental goal of “zero
wasted resources” drives how we plan
for and monitor water use, and how
effi ciently we actually use it. Each TI
site maintains a water management
system that is both OHSAS 18001- and
ISO 14001-compliant, even if a site has
not yet been certifi ed…Each TI site
also monitors its own progress for fair
water use and conservation.
…As a practical consideration, when
selecting the location of a new site,
we consider whether the area has
suffi cient stores of water. We review
both water quality and quantity during
site selection, long before construction
begins. Additionally, we consult with
local water authorities to assess the
long-term storage and use needs
where we operate.”
Source: Texas Instruments, “2008 Corporate
Citizenship Report.” See: http://www.ti.com/
corp/docs/csr/environment/WaterUse.shtml

94 Murky Waters: Corporate Reporting on Water Risk
Intel: Water Management in Arizona
Intel reports working with the city of Chandler, Arizona over the past decade to
implement a water management system that has lowered Intel Arizona’s daily water
demand by up to 75 percent. Th e company details a series of water conservation
activities undertaken to achieve these gains:
• Aquifer recharge: Since 1996, Intel has replenished over 3.5 billion gallons of water
back to the underground aquifer, using reverse osmosis (RO) technologies to treat
wastewater from its Chandler plants to drinking water standards.
• Reclaim: Over the past decade, the company has used more than 4.5 billion gallons
of treated wastewater from Chandler’s Ocotillo Water Reclamation Facility instead
of tapping into potable water supplies to run cooling towers and air-abatement
equipment, among other uses.
• Recycle: Using advanced technologies such as RO and a brine evaporation system,
Fabrication Plant 22 in Chandler operates one of Intel’s most effi cient ultra-pure
water (UPW) treatment facilities, producing roughly 0.85 gallons of UPW per gallon
of city water – saving millions of gallons of water each year compared to other
purifi cation processes.
Source: Intel, “2008 Corporate Responsibility Report.” See: http://download.intel.com/intel/cr/gcr/pdf/
Intel_CSR_Report_2008.pdf

Ceres is a national coalition of investors, environmental groups, and other public interest
organizations working with companies to address sustainability challenges such as water scarcity
and climate change. Ceres directs the Investor Network on Climate Risk, a group of more than 80
institutional investors and fi nancial fi rms from the U.S. and Europe managing over $8 trillion in assets.
UBS is a global fi rm providing fi nancial services to private, corporate, and institutional clients. Th e
UBS Investment Research SRI & Sustainability research team was formally established as part of
the Investment Bank at the end of 2004, in response to steady demand from UBS clients for such
research. SRI & Sustainability Investment is an active asset management approach, that takes
fi nancial, fundamental, and also environmental, social, ethical, and governance issues into account in
the implementation of investment decisions.
Bloomberg, LP provided the water-related data for this report. Bloomberg’s Environmental, Social
and Governance (ESG) Data Service provides multi-year, as reported data on over 3,500 companies
as well as supporting news, research, and analytics integrated into the core system functionality.
As the premier fi nancial information provider for banks, corporations, governments and others,
Bloomberg leverages its distribution platform to provide ESG data to improve transparency,
liquidity and asset valuations.
Acknowledgements
Th is report was made possible through support from the Park Foundation and
Compton Foundation. Th e opinions expressed in this report are those of the authors
and do not necessarily refl ect the views of the sponsors.
UBS and Ceres would especially like to thank Shilpa Salian for her assistance
on this report. Shilpa Salian is not an employee of UBS.
Ceres wishes to thank the Bloomberg analysts who collected data for this report:
Emil Efthimides, Jacob Gladstone, Rina Levy, Melissa Reville, and Andrew Snow.
Ceres also wishes to thank the Investor Network on Climate Risk members who helped
develop this report, and members of the Ceres team who provided valuable insight and
suggestions: Jim Coburn, Peyton Fleming, Andrea Moff at, Roseann Casey,
Warren Paul Anderson, Matt Fisher, Dan Mullen, Meg Crawford, Lauren Wolpin,
Courtney Queen, and Kara Oberg.
Graphic design by Maggie Powell Designs.
Copyright 2010 by Ceres.
For more information, contact:
Th e views and opinions expressed in this article are those of
the author and are not necessarily those of UBS Limited. UBS
Limited accepts no liability over the content of the article. It
is published solely for informational purposes and is not to
be construed as a solicitation or an off er to buy or sell any
securities or related fi nancial instruments.
Brooke Barton
Senior Manager, Corporate Programs
Ceres
99 Chauncy Street
Boston, MA 02111
www.ceres.org
Shirley Morgan-Knott
Analyst, SRI and Sustainability Research
UBS Investment Research
1 Finsbury Avenue
London EC2M 2PP
www.ubs.com
Emil Efthimides
ESG Data Product Manager
Bloomberg, LP
100-101 Business Park Drive
Skillman, NJ 08558
www.bloomberg.com

MURKY WATERS? Corporate Reporting
on Water RiskA Benchmarking Study of 100 Companies
February 2010A Ceres Report
Authored byBrooke Barton, Ceres
With scoring and analysis byShirley Morgan-Knott,
UBS Investment Research
With data support byBloomberg, LP
Ceres99 Chauncy Street
Boston, MA 02111
T: 617-247-0700
F: 617-267-5400
www.ceres.org
©2010 Ceres
Bloomberg, LP