Embed Size (px)
Citation preview

MPRAMunich Personal RePEc Archive
Tourism-led Growth Hypothesis in theTop Ten Tourist Destinations: NewEvidence Using the Quantile-on-QuantileApproach
Syed Jawad Hussain Shahzad and Muhammad Shahbaz and
Roman Ferrer and Ronald Ravinesh Kumar
COMSATS Institute of Information Technology, Islamabad,Pakistan, University of Valencia, Spain, University of the SouthPacific, Suva, Fiji
1 December 2016
Online at https://mpra.ub.uni-muenchen.de/75540/MPRA Paper No. 75540, posted 13 December 2016 15:46 UTC
1
Tourism-led Growth Hypothesis in the Top Ten Tourist Destinations: New Evidence Using the Quantile-on-Quantile Approach
Syed Jawad Hussain Shahzad COMSATS Institute of Information Technology, Islamabad Pakistan & University of Malaysia Terengganu, Malaysia E-mail: [email protected] Muhammad Shahbaz Energy Research Centre COMSATS Institute of Information Technology, Lahore, Pakistan. Email: [email protected] Román Ferrer Department of Actuarial and Financial Economics University of Valencia (Spain) Avda. Tarongers s/n 46022 Valencia (Spain) E-mail: [email protected] Ronald Ravinesh Kumar School of Accounting & Finance, University of the South Pacific, Suva, Fiji. E-mail: [email protected]; [email protected] & QUT Business School, Queensland University of Technology, 2 George Street, Brisbane QLD 4001, Australia. Email: [email protected]; & Bolton Business School, University of Bolton, Deane Rd, Bolton BL3 5AB, United Kingdom. E-mail: [email protected] Abstract: This paper examines the empirical validity of the tourism-led growth hypothesis in the toptentourist destinations in the world(China, France, Germany, Italy, Mexico, Russia, Spain, Turkey, the United Kingdom, and the United States)using the quantile-on-quantile (QQ) approach and a new index of tourism activity that combines the most commonly used tourism indicators. This methodology, recently introduced by Sim and Zhou (2015), provides an ideal framework with which to capture the overall dependence structure between tourism development and economic growth. The empirical results primarily show a positive relation between tourism and economic growth for the ten countries considered with substantial variations across countries and across quantiles within each country. The weakest links arenoted for China and Germany,possibly because of the limitedimportance of the tourism sector relative to other major economic activities in those countries. Important country-specific policy implications may be drawn from these findings. Keywords: tourism, economic growth, tourism-led growth hypothesis, real GDP per capita, quantile-on-quantile (QQ) approach.

2
1. Introduction
Tourism is one of the fastest growing industries in the world and a leading driver of
economic growth and socio-economic progress,not only for many developing countriesbut
alsofor somedeveloped countries. The continued surge in international tourist flows over the past
few decades is an unequivocal sign of the buoyant and resilient tourism sector worldwide. The
United Nations World Tourism Organization (UNWTO) projects that total international tourist
arrivals will grow by 3.3%a year to reach 1.8 billion by 2030. Tourism can affect economic
activityby a number of channels.The tourism sector generates employment and tax revenues;it
stimulates investment in infrastructure, human capital and technology;it enhances the efficiency
of local firms by increasing competition; and it facilitates the exploitation of economies of scale.
Furthermore, tourismmay be considered an alternative form of export and hence a prime source
of foreign exchange earnings, which reducesthedeficitin a country’s balance of payments.In
addition, tourismcontributes to exchanges of cultures and experiences betweensource and origin
countries, thus enhancing social capital. Finally, because ofefforts in green tourism, the tourism
sector may also be an important catalyst forthe protection of the environment and wildlife.
The positive and interdependent effects of tourism development on the economy
havefosteredthe emergence of thetourism-led growth (henceforth TLG) hypothesis (Balaguer and
Cantavella-Jordá, 2002).According to this hypothesis, tourism is a major determinant of overall
long-term economic growth. It is crucial for governments to identifythe empirical validity of the
TLG hypothesis in a countrytooptimize resource allocation to tourism development and hence to
harness the consequent multiple benefits.
However, despite the strong growth of the tourism sector in many countries in recent years,
the effect of tourism development on economic growth does not necessarily have to be

3
identicalfor all countries. In this regard, the analysis of the validity of the TLG hypothesis in a
group of countries is particularly conducive to achieving a better understanding of the tourism-
economic growth nexus and to identifying possible divergences among countries. In cases in
which tourism enhances growth, it is critical to discernthe key factors underpinning the sustained
link between tourism and economic growth. Conversely, in cases in which the TLG hypothesis
does not hold, it becomes evident that tourism policies and the overall socio-economic
structureof the involved countries require a thorough re-assessment.
The aim of this paper is to investigate the relation between tourism development and
economic growth in the top ten tourist destinations in the world (China, France, Germany, Italy,
Mexico, Russia, Spain, Turkey, the United Kingdom and the United States) using thequantile-on-
quantile (QQ henceforth) methodology. The QQ approach, recently developed by Sim and Zhou
(2015),combines quantile regression and nonparametric estimation techniques and basically
involves regressing the quantile of a variable onto the quantile of another variable. As argued by
Pablo-Romero and Molina (2013), the literature on the tourism-economic growth link has
evolved towards the use of increasingly more sophisticated econometric techniqueswith
anincreasing recognition of the importance of nonlinear relations between tourism and economic
growth. In a similar vein, Wang (2012) noted that a linear framework may oversimplify the
tourism-growth relation and that the link between these variables is indeed complex and
nonlinear in nature. In this context, the QQ analysis emerges as quite auseful method,
enablinganestimation of the effect of the quantiles of tourism growthon the quantiles of
economic growth and providinga comprehensive and precise picture of the overall
interdependence of the variables. By its very nature, the QQ frameworkallows uncovering
4
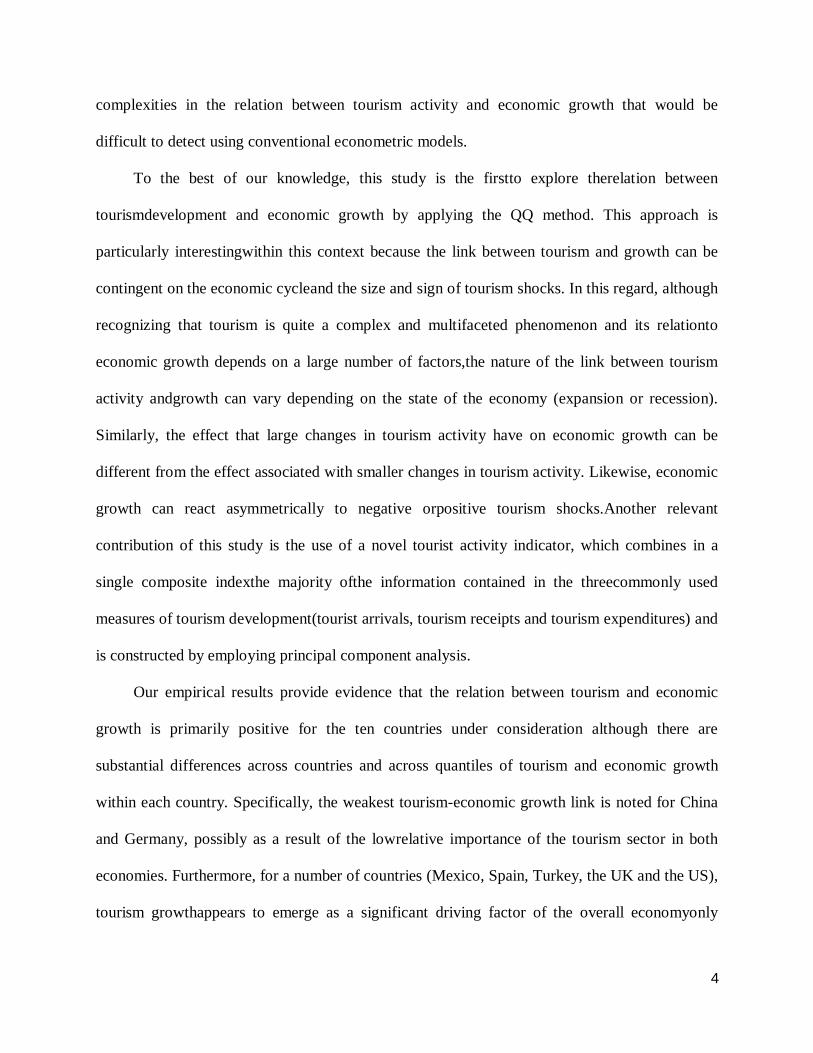
complexities in the relation between tourism activity and economic growth that would be
difficult to detect using conventional econometric models.
To the best of our knowledge, this study is the firstto explore therelation between
tourismdevelopment and economic growth by applying the QQ method. This approach is
particularly interestingwithin this context because the link between tourism and growth can be
contingent on the economic cycleand the size and sign of tourism shocks. In this regard, although
recognizing that tourism is quite a complex and multifaceted phenomenon and its relationto
economic growth depends on a large number of factors,the nature of the link between tourism
activity andgrowth can vary depending on the state of the economy (expansion or recession).
Similarly, the effect that large changes in tourism activity have on economic growth can be
different from the effect associated with smaller changes in tourism activity. Likewise, economic
growth can react asymmetrically to negative orpositive tourism shocks.Another relevant
contribution of this study is the use of a novel tourist activity indicator, which combines in a
single composite indexthe majority ofthe information contained in the threecommonly used
measures of tourism development(tourist arrivals, tourism receipts and tourism expenditures) and
is constructed by employing principal component analysis.
Our empirical results provide evidence that the relation between tourism and economic
growth is primarily positive for the ten countries under consideration although there are
substantial differences across countries and across quantiles of tourism and economic growth
within each country. Specifically, the weakest tourism-economic growth link is noted for China
and Germany, possibly as a result of the lowrelative importance of the tourism sector in both
economies. Furthermore, for a number of countries (Mexico, Spain, Turkey, the UK and the US),
tourism growthappears to emerge as a significant driving factor of the overall economyonly

5
during periods of economic downturn. This latter finding shows the strategic role of the tourism
sector under adverse economic conditions and may have important implicationswhen policy
makers are designingoptimal tourism and economic policies.
The remainderof the paper is organized as follows: Section2 provides an overview of the
previous literature on the nexus between tourism and economic growth. Section3 presents the
data set employed, and Section4 describes the key features of the QQ approach as well as the
model used to investigate the tourism-economic growth link. Section5 reports and discusses the
primary empirical findings of the QQ analysis. Finally, Section6 offers some concluding
remarks.
2. Literature Review
Over the past four decades, a vast amount of literature hasinvestigatedthe relation between
tourism development and economic growth, with a particular focus on countries in which the
tourism sector plays a more prominent role. Specifically, Ghali (1976) was the first to investigate
the nexus between tourism and economic growth from an empirical perspective using the
ordinary least square method, and Balaguer and Cantavella-Jordá (2002) were pioneers in
examiningthe validity of the TLG hypothesis. The results of this line of research are sensitive to
the sample period, model specification, variablesselected,frequency of observations,
methodological approachapplied and country/countries involved, althoughthe majority of studies
support the TLG hypothesis (e.g.,Brida et al., 2008; Gunduz and Hatemi-J, 2005; Nowak and
Sahli, 2007; Tang and Abosedra, 2016; Tang and Tan, 2015).However, a number ofstudies (Lee,
2012; Oh, 2005; Payne and Mervar, 2010; Tang and Jang, 2009)have identified the reverse
effect, that economic development boosts tourism expansion. This hypothesis, called the growth-
6
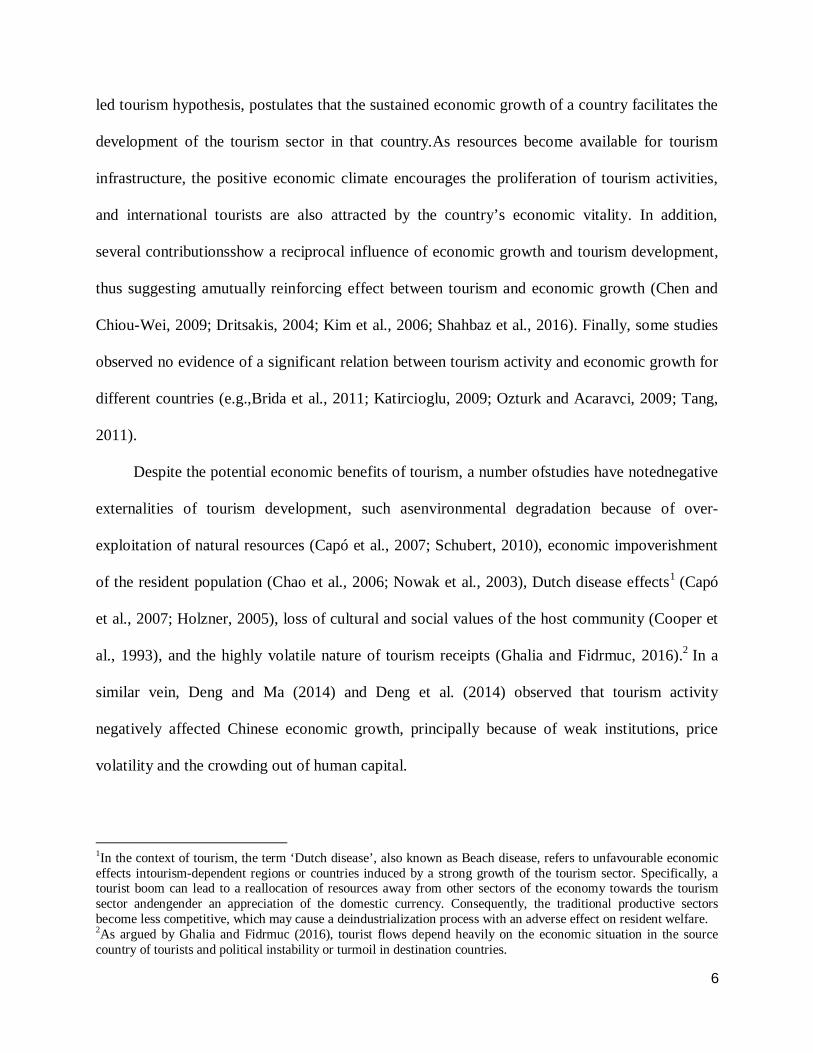
led tourism hypothesis, postulates that the sustained economic growth of a country facilitates the
development of the tourism sector in that country.As resources become available for tourism
infrastructure, the positive economic climate encourages the proliferation of tourism activities,
and international tourists are also attracted by the country’s economic vitality. In addition,
several contributionsshow a reciprocal influence of economic growth and tourism development,
thus suggesting amutually reinforcing effect between tourism and economic growth (Chen and
Chiou-Wei, 2009; Dritsakis, 2004; Kim et al., 2006; Shahbaz et al., 2016). Finally, some studies
observed no evidence of a significant relation between tourism activity and economic growth for
different countries (e.g.,Brida et al., 2011; Katircioglu, 2009; Ozturk and Acaravci, 2009; Tang,
2011).
Despite the potential economic benefits of tourism, a number ofstudies have notednegative
externalities of tourism development, such asenvironmental degradation because of over-
exploitation of natural resources (Capó et al., 2007; Schubert, 2010), economic impoverishment
of the resident population (Chao et al., 2006; Nowak et al., 2003), Dutch disease effects1 (Capó
et al., 2007; Holzner, 2005), loss of cultural and social values of the host community (Cooper et
al., 1993), and the highly volatile nature of tourism receipts (Ghalia and Fidrmuc, 2016).2 In a
similar vein, Deng and Ma (2014) and Deng et al. (2014) observed that tourism activity
negatively affected Chinese economic growth, principally because of weak institutions, price
volatility and the crowding out of human capital.
1In the context of tourism, the term ‘Dutch disease’, also known as Beach disease, refers to unfavourable economic effects intourism-dependent regions or countries induced by a strong growth of the tourism sector. Specifically, a tourist boom can lead to a reallocation of resources away from other sectors of the economy towards the tourism sector andengender an appreciation of the domestic currency. Consequently, the traditional productive sectors become less competitive, which may cause a deindustrialization process with an adverse effect on resident welfare. 2As argued by Ghalia and Fidrmuc (2016), tourist flows depend heavily on the economic situation in the source country of tourists and political instability or turmoil in destination countries.

7
In terms of methodology, Granger causality tests with time series data,primarily within a
vector error correction model framework,are the most widelyemployed technique in this field
(e.g.,Balaguer and Cantavella-Jordá, 2002; Brida et al., 2008; Pavlic et al., 2015; Ridderstaat et
al., 2014; Tang and Tan, 2015). Nevertheless, some recent studies have explored the economic
growth-tourism link using increasingly sophisticated time series methodssuch astime-varying
models (Antonakakis et al., 2015a; Arslanturk et al., 2011; Balcilar et al., 2014), nonlinear
models (Brida et al., 2015; Phiri, 2015; Po and Huang, 2008; Wang, 2012),time-varying copula
functions (Pérez-Rodríguez et al., 2015) and a VAR-basedspillover index approach (Antonakakis
et al., 2015b).Another importantline of researchhas examined the nexus between economic
growth and tourism using panel data techniques for a selected group of countries (Aslan, 2013;
Lee and Chang, 2008;Narayan et al., 2010; Sequeira and Nunes, 2008;Tugcu, 2014).The great
majority of these panel-data-based studies provide evidence supporting the TLG hypothesis.
3. Data description
The dataset in this study comprises a novel indicator of tourism activity as a proxy for the
volume of international tourism and the rate of growth of real Gross Domestic Product (GDP
henceforth) per capita in constant 2005 US dollars as a proxy for economic growth for each of
the world’s top ten countries in terms of tourism receipts (China, France, Germany, Italy,
Mexico, Russia, Spain, Turkey, the UK and the US).Consistent with other studies (Balaguer and
Cantavella-Jordá 2002; Dritsakis 2004; Kumar et al. 2016; Loganathan et al. 2012; Shahbaz et al.
2016), quarterly data areused in this study. The sample period spans from 1990Q1 to 2015Q4,
with a total of 104 quarterly observations.

8
Three key variables havetraditionally been employed in the tourism economics literature
to measure the volume of tourism flows: the total number of international tourist arrivals
(Gunduz and Hatemi-J, 2005; Katircioglu, 2009; Kim et al., 2006; Tang and Abosedra, 2016),
international tourism receipts (Arslanturk et al., 2011; Balaguer and Cantavella-Jordá, 2002;
Chen and Chiou-Wei, 2009; Ridderstaat et al., 2014), and international tourism expenditures
(Aslan, 2016; Cárdenas-García et al., 2015; Song et al., 2010; Tugcu, 2014). However, a major
drawback of these common tourismactivity indicators is that such indicators only show a partial
connection to economic growth. In particular, tourist arrivals indicate the number of international
visitors;international tourism receipts reflect the income side and international tourism
expenditures cover the expense side.However, it is widely accepted that astrong positive
correlation exists amongthese variables because a larger number of tourism arrivals indicates
more expenditures and more receipts. As noted by Zaman et al. (2016), the simultaneous use of
these three tourismindicators in a regression model may cause serious problems of
multicollinearity because of high correlations between these indicators.Acomprehensive
indicator of tourism activity not affected by multicollinearity, constructed by applying Principal
Component Analysis (PCA) to the three above-mentioned standard tourism variables, is utilized
in the present study. Specifically, the new tourism development indicator is a weighted index of
international tourist arrivals, international tourism receipts and international tourism expenditures
derived using PCA. Its primary advantage is that this indicator combines, in a single composite
index,the majority of the relevant information pertinent to the three traditional tourism variables.
Table 1 summarizes the results of the PCA for each of the ten countries under
examination. The two first columns show the eigenvalue corresponding to the first principal
component and the proportion of total variance explained by the first principal component,

9
respectively.The eigenvalue for the first principal component clearly exceeds 1 for all countries,
which indicates the relevance of the first principal component. By contrast, the eigenvalues for
the second and third principal components, although not reported here for the sake of brevity, are
below 1 for all countries. Consequently, following the Kaiser criterion, the second and third
principal components are omitted from the analysis. The importance of the first factor is
confirmed by the considerable proportion of variance in the data that accounted for the first
principal component. Withthe exception only of Mexico, the first principal component alone
explains more than 80% of the total variability for all countries under study and hence it may be
considered a good summary indicator of tourism activity. The factor loadings of the first
principal component are displayed in the intermediate columns of Table 1. Inspection of the
factor loadings reveals that the three standard tourism variables enter the first principal
component with a similar positive weight for virtually all countries. In addition, the last three
columns of Table 1 show the correlation coefficient between the weighted tourism activity
indicator and each of the three traditional tourism variables. As expected, there is a high positive
correlation between the weighted tourism index and the three common tourism indicators for all
countries. In fact, the correlation coefficients are above 0.75 in the vast majority of cases.
The data on the number of arrivals of international tourists, international tourism receipts
in current US dollars and international tourism expenditures in current US dollarswere collected
from the World Tourism Organization (Yearbook of Tourism Statistics, 2016:
http://www2.unwto.org).3 The data on real GDP per capita come from the World Bank’s World
Development Indicators database (CD-ROM, 2016).4
3 International tourism receipts and international tourism expenditures have been converted into real terms by dividing both series by the US exchange rate prevailing in 2005 for each of the top-10 tourist destinations. 4The annual time series data are transformed into quarterly frequency data by applying a quadratic match-sum method, which is particularly appropriate for avoiding the small-sample problem. Furthermore, the quadratic match-
10
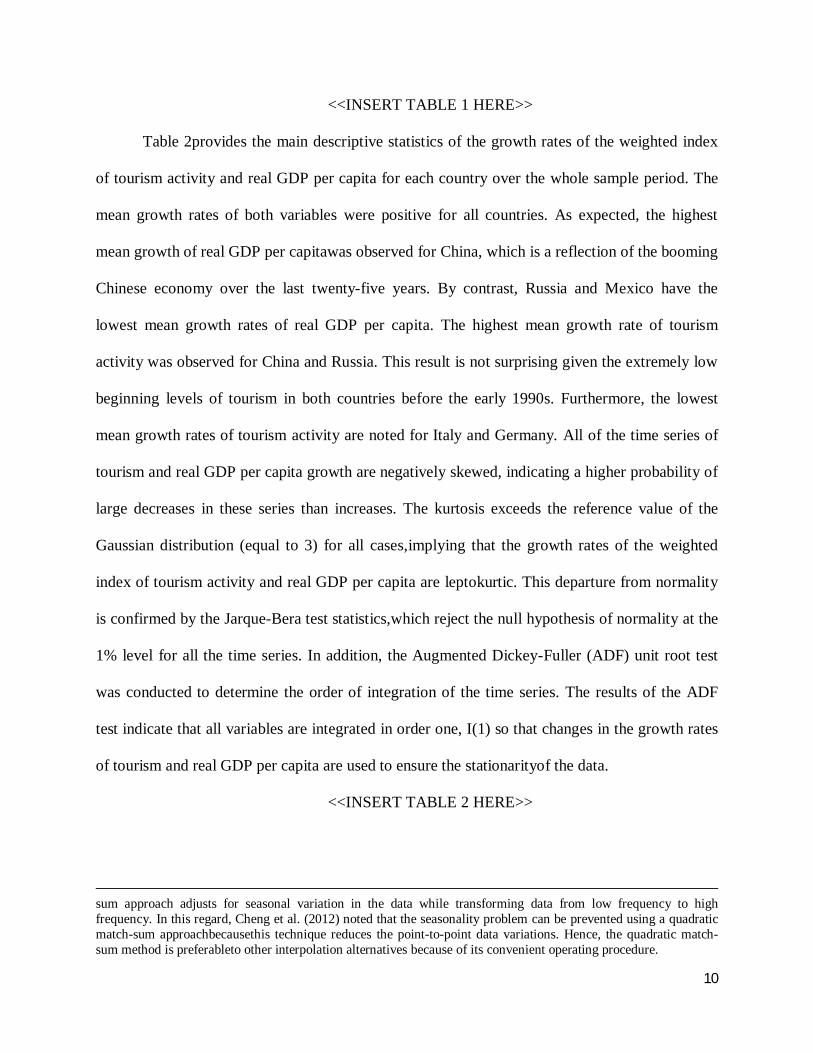
<<INSERT TABLE 1 HERE>>
Table 2provides the main descriptive statistics of the growth rates of the weighted index
of tourism activity and real GDP per capita for each country over the whole sample period. The
mean growth rates of both variables were positive for all countries. As expected, the highest
mean growth of real GDP per capitawas observed for China, which is a reflection of the booming
Chinese economy over the last twenty-five years. By contrast, Russia and Mexico have the
lowest mean growth rates of real GDP per capita. The highest mean growth rate of tourism
activity was observed for China and Russia. This result is not surprising given the extremely low
beginning levels of tourism in both countries before the early 1990s. Furthermore, the lowest
mean growth rates of tourism activity are noted for Italy and Germany. All of the time series of
tourism and real GDP per capita growth are negatively skewed, indicating a higher probability of
large decreases in these series than increases. The kurtosis exceeds the reference value of the
Gaussian distribution (equal to 3) for all cases,implying that the growth rates of the weighted
index of tourism activity and real GDP per capita are leptokurtic. This departure from normality
is confirmed by the Jarque-Bera test statistics,which reject the null hypothesis of normality at the
1% level for all the time series. In addition, the Augmented Dickey-Fuller (ADF) unit root test
was conducted to determine the order of integration of the time series. The results of the ADF
test indicate that all variables are integrated in order one, I(1) so that changes in the growth rates
of tourism and real GDP per capita are used to ensure the stationarityof the data.
<<INSERT TABLE 2 HERE>>
sum approach adjusts for seasonal variation in the data while transforming data from low frequency to high frequency. In this regard, Cheng et al. (2012) noted that the seasonality problem can be prevented using a quadratic match-sum approachbecausethis technique reduces the point-to-point data variations. Hence, the quadratic match-sum method is preferableto other interpolation alternatives because of its convenient operating procedure.

11
4. Methodology
This section briefly describes the key features of the QQ approach (Sim and Zhou 2015)
as well as the model specification used in this study to examine the relation between tourism
activity and economic growth.
The QQ method can be perceived as a generalization of the standard quantile regression
model,which enables one to examine how the quantiles of a variable affect the conditional
quantiles of another variable. The QQ approach is based on the combination of quantile
regression and nonparametric estimation. First, conventional quantile regression is utilized to
estimate the effect of an explanatory variable on the different quantiles of the dependent variable.
The quantile regression methodology developed by Koenker and Bassett (1978) can be regarded
as an extension of the classic linear regression model. Unlike OLS estimation, the quantile
regression analyses the effect of the explanatory variables not only at the centre but also at the
tails of the distribution of the dependent variable, thus allowing a more comprehensive
characterization of the relation between variables. Second, local linear regression is employed to
estimate the local effect of a specific quantile of the explanatory variable on the dependent
variable. The local linear regression introduced by Stone (1977) and Cleveland (1979) avoids the
so-called “curse of dimensionality” problem associated with purely nonparametric models. The
basic idea behind this dimension-reduction technique is to fit a linear regression locally around a
neighbourhood of each data point in the sample, assigning greater weight to closer neighbours.
Therefore, combining these two approaches enablesmodelling the relation between quantiles of
the explanatory variable and quantiles of the dependent variable, providing a greater amount of
information than alternative estimation techniques such as OLS or standard quantile regression.

12
In the framework of the present study, the QQ approach is proposed to investigate the
effect of the quantiles of tourism growth on the quantiles of economic growth of a country. This
approach has its starting point in the following nonparametric quantile regression model:
퐺퐷푃 = 훽 (푇푂푈푅 ) + 푢 (1)
where GDPt represents the real GDP per capita growth of a given country in period t, TOURt
denotes the growth rate of the weighted index of tourism activity in that country in period t, θ is
the θth quantile of the conditional distribution of thegrowth of real GDP per capita and 푢 is a
quantile error term whose conditional θth quantile is equal to zero. 훽 (∙) is an unknown function
because we had no prior information linking tourism and economic growth.
This quantile regression model measures the effect of tourismactivity growth on the
distribution of the growth ofthe real GDP per capita of a country whilst allowing the effect of
tourism growth to vary across different quantiles of real GDP growth. The primary advantage of
this specification is its flexibility because no hypothesis was developed regarding the functional
form of the relation between tourism growth and economic growth. However, a shortcoming of
the quantile regression approach is its ability to capture dependence in its entirety. In this regard,
the quantile regression model does not consider the possibility that the nature of tourism shocks
may also influence the manner in which tourism and economic growth are related. For example,
the effects of large positive tourism shocks can be different from the effects of small positive
tourism shocks. In addition, economic growth can react asymmetrically to negative and positive
tourism shocks.
Then, to analyse the relation between the θth quantile of real GDP per capita growth and
the τth quantile of tourism activity growth, denoted by 푇푂푈푅 , Eq. (1) is examined in the
neighbourhood of 푇푂푈푅 employing local linear regression. Because 훽 (∙) is unknown, this

13
function can be approximated by a first-order Taylor expansion around a quantile 푇푂푈푅 , such
that
훽 (푇푂푈푅 ) ≈ 훽 (푇푂푈푅 ) + 훽 ′(푇푂푈푅 )(푇푂푈푅 − 푇푂푈푅 ) (2)
where훽 ′ is the partial derivative of 훽 (푇푂푈푅 ) with respect to TOUR, also called marginal
effect or response,and is similar in interpretation to the slope coefficient in a linear regression
model.
A prominent feature of Eq. (2) is that the parameters 훽 (푇푂푈푅 ) and 훽 ′(푇푂푈푅 ) are
doubly indexed in θ and τ. Given that 훽 (푇푂푈푅 ) and 훽 ′(푇푂푈푅 ) are functions of θ and
푇푂푈푅 and that푇푂푈푅 is a function of τ, it is clear that 훽 (푇푂푈푅 ) and 훽 ′(푇푂푈푅 ) are both
functions of θ and τ. Additionally, 훽 (푇푂푈푅 ) and 훽 ′(푇푂푈푅 ) can be renamed as
훽 (휃, 휏)and훽 (휃, 휏), respectively. Accordingly, Eq. (2) can be rewritten as
훽 (푇푂푈푅 ) ≈ 훽 (휃, 휏) + 훽 (휃, 휏)(푇푂푈푅 − 푇푂푈푅 ). (3)
By substituting Eq. (3) in Eq. (1), the following equation is obtained:
퐺퐷푃 = 훽 (휃, 휏) + 훽 (휃, 휏)(푇푂푈푅 − 푇푂푈푅 )(∗)
+ 푢 . (4)
As can be seen, the part (*) of Eq. (4) is the θth conditional quantile of real GDP per
capita growth. However, unlike the standard conditional quantile function, this expression
reflects the relation between the θth quantile of real GDP per capita growth and the τth quantile
of tourism activity growth because the parameters 훽 and 훽 are doubly indexed in θ and τ. These
parameters may vary across different θth quantiles of real GDP per capita growth and τth
quantiles of tourism growth.Moreover, at no time a linear relation is assumed between the
quantiles of the variables under study. Therefore, Eq. (4) estimates the overall dependence
14
structure between economic growth and tourism activity growth throughthe dependence
betweentheir respective distributions.
Estimating Eq. (4)requires replacing푇푂푈푅 and 푇푂푈푅 with their estimated counterparts
푇푂푈푅 and 푇푂푈푅 , respectively. The local linear regression estimates of the parameters 푏 and
푏 , which are the estimates of 훽 and 훽 , are obtained by solving the following minimization
problem:
min , ∑ 휌 퐺퐷푃 − 푏 − 푏 푇푂푈푅 − 푇푂푈푅 퐾 ( ) (5)
where휌 (푢) is the quantile loss function, defined as 휌 (푢) = 푢 휃 − 퐼(푢 < 0) , Ibeingthe usual
indicator function. 퐾(∙) denotes the kernel function and h is the bandwidth parameter of the
kernel.
The Gaussian kernel, which is one of the most popular kernel functions in economic and
financial applications because of its computational simplicity and efficiency, is used in this study
to weight the observations in the neighbourhood of 푇푂푈푅 . The Gaussian kernel is symmetrical
around zero and assigns low weights to observations farther away. Specifically, in our analysis,
these weights are inversely related to the distance between the empirical distribution function of
푇푂푈푅 ,denoted by 퐹 푇푂푈푅 = ∑ 퐼(푇푂푈푅 < 푇푂푈푅 ), and the value of the distribution
function that corresponds to the quantile 푇푂푈푅 , denoted by τ.
The choice of the bandwidth is critical when using nonparametricestimation techniques.
The bandwidth determines the size of the neighbourhood surrounding the target point and,
therefore, the bandwidth controls the smoothness of the resulting estimate. A larger
bandwidthindicates a greater potential for bias in estimateswhereas a smaller bandwidth can lead
to estimates with greater variance. Thus, a bandwidth that strikes a balance between bias and

15
variance must be selected. Following Sim and Zhou (2015), a bandwidth parameter ℎ = 0.05
was employed in this study.5
5. Empirical results
5.1. Estimates of the QQ approach
This sectionpresents the primary empirical results of the QQ analysisof tourism growth
and real GDP per capita growth for the world’s top ten tourist destinations. Figure 1 (a-j)
displays the estimates of the slope coefficient 훽 (휃, 휏), which captures the effect of the τth
quantile of tourism growth on the θth quantile of growth inreal GDP per capita,at different values
of θ and τfor the ten countries under consideration.
<<INSERT FIGURE 1 HERE>>
Several interesting results emerge from the graphsin Figure 1.First, the relation between
tourismgrowth and economic growth is positive for most combinations of quantiles of both
variables inall countries. This findingis consistent with the positive association between tourism
development and economic growththat has beenextensively documented in prior literature for a
wide range of countries and can be justified by the multiple beneficial effects of tourism on the
economy of a country (e.g.,Balaguer and Cantavella-Jordá, 2002; Chen and Chiou-Wei, 2009;
Cortés-Jiménez and Pulina, 2010; Gunduz and Hatemi-J, 2005; Ridderstaat et al., 2014).Second,
despite the prevailing positive connection,there is a considerable heterogeneity across countries
regarding the tourism-economic growth nexus. This result may be attributed to the significant
differences across countries in terms of the relative importance of tourism in their overall
5A number of alternative values of the bandwidth have also been considered. However, the results of the estimation remain qualitatively identical.

16
economies, the size and openness of each economy and itsproduction capacity constraints,the
role and effectiveness of local businesses in supporting tourism sectordevelopment and the
possible negative externalities caused by tourism in some countries.It is also worth mentioning
that ignoring such heterogeneity across countries could lead to inaccurate inferences. Third,
within each country,sizeable variations of the slope coefficient are observed across different
quantiles of tourism growth and real GDP per capita growth. This finding suggests that the link
between tourism development and economic growth is not uniform across quantiles, but thatthis
relationdepends on both the sign and size of tourism shocks in a country and the specific phase
of the economic cycle that a country is experiencing. In addition, the most pronounced (in
absolute value) relation between tourism and the overall economy is observed for most countries
in extreme circumstances of tourism and economic growth, that is, when considering the lowest
and highest quantiles of both variables.
Examining the results by country, the weakest connection between international tourism
growth and real GDP per capita growth was observed for China.The tourism-economic growth
linktakes quite small or even negative values for the vast majority of combinations of quantiles
of tourism and real GDP growth, implying that there is apparently no significant relation
between tourism activity and economic development in China. This result may be explained by
the extremely limited weight of tourism on the Chinese economy and is consistent with the
empirical evidence previously reported for China by, among others, Chiang (2012), Deng and
Ma (2014), He and Zheng (2011)and Li et al. (2015).In this regard, according to data of the
World Travel & Tourism Council (WTTC) Economic Impact Report, the direct contribution of
tourism to the Chinese economy in 2014 was 2.6% of the total Chinese GDP.In fact, a relatively
pronounced relation, with a negative sign, was onlyobserved in the area that combines the lowest

17
quantiles of tourism activity growth (0.05-0.10) with the intermediate to upper quantiles of real
GDP capita growth (0.60-0.75). This finding suggests that sharp declines in international
tourism, which are represented by the lowest quantiles of tourism growth, appear to have a
relevantdownward effect on the overall Chineseeconomy,primarily in times of buoyant economic
growth, which is represented by the intermediate to upper quantiles of economic growth.
Thelink between tourism developmentand economic growth is equallyweak for Germany.
More precisely, the tourism-economic growthrelationhas extremely low values for most
combinations of quantiles of tourism and real GDP per capita growthin Germany, which
indicates that,in general, tourism cannotbe regarded as a major driver of the German economy.
This minor role of the German tourism industry is not surprising if we consider that Germany,
which is the leading European economy and the second largest exporter worldwide,is basically
specialized in non-tourism-related and technologically advanced industriessuch as automobiles,
chemicals, electrical equipment and machinery (Antonakakis et al., 2015b).In fact, according to
the WTTC Economic Impact Report, in 2014, the direct contribution of tourism to the German
economy was 3.8% of the total German GDP. In the case of Germany, the mainexception to the
generally poor tourism-economic growth nexus islocated in the area that combines the lowest
quantiles of tourism growth (0.05-0.15) with the lowest quantiles of real GDP per capita growth
(0.05-0.15). The relatively high positive relation observed in this region can be interpreted to
indicate that sharp falls in tourismappear to contribute to the aggravation of the German
economic situation duringperiods of deep economic downturn.
Notably, France and Italy share some commonalities regarding the association between
tourismdevelopment and economic growth. Inboth countries, the tourism-economic growth
connection is positive for the great majority of combinations of quantiles. However, the intensity
18
of the relation is in general not extremely high, which suggests that the economies of France and
Italy are not excessively dependent on the tourism industry. In particular, the most accentuated
positive connection for both countriesis in areas combininglow quantiles of tourism growth
(0.15-0.30) with the lowest quantiles of real GDP per capita growth (0.05-0.15). A possible
explanation for this result is that significant drops in inbound tourism inFrance and Italy appear
to have led to further deterioration of theirrespective economiesduring a strong economic
recession.
Mexico, the UK and, to a lesser extent, Spain exhibit a similar pattern of the association
between tourism development and economic activity. The tourism-economic growth link is
positive for Mexico and the UK regardless of the combinations of quantiles of tourism and real
GDP per capita growth, whereas for Spain thislink shows small negative values in some regions
of the sample. The most intense relation between tourism and the overall economy is positive for
these three countries and is identified in the area that combines the highest quantiles of tourism
(0.90-0.95 for Mexico and the UK and 0.70-0.80 for Spain) with the lowest quantiles of real
GDP growth per capita (0.05-0.15 for the three countries). This particularly pronounced
positiveconnection in times of strong tourism growth and deep economic downturn suggests that
the tourism sector acts as a relevant engine of economic growth for these countries during
periods characterized by a booming tourism sector and poor general economic performance.
Bycontrast, the tourism-economic growth nexus is rather weak in the areas that combine the
highest quantiles of tourism growth with the highest quantiles of real GDP per capita growth,
indicating that the tourism industry loses its status of key growth driver in times of a buoyant
economy. In any case, it is notable that the strongest connection between tourism activity and the
overall economy was observed for Mexico, reflecting the heavily tourism-dependent nature of

19
the Mexican economy. The positive effect of tourism on economic growth in Mexico, the UK
and Spain is consistent with the evidence previously reported by Brida et al. (2008), Santana-
Gallego et al. (2010) and Cortés-Jiménez and Pulina (2010), respectively.
The connection between inbound tourism and the overall Russianeconomy is also
predominantly positive for the great majority of combinations of quantiles of tourism and real
GDPper capita growth. In this case, the strongest positive relationis manifested in the regionthat
combines thelowest quantiles of tourism growth (0.05-0.10) and theintermediate to upper
quantiles (0.45-0.65) of real GDP per capita growth. This finding suggests thatRussian economic
developmentappears to have an encouraging effect on the tourism sectorprincipally during
periods of healthy economic growth and low or negative growth in tourism activity. A possible
explanation for this phenomenon is that economic expansion and the subsequent availability of
resources, investments and infrastructure may generate a positive economic climate that favours
tourism activities in Russia. This singular nature of the tourism-economic growth nexus may also
be related to the fact that the Russian tourism industry remains in its infancy. In fact,the
deregulation of tourism in Russia began in the 1990s, after the collapse of the Communist
regime.
In the case of Turkey, a positiverelation between tourismand economic growth was also
consistently observed for most combinations of quantiles of tourism and real GDP per capita
growth. The most pronounced positive tourism-economic growth link was found in the area
combining the intermediate to upper quantiles of tourism growth (0.50-0.65) with the lowest
quantiles of real GDP per capita growth (0.05-0.10). This result indicates that the effect of
tourism on Turkish economic growthis particularly beneficial in periods of robust growth in the
tourism sector and extremely adverse conditions in the overall Turkish economy. However, a

20
strong positive association betweentourism activity and economic development was also noted in
the area that combines the highest quantiles of tourism growth (0.80-0.90) with thehighest
quantiles of economic growth (0.90-0.95), suggesting that tourism also has a significant positive
effect on the Turkish economy in times of a booming tourism industry and a booming economy.
This empirical evidence is consistent with the findings ofArslanturk et al. (2011), Aslan (2016),
Katircioglu (2009) and Ozturk and Acaravci (2009), who demonstrated that the relation between
tourism and economic growth in Turkey is not stable over time, but depends on general business
conditions and major economic events.
Finally, the tourism-economic growth nexus for the US was also prevalently positive for
most combinations of quantiles of tourism and real GDP per capita growth. The highest
positiveconnection betweentourism growth and the US general economywas detected in the
regionthat combines the intermediate quantiles of tourism growth (0.40-0.55) with the lowest
quantiles of real GDP growth (0.05-0.10). However, a relatively strong positive relationwas also
observed in the region combining the highest quantiles of tourism growth (0.85-0.90) with the
lowest quantiles of real GDP growth (0.05-0.10).This result indicates that inboundtourism
appears to have a particularly beneficial effect on the US economy during times ofsharp
economic downturn and vigorous growth of the tourism sector.By contrast, the weakest relation
was found in the region combining the lowest quantiles of tourism growth (0.05-0.15) with the
highest quantiles of real GDP growth (0.85-0.95), indicating that in times of economic boom and
low tourism growth, the tourism-economic growth link is quite limited. Accordingly, it appears
clear that tourism activity only has a significant influence on US economic activity during a
strong economic recession. This evidenceis consistent with the results of Tang and Jang (2009),
in the sense that,in general, the US tourism industry is not a key driving factor of the overall US
21
economy, which seems reasonable considering that the US is not a particularly tourism-oriented
economy.
5.2. Checking the validity of the QQ method
The QQ approach can be viewed as a method that decomposes the estimates of the
standard quantile regression model, enabling specific estimates to be obtained for different
quantiles of the explanatory variable. In the framework of the present study, the quantile
regression model is based onregressing the θth quantile of real GDP per capita growth on
tourism growth; hence the quantile regression parameters are only indexed by θ. However, as
stated earlier, the QQ analysis regresses the θth quantile of growth of real GDP per capita on the
τth quantile of tourism activity growth,and, hence, its parameters will be indexed by both θ and τ.
Thus, the QQ approach contains more disaggregated information regarding the tourism-
economic growth link than the quantile regression model asthis relation is perceived by the QQ
methodto be potentially heterogeneous across the quantiles of tourism activity growth.
Given this property of decomposition inherent in the QQ approach, it is possible to use
the QQ estimates to recover the estimates of the standard quantile regression. Specifically, the
quantile regression parameters, which are only indexed by θ, can be generated by averaging the
QQ parameters along τ. For example, the slope coefficient of the quantile regression model,
which measures the effect of tourism growth on the distribution of real GDP per capita growth
and is denoted by 훾 (휃), can be obtained as follows:
훾 (휃) ≡ 훽 (휃) = ∑ 훽 (휃, 휏) (6)
where S=19 is the number of quantiles 휏 = [0.05, 0.10, … , 0.95] considered.

22
In this context, a simple manner of checking the validity of the QQ approach is to
compare the estimated quantile regression parameters with the τ-averaged QQ parameters. Figure
2 plots the quantile regression and averagedQQ estimates of the slope coefficientthat measures
the effect of growth in tourism activity on real GDP per capita growth for all the countries under
study.
<<INSERT FIGURE 2 HERE>>
The graphs in Figure 2 (a-j) reveal that the averaged QQ estimates of the slope coefficient
are quite similar to the quantile regression estimates for all countries regardless of the quantile
considered. This graphical evidence provides a simple validation of the QQ methodology by
showing that the primary features of the quantile regression model can be recovered by
summarizing the more detailed information contained in the QQ estimates.Therefore, Figure 2
largely confirmsthe results of the QQ analysis reported earlier. First, the effect of tourismgrowth
on economic growth is consistently positive across quantiles for all countries. In fact, a negative
relation between tourism development and the overall economic performance was only found for
some quantiles of real GDP per capita growth in China, Germany and Italy. Second, a notable
heterogeneity across countries and across quantiles within each country in terms of the link
between tourism growth and real GDP growthwas also observed. Specifically, the largest effect
of tourism growth on the overall economy of most countrieswas identified at the lowestquantiles
of their respective distributionsof real GDP per capita growth. This finding corroborates the
argument that the influence of tourism oneconomic growth tends to be stronger in an
environment ofeconomic downturn, suggesting that the tourism sector becomes an important
engine of economic growth primarily during periods of economic contraction.

23
6. Concluding remarks
This study investigates the empirical validity of the tourism-led growth hypothesis for the
top ten tourist destinationsworldwide over the period 1990-2015 using the QQ (quantile-on-
quantile) approach recently developed by Sim and Zhou (2015). The QQ methodology allows
one to estimate how the quantiles of tourism growth affect the quantiles of economic growth,
thus providinga more precise description of the overall dependence structure between tourism
activity and economic growth compared with conventional techniques such as OLS or quantile
regression.
Our empirical results show that the relation between tourismdevelopment and economic
growth is primarily positive for all countries, although there are wide differences across countries
and across different quantiles of tourism and real GDP per capita growth within each country.
The heterogeneity among countries in terms of the tourism-economic growth nexus may be
attributed to differences in the relative weight of the tourism industryin the overall economy of
each country, the size and openness of each economy and itsproduction capacity constraints,the
relevance of local businesses in the tourism industry of each country and the possible negative
externalities caused by tourism growth in some countries. In particular, the weakest
relationbetween tourism and economic growth was noted for China and Germany,most
likelybecause of the scant directcontribution of tourismto the respective economies of those two
countries. Furthermore, the marked divergence across quantiles of tourism and economic growth
indicates that the tourism-economic growth link is not uniform, but depends on both the phase of
the economic cycle and the sign and size of tourism shocks. In this respect, for a wide range of
countries, such as France, Italy, Mexico, Spain, Turkey, the UK and the US, the most
24
pronounced link between tourism activity and economic growth was observed only during
periods of deep economic downturn.
The empirical evidence presented in this study may have important implications for
policy makers, who should consider the specific phase of the economic cycle when designing
their tourism policies.Specifically, tourism-enhancing policies may be particularly beneficial to
the general economy of many countries during periods of economic downturn. Hence, the
tourism sector may play a strategic role in stimulating economic recovery. In any case, this study
can be regarded as a first attempt to analyse the link between tourism and economic growth
depending on the overall economic conditions and the particular conditions prevailing in the
tourism sector. Therefore, future research on the tourism-economic growth nexus under different
scenarios of economic and tourism growth appears necessary to shed more light on this issue.

25
References
Antonakakis, N., Dragouni, M. and Filis, G. (2015a). Tourism and growth: The times they are a-
changing. Annals of Tourism Research, 50, 165-169.
Antonakakis, N., Dragouni, M. and Filis, G. (2015b). How strong is the linkage between tourism
and economic growth in Europe. Economic Modelling, 44, 142-155.
Arslanturk, Y., Balcilar, M. and Ozdemir, Z. A. (2011). Time-varying linkages between tourism
receipts and economic growth in a small open economy. Economic Modelling, 28, 664–671.
Aslan, A. (2013). Tourism development and economic growth in the Mediterranean countries:
Evidence from panel Granger causality tests. Current issues in Tourism, 17, 363-372.
Aslan, A. (2016). Does tourism cause growth? Evidence from Turkey. Current Issues in
Tourism, 19, 1176-1184.
Balaguer, J. and Cantavella-Jordá, M.(2002). Tourism as a long-run economic growth factor: the
Spanish case. Applied Economics, 34, 877-884.
Balcilar, M., van Eyden, R., Inglesi-Lotz, R. and Gupta, R. (2014). Time-varying linkages
between tourism receipts and economic growth in South-Africa. Applied Economics, 46,
4381-4398.
Brida, J.G., Lanzilotta, B., Pereyra, J. S. and Pizzolon, F. (2015). A nonlinear approach to the
tourism-led growth hypothesis: The case of the MERCOSUR. Current Issues in Tourism, 18,
647-666.
Brida, J.G., Punzo, L. F.and Risso, W. A. (2011). Tourism as a factor of growth: The case of
Brazil. Tourism Economics, 17, 1375-1386.
Brida, J.G., Sánchez, E.J. and Risso, W. A. (2008). Tourism’s impact on long-run Mexican
economic growth. Economics Bulletin, 3, 1-8.

26
Capó, J., Riera, A. and Rosselló, J. (2007). Dutch disease in tourism economies: Evidence from
the Balearics and the Canary Islands.Journal of Sustainable Tourism, 15, 615-627.
Cárdenas-García, P. J., Sánchez-Rivero, M. and Pulido-Fernández, J. I. (2015). Does tourism
growth influence economic development? Journal of Travel Research, 54, 206-221.
Chao, C.-C., Hazari, B. R., Laffargue, J.-P. Sgro, P. M. and Yu, E. S. H. (2006). Tourism, Dutch
disease and welfare in an open dynamic economy. The Japanese Economic Review, 57, 501-
515.
Chen, C-F. and Chiou-Wei, S. Z. (2009). Tourism expansion, tourism uncertainty and economic
growth: New evidence from Taiwan and Korea. Tourism Management, 30, 812–818.
Cheng, M., Chung, L., Tam, C-S., Yuen, R., Chan, S. and Yu, I.-W. (2012). Tracking the Hong
Kong economy. Hong Kong Monetary Authority, Occasional Paper 03/2012.
Chiang, M. H. (2012). The changing role of tourism in China’s economy. Journal of China
Tourism Research, 8, 207-223
Cleveland, W. S. (1979). Robust locally weighted regression and smoothing scatterplots. Journal
of the American Statistical Association, 74, 829-836.
Cooper, C. H., Gilbert, D., Fletcher, J. and Wanhill, S. (1993). Tourism: principles and practice
[Second ed.]. New York: Addison Wesley Longman.
Cortés-Jimenez, I. and Pulina, M. (2010). Inbound tourism and long-run economic growth.
Current Issues in Tourism, 13, 61-74.
Deng, T. and Ma, M. (2014). Resource curse in tourism economies? an investigation of China’s
world cultural and natural heritage sites. Asia Pacific Journal of Tourism Research, 19, 809-
822.

27
Deng, T., Ma, M. and Cao, J. (2014). Tourism resource development and long term economic
growth: a resource curse hypothesis approach. Tourism Economics, 20, 923–938.
Dritsakis, N.(2004). Tourism as a long-run economic growth factor: An empirical investigation
for Greece using causality analysis. Tourism Economics, 10, 305–316.
Ghali, M. (1976). Tourism and economic growth: An empirical study. Economic Development
and Cultural Change, 24, 527-538.
Ghalia, T. and Fidrmuc, J. (2016). The curse of tourism? Journal of Hospitality & Tourism, DOI:
10.1177/1096348015619414.
Gunduz, L. and Hatemi-J, A. (2005). Is the Tourism-led Growth Hypothesis Valid for Turkey?.
Applied Economics Letters, 12, 499-504.
He, L. H. and Zheng, X. G. (2011). Empirical analysis on the relationship between tourism
development and economic growth in Sichuan. Journal of Agricultural Science, 3, 212-217.
Holzner, M. (2005). Fear of Croatian disease: is there a danger of a Dutch disease effect with
respect to a boom in the tourism sector in Croatia in the long run—“The Croatian case”
Doctoral thesis WU Vienna University of Economics and Business.
Katircioglu, S. T. (2009). Revisiting the tourism-led-growth hypothesis for Turkey using the
bounds test and Johansen approach for cointegration. Tourism Management, 30, 17–20.
Kim, H. J., Chen, M. H. and Jang, S. C. (2006). Tourism expansion and economic development:
the case of Taiwan. Tourism Management, 27, 925–933.
Koenker, R. and Bassett, G.J. (1978). Regression quantiles. Econometrica, 46, 33-50.
Kumar, R. R., Stauvermann, P. J., Patel, A., Kumar, N. and Prasad, S. (2016). Exploring the
Nexus Between Tourism and Output in Cook Islands: An ARDL Bounds Approach. Social
Indicators Research, 128, 1085-1101.

28
Loganathan, N., Subramaniam, T. andKogid, M. (2012). Is' Malaysia Truly Asia'? Forecasting
tourism demand from ASEAN using SARIMA approach. Tourismos, 7, 367-381.
Lee, C. G. (2012). Tourism, trade, and income: evidence from Singapore. Anatolia: An
International Journal of Tourism and Hospitality Research,23, 348–358.
Lee, C.-C. and Chang, C.-P. (2008). Tourism development and economic growth: a closer look
at panels. Tourism Management, 29, 180–192.
Li, H., Goh, C. and Zhang, Z. (2015). Is the Growth of Tourism-specialised Economies
Sustainable? A Case Study of Sanya and Zhangjiajie in China. Journal of China Tourism
Research, 11, 35-52.
Narayan, P. K., Narayan, S., Prasad, A. and Prasad, B. C. (2010). Tourism and economic growth:
A panel data analysis for Pacific Island countries. Tourism Economics, 16, 169-183.
Nowak, J.-J. and Sahli, P. (2007). Coastal tourism and “Dutch disease” in a small island
economy. Tourism Economics, 13, 49-65.
Nowak, J.-J., Sahli, P. and Sgro, P. (2003). Tourism, trade and domestic welfare. Pacific
Economic Review, 8, 245-258.
Oh, C. K. (2005). The contribution of tourism development to economic growth in the Korean
economy. Tourism Management, 26, 39–44.
Ozturk, I. and Acaravci, A. (2009). On the causality between tourism growth and economic
growth: empirical evidence from Turkey. Transylvanian Review of Administrative Sciences,
25, 73-81.
Pablo-Romero, M. and Molina, J. A. (2013). Tourism and economic growth: A review of
empirical literature. Tourism Management Perspectives, 8, 28-41.

29
Pavlic, I., Svilokos, T. and Tolic, M. S. (2015). Tourism, real effective exchange rate and
economic growth: empirical evidence for Croatia. International Journal of Tourism
Research, 17, 282-289.
Payne, J. E. andMervar, A. (2010). The tourism–growth nexus in Croatia. TourismEconomics,
16, 1089–1094.
Pérez-Rodríguez, J.V., Ledesma-Rodríguez, F. and Santana-Gallego, M. (2015). Testing
dependence between GDP and tourism’s growth rates. Tourism Management, 48, 268-282.
Phiri, A. (2015). Tourism and economic growth in South Africa: Evidence from linear and
nonlinear cointegration frameworks. MPRA Paper No. 65000.
Po, W.-C. and Huang, B.-N. (2008). Tourism development and economic growth-A nonlinear
approach. Physica A: Statistical Mechanics and its Applications, 387, 5535-5542.
Ridderstaat, J., Croes, R. and Nijkamp, P. (2014). Tourism and Long-run Economic Growth in
Aruba. International Journal of Tourism Research, 16, 472–487.
Santana-Gallego, M., Ledesma-Rodríguez, F., Pérez-Rodríguez, J. V. and Cortés-Jiménez, I.
(2010). Does a common currency promote countries’ growth via trade and tourism? The
World Economy, 33, 1811-1835.
Schubert, S. F. (2010). Coping with externalities in tourism: A dynamic optimal taxation
approach. Tourism Economics, 16, 321-343.
Sequeira, T. N, and Nunes, P. M. (2008). Does tourism influence economic growth? A dynamic
panel data approach. Applied Economics, 40, 2431-2441.
Shahbaz, M., Kumar, R. R., Ivanov, S. and Loganathan, N. (2016). The nexus between Tourism
demand and output per capita, with the relative importance of trade openness and financial
30
development: A study of Malaysia. Tourism Economics,
DOI:https://doi.org/10.5367/te.2015.0505.
Sim, N. and Zhou, H., 2015. Oil prices, US stock return, and the dependence between their
quantiles. Journal of Banking and Finance, 55, 1-8.
Song, H., Li, G., Witt, S. F. and Fei, B. (2010). Tourism demand modelling and forecasting: how
should demand be measured? Tourism Economics, 16, 63-81.
Stone, C. J. (1977). Consistent nonparametric regression. The Annals of Statistics, 5, 595-620.
Tang, C.F. (2011). Is the tourism-led growth hypothesis valid for Malaysia? A view from
disaggregated tourism markets.International Journal of Tourism Research, 13, 97-101.
Tang, C.F. and Abosedra, S. (2016). Tourism and growth in Lebanon: new evidence from
bootstrap simulation and rolling causality approaches. Empirical Economics, 50, 679-696.
Tang, C. H. and Jang, S. (2009). The tourism-economy causality in the United States: A sub-
industry level examination. Tourism Management, 30, 553-558.
Tang, C. F. and Tan, E. C. (2015). Does tourism effectively stimulate Malaysia’s economic
growth? Tourism Management, 46, 158-163.
Tugcu, C. T. (2014). Tourism and the economic growth nexus revisited: A panel causality
analysis for the case of the Mediterranean region. Tourism Management, 42, 207-212.
Wang, Y.-S. (2012). Threshold effects on development of tourism and economic growth.
Tourism Economics, 18, 1135-1141.
Zaman, K., Shahbaz, M., Loganathan, N. and Raza, S. A. (2016). Tourism development, energy
consumption and Environmental Kuznets Curve: Trivariate analysis in the panel of
developed and developing countries. Tourism Management, 54, 275-283.

31
Table 1:PCA results for the weighted tourism activity index
Country Eigenvalue PC1
Proportion explained by PC1
Factor loadings of PC1 Correlation with weighted tourism
index TOARVL TORREC TOREXP TOARVL TORREC TOREXP
China 2.678 0.893 0.576 0.608 0.546 0.777 0.959 0.685 France 2.436 0.812 0.520 0.634 0.572 0.766 0.996 0.895 Germany 2.843 0.948 0.572 0.590 0.570 0.909 0.976 0.991 Italy 2.524 0.841 0.545 0.569 0.616 0.680 0.946 0.920 Mexico 2.277 0.759 0.444 0.618 0.648 0.521 0.962 0.980 Russia 2.627 0.876 0.550 0.603 0.577 0.680 0.925 0.986 Spain 2.802 0.934 0.560 0.588 0.583 0.820 0.981 0.992 Turkey 2.929 0.976 0.580 0.580 0.572 0.966 0.967 0.981 UK 2.796 0.932 0.591 0.574 0.567 0.881 0.773 0.989 US 2.861 0.954 0.577 0.586 0.569 0.850 0.921 0.980
Note: This table summarizes the results of the principal component analysis (PCA) conducted to derive the weighted tourism activity index for the top ten tourist countries worldwide in terms of tourism receipts from1990-2015 (a total of 104 quarterly observations). PC1 denotes the first principal component of the three standard tourism variables (tourist arrivals, tourism receipts and tourism expenditures). The numbers shown include the eigenvalue corresponding to the PC1 for each country, the proportion of total variance accounting for the PC1, the factor loadings of the PC1 and the correlation between the weighted tourism index and each of the three traditional tourism indicators. PTOARVL, TORREC and TOREXPindicatethenumber of tourist arrivals, tourism receipts and tourism expenditures, respectively.

32
Table 2: Descriptive statistics of the growth rates of the weighted index of tourism activity and real GDP per capita
Mean Min. Max. Std. Dev. Skewness Kurtosis J-B Stats. ADF
Panel A: GDP per capita growth rate China 0.0210 -0.0044 0.0414 0.0068 -0.5148 5.3473 28.198*** -3.751*** France 0.0079 -0.0733 0.0382 0.0148 -1.7139 11.0429 321.67*** -4.521*** Germany 0.0034 -0.0388 0.0268 0.0069 -1.9626 16.4552 843.10*** -4.536*** Italy 0.0039 -0.0331 0.0171 0.0065 -1.3821 8.6459 169.59*** -3.953*** Mexico 0.0027 -0.0527 0.0268 0.0100 -2.1609 14.3107 629.208*** -4.686*** Russia 0.0025 -0.0644 0.0381 0.0195 -1.1444 4.3294 30.703*** -3.696*** Spain 0.0037 -0.0237 0.0141 0.0060 -1.1331 5.3179 44.3290*** -3.222** Turkey 0.0060 0.0040 0.0008 0.0010 -0.0037 1.6939 7.3127** -4.831*** UK 0.0038 -0.0271 0.0162 0.0055 -2.1360 11.4721 386.37*** -3.629*** US 0.0033 -0.0211 0.0140 0.0049 -1.6338 8.2838 165.63*** -4.355*** Panel B: Tourism activity growth rate China 0.0156 -0.1386 0.1871 0.0336 -0.1990 13.4484 460.08*** -4.640*** France 0.0100 -0.1058 0.0898 0.0241 -1.1696 9.8632 221.25*** -4.768*** Germany 0.0052 -0.0769 0.0604 0.0178 -0.4328 7.0402 71.848*** -4.191*** Italy 0.0026 -0.0735 0.0495 0.0162 -0.4795 7.5003 89.101*** -4.342*** Mexico 0.0101 -0.1046 0.0704 0.0182 -2.4470 18.2869 1084.2*** -4.745*** Russia 0.0132 -0.1294 0.0919 0.0347 -1.3364 6.9494 95.706*** -4.205*** Spain 0.0094 -0.1140 0.0711 0.0214 -1.7932 13.4594 514.51*** -4.624*** Turkey 0.0093 -0.1075 0.0933 0.0227 -0.8524 11.8460 341.54*** -4.703*** UK 0.0080 -0.1367 0.0622 0.0224 -3.0367 19.5789 1311.9*** -4.137*** US 0.0069 -0.0957 0.0616 0.0178 -1.8728 14.5856 623.91*** -4.708***
Note: This table reports the primary descriptive statistics of the quarterly growth rates of the weighted index of tourism activity and real GDP per capita of the top ten countries worldwide in terms of tourism receipts from 1990-2015 (a total of 104 quarterly observations). Std. Dev. and J-B stand for standard deviations and statistics of the Jarque-Bera test for normality, respectively. ADF denotes the Augmented Dickey-Fuller unit root test. *** indicates rejection of null hypothesis of normality at a 1% level of significance.

33
Figure 1:Quantile-on-Quantile (QQ) estimates of the slope coefficient, 훽 (휃, 휏)
a). China b). France
c). Germany d). Italy
e). Mexico f). Russia

34
g). Spain h). Turkey
i). UK j). US
Note: These graphs show the estimates of the slope coefficient훽 (휃, 휏) in the z-axis against the quantiles of growth of GDP per capita (θ) in the x-axis and the quantiles of tourism growth (τ) in the y-axis.

35
Figure 2: Comparison of Quantile Regression and QQ estimates
a). China b). France
c). Germany d). Italy
e). Mexico f). Russia
-0.2
-0.15
-0.1
-0.05
0
0.05
0.1
0.05 0.2 0.35 0.5 0.65 0.8 0.95Quantile of growth of GDP per capita (θ)
QRQQ
0
0.1
0.2
0.3
0.4
0.5
0.6
0.05 0.2 0.35 0.5 0.65 0.8 0.95Quantile of growth of GDP per capita (θ)
QRQQ
-0.3
-0.2
-0.1
0
0.1
0.2
0.3
0.4
0.5
0.6
0.7
0.05 0.2 0.35 0.5 0.65 0.8 0.95Quantile of growth of GDP per capita (θ)
QRQQ
-0.6
-0.4
-0.2
0
0.2
0.4
0.6
0.8
1
0.05 0.2 0.35 0.5 0.65 0.8 0.95Quantile of growth of GDP per capita (θ)
QRQQ
0
0.2
0.4
0.6
0.8
1
1.2
0.05 0.2 0.35 0.5 0.65 0.8 0.95Quantile of growth of GDP per capita (θ)
QRQQ
0
0.2
0.4
0.6
0.8
1
1.2
1.4
1.6
0.05 0.2 0.35 0.5 0.65 0.8 0.95Quantile of growth of GDP per capita (θ)
QRQQ

36
g). Spain h). Turkey
i). UK j). USA Note: These graphs display the estimates of the standard quantile regression parameters, denoted by QR (continuous black line), and the averaged QQ parameters, denoted by QQ (dashed black line), at different quantiles of real GDP per capita growth for all countries examined.
-0.3
-0.2
-0.1
0
0.1
0.2
0.3
0.4
0.5
0.6
0.7
0.05 0.2 0.35 0.5 0.65 0.8 0.95Quantile of growth of GDP per capita (θ)
QRQQ
0
0.1
0.2
0.3
0.4
0.5
0.6
0.7
0.8
0.05 0.2 0.35 0.5 0.65 0.8 0.95Quantile of growth of GDP per capita (θ)
QRQQ
0
0.1
0.2
0.3
0.4
0.5
0.6
0.7
0.8
0.05 0.2 0.35 0.5 0.65 0.8 0.95Quantile of growth of GDP per capita (θ)
QRQQ
0
0.1
0.2
0.3
0.4
0.5
0.6
0.7
0.05 0.2 0.35 0.5 0.65 0.8 0.95Quantile of growth of GDP per capita (θ)
QRQQ