Embed Size (px)
Citation preview

MPRAMunich Personal RePEc Archive
Analysis of technical efficiency of riceproduction in fogera district of Ethiopia:A stochastic frontier approach
Tadesse Zenebe Lema and Solomon Amare Tessema and
Fentahun Addis Abebe
Debre Berhan University, Debre Tabor University, Bahir DarUniversity
December 2016
Online at https://mpra.ub.uni-muenchen.de/77774/MPRA Paper No. 77774, posted 21 March 2017 11:10 UTC
1
Analysis of Technical Efficiency of Rice Production in Fogera District of Ethiopia: A
stochastic Frontier Approach
Tadesse Zenebe Lema1, Solomon Amare Tessema2 and Fentahun Addis Abebe3
1Lecturer at Department of Economics, College of Business and Economics, Debre Berhan University 2Graduate Assistant at Department of Economics, Faculty of Business and Economics, Debre Tabor University
3Lecturer at Department of Economics, College of Business and Economics, Bahir Dar University
Abstract
The possible way to improve production and productivity with a given input mix and available technology is to improve efficiency of resource use. For this purpose examining the technical efficiency of the production process is very crucial. Thus, the aim of this paper is to analyze the technical efficiency of rice production in Fogera District of Ethiopia. To do so, stochastic frontier approach is employed on a da ta which is collected from 200 sample households in 2015/16 production year. The sampling techniques used to get those 200 sample households is a multistage sampling where in the first stage five Kebeles
1
were purposively selected, in the second stage two Gotes2 randomly selected from each Kebeles and in
the third stage 200 households were selected using simple random sampling technique. Doing so, it was found that except manure all the variables in the Cobb-Douglass stochastic frontier model which includes; land, fertilizer, oxen, seed and labor are found to be positively and significantly related to rice production. The average technical efficiency score predicted from the estimated Cobb-Douglas stochastic frontier production function is found to be 77.2% implying that there is a room for rice yield increment by improving the resource use efficiency of the households. The study also revealed that; provision of extension service, training on rice product improvement, experience on rice farming; agrochemical and education tend to be positively and significantly related to technical efficiency while household size is negatively and significantly related. Thus, strengthening extension service provision and training on rice yield increment, campaigns to disseminate rice farming experiences and increasing the supply of agrochemicals are crucial to improve the technical efficiency of rice production in the study area.
Keywords
Ethiopia, Fogera District, Technical Efficiency, Cobb-Douglas Production Function, Stochastic Frontier Approach
1 Kebele is the smallest administrative unit of Ethiopia
2 Gote is a sub Kebele
2
1. Introduction
Rice is among the most important food crops
grown in different parts of Ethiopia (Asmelash,
2012). The potential for rice production in the
country is also estimated to be around thirty
million hectares (Ministry of Agriculture and
Rural Development office [MoARD], 2010).
According to Hagos and Zemedu (2015) now
days Fogera District is one of the main
producers of rice which contributes around 58
percent of the Amhara national regional state
and 28 percent of the national rice production.
The product is one of the main crops produced
in the area. According to Gebremedhin and Dirk
(2007) 72 percent of farmers in the District
produce Rice.
Rice production in Fogera District has shown
strong performance in terms of yield. For
instance, the total rice yield of the District
during the 2011/2012 production period was
827, 104 Quintal3, while in the 2014/2015
production period it is 943, 555.5 Quintal
(Fogera District Agricultural and Rural
Development office [FWARoD], 2015). Noneth
eless, the productivity did not record any
increase. Instead, it fell from 58.5 Quintal to
56.67 Quintal during the above period
(FWARoD, 2015). The increase in the
production was simply because more land under
rice cultivation. For a food insecure country like
Ethiopia, where poverty is the most striking
problem (Oxford Poverty and Human
Development Initiative, [OPHI] 2015) and
agriculture plays the major role in the economy
employing more than 84 percent of the country’s
population, contributing the largest share to the
foreign exchange earnings and leading the
livelihood of the dominant population,
improving the production and productivity of
this sector is the best way to bring about reduced
poverty and achieve food security (Asfaw &
Bekele, 2010). Increasing production and
3 Quintal is equal with 100 kg
productivity is also critical to economic growth
and development of the country in general and
that of the study area in particular. Nonetheless,
given limited agricultural resource like arable
land, it will be a difficult job to increase
production and productivity. This calls for
improving yields of major staples crops such as
Rice for better food security.
One way to bring about increased agricultural
production and productivity is introduction of
improved technology and Agricultural research
(Asfaw & Bekele, 2010). Despite the fact that
the policy rule is pursued so long ago,
improvement in agricultural productivity in
general and rice productivity in particular is
minimal. This might be due to the difficulty for
agricultural researchers to identify when and
how new technologies are used by farmers,
inability to finance farm technologies and other
farm expenditure owing to the lower per capita
income of farmers and higher prices of those
technologies. According to Asefa (2012), if the
existing inputs and technologies are not
efficiently utilized trying to introduce new
technologies is not cost effective. That is, under
such circumstances the use of the existing
technologies is more cost effective than applying
new technologies. Thus, a study on the technical
efficiency analysis is crucial to identify if
farmers are efficient in the use of the existing
resource and for decisions to introduce new
technologies.
Studies have been undertaken on the issue of
technical efficiency analysis. For instance,
Abedullah and Khalid (2007) analyzed the
technical efficiency of rice production in Punjab
(Pakistan) using stochastic frontier approach and
indicated that farmers in the study area were
91% efficient implying limited scope to improve
the resource use efficiency. Abedullah and
Khalid (2007) also indicated that education and
mechanization have positive and significant
effect on technical efficiency score while age is
3
found to have negative and significant effect.
Idiong (2007) estimated the farm level technical
efficiency in small-scale swamp rice production
in cross river state of Nigeria using stochastic
frontier approach and found an average technical
efficiency score of 77% implying better scope to
enhancing the resource use efficiency. The study
also shown that, years of schooling, membership
to associations and access to credit are found to
be the major determinants of technical
efficiency. Bamiro and Janet (2012) employed
stochastic frontier approach to analyze the
technical efficiency of swamp rice and upland
rice production in Osune Sate, Nigeria and
estimated an average technical efficiency of
56% and 91% respectively, which showed that
efficiency improvement is possible in the swamp
rice production. The study revealed that volume
of credit have negative effect on technical
efficiency of upland rice while females are
found to be more efficient compared to males in
the swamp rice production. Kadiri et al. (2014)
revealed that paddy rice production is
technically inefficient in the Niger Delta Region
of Nigeria. The study further indicated that,
marital status, educational level and farm size
are the major determinants of rice production in
the study area.
Studies conducted in Ethiopia emphasized on
the efficiency of maize production. That
is, Yilma and Ernst (2001), on the technical
efficiency of maize production in Southwestern
Ethiopia; Jimma zone, Alemu et al. (2008), on
the technical efficiency of farming systems
across agro ecological zones in Ethiopia, Asefa (
2012) on the technical efficiency of crop produci
ng smallholder farmers in Tigray, Ethiopia and
Geta et al. (2013) on technical efficiency of
Smallholder Maize Producers in Southern
Ethiopia. Nonetheless, findings of those studies
might not be applicable for the case of rice
production in Fogera District due to the diversity
in climatic condition of Fogera District and the
aforementioned areas, differences in the
knowhow of the farmers, differences in output
produced, difference in technology and means of
production. According to Danso-Abbeam et al.
(2012) farmers in different agro ecological zone
have different socio-economic background and
resource endowment which might impact their
resource use efficiency. Thus, the main objective
of this study is to analyze the technical
efficiency of rice production in Fogera District
of Ethiopia.
2. Methodology
The study aimed at analyzing the technical
efficiency of rice production in Fogera District
in the 2015/16 production period using cross-
sectional data. Below is discussion of the data
type and sources, model specification and
method of analysis.
2.1. Description of the Study area
Fogera District is located in the South Gondar
Zone of Amhara national regional state and it is
one of the 151 Districts found in the region. The
capital of the District is Woreta and is located
625 km northwest of Addis Ababa and 55 km
from the regional capital, Bahir Dar. It is
situated at 11º46 to 11º59 latitude North and
37º33 to 37º52 longitude East. It has a total land
area of 117,405 hectare of which flat lands
account for 76% while the rest are mountains
and hills and valley bottoms account for 11%
and 13%, respectively. The land use pattern of
the District is characterized by 48 % cultivated
land, 22 % grazing land, 21% water bodies, 2 %
forest land and 7 % for others. The main crops
produced in the District include Rice, Teff,
Maize, Vegetables and Horticultures. The study
area has an annual total rainfall which ranges
from1103 to 1336 mm. There are altogether 26
rural Keeble’s and 5 urban Keeble’s. As per
population census dated 2005, the population of

4
this district was 224,884 (Central Statistical
Authority [CSA] 2005).
2.2. Data Type and Sources
Primary data on socio economic and production
information is collected from 2004 households
belonging to 10 Gotes using structured
questionnaire in the 2015/16 production period.
The socio-economic data includes data on sex of
respondents, age, marital status and education
status. Production information data on the other
hand includes size of farm land, labor used in
production, fertilizer application, agrochemical
usage, manure and yield.
2.3. Sampling Technique
To select representative sample for the study a
multistage sampling technique is employed. In
the first stage five Keeble’s are purposively
selected based on the extent of rice production.
The purposive sampling technique is used due to
the fact that it enables to choose Kebele s̀ with
better potential of growing rice. From the
aforementioned Keeble’s 10 Gotes (two Gotes
from each Kebele) are randomly selected from
which 200 households are randomly chosen.
Given the fact that the population size of Gotes
is comparable, sample size is taken
proportionately.
2.4. Analytical Framework
The two most important approaches to estimate
efficiency/inefficiency level is the stochastic
frontier production function (parametric) and the
4 The sample size is determined by using Israel
(1992) sample size determination formula which is
given as:
. Assuming a 95% degree of
confidence, 50% proportion of an attribute that is
present in the population and a 7% desired level of
precision the sample size is determined at 196. For
ease of distributing the sample size to each Gotes
proportionately the sample size approximated to 200
households.
Data Envelopment Analysis (DEA) or
nonparametric approach. DEA has the power of
accommodating multiple output and inputs in
technical efficiency analysis. Nonetheless, it
fails to take into consideration the possible
impact of random shock like measurement error
and other noise in the data (Coelli, 1995). On the
other hand, the stochastic frontier does not
accommodate multiple input and output. It is
also more likely to be influenced by
misspecification issues. However, the fact that it
incorporates stochastic component into a model
increased its applicability in the analysis of
technical efficiency of agricultural productions.
Thus, for this study the stochastic frontier
production function is employed and is adapted
from Addai and Victor (2014) and Salau et al.
(2012).
2.4.1 Stochastic Frontier Production
Function
As indicated above DEA assumes the absence of
random shocks, while farmers always operate
under uncertainty. As a result this study
employed the stochastic frontier approach. The
stochastic frontier production function with
multiplicative error term is given by equation 1
(Kadiri et al., 2014):
( ) ( )
Where, refers to the total value of Rice output
of the ith
farm measured in Birr, ( ) is
suitable functional form (like Cobb-Douglass,
translog) of the Vector of inputs , refers to
vector of parameters to be estimated and
refers to an error term. The error term in the
stochastic frontier production function has two
components. i.e.
( )
Where and are independent of each other,
is identically and independently normally
distributed random error ( ) that
captures the stochastic effects outside the
farmers control and is a one sided efficiency
5
component that capture the technical
inefficiency of the farmer. The technical
efficiency of the ith
firm is estimated by the ratio
of the observed output to maximum possible
output, where the latter is provided by the
stochastic frontier production function.
( )
( ) ( )
( ) ( ) ( )
( ) ( )
2.5 The Empirical Stochastic Frontier
Production Function Model5
The empirical stochastic frontier model used the
Cobb-Douglass specification for the analysis of
the technical efficiency of rice farms in Fogera
District. The Cobb-Douglass functional form is
frequently employed in related efficiency studies
(Mohammed 2012; Danso-Abbeam et al., 2012).
This enables comparison of results with previous
studies (Danso-Abbeam et al. 2012). The log
linear Cobb-Douglass production function is
given by equation 6:
( )
5 The variables in the Cobb Douglass production
function and the inefficiency model are selected
based on previous literature and pilot survey
conducted prior to data collection.
Where, ij refers to the jth
observation of the ith
farm, refers to the total value of Rice output,
, …. are parameters to be estimated, ,
… refers Land, Labor, Oxen, Fertilizer
used in kg, Seed input in kg and Manure use
respectively and V and U are as defined before.
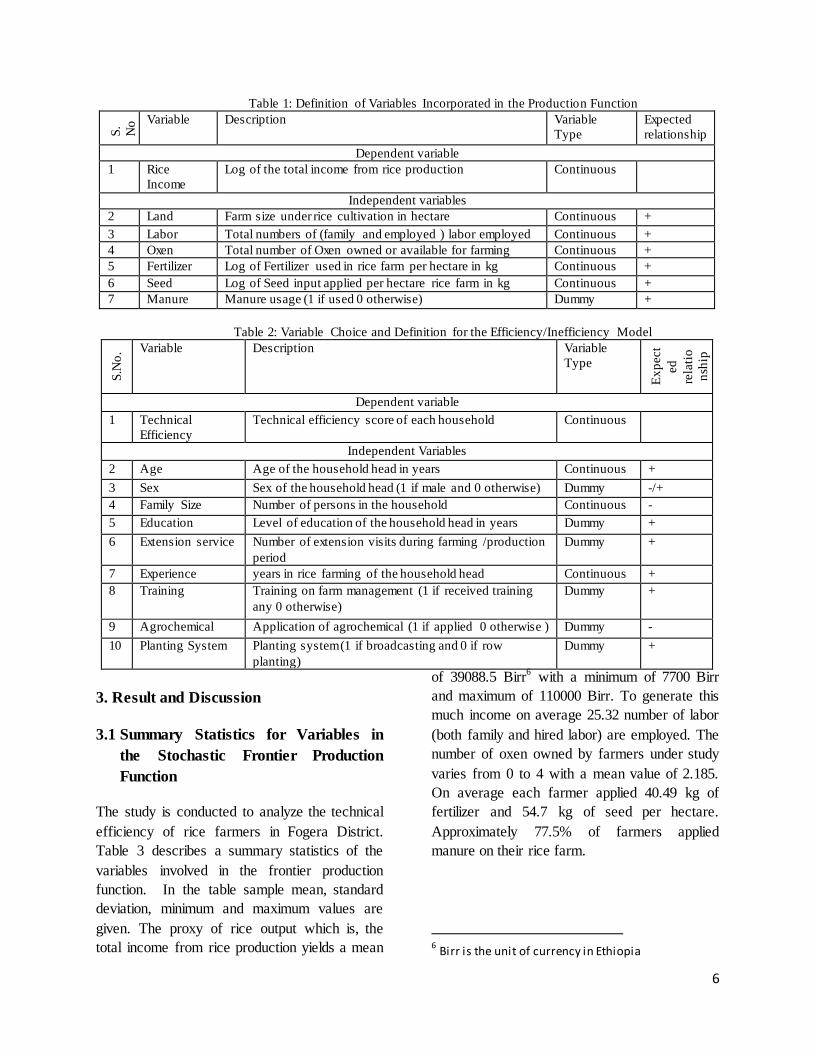
Table 1 presents the list of explanatory variables
in the frontier model, variable and expected
relationship of the variables with rice output
which proxy is rice income.
2.6 Factors Affecting Technical Efficiency
To examine the factors affecting technical
efficiency score, the following model is
established.
( )
Where refers to the technical efficiency of
rice farmers, s̀ are parameters to be estimated
and s̀ refers to the socio economic
characteristics which includes, age, sex, family
size, education, extension service, experience,
training, agrochemical and planting system.
Below is given the description of the variables
incorporated in the inefficiency model, the
variables type and expected signs of the
explanatory variables
6
Table 1: Definition of Variables Incorporated in the Production Function S
.
No
.
Variable Description Variable
Type
Expected
relationship
Dependent variable
1 Rice
Income
Log of the total income from rice production Continuous
Independent variables
2 Land Farm size under rice cultivation in hectare Continuous +
3 Labor Total numbers of (family and employed ) labor employed Continuous +
4 Oxen Total number of Oxen owned or available for farming Continuous +
5 Fertilizer Log of Fertilizer used in rice farm per hectare in kg Continuous +
6 Seed Log of Seed input applied per hectare rice farm in kg Continuous +
7 Manure Manure usage (1 if used 0 otherwise) Dummy +
Table 2: Variable Choice and Definition for the Efficiency/Inefficiency Model
S.N
o. Variable Description Variable
Type
Ex
pect
ed
rela
tio
nsh
ip
Dependent variable
1 Technical
Efficiency
Technical efficiency score of each household Continuous
Independent Variables
2 Age Age of the household head in years Continuous +
3 Sex Sex of the household head (1 if male and 0 otherwise) Dummy -/+
4 Family Size Number of persons in the household Continuous -
5 Education Level of education of the household head in years Dummy +
6 Extension service Number of extension visits during farming /production
period
Dummy +
7 Experience years in rice farming of the household head Continuous +
8 Training Training on farm management (1 if received training
any 0 otherwise)
Dummy +
9 Agrochemical Application of agrochemical (1 if applied 0 otherwise ) Dummy -
10 Planting System Planting system (1 if broadcasting and 0 if row
planting)
Dummy +
3. Result and Discussion
3.1 Summary Statistics for Variables in
the Stochastic Frontier Production
Function
The study is conducted to analyze the technical
efficiency of rice farmers in Fogera District.
Table 3 describes a summary statistics of the
variables involved in the frontier production
function. In the table sample mean, standard
deviation, minimum and maximum values are
given. The proxy of rice output which is, the
total income from rice production yields a mean
of 39088.5 Birr6 with a minimum of 7700 Birr
and maximum of 110000 Birr. To generate this
much income on average 25.32 number of labor
(both family and hired labor) are employed. The
number of oxen owned by farmers under study
varies from 0 to 4 with a mean value of 2.185.
On average each farmer applied 40.49 kg of
fertilizer and 54.7 kg of seed per hectare.
Approximately 77.5% of farmers applied
manure on their rice farm.
6 Birr is the unit of currency in Ethiopia

7
Table 3: Summary of the Frontier Production Function
Variables Observation Mean Std. Dev. Min Max
Rice Income 200 39088.5 18083.21 7700 110000
Oxen 200 2.185 0.978 0 4
Land 200 0.833 0.458 0.125 3
Manure 200 0.775 0.419 0 1
Labor 200 25.32 6.032 13 60
Fertilizer 200 40.49 12.900 20 80
Seed 200 54.7 11.623 25 100
Source: Author’s computation based on survey data (2015/16)
3.2 Socio Economic Characteristics of
Rice Farmers
Table 4 presents summary statistics of the socio
economic characteristics of rice producing
farmers in the study area. As it can be seen from
the table, the mean age of rice farmers is 47.205
with 21 and 80 the minimum and maximum age
respectively. The average household size is 5.46
with minimum 1 and maximum 12. Female
household head represents only 6 percent of the
total household under study. Thus, the gender
distribution in the study area is characterized by
male dominance. On the other hand 79 percent
of the respondents received extension service
while 41.5 percent have participated in rice
output improvement trainings. Table 4 also
indicates that 46 percent of rice farmers applied
agrochemical on their rice farm. Majority of the
farmers in the study area (75 percent) use
broadcasting system of rice planting while, the
rest practice row planting. It is also indicated
that 55 percent of the respondents are literate.
Table 4: Summary Statistics of the Socio Economic Characteristics of Rice Farmers
Variable Obs Mean Std. Dev. Min Max
Age 200 47.20 12.83 21 80
Gender 200 0.06 0.25 0 1
Extension 200 0.79 0.41 0 1
Training 200 0.42 0.49 0 1
Experience 200 18.44 5.41 2 27
Agrochemical 200 0.46 0.50 0 1
Household size 200 5.46 1.98 1 12
education 200 0.55 0.49 0 1
Planning system 200 0.75 0.44 0 1
Source: Author’s computation based on survey data (2015/16)
3.3 Least Square Estimation
Table 5 presents the ordinary least square
estimates of the log linear Cobb-Douglass
production function. As it is shown in the table
5; Rice land size, number of oxen owned and
labor force employed in rice framing are found
to be positive and significant in the production
process at one percent level of significance. On
the other hand, fertilizer and rice seed applied
are found to have positive and significant effect
on rice output at ten percent level of
significance.

8
Table 5: Ordinary Least Square Estimates of the Cobb-Douglass Production Function
Rive Income Coef. Std. Err. t P>|t|
Intercept 5.268*** 0.432 12.18 0.000
Land 0.169*** 0.049 3.43 0.001 Fertilizer 0.104* 0.061 1.71 0.089
Oxen 0.156*** 0.023 6.70 0.000
Seed 0.173* 0.089 1.94 0.053 Labor 1.139*** 0.097 11.70 0.000
Manure 0.058 0.045 1.27 0.205
R squared : 0.737
Adjusted R squared: 0.729
Number of observation: 200
Note: The asterisks (*, **, ***) indicate significance at the 10%, 5% and 1% levels Source: Author’s computation based on survey data (2015/16)
Manure application is found to be insignificant
in the production process. This might be due to
the fact that manure is not widely practiced in
the study area and thus it has negligible role to
rice output. Due to the fact that the variable
manure is insignificant it is excluded from the
frontier model estimation. With a higher value
of R2 and Adjusted R
2 (73.67% and 72.85%
respectively), the inputs employed in the model
were able to explain more than seventy two
percent of the variation in rice out and thus
implying better goodness of fit of the model.
3.4 Estimation of the Frontier Model
To estimate the frontier model the half-normal,
the exponential and the truncated-normal
distribution is assumed as a distribution for the
efficiency/inefficiency term.
Table 6: Parameter Estimates of the Stochastic Frontier Model
Variables frontier normal/half-normal model frontier normal/exponential model
frontier normal/truncated-normal model
Rive output
Coef. Std. Err.
z P>|z| Coef. Std. Err.
z P>|z| Coef. Std. Err.
z P>|z|
Intercept 5.849*** 0.401 14.5 0.000 5.970*** 0.396 15.1 0.000 5.970*** 0.396 15.1 0.000
Land 0.190*** 0.050 3.80 0.000 0.196*** 0.046 4.21 0.000 0.196*** 0.047 4.21 0.000
Fertilizer 0.119** 0.056 2.12 0.034 0.106** 0.053 2.01 0.044 0.106** 0.053 2.01 0.044
Oxen 0.135*** 0.021 6.28 0.000 0.138*** 0.020 6.76 0.000 0.138*** 0.020 6.76 0.000
Seed 0.163** 0.079 2.06 0.039 0.149* 0.076 1.94 0.052 0.149* 0.077 1.94 0.052 Labor 1.045*** 0.083 12.5 0.000 1.011*** 0.084 11.9 0.000 1.011*** 0.085 11.9 0.000
/lnsig2v -3.989 0.307 -12.9 0.000 -3.698 0.221 -16.7 0.000 /mu -286.89 481.608 -0.60 0.551
/lnsig2u -2.052 0.195 -10.5 0.000 -3.185 0.267 -11.9 0.000 /lnsigma2 /ilgtgamma
4.069 7.768
1.669 1.685
2.44 4.61
0.015 0.000
sigma_v 0.136 0.020 0.157 0.017 sigma2 58.496 97.670
sigma_u 0.358 0.034 0.203 0.027 gamma 0.999 0.0007
sigma2 0.146 0.021 0.066 0.009 sigma_u2 58.47 97.670
lambda 2.633 0.050 1.292 0.039 sigma_v2 0.0247 0.0055
LR test of sigma_u=0: LR test of sigma_u=0:
chibar2(01) = 26.43 Prob>=chibar2 = 0.000
chibar2(01) = 19.48 Prob>=chibar2 = 0.000
Note: The asterisks (*, **, ***) indicate significance at the 10%, 5% and 1% levels
Source: Author’s computation based on survey data (2015/16)

9
As it is indicated in table 6 the result under all
assumptions is consistent. The estimated values
for the variance parameters are found to be
significant. This implies that technical
efficiency had an effect on rice yield. As shown
in table 6 the estimated lambda and sigma2 are
found to be significant. This implies that the
model is characterized by better goodness of fit
and also the distributional assumption of the
efficiency/inefficiency term is correct. On the
other hand the higher value of lambda which is
2.6337 for the half-normal model indicates that
the one sided error term “U” dominates the
random term and thus implying that variation in
rice yield in the study area is due to the
difference in farm specific characteristics
discussed above. The likelihood ratio test for the
inefficiency term is found to be significant at
one percent level of significant implying that
inefficiency component presents in the model
and thus the model will not reduce to ordinary
least square.
3.5 Input Elasticities of Rice Production
The Elasticities of the independent variables are
provided in table 7. As it can be seen from the
table the elasticity of labor is found to be higher
implying that rice yield is more responsive to the
amount of labor employed in the production
process. The response of rice yield is significant
7 Lambda ( ̂) is the ratio of the standard deviation of
the two error components. i.e.
. The fact that
the estimated is greater than 1 and significantly
different from zero implies the presence of
inefficiency effect within the model.
to the rest of covariates involved in the Cobb-
Douglass stochastic frontier model.
Table 7: Elasticities of Independent Variables
Variables Elasticity Std. Err. z P>|z| Land 0.015 0.004 3.80 0.00
Fertilizer 0.041 0.019 2.13 0.03
Oxen 0.027 0.004 6.25 0.00
Seed 0.060 0.029 2.06 0.04
Labor 0.312 0.025 12.47 0.00
Source: Author’s computation based on survey data (2015/16)
3.6 Frequency Distribution of the
Technical Efficiency Scores
The technical efficiency score8 derived from the
stochastic frontier model is presented in table
3.6. It is evident from the result that the total
technical efficiency score ranges from 29.89% to
95.17% with a mean score of 77.2%. Thus,
based on the efficiency theory a farm operating
at full efficiency level could reduce its input use
on average by 22.8% so as to produce the same
level of output.
8 The technical efficiency scores are predicted from
the half normal model. This is because, the half
normal model produces moderate technical efficiency
score while the exponential and the truncated-normal
models, underestimates and over estimates the
technical efficiency score respectively (Kebede,
2001).

10
Table 8: Technical Efficiency Distribution of Rice Farmers
TE Rating (% ) No. of Farmers % age of Farmers 0<TE<20 0 0
20<TE<30 1 0.5
30<TE<40 2 1
40<TE<50 6 3
50<TE<60 14 7
60<TE<70 25 12.5
70<TE<80 55 27.5
80<TE<90 71 35.5
90<TE<100 26 13
Total 100 Mean TE 77.2%
Standard deviation 12.67% Minimum 29.89% Maximum 95.167%
Note: A TE value close to one indicates higher level of technical efficiency
Source: Author’s computation based on survey data (2015/16)
3.7 Determinants of Technical Efficiency
To examine the determinants of technical
efficiency of rice farm in the study area both the
ordinary least square and a Tobit model are
used. The result indicates that both models are
consistent. The estimation result is presented in
table 9. As shown in the table, age is found to
have positive but insignificant effect on
technical efficiency. Gender is positive and not
significantly related to technical efficiency. This
indicates that being male or female as a
household head does not have a role on rice farm
technical efficiency. This finding is in line with
a study by Kadiri et al. (2014). Provision of
extension service and participation in rice yield
improvement trainings show positive and
significant relationship with technical efficiency.
Agrochemical is positively and significantly
related to technical efficiency. Household size is
found to have negative and significant effect on
technical efficiency.
Table 9: Estimates of Parameters of the Efficiency/Inefficiency Model
Variables Ordinary Least Square Estimates Tobit Estimates
Rive Income Coef. Std. Err. t P>|t| Coef. Std. Err. t P>|t|
Intercept 0.537*** 0.0371 14.47 0.000 0.536*** 0.0365 14.72 0.000
Age -0.0001 0.0006 -0.23 0.820 -0.0001 0.0005 -0.24 0.808
Gender 0.031 0.0259 1.22 0.224 0.031 0.0255 1.22 0.224
Extension 0.092*** 0.0170 5.45 0.000 0.093*** 0.0167 5.57 0.000
Training 0.039*** 0.0140 2.86 0.005 0.039*** 0.0137 2.89 0.004
Experience 0.008*** 0.0014 6.36 0.000 0.009*** 0.0014 6.53 0.000
Agrochemical 0.049*** 0.0143 3.49 0.001 0.050*** 0.0141 3.56 0.000
HH size -0.009*** 0.0034 -2.72 0.007 -0.009*** 0.0034 -2.81 0.005
Education 0.029** 0.0142 2.09 0.038 0.030** 0.0140 2.15 0.033
Planting system -0.001 0.0165 -0.08 0.940 -0.002 0.0163 -0.11 0.909
R squared
Adjusted R squared F
0.533
0.511 24.13***
125.98***
Note: The asterisks (*, **, ***) indicate significance at the 10%, 5% and 1% levels Source: Author’s computation based on survey data (2015/16)
11
This might be due to the fact that households
with large family size tend to spend more on
consumption goods and thus expenditure on rice
yield improvement like agrochemical will be
minimal. The result is in line with that of Kadiri
et al. (2014). Planting system is not significantly
related to technical efficiency. This indicates
that there is no significant technical
efficiency difference between farmers that practi
ce broadcasting planting system and those that p
ractice row planting. Education is significant at
10% level of significance which implies that
farmers with better education are more efficient
compared to those with less educated. This
result is in line with that of Chi and Yamada
(2005), Abedullah and Khalid (2007
and Kadiri et al. (2014).
Conclusion and Policy Implications
This study analyzed the technical efficiency of
rice production in Fogera District. The results
have shown that the average technical efficiency
score is around 77.2 percent with a minimum
score of 29.89% and a maximum of 95.17%.
This proves that there is substantial possibility to
increase rice yield in the study area by
improving the resource use efficiency. The main
factors affecting the technical efficiency of rice
farmers in the study area includes; Extension,
Training, Experience, Agrochemical, Household
size and Education. To improve the technical
efficiency of rice farming in the study area the
following policy implications should be
considered. That is, provision of extension
service and trainings on rice yield improvement
provided by the government and non-
governmental organization are found to be
significant. Thus, it is essential to further
strengthen these efforts. As experience is
significantly related to technical efficiency, the
District agricultural development office should
create an opportunity for those farmers with
lower technical efficiency to share an experience
from those that scored an efficiency score close
to one. It is also essential to further improve the
supply of Agrochemicals and the trainings on
how to apply agrochemicals on rice filed. The
study also revealed that education is positively
related to technical efficiency and thus it is quite
essential to provide adult education and
vocational education for the farmers in the study
area.
References
Abedullah, Shahzad Kouser, and Khalid Mushtaq.
(2007). Analysis of technical efficiency of
rice production in Punjab (Pakistan):
Implications for future investment
strategies. Pakistan Economic and Social
Review, 231-244. Addai, Kwabena Nyarko, and Victor Owusu. (2014).
Technical efficiency of maize farmers
across various agro ecological zones of
Ghana. Journal of Agriculture and
Environmental Sciences, 3(1), 149-172.
Alemu, Bamlaku A., E. A. Nuppenau, and H. Boland.
(2008). Technical efficiency of farming
systems across agro-ecological zones in
Ethiopia: An application of stochastic
frontier analysis.
Asefa, Shumet. (2012). Analysis of technical
efficiency of crop producing smallholder
farmers in Tigray. Ethiopia.'Munich
Personal RePEc Archive (MPRA), Paper,
(40461).
Asfaw, Solomon, and Bekele Shiferaw. (2010).
Agricultural technology adoption and rural
poverty: Application of an endogenous
switching regression for selected East
African Countries. Poster Presented at the
Joint 3rd African Association of
Agricultural Economists (AAAE), 19-23.
Asmelash, Yemane. (2012). Farmers’ evaluation of
upland rice varieties in Fogera District,
South Gondar, Ethiopia. Asian Journal of
Agriculture and Rural Development, 2(4),
604-608.
Bamiro, Olasunkanmi M., and Janet O. Aloro.
(2013). Technical efficiency in swamp and
upland rice production in Osun
State. Scholarly Journal of Agricultural
Science, 3(1), 31-37. Coelli, T. J. (1995). Recent developments in frontier
modelling and efficiency
measurement. Australian Journal of
agricultural economics, 39(3), 219-245.
Chi, Truong Thi Ngoc and Ryuichi Yamada. (2005).
Assessing the technical efficiency of input in

12
rice production in Thoi Lai Commune, Co
Do District, Can Tho City. Omonrice 13 (-):
116-120
Danso-Abbeam, G., R. Aidoo, K. O. Agyemang, and
K. Ohene-Yankyera. (2012). Technical
efficiency in Ghana’s cocoa industry:
Evidence from Bibiani-Anhwiaso-Bekwai
District. Journal of Development and
Agricultural Economics,4(10), 287-294.
FDARoD (Fogera District Agricultural and Rural
Development Office), (2015). Annual report.
Ethiopia, Woreta.
Gebremedhin, Berhanu, and Dirk Hoekstra. (2007).
Cereal marketing and household market
participation in Ethiopia: The case of teff,
wheat and rice. In AAAE Conference
Proceedings (2007) (pp. 243-252).
Geta, Endrias, Ayalneh Bogale, Belay Kassa, and
Eyasu Elias. (2013). Productivity and
efficiency analysis of smallholder maize
producers in Southern Ethiopia. Journal of
Human Ecology, 41(1), 67-75.
Hagos, A., & Zemedu, L. (2015). Determinants of
Improved Rice Varieties Adoption in
Fogera District of Ethiopia. Science,
Technology and Arts Research Journal ,
4(1), 221-228.
Idiong, I. C. (2007). Estimation of farm level
technical efficiency in smallscale swamp
rice production in cross river state of
Nigeria: a stochastic frontier
approach. World Journal of Agricultural
Sciences, 3(5), 653-658. Israel, G. D. (1992). Determining sample size.
University of Florida Cooperative
Extension Service, Institute of Food and
Agriculture Sciences, EDIS.
Kadiri, F. A., C. C. Eze, J. S. Orebiyi, J. I. Lemchi,
D. O. Ohajianya, and I. U. Nwaiwu.
(2014). Technical efficiency in paddy rice
production in Niger Delta Region of
Nigeria. Global Journal of Agricultural
Research, 2(2), 33-43. Kebede, T. A. (2001). Farm household technical
efficiency: A stochastic frontier analysis. A
study of rice producers in Mardi watershed
in the western development region of
Nepal. Departemen of Economics and
Social Sciences, Agricultural University of
Norway.
MoARD (Ministry of Agriculture and Rural
Development), (2010). Annual report.
Ethiopia, Addis abeba.
Mohammed, Wakili Abba. (2012). Technical
efficiency of sorghum production in hong
local government area of Adamawa state,
Nigeria. Russian Journal of Agricultural
and Socio-Economic Sciences, 6(6).
Salau, S. A., Adewumi, M. O., & Omotesho, O. A.
(2012). Technical efficiency and its
determinants at different levels of
intensification among maize-based farming
households in Southern Guinea Savanna of
Nigeria. Ethiopian Journal of
Environmental Studies and Management,
5(2), 195-206.
Yilma, Tsegaye, and Ernst Berg. (2001). Technical
efficiency of maize production in
Southwestern Ethiopia: a case of Jimma
zone. In Proceedings of Deutscher
Tropentag Conference on International
Agricultural Research for Development,
October (9-11).
Acknowledgements
Acknowledgements go to Fogera District
Agricultural development office for facilitating the
data collection process and providing the necessary
information needed to conduct this study and Mr.
Debebe Aklog, Mr. Hailu Desalegn for their support
in the data collection process and Dr. KN Reddy for
sparring some time to go through the language part.