Embed Size (px)
Citation preview

lable at ScienceDirect
Environmental Pollution 244 (2019) 72e83
Contents lists avai
Environmental Pollution
journal homepage: www.elsevier .com/locate/envpol
Multivariate receptor models and robust geostatistics to estimatesource apportionment of heavy metals in soils*
Jianshu Lv a, b, *
a College of Geography and Environment, Shandong Normal University, Ji'nan, 250014, Chinab State Key Laboratory of Estuarine and Coastal Research, East China Normal University, Shanghai, 200062, China
a r t i c l e i n f o
Article history:Received 12 June 2018Received in revised form18 September 2018Accepted 29 September 2018Available online 8 October 2018
Keywords:Source apportionmentPMFAPCS/MLRHeavy metalsRobust geostatistics
* This paper has been recommended for acceptanc* College of Geography and Environment, Shando
250014, China.E-mail address: [email protected].
https://doi.org/10.1016/j.envpol.2018.09.1470269-7491/© 2018 Elsevier Ltd. All rights reserved.
a b s t r a c t
Absolute principal component score/multiple linear regression (APCS/MLR) and positive matrix factoriza-tion (PMF) were applied to a dataset consisting of 10 heavy metals in 300 surface soils samples. Robustgeostatistics were used to delineate and compare the factors derived from these two receptor models. BothAPCS/MLR and PMF afforded three similar source factors with comparable contributions, but APCS/MLR hadsome negative and unidentified contributions; thus, PMF, with its optimal non-negativity results, wasadopted for source apportionment. Experimental variograms for each factor from two receptor modelswere built using classical Matheron's and three robust estimators. The best association of experimentalvariograms fitted to theoretical models differed between the corresponding APCS and PMF-factors. How-ever, kriged interpolation indicated that the corresponding APCS and PMF-factor showed similar spatialvariability. Based on PMF and robust geostatistics, three sources of 10 heavy metals in Guangrao weredetermined. As, Co, Cr, Cu, Mn, Ni, Zn, and partially Hg, Pb, Cd originated from natural source. The factorgrouping these heavy metals showed consistent distribution with parent material map. 43.1% of Hg and13.2% of Pb were related to atmosphere deposition of human inputs, with high values of their associationpatterns being located around urban areas. 29.6% concentration of Cd was associated with agriculturalpractice, and the hotspot coincided with the spatial distribution of vegetable-producing soils. Overall,natural source, atmosphere deposition of human emissions, and agricultural practices, explained 81.1%,7.3%, and 11.6% of the total of 10 heavy metals concentrations, respectively. Receptor models coupled withrobust geostatistics could successfully estimate the source apportionment of heavy metals in soils.
© 2018 Elsevier Ltd. All rights reserved.
1. Introduction
Soil is the most important reservoir of pollutants in the terres-trial ecosystem, and provides a medium for the transportation ofheavy metals to the atmosphere, hydrosphere, and biomass(Alloway, 2013; Kabata-Pendias and Pendias, 2001; Lv et al., 2014).Among various pollutants in soils, heavy metals are particularlyhazardous due to their cumulative toxicity and persistence(Rodriguez et al., 2008); they may threaten human health throughintake, direct ingestion and dermal contact (Kabata-Pendias andMukherjee, 2007; Siegel, 2001). Heavy metals in soils arecommonly controlled by both natural background and human
e by Prof. W. Wen-Xiong.ng Normal University, Ji'nan,
inputs. Soil inherits themineral skeleton of parentmaterial throughweathering and pedogenesis (Alloway, 2013), and parent materialsdetermine the background contents of heavy metals in soils. Due torapid industrialization and urbanization, human activities (e.g.,fossils fuel combustion, industrial productions, vehicle exhaustemissions and the application of fertilizers and pesticides) inevi-tably lead to elevated soil heavy metal concentrations (Lv et al.,2015b; Vanek et al., 2018), which have exceeded the permissiblelimits for maintaining human health in some places (Chen et al.,2015; Rodríguez Martin et al., 2015; Zhong et al., 2011). Therefore,source apportionment is of key importance because it can providereferences for soil management and remediation.
Multivariate statistical analyses, especially principal componentanalysis (PCA), have been widely used to identifying the source ofheavy metals in soils (Facchinelli et al., 2001; Huang et al., 2015; Liet al., 2009; Lv et al., 2015a; RodríguezMartín et al., 2013; Sajn et al.,2011). PCA, as a linear technique for dimensionality reduction,could transform many heavy metals into few principle component
J. Lv / Environmental Pollution 244 (2019) 72e83 73
(PC) corresponding to a certain source. However, PCA cannotinterpret the quantitative contributions of natural and humansources to heavy metals. Multivariate receptor models such as ab-solute principal component score/multiple linear regression (APCS/MLR) and positive matrix factorization (PMF) were developed tosolve the chemical mass balance (CMB) and could quantify thesource apportionment of heavy metals in soils. APCS/MLR and PMFdo not depend on the previous source signatures from samplingand measurement; therefore, APCS/MLR and PMF are moreconvenient and efficient than traditional CMB. APCS/MLR evolvedfrom PCA, and source contributions are obtained through carryingout the regressions between heavy metal contents and APCS(Thurston and Spengler, 1985). PMF uses experimental un-certainties in the data matrix and decomposes a data matrix intofactor contributions and factor profiles under the non-negativeconstraint (Paatero and Tapper, 1994). Currently, APCS/MLR andPMF have been applied in source apportionment of various pol-lutants in the atmosphere, soil, and dust (Chen et al., 2016; Jianget al., 2017; Lee et al., 1999; Liang et al., 2017; Lu et al., 2008;PriyaDarshini et al., 2016; Vaccaro et al., 2007; Xue et al., 2014;Zhang et al., 2012b).
Multivariate receptor models aim to create one or more newvariables or factors, each representing a source with a cluster ofinterrelated variables within the data set (Luo et al., 2015; Qu et al.,2013; Rodríguez Martín et al., 2013). These statistical models areessential to understand the relationships between soil elements.However, these methods ignore the spatial correlations betweensampling points, which contain important information. Geo-statistics with variography and kriging could examine spatialstructure and variability of factors resulting from multivariate re-ceptor models (Goovaerts, 1997; Matheron,1963), which could leadto an adequate understanding of multivariate receptor models fromthe insight of spatial correlations, and also facilitate to demarcatethe natural or contamination source represented by respectivefactor. Soil data due to point-sources of pollution exhibited somehotspots or outliers. The classical Matheron's variogram, as anasymptotically unbiased estimator, is sensitive to the skewness ofdata due to the existence of outliers (Matheron, 1963; Webster andOliver, 2007). Several robust estimators have been proposed toreduce the effects of the outliers in the calculation of experimentalvariograms (Cressie and Hawkins, 1980; Dowd, 1984; Genton,1998). Based on robust experimental variograms fitted to theoret-ical models, kriged maps of the factors resulting from APCS/MLRand PMF could be superposed on the auxiliary environmental data(such as land use types and parent materials) using GIS techniques(Liu et al., 2013). Receptor models combined with robust geo-statistics are expected to be powerful tools to estimate sourceapportionment of heavymetals in soils. Tomy knowledge, there areno studies conducted to apply robust geostatistics to present theresult derived from receptor model.
In our study, both APCS/MLR and PMFwere applied to the heavymetal datasets (As, Cd, Co, Cr, Cu, Hg, Mn, Ni, Pb, and Zn concen-trations of 300 surface soils samples) in Guangrao County, easternChina, and robust geostatistics was used to map and compare thespatial structure and variability of factors resulting from the APCS/MLR and PMF. Based on these findings, potential sources repre-sented by factors were demarcated, and sources contributions werequantified.
2. Methods and materials
2.1. Study area
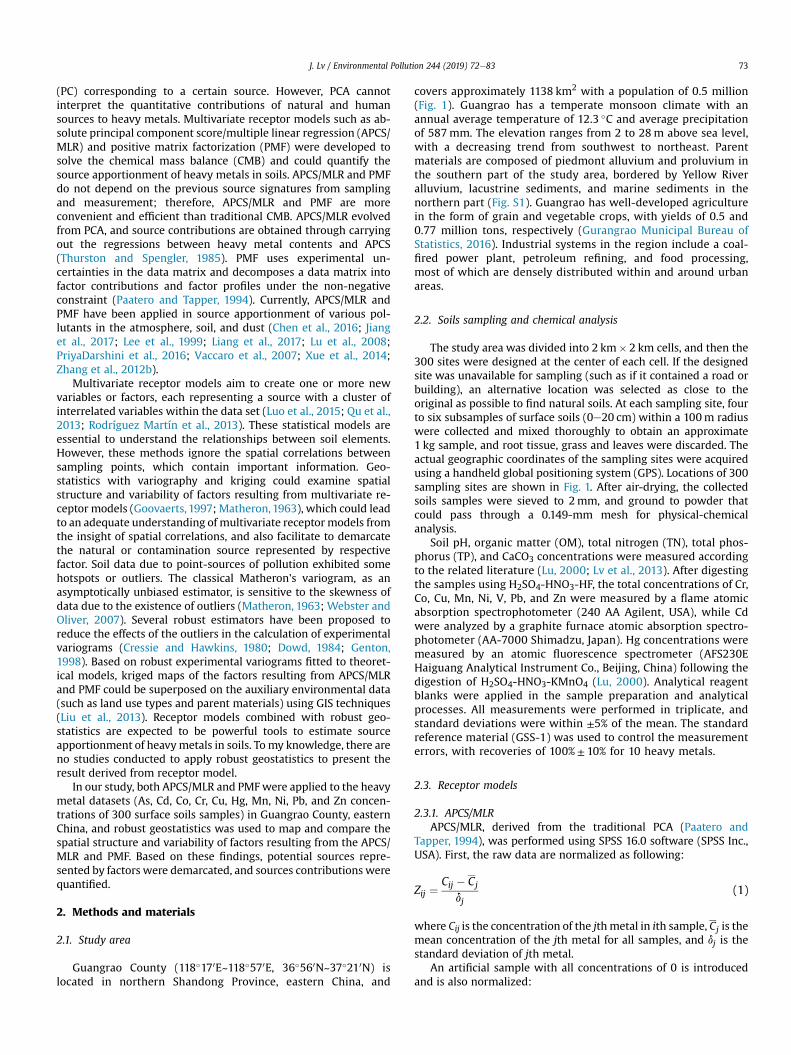
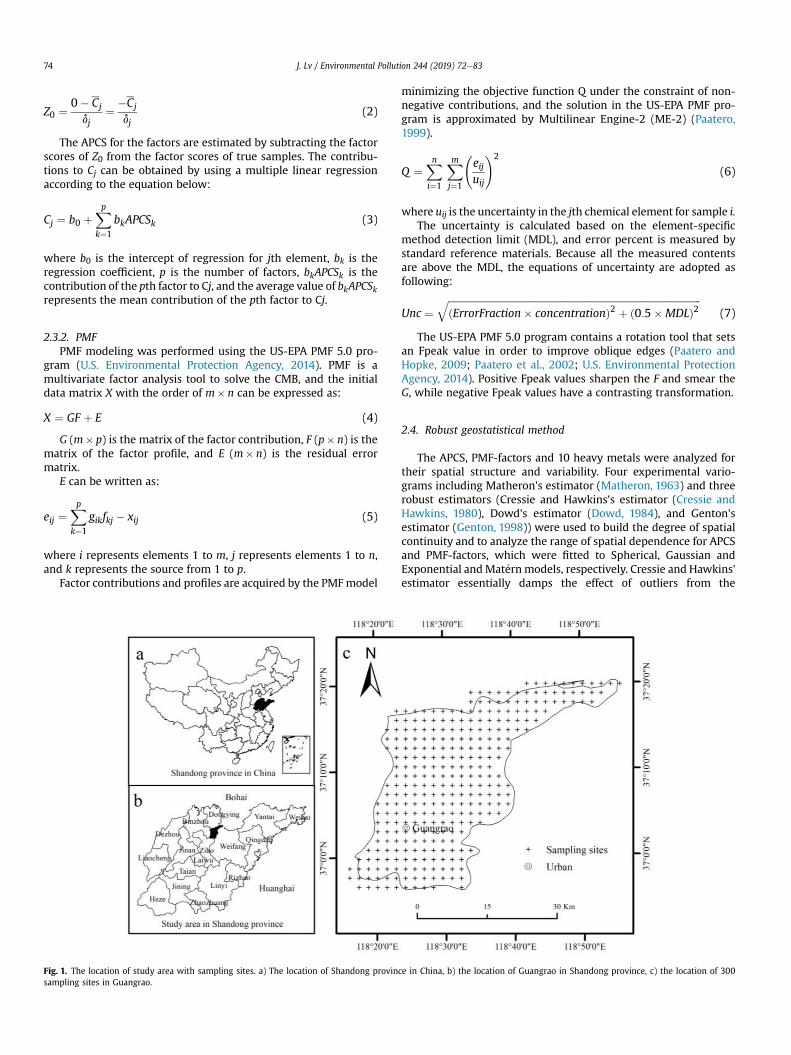
Guangrao County (118�170E~118�570E, 36�560N~37�210N) islocated in northern Shandong Province, eastern China, and
covers approximately 1138 km2 with a population of 0.5 million(Fig. 1). Guangrao has a temperate monsoon climate with anannual average temperature of 12.3 �C and average precipitationof 587mm. The elevation ranges from 2 to 28m above sea level,with a decreasing trend from southwest to northeast. Parentmaterials are composed of piedmont alluvium and proluvium inthe southern part of the study area, bordered by Yellow Riveralluvium, lacustrine sediments, and marine sediments in thenorthern part (Fig. S1). Guangrao has well-developed agriculturein the form of grain and vegetable crops, with yields of 0.5 and0.77 million tons, respectively (Gurangrao Municipal Bureau ofStatistics, 2016). Industrial systems in the region include a coal-fired power plant, petroleum refining, and food processing,most of which are densely distributed within and around urbanareas.
2.2. Soils sampling and chemical analysis
The study area was divided into 2 km� 2 km cells, and then the300 sites were designed at the center of each cell. If the designedsite was unavailable for sampling (such as if it contained a road orbuilding), an alternative location was selected as close to theoriginal as possible to find natural soils. At each sampling site, fourto six subsamples of surface soils (0e20 cm) within a 100m radiuswere collected and mixed thoroughly to obtain an approximate1 kg sample, and root tissue, grass and leaves were discarded. Theactual geographic coordinates of the sampling sites were acquiredusing a handheld global positioning system (GPS). Locations of 300sampling sites are shown in Fig. 1. After air-drying, the collectedsoils samples were sieved to 2mm, and ground to powder thatcould pass through a 0.149-mm mesh for physical-chemicalanalysis.
Soil pH, organic matter (OM), total nitrogen (TN), total phos-phorus (TP), and CaCO3 concentrations were measured accordingto the related literature (Lu, 2000; Lv et al., 2013). After digestingthe samples using H2SO4-HNO3-HF, the total concentrations of Cr,Co, Cu, Mn, Ni, V, Pb, and Zn were measured by a flame atomicabsorption spectrophotometer (240 AA Agilent, USA), while Cdwere analyzed by a graphite furnace atomic absorption spectro-photometer (AA-7000 Shimadzu, Japan). Hg concentrations weremeasured by an atomic fluorescence spectrometer (AFS230EHaiguang Analytical Instrument Co., Beijing, China) following thedigestion of H2SO4-HNO3-KMnO4 (Lu, 2000). Analytical reagentblanks were applied in the sample preparation and analyticalprocesses. All measurements were performed in triplicate, andstandard deviations were within ±5% of the mean. The standardreference material (GSS-1) was used to control the measurementerrors, with recoveries of 100% ± 10% for 10 heavy metals.
2.3. Receptor models
2.3.1. APCS/MLRAPCS/MLR, derived from the traditional PCA (Paatero and
Tapper, 1994), was performed using SPSS 16.0 software (SPSS Inc.,USA). First, the raw data are normalized as following:
Zij ¼Cij � Cj
dj(1)
where Cij is the concentration of the jthmetal in ith sample, Cj is themean concentration of the jth metal for all samples, and dj is thestandard deviation of jth metal.
An artificial sample with all concentrations of 0 is introducedand is also normalized:
J. Lv / Environmental Pollution 244 (2019) 72e8374
Z0 ¼ 0� Cj
dj¼ �Cj
dj(2)
The APCS for the factors are estimated by subtracting the factorscores of Z0 from the factor scores of true samples. The contribu-tions to Cj can be obtained by using a multiple linear regressionaccording to the equation below:
Cj ¼ b0 þXpk¼1
bkAPCSk (3)
where b0 is the intercept of regression for jth element, bk is theregression coefficient, p is the number of factors, bkAPCSk is thecontribution of the pth factor to Cj, and the average value of bkAPCSkrepresents the mean contribution of the pth factor to Cj.
2.3.2. PMFPMF modeling was performed using the US-EPA PMF 5.0 pro-
gram (U.S. Environmental Protection Agency, 2014). PMF is amultivariate factor analysis tool to solve the CMB, and the initialdata matrix X with the order of m� n can be expressed as:
X ¼ GF þ E (4)
G (m� p) is the matrix of the factor contribution, F (p� n) is thematrix of the factor profile, and E (m� n) is the residual errormatrix.
E can be written as:
eij ¼Xpk¼1
gikfkj � xij (5)
where i represents elements 1 to m, j represents elements 1 to n,and k represents the source from 1 to p.
Factor contributions and profiles are acquired by the PMFmodel
Fig. 1. The location of study area with sampling sites. a) The location of Shandong provinsampling sites in Guangrao.
minimizing the objective function Q under the constraint of non-negative contributions, and the solution in the US-EPA PMF pro-gram is approximated by Multilinear Engine-2 (ME-2) (Paatero,1999).
Q ¼Xni¼1
Xmj¼1
eijuij
!2
(6)
where uij is the uncertainty in the jth chemical element for sample i.The uncertainty is calculated based on the element-specific
method detection limit (MDL), and error percent is measured bystandard reference materials. Because all the measured contentsare above the MDL, the equations of uncertainty are adopted asfollowing:
Unc ¼ffiffiffiffiffiffiffiffiffiffiffiffiffiffiffiffiffiffiffiffiffiffiffiffiffiffiffiffiffiffiffiffiffiffiffiffiffiffiffiffiffiffiffiffiffiffiffiffiffiffiffiffiffiffiffiffiffiffiffiffiffiffiffiffiffiffiffiffiffiffiffiffiffiffiffiffiffiffiffiffiffiffiffiffiffiffiffiffiffiffiffiffiffiffiffiffiffiffiffiffiffiffiffiffiðErrorFraction� concentrationÞ2 þ ð0:5�MDLÞ2
q(7)
The US-EPA PMF 5.0 program contains a rotation tool that setsan Fpeak value in order to improve oblique edges (Paatero andHopke, 2009; Paatero et al., 2002; U.S. Environmental ProtectionAgency, 2014). Positive Fpeak values sharpen the F and smear theG, while negative Fpeak values have a contrasting transformation.
2.4. Robust geostatistical method
The APCS, PMF-factors and 10 heavy metals were analyzed fortheir spatial structure and variability. Four experimental vario-grams including Matheron's estimator (Matheron, 1963) and threerobust estimators (Cressie and Hawkins's estimator (Cressie andHawkins, 1980), Dowd's estimator (Dowd, 1984), and Genton'sestimator (Genton, 1998)) were used to build the degree of spatialcontinuity and to analyze the range of spatial dependence for APCSand PMF-factors, which were fitted to Spherical, Gaussian andExponential andMat�ernmodels, respectively. Cressie and Hawkins'estimator essentially damps the effect of outliers from the
ce in China, b) the location of Guangrao in Shandong province, c) the location of 300

J. Lv / Environmental Pollution 244 (2019) 72e83 75
secondary process, and is based on the fourth root of the squareddifferences. Dowd's estimator and Genton's estimator are bothscale estimators, they estimate the variogram for a dominantintrinsic process in the presence of outliers. For detailed de-scriptions of these four estimators, please refer to the relatedliterature (Cressie and Hawkins, 1980; Dowd, 1984; Genton, 1998;Goovaerts, 1997; Webster and Oliver, 2007). Experimental vario-grams were calculated using the Georob package (Papritz andSchwierz, 2018) in R 3.3.2 software (R Development Core Team).
The median of the squared deviation ratio (SDR) derived fromcross-validation was used to find the best association of theexperimental variogram fitted to the theoretical model. When thebest association is used for kriging, the median of SDR should beclose to 0.455 (Lark, 2000).
SDR ¼�zðxaÞ � z*ðxaÞ
�2s2KRðxaÞ
(8)
Kriged estimation is expressed as the weighted sums of theadjacent sampled concentrations with different kriging algorithms(Goovaerts, 1997), and ordinary kriging (OK) was conducted usingArcGIS 10.2 (Esri Inc., USA).
3. Results
3.1. Descriptive statistics of soil properties and heavy metals
Descriptive statistics of physical-chemical properties and heavymetals in Guangrao are summarized in Table 1. Themean pH of 8.24suggested that the surface soils had completely alkaline properties,which commonly reduces the mobility of heavy metals (Alloway,2013). OM with a mean value of 1.45% was higher than the back-ground values of Shandong Province (China NationalEnvironmental Monitoring Center, 1990). The mean contents ofTN and TP in topsoil samples were 0.90 and 0.97 g kg�1, which werehigher than their background values (China NationalEnvironmental Monitoring Center, 1990). The mean content ofCaCO3 was 8.66%, varying between 2.48% and 18.95%, and thus thesoils showed relatively high CaCO3 levels.
The mean concentrations of As, Cd, Co, Cr, Cu, Hg, Mn, Ni, Pb andZn were 10.8, 0.13, 11.9, 68.1, 24.0, 0.04, 586, 28.8, 22.6 and67.2mg kg�1, respectively. The contents of As, Cd, Cr, Cu, Ni, Pb andZn in all samples were below level II of the Environmental QualityStandard for Soils (EQSS) of China (State Environmental ProtectionAdministration of China, 1997), which represents the threshold to
Table 1Descriptive statistics of physical-chemical properties and heavy metals in soils.
Unit Range Mean Median SD
pH e 7.81e8.75 8.24 8.22 0.18OM % 0.14e3.41 1.43 1.45 0.43TN g kg�1 0.20e1.66 0.90 0.93 0.23TP g kg�1 0.48e2.32 0.97 0.94 0.26CaCO3 % 2.48e18.95 8.66 9.00 2.75As mg kg�1 5.2e17.2 10.8 10.3 2.64Cd mg kg�1 0.07e0.29 0.13 0.13 0.03Co mg kg�1 6.1e16.9 11.9 11.9 1.83Cr mg kg�1 53.5e94.1 68.1 67.5 5.53Cu mg kg�1 11.8e37.8 24.0 23.7 4.42Hg mg kg�1 0.01e0.54 0.04 0.03 0.04Mn mg kg�1 411e970 586 576 98.46Ni mg kg�1 14.6e43.4 28.8 28.6 5.05Pb mg kg�1 12.6e30.4 22.6 22.8 2.99Zn mg kg�1 34.8e98.6 67.2 66.6 10.63
a Soil background values of Shandong province (China National Environmental Monitb Level II of the Environmental Quality Standard for Soils (EQSS) of China (State Envir
maintain safety in agricultural production and human health, andthere was only one sample with a Hg content slightly above level IIof the EQSS. The average contents of As, Cd, Cr, Cu, Hg, Mn, Ni, andZn exceeded the corresponding background values of ShandongProvince (China National Environmental Monitoring Center, 1990):in particular, the mean contents of Cd and Hg presented at 1.86 and2.5 times the background values, suggesting that these two heavymetals were clearly enriched in topsoils. Hg had the highest coef-ficient of variation (CV), followed by Cd, reflecting a wider extent ofvariability in relation to the means. Hg and Cd showed stronglypositive skewness, which may be attributed to the outliers fromhuman inputs (Lv et al., 2013).
Analysis of variance (ANOVA) was applied to examine the dif-ferences of soil heavy metal concentrations between parent ma-terials and among land use types (Table S1). No significantdifferences were observed for As, Co, Cu, and Pb among land usetypes. Significantly, while urban areas presented the lowest Cr, Mn,Ni and Zn contents and the highest Hg concentration, cultivatedland exhibited the highest Cd content. As, Cd, Co, Cr, Cu, Mn, Ni, Pband Zn presented significantly higher contents in the soils fromlacustrine deposit and the Yellow River alluvium. For Hg, therewere no significant differences among parent materials.
3.2. APCS/MLR modeling
The first three factors were extracted through PCA (Table S2)and explained 83.5% of the total variance. Approximately, 64.8% oftotal variance was explained by Factor 1 (F1), showing stronglypositive loadings of As, Co, Cr, Cu, Mn, Ni, Pb, and Zn, as well asmoderate loading of Cd. F2, accounting for 11.5% of the total datavariance, had highly positive loadings of Hg and amoderate loadingof Pb. F3 amounted to 7.2% of the total variance and was dominatedexclusively by the moderate loading of Cd.
The results of APCS/MLR modeling are shown in Table 2, andTable S3. R2 and the ratio of predicted to observed values were usedto assess the accuracy of APCS/MLR modeling. These two parame-ters varied between 0.63 and 0.94, 0.87 and 1.08, respectively,indicating that APCS-MLR modeling had high accuracy (Table 2).The results of APCS/MLR were consistent with PCA. There weresome negative values explained by F2 and F3, resulting in the As,Co, Cu, Mn, Ni, and Zn contents explained by F1 exceeding theirtotal predicted values. All heavy metals except for Hg were pri-marily contributed by F1, and ranged from 50.4% to 130.1%. Hgexhibited the highest concentration in F2, and was thus dominatedby F2. F2 explained 15.9% of Pb concentration (3.6mg kg�1). F3
Skewness Kurtosis CV Background a Level II of EQSS b
0.28 �0.17 0.02 e e
�0.02 2.02 0.30 1.31 e
�0.70 1.128 0.25 0.82 e
1.16 2.64 0.27 0.66 e
0.07 �0.42 0.32 e e
0.44 �0.5 0.24 8.9 301.1 2.54 0.25 0.07 0.3�0.15 0.22 0.15 12.6 e
0.54 1.08 0.08 64.3 2000.14 0.69 0.18 22.3 1009.99 128.71 0.95 0.016 0.50.91 1.11 0.17 552.00 e
0.09 0.01 0.18 24.4 50�0.77 1.36 0.13 24.5 300�0.08 0.29 0.16 60.9 250
oring Center, 1990).onmental Protection Administration of China, 1997).

Table 2Percentage contribution (%) of each factor for heavy metals derived from APCS/MLR and PMF.
APCS/MLR PMF
Predicted/Observed R2 F1 F2 F3 Unidentified Predicted/Observed R2 F1 F2 F3
As 1.00 0.74 115.4 �2.0 4.7 �18.0 1.00 0.98 84.2 7.0 8.8Cd 1.08 0.88 75.2 1.5 35.9 �12.6 1.03 0.99 61.3 9.1 29.6Co 0.87 0.89 116.3 0.0 �27.3 11.0 0.99 0.90 81.8 7.7 10.4Cr 1.00 0.63 50.4 �0.9 4.9 45.7 0.99 0.62 77.3 8.9 13.8Cu 0.98 0.89 130.1 �1.2 �3.8 �25.1 0.98 0.88 78.9 9.6 11.4Hg 0.93 0.88 12.5 47.9 9.3 30.3 0.94 0.57 47.0 43.1 9.9Mn 1.00 0.86 114.0 �1.4 0.7 �13.4 1.00 0.89 81.9 6.6 11.5Ni 1.11 0.93 110.8 �0.7 5.1 �15.2 0.99 0.93 82.3 7.0 10.7Pb 1.00 0.71 73.5 15.9 �2.5 13.1 0.99 0.80 75.1 13.2 11.7Zn 1.00 0.94 111.8 0.6 �5.2 �7.2 0.99 0.93 80.0 8.8 11.2P
metals e e 107.5 �1.1 0.5 �6.9 e e 81.1 7.3 11.6
J. Lv / Environmental Pollution 244 (2019) 72e8376
contributed to the 35.9% of Cd variation but explained very smallproportions of the other nine heavy metals. The unaccounted part,referring to the intercepts of regressions, varied from �25.1% to45.7%, with the highest values for Cr. The source contributions to S
metals of the three factors were also calculated by the APCS/MLR.F1 dominated the S metals with the contribution of 107.5%, whileF2 and F3 explained merely �1.1% and 0.5% of the S metals.
3.3. PMF modeling
PMF modeling with the use of three factors was determined bytrying factor numbers ranging from 1 to 6, and then using therotational tool when running the model to improve oblique edges(Paatero and Hopke, 2009). The optimal three factors were derivedfrom a run with the Fpeak of �0.5 and Q (robust) of 3257 and areshown in Table 2, and Table S3. The ratios of predicted to observedvalues were close to 1, and R2 varied between 0.57 and 0.99; indi-cating a good fit for PMF modeling (Table 2). As, Cd, Co, Cr, Cu, Mn,Ni, Pb, and Zn had the highest concentrations in F1 and wereinfluenced by F1 with a contribution ranging from 61.3% to 84.2%.F1 contributed to 47.0% of the Hg variation, roughly equivalent to F2(43.1%), and Pb had 13.2% of concentration related to F2. F3 domi-nated 29.6% of Cd and presented small contributions to other heavymetals. The strongest contribution to the
Pmetals in soils was F1,
with a contribution of 81.1%, followed by F3 (11.6%) and F2 (7.3%) inturn.
The results calculated from PMFwere consistent with APCS/MLRin terms of three factors. However, APCS/MLR had some negativecontributions and unidentified parts and may have some limits. F1arising from two models commonly showed high contributions forAs, Cd, Co, Cr, Cu, Mn, Ni, Pb, and Zn. Hg and Pb were significantlyexplained by both F1 and F2, while F3 had the highest relation forCd only.
3.4. Geostatistical analysis
The results of variogram fitting for APCS and PMF-factors areindicated in Fig. 2 and Table S4. Through comparing the median ofSDR with 0.455, Dowd's variogram fitted to a Gaussian model werethe best for APC1 and APC3, and Genton's variogram fitted to anexponential model was the most suitable for APC2. Dowd's vario-gram fitted to spherical and Gaussian models were used for PMF-F1and PMF-F2, while Genton's variogram fitted to a Gaussian modelcorresponded to PMF-F3. The experimental variograms of corre-sponding APCS and PMF-factors showed their significant differ-ences (Fig. 2), which could be attributed to the different algorithmsof PMF and ACPS/MLR. The nugget/sill ratio can be regarded aparameter to classify the spatial dependence of soil factors. Thenugget/sill ratio varied from 0.365 for APC 1 and 0.622 for PMF-F1,
0.196 for APC 2 and 0.455 for PMF-F2, 0.536 for APC 3 and 0.265 forPMF-F3, indicated the different spatial dependence of corre-sponding APCS and PMF-factor. Range is another important geo-statistical parameter considered to be the distance beyond whichobservations are not spatially dependent. The ranges of APC 1 andPMF-F1, APC 3 and PMF-F3 were similar, but APC 2 and PMF-F2were different. The variogram fitting results for log-transformedheavy metals are shown in Table S5 and Fig. 3. The best associa-tions of experimental variograms fitted to theoretical modelsdiffered among 10 heavy metals.
Kriged maps of APCS, PMF-factors and 10 heavy metals areillustrated in Fig. 4 and Fig. 5. It is clearly implied that the spatialdistribution of APCS was quietly in accordance with the corre-sponding PMF-factor (Fig. 4). Furthermore, heavy metals and theircorresponding APCS and PMF-factor had analogous distributions(Figs. 4 and 5). APC 1, PMF-F1, As, Cd, Co, Cr, Cu, Mn, Ni, Pb, and Znshowed similar patterns (Fig. 4a1, b1 and 5a, b, c, d, e, g, h, i, j) andwere characterized by the significant north-south trend withhigher values in the north part, which coincided with parent ma-terials (Fig. S1b). The common hotspot of APC2, PMF-F2, Hg and Pbwas located at the southwest region corresponding to nearby urbanareas and followed a decreasing trend from the center to the pe-riphery (Fig. 4a2, b2, and 5f, i). APC3, PMF-F3 and Cd presented highvalues in the northern and southern zones, as well as low values inthe central region (Fig. 4a3, b3, and 5b).
4. Discussion
4.1. Source interpretation of factor 1
As, Cd, Cu, Mn, Pb, and Zn associated with Co, Cr and Ni had highand positive loadings in the F1 (Table 2, and Table S3) through PMFand APCS/MLRmodeling, and the contributions of F1 to these heavymetals by PMF were close to the respective background values(Table 1), suggesting a strong lithogenic source of this group of nineheavymetals by the parent materials (Nanos and RodríguezMartin,2012). The concentrations of Co, Cr and Ni in soils highly rely ontheir contents in parent rocks, and human inputs of Co, Cr and Nifrom fertilizers, limestone, and manure are commonly lower thantheir background contents in soils (Alloway, 2013; Facchinelli et al.,2001; Rodríguez Martín et al., 2006). Co, Cr and Ni grouped in thesame factor by the PCA and PMF are commonly considered as theindicator of a natural source, which has been clearly demonstratedby the works of Rodríguez Martín et al. (2006) in the Ebro riverbasin, Nanos and Rodríguez Martin (2012) in the Duero river basin,Lv et al. (2015a) in Ju County, Facchinelli et al. (2001) in Piemonte,Xue et al. (2014) in Changxing, and Jiang et al. (2017) in Changshu.
Based on kriged maps of APCS and PMF-factors and ANOVAresults (Fig. 4, Table S1), we confirmed that As, Cd, Co, Cr, Cu, Mn, Ni,
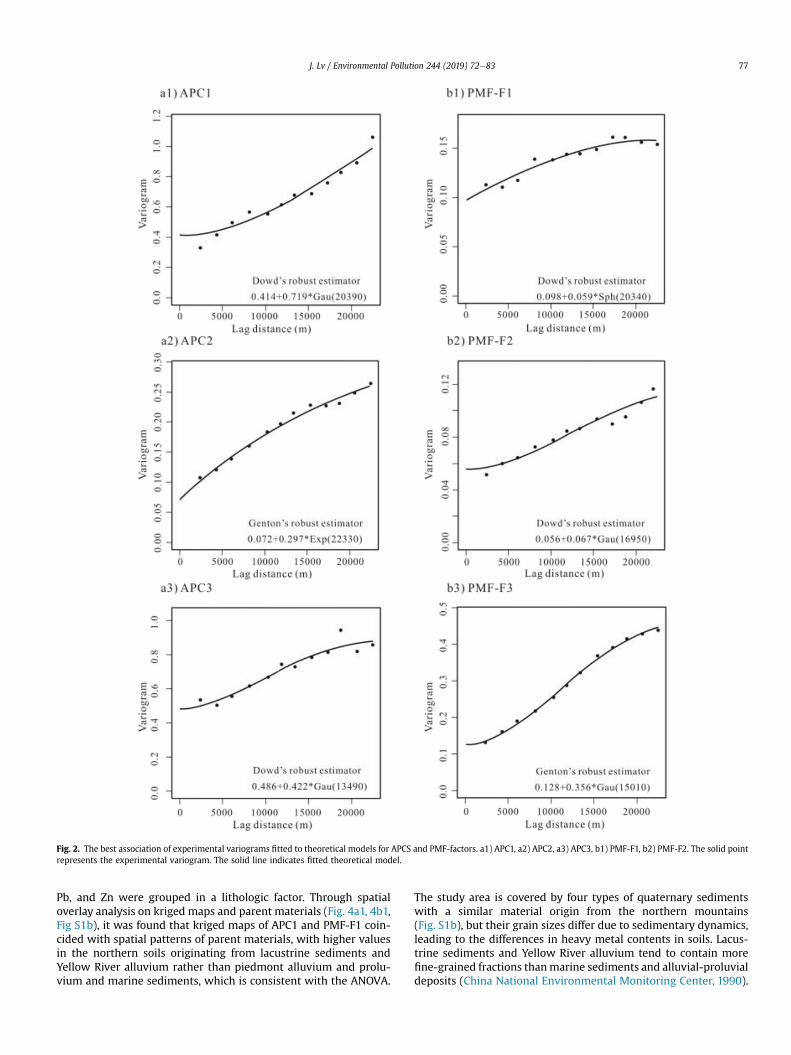
Fig. 2. The best association of experimental variograms fitted to theoretical models for APCS and PMF-factors. a1) APC1, a2) APC2, a3) APC3, b1) PMF-F1, b2) PMF-F2. The solid pointrepresents the experimental variogram. The solid line indicates fitted theoretical model.
J. Lv / Environmental Pollution 244 (2019) 72e83 77
Pb, and Zn were grouped in a lithologic factor. Through spatialoverlay analysis on kriged maps and parent materials (Fig. 4a1, 4b1,Fig S1b), it was found that kriged maps of APC1 and PMF-F1 coin-cided with spatial patterns of parent materials, with higher valuesin the northern soils originating from lacustrine sediments andYellow River alluvium rather than piedmont alluvium and prolu-vium and marine sediments, which is consistent with the ANOVA.
The study area is covered by four types of quaternary sedimentswith a similar material origin from the northern mountains(Fig. S1b), but their grain sizes differ due to sedimentary dynamics,leading to the differences in heavy metal contents in soils. Lacus-trine sediments and Yellow River alluvium tend to contain morefine-grained fractions thanmarine sediments and alluvial-proluvialdeposits (China National Environmental Monitoring Center, 1990).

Fig. 3. The best association of experimental variograms fitted to theoretical models for log-transformed concentrations of As (a), Cd (b), Co (c), Cr (d), Cu (e), Hg (f), Mn (g), Ni (h), Pb(i), and Zn (j). The solid point represents the experimental variogram. The solid line indicates fitted theoretical model.
J. Lv / Environmental Pollution 244 (2019) 72e8378
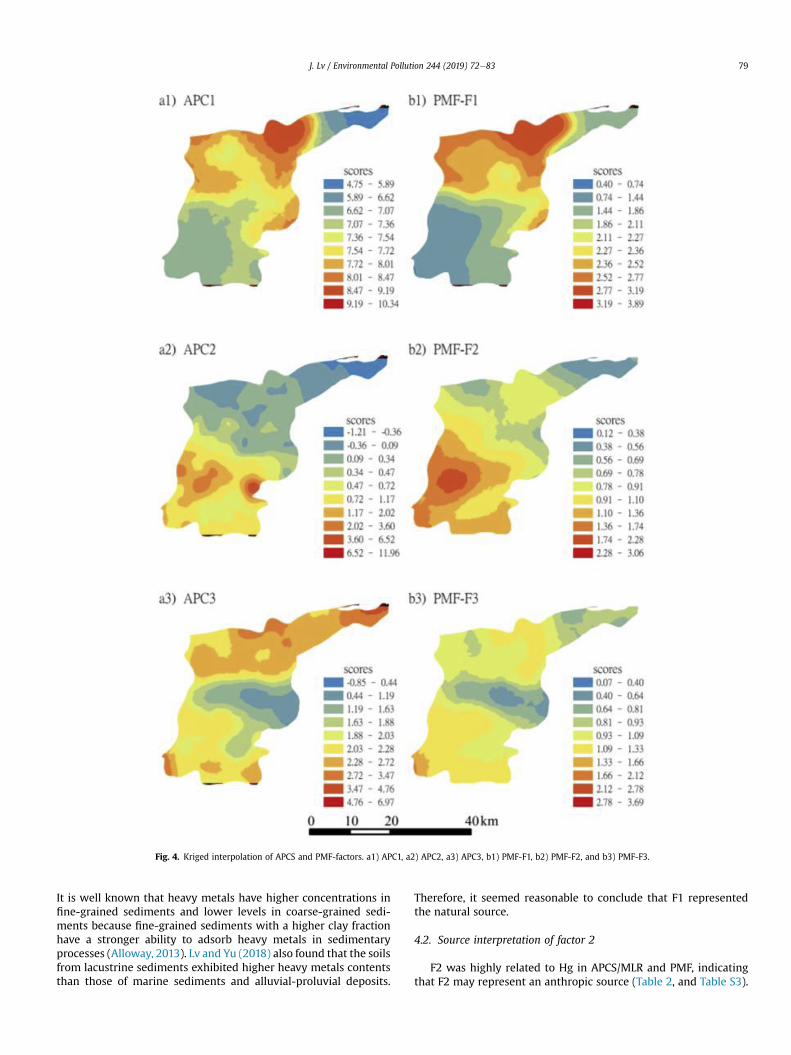
Fig. 4. Kriged interpolation of APCS and PMF-factors. a1) APC1, a2) APC2, a3) APC3, b1) PMF-F1, b2) PMF-F2, and b3) PMF-F3.
J. Lv / Environmental Pollution 244 (2019) 72e83 79
It is well known that heavy metals have higher concentrations infine-grained sediments and lower levels in coarse-grained sedi-ments because fine-grained sediments with a higher clay fractionhave a stronger ability to adsorb heavy metals in sedimentaryprocesses (Alloway, 2013). Lv and Yu (2018) also found that the soilsfrom lacustrine sediments exhibited higher heavy metals contentsthan those of marine sediments and alluvial-proluvial deposits.
Therefore, it seemed reasonable to conclude that F1 representedthe natural source.
4.2. Source interpretation of factor 2
F2 was highly related to Hg in APCS/MLR and PMF, indicatingthat F2 may represent an anthropic source (Table 2, and Table S3).

Fig. 5. Kriged interpolation of the concentration of As (a), Cd (b), Co (c), Cr (d), Cu (e), Hg (f), Mn (g), Ni (h), Pb (i), and Zn (j).
J. Lv / Environmental Pollution 244 (2019) 72e8380

J. Lv / Environmental Pollution 244 (2019) 72e83 81
The mean concentration of Hg was almost two times the back-ground value of Shandong Province with the maximum value of0.537mg kg�1, and 43.1% of the Hg concentration was explained byPMF-F2. The hotspots for APC2, PMF-F2 and Hg were exclusivelylocated around urban areas with dense industrial factories andtraffic lines (Fig. 4a2, 4b2, 5f, and Fig S1a), and Hg was 0.09mg kg�1
in urban areas, which is almost 6 times more than the backgroundvalues (Table 1, Table S1). The anthropic sources of Hg in PCA havebeen clearly demonstrated in previous works (Cai et al., 2012; Lvet al., 2013), where Hg was grouped in an isolated factor. It couldbe inferred that F2 may represent the atmospheric deposition ofhuman emissions.
There are several coal-fired plants and factories in Gurangraowith an annual consumption of 2 million tons (GurangraoMunicipal Bureau of Statistics, 2016), and coal combustion iscommonly regarded as the most important source of Hg in China(Wu et al., 2016; Ying et al., 2017; Zheng et al., 2011). The averageHg concentration in coal in China is 0.17mg kg�1 (Zhang et al.,2012a). The chemical behaviors of Hg in the combustion processare significantly different from other metals due to its high vola-tility (Vejahati et al., 2010; Xu et al., 2004). At temperatures over700 �C, almost 100% of Hg in coal is output to flue gas with threetypes of speciation, including gaseous elementary Hg (Hg0),gaseous oxidized Hg (Hg2þ), and particle-bound Hg (Wang et al.,2012; Xu et al., 2004; Zhu et al., 2016). Particle-bound Hg andgaseous Hg2þ could be effectively captured by the electrostaticprecipitators (ESP) and wet flue gas desulfurization (WFGD),respectively, which have been equipped in the coal-fired powerplants and factories in Guangrao. However, the water-insoluble Hg0
is resistant to being captured by the ESP and WFGD, and can easilyescape to the atmosphere. Srivastava et al. (2006) reported that ESPand ESP þWFGD could remove only 38.6% and 46.9% of Hg in fluegas, respectively. Hg0 accounts for more than 70% of the total Hgemission from coal combustion after the retaining of scrubbers(Yang et al., 2012). Hg in the atmosphere could enter soils throughdry and wet atmospheric deposition (Lindberg et al., 2007; Lv et al.,2013), and Rodríguez Martin and Nanos (2016) found that most ofthe emitted mercury was deposited within 15 km from the powerplants. As, Cd, Co, Cr, Cu, Mn, Ni, Pb, and Zn are mid- or low-volatileelements (Xu et al., 2004) and are mainly distributed in the fly ashand bottom ash with little vapor in the coal-fired process;ESPþWFGD scrubbers are sufficient to remove these metals in fluegas (Zhu et al., 2016). Deng et al. (2014) found that the percentagesof removal for Pb, Mn and Cd through ESPþWFGD reached 95e99%in six coal-fired power plants in China. Zhao et al. (2017) found thatthe overall removal rates of Cr, Mn, Co, Ni, Cu, Zn, As, Ba, and Pb byESPþWFGD were higher than 99.9% in a 100 MW coal-fired powerplant. Therefore, coal combustion contributed a much higher pro-portion of Hg compared with the other nine metals.
Additionally, there are 10 oil-refining factories in the region dueto its proximity to the Shengli oil field, the second largest oil field inChina, with a total annual crude oil-processing capacity ofapproximately 3 million tons (Gurangrao Municipal Bureau ofStatistics, 2016). Heavy metals with medium and low volatilitiescombined with sulfur and nitrogen could be effectively removed byhydro-processing (HDT), with the exception of the highly volatileHg (Zheng et al., 2011). According to the work of Wilhelm in theUSA (Wilhelm, 2001), approximately 20% of Hg in crude oil escapesto the atmosphere in the refining process, approximately 25% iscontained in solid and liquid waste from refineries, and approxi-mately 55% is finally deposited in products on the market. There-fore, oil-refining processes could be another source of Hg.
After analyzing coal combustion and oil refining processes, it isclear that both of these two human inputs contributed a muchhigher proportion of Hg than other heavy metals due to its high
volatility, which is consistent with the findings of exclusively highHg loading in F2 and relatively low loading of other heavy metals inPMF and APCS/MLR. Additionally, 13.2% of Pb concentration wascontrolled by F2 in PMF modeling, and Pb had a hotspot with highvalues in the urban area (Fig. 5i), suggesting that F2 was also relatedto traffic emissions. Tetraethyl lead was historically used as anantiknock agent in gasoline, where it was emitted into the atmo-sphere through combustion and then entered soils through atmo-spheric deposition. Though tetraethyl lead has been banned inChina since 2000 (Chen et al., 2012), the historical Pb emissionsfromvehicles still exist in soils. Consequently, we confirmed that F2was related to the dry and wet atmospheric deposition of coalcombustions, oil refining and traffic emissions.
4.3. Source interpretation of factor 3
F3 was dominated exclusively by Cd in PCA and PMF andexplained 29.6% of the Cd concentration in PMF modeling (Table 2,and Table S3). The high values of APC3, PMF-F3 and Cd weredistributed in the central and north parts of the study area (Fig. 4a3,4b3, 5b, and Fig. S1b), coinciding with the spatial distribution ofvegetable-producing soils. The amount of fertilizer applications invegetable-producing soils is 5e10 times greater than that of othercultivated land to maintain this area's vast productivity (Liu et al.,2008). Cd, as an inherent component of phosphate rock, is trans-ferred to phosphate fertilizers (Mortvedt, 1996; Nziguheba andSmolders, 2008), and thus Cd is commonly an indicator of theapplication of chemical fertilizers. The application of chemicalfertilizers on the study area in 2016 was 1468 kg hm�2, and thephosphate, nitrate, potassium, and compound fertilizers accountedfor 33.6%, 19.9%, 8.7% and 37.8% of the total application amount,respectively (Gurangrao Municipal Bureau of Statistics, 2016). InChina, the mean Cd contents in phosphate rock and phosphatefertilizer are 0.98 and 0.6mg kg�1 (Lu et al., 1992), and compoundfertilizers have a mean Cd content of 0.18mg kg�1 (Wang and Ma,2004), which is much higher than the background values in soils(Table 1). Meanwhile, the mean Cd contents in the nitrate andpotassium fertilizers are 0.0005 and 0.05mg kg�1, significantlylower than those in phosphate and compound fertilizers and thebackground values in soils. The levels of Cu, Hg, Mn, Pb and Zn in allfour fertilizers are lower than their background values in soils.Therefore, the application of chemical fertilizers could elevate Cdlevels in agricultural soils more significantly than other metals, inagreement with the prominent loading of Cd in F3. RodríguezMartín et al. (2013), Gil et al. (2004), Lu et al. (2012), Chen et al.(2008), and Lv et al. (2015a) found that Cd combined with othermetals in the same group could indicate inputs from agriculturalpractices. It could be concluded that F3 represented agriculturalpractices.
4.4. Source contribution of heavy metals in soils
Once we determined the sources related to various factors, thesource contributions of heavy metals could be easily determined.PMF and APCS/MLR afforded three similar factors with comparablecontributions. PMF were calculated under the circumstances of anon-negative constraint; therefore, the contributions values fromPMF were all non-negative, while APCS/MLR showed some nega-tive and unidentified contributions. Therefore, PMF could providemore rational source contributions than APCS/MLR and wasadopted for source apportionment. Khairy and Lohmann (2013),Sofowote et al. (2010), Sofowote et al. (2008), Stout and Graan(2010) found that PMF could afford better source apportionmentof pollutants in the atmosphere, soils and sediments than APCS/MLR.
J. Lv / Environmental Pollution 244 (2019) 72e8382
Co, Cr, Cu, Mn, Ni, and Zn were dominated by parent materials,with their contributions varying from 77.3% to 84.2%, and mainlyoriginated from a natural source. Hg originated equally from theparent materials and atmospheric deposition of human emissions,with contributions of 47.0% and 43.1%, respectively. Pb wasexplained by parent materials with a contribution of 75.1%, butatmospheric deposition from human emissions also accounted for13.2% of Pb. Cd was mainly controlled by parent materials andagricultural practices, with percentages of 61.3% and 29.6%,respectively. In total, 81.1% of the sum of heavy metal contentsoriginated from natural sources, and atmospheric deposition ofhuman emissions and agricultural practices contributed only 7.3%and 11.6% of the total heavy metal contents.
5. Conclusions
In this study, we combined two multivariate receptor modelsand robust geostatistics to estimate source apportionment of heavymetals in soils of Guangrao, eastern China. PMF with the non-negative constraint afforded better source apportionment resultsthan APCS/MLR. Although the best association of experimentalvariograms fitted to theoretical models differed between the cor-responding APCS and PMF-factors, they showed similar spatialvariability. Three sources were determined including naturalsource, atmosphere deposition of human emissions, and agricul-tural practices, explaining 81.1%, 7.3%, and 11.6% of the total of 10heavy metals concentrations, respectively. Parent material was thedominate source of As, Co, Cr, Cu, Mn, Ni, and Zn, with the contri-butions varying from 77.3% to 84.2%. Hg originated from equallyparent materials (47.0%) and atmosphere deposition of humanemissions (43.1%). 75.1% of Pb concentration was associated withparent materials, and was also influenced by atmosphere deposi-tion of human inputs (13.2%). Cd was related to parent materialsand agricultural practices, with the contribution of 61.3% and 29.6%,respectively.
Acknowledgement
This study was jointly funded by National Natural ScienceFoundation of China (No. 41601549), Natural Science Foundation ofShandong Province (No.ZR2016DQ11), and Open Research Fund ofState Key Laboratory of Estuarine and Coastal Research (SKLEC-KF201710).
Appendix A. Supplementary data
Supplementary data to this article can be found online athttps://doi.org/10.1016/j.envpol.2018.09.147.
References
Alloway, B., 2013. Heavy Metals in Soils. Springer, Dordrecht.Cai, L.M., Xu, Z.C., Ren, M.Z., Guo, Q.W., Hu, X.B., Hu, G.C., Wan, H.F., Peng, P.G., 2012.
Source identification of eight hazardous heavy metals in agricultural soils ofHuizhou, Guangdong Province, China. Ecotoxicol. Environ. Saf. 78, 2e8.
Chen, H.Y., Teng, Y.G., Chen, R.H., Li, J., Wang, J.S., 2016. Contamination character-istics and source apportionment of trace metals in soils around Miyun Reser-voir. Environ. Sci. Pollut. Res. 23, 15331e15342.
Chen, H.Y., Teng, Y.G., Lu, S.J., Wang, Y.Y., Wang, J.S., 2015. Contamination featuresand health risk of soil heavy metals in China. Sci. Total Environ. 512, 143e153.
Chen, T., Liu, X.M., Zhu, M.Z., Zhao, K.L., Wu, J.J., Xu, J.M., Huang, P.M., 2008. Iden-tification of trace element sources and associated risk assessment in vegetablesoils of the urban-rural transitional area of Hangzhou, China. Environ. Pollut.151, 67e78.
Chen, X.D., Lu, X.W., Yang, G., 2012. Sources identification of heavy metals in urbantopsoil from inside the Xi'an Second Ringroad, NW China using multivariatestatistical methods. Catena 98, 73e78.
China National Environmental Monitoring Center, 1990. Background Concentrationsof Elements in Soils of China. China Environmental Science Press, Beijing.
Cressie, N., Hawkins, D.M., 1980. Robust estimation of the variogram.1. Math. Geol.12, 115e125.
Deng, S., Shi, Y.J., Liu, Y., Zhang, C., Wang, X.F., Cao, Q., Li, S.G., Zhang, F., 2014.Emission characteristics of Cd, Pb and Mn from coal combustion: field study atcoal-fired power plants in China. Fuel Process. Technol. 126, 469e475.
Dowd, P.A., 1984. The variogram and kriging: robust and resistant estimators. In:Verly, G., David, M., Journel, A.G., Marechal, A. (Eds.), Geostatistics for NaturalResources Characterization (Part 1). Reidel, Dordrecht, pp. 91e106.
Facchinelli, A., Sacchi, E., Mallen, L., 2001. Multivariate statistical and GIS-basedapproach to identify heavy metal sources in soils. Environ. Pollut. 114, 313e324.
Genton, M.G., 1998. Highly robust variogram estimation. Math. Geol. 30, 213e221.Gil, C., Boluda, R., Ramos, J., 2004. Determination and evaluation of cadmium, lead
and nickel in greenhouse soils of Almerı
a (Spain). Chemosphere 55, 1027e1034.Goovaerts, P., 1997. Geostatistics for Natural Resources Evaluation. Oxford Univer-
sity Press, New York.Gurangrao Municipal Bureau of Statistics, 2016. Gruangrao Statistical Year Book in
2016. China Statistics Press, Beijing.Huang, Y., Li, T.Q., Wu, C.X., He, Z.L., Japenga, J., Deng, M., Yang, X., 2015. An inte-
grated approach to assess heavy metal source apportionment in pen-urbanagricultural soils. J. Hazard Mater. 299, 540e549.
Jiang, Y.X., Chao, S.H., Liu, J.W., Yang, Y., Chen, Y.J., Zhang, A.C., Cao, H.B., 2017. Sourceapportionment and health risk assessment of heavy metals in soil for a town-ship in Jiangsu Province, China. Chemosphere 168, 1658e1668.
Kabata-Pendias, A., Mukherjee, A.B., 2007. Trace Elements from Soil to Human.Springer Verlag, Berlin.
Kabata-Pendias, A., Pendias, H., 2001. Trace Elements in Soils and Plants. CSC press,London.
Khairy, M.A., Lohmann, R., 2013. Source apportionment and risk assessment ofpolycyclic aromatic hydrocarbons in the atmospheric environment of Alexan-dria, Egypt. Chemosphere 91, 895e903.
Lark, R.M., 2000. A comparison of some robust estimators of the variogram for usein soil survey. Eur. J. Soil Sci. 51, 137e157.
Lee, E., Chan, C.K., Paatero, P., 1999. Application of positive matrix factorization insource apportionment of particulate pollutants in Hong Kong. Atmos. Environ.33, 3201e3212.
Li, J.L., He, M., Han, W., Gu, Y.F., 2009. Analysis and assessment on heavy metalsources in the coastal soils developed from alluvial deposits using multivariatestatistical methods. J. Hazard Mater. 164, 976e981.
Liang, J., Feng, C.T., Zeng, G.M., Gao, X., Zhong, M.Z., Li, X.D., Li, X., He, X.Y., Fang, Y.L.,2017. Spatial distribution and source identification of heavy metals in surfacesoils in a typical coal mine city, Lianyuan, China. Environ. Pollut. 225, 681e690.
Lindberg, S., Bullock, R., Ebinghaus, R., Engstrom, D., Feng, X.B., Fitzgerald, W.,Pirrone, N., Prestbo, E., Seigneur, C., 2007. A synthesis of progress and un-certainties in attributing the sources of mercury in deposition. Ambio 36,19e32.
Liu, Y., Lv, J.S., Zhang, B., Bi, J., 2013. Spatial multi-scale variability of soil nutrients inrelation to environmental factors in a typical agricultural region, Eastern China.Sci. Total Environ. 450, 108e119.
Liu, Z., Jiang, L., Zhang, W., Zheng, F., Wang, M., Lin, H., 2008. Evolution of fertil-ization rate and variation of soil nutrient contents in greenhouse vegetablecultivation in Shandong. Acta Pedol. Sin. 45, 206e303.
Lu, A.X., Wang, J.H., Qin, X.Y., Wang, K.Y., Han, P., Zhang, S.Z., 2012. Multivariate andgeostatistical analyses of the spatial distribution and origin of heavy metals inthe agricultural soils in Shunyi, Beijing, China. Sci. Total Environ. 425, 66e74.
Lu, J.H., Jiang, P.P., Wu, L.S., Chang, A.C., 2008. Assessing soil quality data by positivematrix factorization. Geoderma 145, 259e266.
Lu, R.K., 2000. Analysis Method of Soil and Agricultural Chemistry. China Agricul-tural Science & Technology Press, Beijing.
Lu, R.K., Shi, Z.Y., Xiong, L.M., 1992. Cadmium contents of rock phosphates andphosphate fertilizers of China and their effects on ecological environment. ActaPedol. Sin. 29, 150e157.
Luo, X.S., Xue, Y., Wang, Y.L., Cang, L., Xu, B., Ding, J., 2015. Source identification andapportionment of heavy metals in urban soil profiles. Chemosphere 127,152e157.
Lv, J., Liu, Y., Zhang, Z., Dai, B., 2014. Multivariate geostatistical analyses of heavymetals in soils: spatial multi-scale variations in Wulian, Eastern China. Eco-toxicol. Environ. Saf. 107, 140e147.
Lv, J., Liu, Y., Zhang, Z., Dai, J., 2013. Factorial kriging and stepwise regressionapproach to identify environmental factors influencing spatial multi-scalevariability of heavy metals in soils. J. Hazard Mater. 261, 387e397.
Lv, J., Yu, Y., 2018. Source identification and spatial distribution of metals in soils in atypical area of the lower Yellow River, eastern China. Environ. Sci. Pollut. Res.25, 21106e21117.
Lv, J.S., Liu, Y., Zhang, Z.L., Dai, J.R., Dai, B., Zhu, Y.C., 2015a. Identifying the originsand spatial distributions of heavy metals in soils of Ju country (Eastern China)using multivariate and geostatistical approach. J. Soils Sediments 15, 163e178.
Lv, J.S., Liu, Y., Zhang, Z.L., Zhou, R.J., Zhu, Y.C., 2015b. Distinguishing anthropogenicand natural sources of trace elements in soils undergoing recent 10-year rapidurbanization: a case of Donggang, Eastern China. Environ. Sci. Pollut. Res. 22,10539e10550.
Matheron, G., 1963. Principles of geostatistics. Econ. Geol. 58, 1246e1266.Mortvedt, J.J., 1996. Heavy metal contaminants in inorganic and organic fertilizers.
Fert. Res. 43, 55e61.Nanos, N., Rodríguez Martin, J.A., 2012. Multiscale analysis of heavy metal contents
in soils: spatial variability in the Duero river basin (Spain). Geoderma 189,

J. Lv / Environmental Pollution 244 (2019) 72e83 83
554e562.Nziguheba, G., Smolders, E., 2008. Inputs of trace elements in agricultural soils via
phosphate fertilizers in European countries. Sci. Total Environ. 390, 53e57.Paatero, P., 1999. The multilinear engine - a table-driven, least squares program for
solving multilinear problems, including the n-way parallel factor analysismodel. J. Comput. Graph Stat. 8, 854e888.
Paatero, P., Hopke, P.K., 2009. Rotational tools for factor Analytic models. J. Chemom.23, 91e100.
Paatero, P., Hopke, P.K., Song, X.H., Ramadan, Z., 2002. Understanding and con-trolling rotations in factor analytic models. Chemometr. Intell. Lab. Syst. 60,253e264.
Paatero, P., Tapper, U., 1994. Positive matrix factorization - a nonnegative factormodel with optimal utilization of error-estimates of data values. Environmetrics5, 111e126.
Papritz, A., Schwierz, C., 2018. R Package Georob: Robust Geostatistical Analysis ofSpatial Data. https://cran.r-project.org/web/packages/georob/index.html.
PriyaDarshini, S., Sharma, M., Singh, D., 2016. Synergy of receptor and dispersionmodelling: quantification of PM10 emissions from road and soil dust notincluded in the inventory. Atmos. Pollut. Res. 7, 403e411.
Qu, M.K., Li, W.D., Zhang, C.R., Wang, S.Q., Yang, Y., He, L.Y., 2013. Source appor-tionment of heavy metals in soils using multivariate statistics and geostatistics.Pedosphere 23, 437e444.
Rodríguez Martín, J.A., Arias, M.L., Corbi, J.M.G., 2006. Heavy metals contents inagricultural topsoils in the Ebro basin (Spain). Application of the multivariategeoestatistical methods to study spatial variations. Environ. Pollut. 144,1001e1012.
Rodríguez Martín, J.A., Ramos-Miras, J.J., Boluda, R., Gil, C., 2013. Spatial relations ofheavy metals in arable and greenhouse soils of a Mediterranean environmentregion (Spain). Geoderma 200, 180e188.
Rodríguez Martin, J.A., De Arana, C., Ramos-Miras, J.J., Gil, C., Boluda, R., 2015.Impact of 70 years urban growth associated with heavy metal pollution. En-viron. Pollut. 196, 156e163.
Rodríguez Martin, J.A., Nanos, N., 2016. Soil as an archive of coal-fired power plantmercury deposition. J. Hazard Mater. 308, 131e138.
Rodriguez, J.A., Nanos, N., Grau, J.M., Gil, L., Lopez-Arias, M., 2008. Multiscaleanalysis of heavy metal contents in Spanish agricultural topsoils. Chemosphere70, 1085e1096.
Sajn, R., Halamic, J., Peh, Z., Galovic, L., Alijagic, J., 2011. Assessment of the naturaland anthropogenic sources of chemical elements in alluvial soils from the DravaRiver using multivariate statistical methods. J. Geochem. Explor. 110, 278e289.
Siegel, F.R., 2001. Environmental Geochemistry of Potentially Toxic Metals. Springer,Berlin.
Sofowote, U.M., Allan, L.M., McCarry, B.E., 2010. A comparative study of two factoranalytic models applied to PAH data from inhalable air particulate collected inan urban-industrial environment. J. Environ. Monit. 12, 425e433.
Sofowote, U.M., McCarry, B.E., Marvin, C.H., 2008. Source apportionment of PAH inHamilton Harbour suspended sediments: comparison of two factor analysismethods. Environ. Sci. Technol. 42, 6007e6014.
Srivastava, R.K., Hutson, N., Martin, B., Princiotta, F., Staudt, J., 2006. Control ofmercury emissions from coal-fired in electric utility boilers. Environ. Sci.Technol. 40, 1385e1393.
State Environmental Protection Administration of China, 1997. EnvironmentalQuality Standard for Soils (GB15618-1995). Standards Press of China, Beijing.
Stout, S.A., Graan, T.P., 2010. Quantitative source apportionment of PAHs in sedi-ments of little menomonee river, Wisconsin: weathered creosote versus urbanbackground. Environ. Sci. Technol. 44, 2932e2939.
Thurston, G.D., Spengler, J.D., 1985. A quantitative assessment of source contribu-tions to inhalable particulate matter pollution in metropolitan Boston. Atmos.Environ. 19, 9e25.
U.S. Environmental Protection Agency, 2014. EPA Positive Matrix Factorization(PMF) 5.0 Fundamentals and User Guide. https://www.epa.gov/sites/production/files/2015-02/documents/pmf_5.0_user_guide.pdf.
Vaccaro, S., Sobiecka, E., Contini, S., Locoro, G., Free, G., Gawlik, B.M., 2007. Theapplication of positive matrix factorization in the analysis, characterisation anddetection of contaminated soils. Chemosphere 69, 1055e1063.
Vanek, A., Grosslova, Z., Mihaljevic, M., Ettler, V., Trubac, J., Chrastny, V., Penizek, V.,Teper, L., Cabala, J., Voegelin, A., Zadorova, T., Oborna, V., Drabek, O., Holubik, O.,Houska, J., Pavlu, L., Ash, C., 2018. Thallium isotopes in metallurgical wastes/contaminated soils: a novel tool to trace metal source and behavior. J. HazardMater. 343, 78e85.
Vejahati, F., Xu, Z., Gupta, R., 2010. Trace elements in coal: associations with coaland minerals and their behavior during coal utilization e a review. Fuel 89,904e911.
Wang, Q., Ma, Z., 2004. Heavy metals in chemical fertilizer and environmental risk.Rural Eco-Environ. 20, 62e64.
Wang, S.X., Zhang, L., Zhao, B., Meng, Y., Hao, J.M., 2012. Mitigation potential ofmercury emissions from coal-fired power plants in China. Energy Fuel. 26,4635e4642.
Webster, R., Oliver, M.A., 2007. Geostatistics for Environmental Scientists. Wiley,Chichester.
Wilhelm, S.M., 2001. Estimate of mercury emissions to the atmosphere from pe-troleum. Environ. Sci. Technol. 35, 4704e4710.
Wu, Q.R., Wang, S.X., Li, G.L., Liang, S., Lin, C.J., Wang, Y.F., Cai, S.Y., Liu, K.Y., Hao, J.M.,2016. Temporal trend and spatial distribution of speciated atmospheric mer-cury emissions in China during 1978-2014. Environ. Sci. Technol. 50,13428e13435.
Xu, M.H., Yan, R., Zheng, C.G., Qiao, Y., Han, J., Sheng, C.D., 2004. Status of traceelement emission in a coal combustion process: a review. Fuel Process. Technol.85, 215e237.
Xue, J.L., Zhi, Y.Y., Yang, L.P., Shi, J.C., Zeng, L.Z., Wu, L.S., 2014. Positive matrixfactorization as source apportionment of soil lead and cadmium around abattery plant (Changxing County, China). Environ. Sci. Pollut. Res. 21,7698e7707.
Yang, Y.F., Huang, Q.F., Wang, Q., 2012. Ignoring emissions of Hg from coal ash anddesulfurized Gypsum will lead to ineffective mercury control in coal-fired po-wer plants in China. Environ. Sci. Technol. 46, 3058e3059.
Ying, H., Deng, M.H., Li, T.Q., Jan, J.P.G., Chen, Q.Q., Yang, X.E., He, Z.L., 2017.Anthropogenic mercury emissions from 1980 to 2012 in China. Environ. Pollut.226, 230e239.
Zhang, L., Wang, S.X., Meng, Y., Hao, J.M., 2012a. Influence of mercury and chlorinecontent of coal on mercury emissions from coal-fired power plants in China.Environ. Sci. Technol. 46, 6385e6392.
Zhang, Y., Guo, C.S., Xu, J., Tian, Y.Z., Shi, G.L., Feng, Y.C., 2012b. Potential sourcecontributions and risk assessment of PAHs in sediments from Taihu Lake, China:comparison of three receptor models. Water Res. 46, 3065e3073.
Zhao, S.L., Duan, Y.F., Wang, C.P., Liu, M., Lu, J.H., Tan, H.Z., Wang, X.B., Wu, L.T., 2017.Migration behavior of trace elements at a coal-fired power plant with differentBoiler loads. Energy Fuel. 31, 747e754.
Zheng, J.Y., Ou, J.M., Mo, Z.W., Yin, S.S., 2011. Mercury emission inventory and itsspatial characteristics in the Pearl River Delta region, China. Sci. Total Environ.412, 214e222.
Zhong, X.L., Zhou, S.L., Zhu, Q., Zhao, Q.G., 2011. Fraction distribution andbioavailability of soil heavy metals in the Yangtze river Delta-A case study ofKunshan city in Jiangsu province, China. J. Hazard Mater. 198, 13e21.
Zhu, C.Y., Tian, H.Z., Cheng, K., Liu, K.Y., Wang, K., Hua, S.B., Gao, J.J., Zhou, J.R., 2016.Potentials of whole process control of heavy metals emissions from coal-firedpower plants in China. J. Clean. Prod. 114, 343e351.