Embed Size (px)
Citation preview

1
Multivariate Data &
Tables and Graphs
CS 7450 - Information Visualization
Aug. 29, 2016
John Stasko
Fall 2016 CS 7450 2
Learning Objectives
• Explain different types of data models
• Describe different variable types (categories)
• Define metadata
• Know when to use a table versus a graph
• Identify four fundamental types of symbolic displays
• Explain marks and mark properties
• Identify effective techniques for low-dimensional (<=3) data
• Given raw data, be able to analyze, model, and transform into tabular data

2
Data
• Data is taken from and/or representing some phenomena from the world
• Data models something of interest to us
• Data comes in many different forms
Typically, not in the way you want it
• What is available to me (in the raw)?
Fall 2016 CS 7450 3
Fall 2016 CS 7450 4
Example
• Cars make
model
year
miles per gallon
cost
number of cylinders
weights
...

3
Fall 2016 CS 7450 5
Example
• Web pages
?
Data Models
• Often characterize data through three components Objects
Items of interest
(students, courses, terms, …)
AttributesCharacteristics or properties of data
(name, age, GPA, number, date, …)
RelationsHow two or more objects relate
(student takes course, course during term, …)
Fall 2016 CS 7450 6

4
Fall 2016 CS 7450 7
Data Tables
• We take raw data and transform it into a model/form that is more workable
• Main idea:
Individual items are called cases
Cases have variables (attributes)
Statistical Model
• Independent and Dependent variables
• Dimensions
Discrete, categorical info
• Measures
Continuous, quantitative info
Fall 2016 CS 7450 8

5
Fall 2016 CS 7450 9
Data Table Format
Case1 Case2 Case3 ...
Variable1
Variable2
Variable3
...
Value11 Value21 Value31
Value12 Value22 Value32
Value13 Value23 Value33
Think of as a functionf(case1) = <Val11, Val12,…>
Fall 2016 CS 7450 10
Example
People in class
Mary Jim Sally Mitch ...
SSN
Age
Hair
GPA
...
145 294 563 823
23 17 47 29
brown black blonde red
2.9 3.7 3.4 2.1

6
Fall 2016 CS 7450 11
Or
People in class
P1 P2 P3 P4 ...
Name
SSN
Age
Hair
GPA
...
145 294 563 823
23 17 47 29
brown black blonde red
2.9 3.7 3.4 2.1
Mary Jim Sally Mitch
Fall 2016 CS 7450 12
Example
Baseballstatistics

7
Fall 2016 CS 7450 13
Variable Types
• Three main types of variables
N-Nominal (equal or not equal to other values)
Example: gender
O-Ordinal (obeys < relation, ordered set)
Example: fr,so,jr,sr
Q-Quantitative (can do math on them)
Example: age
Alternate Characterization
• Two types of data Quantitative
Relationships between values:RankingRatioCorrelation
CategoricalHow attributes relate to each other:
NominalOrdinalIntervalHierarchical
Fall 2016 CS 7450 14
From S. Few
8
Fall 2016 CS 7450 15
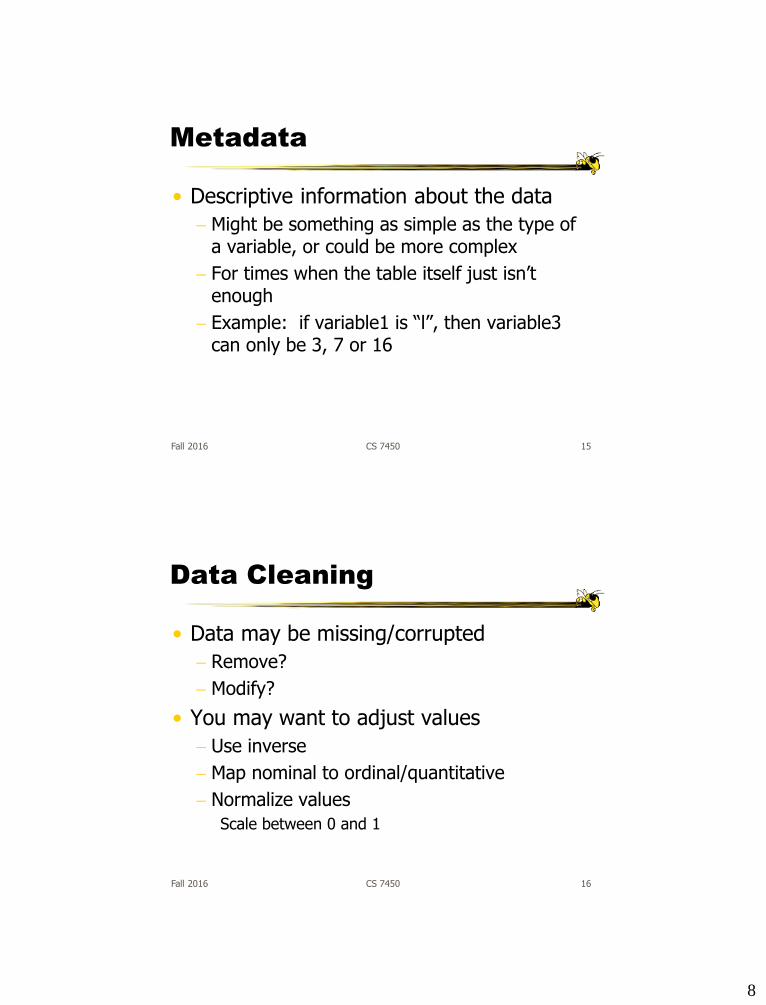
Metadata
• Descriptive information about the data
Might be something as simple as the type of a variable, or could be more complex
For times when the table itself just isn’t enough
Example: if variable1 is “l”, then variable3 can only be 3, 7 or 16
Data Cleaning
• Data may be missing/corrupted
Remove?
Modify?
• You may want to adjust values
Use inverse
Map nominal to ordinal/quantitative
Normalize values
Scale between 0 and 1
Fall 2016 CS 7450 16

9
Nice Interactive Tool
Fall 2016 CS 7450 17
https://www.trifacta.com/start-wrangling/
Fall 2016 CS 7450 18
How Many Variables?
• Data sets of dimensions 1, 2, 3 are common
• Number of variables per class
1 - Univariate data
2 - Bivariate data
3 - Trivariate data
>3 - Hypervariate data

10
Fall 2016 CS 7450 19
Representation
• What are two main ways of presenting multivariate data sets?
Directly (textually) Tables
Symbolically (pictures) Graphs
• When use which?
Strengths?
• Use tables when The document will be used
to look up individual values
The document will be used to compare individual values
Precise values are required
The quantitative info to be communicated involves more than one unit of measure
• Use graphs when The message is contained
in the shape of the values
The document will be used to reveal relationships among values
Fall 2016 CS 7450 20
S. FewShow Me the Numbers

11
Effective Table Design
• See Show Me the Numbers
• Proper and effective use of layout, typography, shading, etc. can go a long way
• (Tables may be underused)
Fall 2016 CS 7450 21
Example
Fall 2016 CS 7450 22

12
Example
Fall 2016 CS 7450 23
Fall 2016 CS 7450 24
Basic Symbolic Displays
• Graphs
• Charts
• Maps
• Diagrams
From:S. Kosslyn, “Understanding chartsand graphs”, Applied CognitivePsychology, 1989.

13
Fall 2016 CS 7450 25
1. Graph
Showing the relationships between variables’values in a data table
0
20
40
60
80
100
1st
Qtr
2nd
Qtr
3rd
Qtr
4th
Qtr
East
West
North
Fall 2016 CS 7450 26
Properties
• Graph
Visual display that illustrates one or more relationships among entities
Shorthand way to present information
Allows a trend, pattern or comparison to be easily comprehended

14
Fall 2016 CS 7450 27
Issues
• Critical to remain task-centric
Why do you need a graph?
What questions are being answered?
What data is needed to answer those questions?
Who is the audience?
time
money
Fall 2016 CS 7450 28
Graph Components
• Framework
Measurement types, scale
• Content
Marks, lines, points
• Labels
Title, axes, ticks

15
Fall 2016 CS 7450 29
Quick Aside
• Other symbolic displays
Chart
Map
Diagram
Fall 2016 CS 7450 30
2. Chart
• Structure is important, relates entities to each other• Primarily uses lines, enclosure, position to link entities
Examples: flowchart, family tree, org chart, ...

16
Fall 2016 CS 7450 31
3. Map
Representation ofspatial relations
Locations identifiedby labels
Fall 2016 CS 7450 32
4. Diagram
• Schematic picture of object or entity• Parts are symbolic
Examples: figures, steps in a manual, illustrations,...

17
Some History
• Which is older, map or graph?
• Maps from about 2300 BC
• Graphs from 1600’s
Rene Descartes
William Playfair, late 1700’s
Fall 2016 CS 7450 33
Fall 2016 CS 7450 34
Details
• What are the constituent pieces of these four symbolic displays?
• What are the building blocks?

18
Fall 2016 CS 7450 35
Visual Structures
• Composed of
Spatial substrate
Marks
Graphical properties of marks
Fall 2016 CS 7450 36
Space
• Visually dominant
• Often put axes on space to assist
• Use techniques ofcomposition, alignment, folding,recursion, overloading to 1) increase use of space2) do data encodings

19
Fall 2016 CS 7450 37
Marks
• Things that occur in space
Points
Lines
Areas
Volumes
Fall 2016 CS 7450 38
Graphical Properties
• Size, shape, color, orientation...
Spatial properties Object properties
Expressingextent
Differentiatingmarks
PositionSize
Grayscale
Orientation ColorShapeTexture

20
Fall 2016 CS 7450 39
Back to Data
• What were the different types of data sets?
• Number of variables per class
1 - Univariate data
2 - Bivariate data
3 - Trivariate data
>3 - Hypervariate data
Fall 2016 CS 7450 40
Univariate Data
• Representations
7
5
3
1
Bill
0 20
Mean
low highMiddle 50%
Tukey box plot

21
Fall 2016 CS 7450 41
What Goes Where?
• In univariate representations, we often think of the data case as being shown along one dimension, and the
value in anotherLinegraph
Bargraph
Y-axis is quantitativevariable
See changes overconsecutive values
Y-axis is quantitativevariable
Compare relative pointvalues
Fall 2016 CS 7450 42
Alternative View
• We may think of graph as representing independent (data case) and dependent (value) variables
• Guideline:
Independent vs. dependent variables
Put independent on x-axis
See resultant dependent variables along y-axis
22
Fall 2016 CS 7450 43
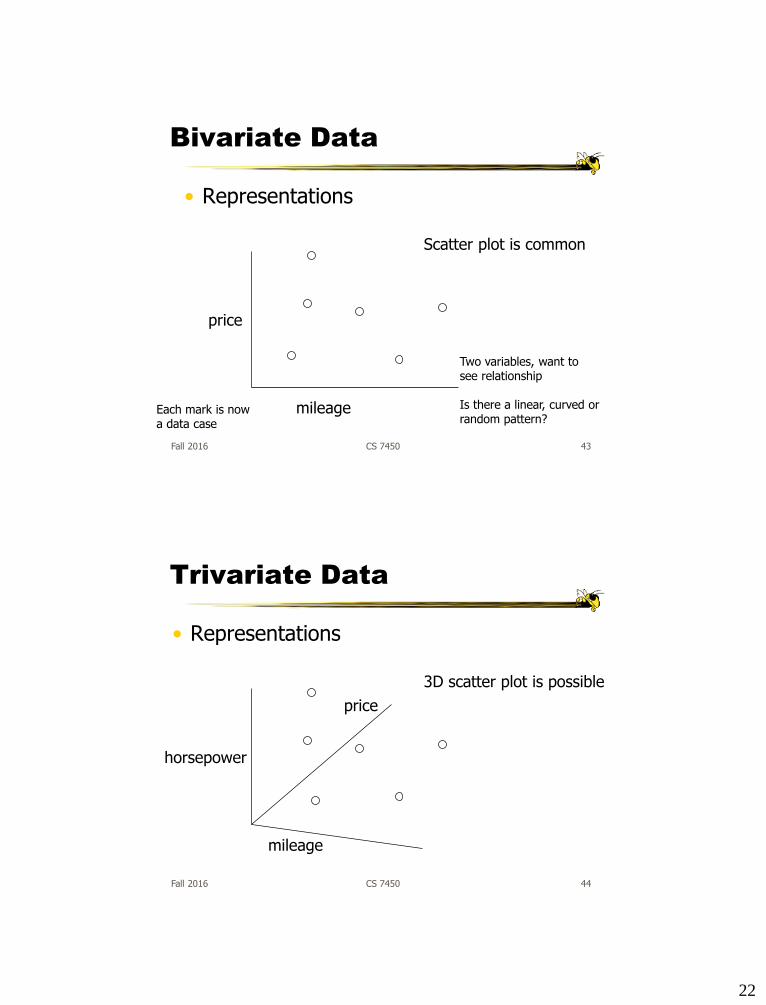
Bivariate Data
• Representations
Scatter plot is common
price
mileage
Two variables, want tosee relationship
Is there a linear, curved orrandom pattern?
Each mark is nowa data case
Fall 2016 CS 7450 44
Trivariate Data
• Representations
3D scatter plot is possible
horsepower
mileage
price

23
Fall 2016 CS 7450 45
Alternative Representation
Still use 2D but havemark propertyrepresent thirdvariable
Fall 2016 CS 7450 46
Alternative Representation
Represent each variablein its own explicit way

24
Fall 2016 CS 7450 47
Hypervariate Data
• Ahhh, the tough one
• Number of well-known visualization techniques exist for data sets of 1-3 dimensions line graphs, bar graphs, scatter plots
We see a 3-D world (4-D with time)
• What about data sets with more than 3 variables? Often the interesting, challenging ones
Fall 2016 CS 7450 48
Multiple Views
Give each variable its own display
A B C D E
1 4 1 8 3 5
2 6 3 4 2 1
3 5 7 2 4 3
4 2 6 3 1 5
A B C D E
1
2
3
4

25
Fall 2016 CS 7450 49
Scatterplot Matrix
Represent each possiblepair of variables in theirown 2-D scatterplot
Useful for what?Misses what?
More to Come…
• Subsequent day will explore other general techniques for handling hypervariate data
Fall 2016 CS 7450 50

26
Advice
• Take DB & IR courses
Learn about query languages, relational data models, datacubes, data warehouses, …
Fall 2016 CS 7450 51
Design Challenge
Fall 2016 CS 7450 52
Data about dogs
VarietyGroupSizeSmartnessPopularityRanking
NNONQQ
Design a representation

27
Fall 2016 CS 7450 53
http://www.slate.com/blogs/wild_things/2014/11/12/big_data_dog_graph_popularity_of_dog_breeds_mapped_against_their_overall.html
Dear Data
Fall 2016 CS 7450 54
http://www.dear-data.com
http://www.dear-data.com/all
28
Fall 2016 CS 7450 55
Learning Objectives
• Explain different types of data models
• Describe different variable types (categories)
• Define metadata
• Know when to use a table versus a graph
• Identify four fundamental types of symbolic displays
• Explain marks and mark properties
• Identify effective techniques for low-dimensional (<=3) data
• Given raw data, be able to analyze, model, and transform into tabular data
Fall 2016 CS 7450 56
Administratia
• Office hours posted
• John S.
• John T.
• Ayshwarya

29
Piazza
• Add yourself
• Feel free to post…
Fall 2016 CS 7450 57
HW 1 Discussion
• What findings did you make?
• What was difficult?
• What help did you want?
Fall 2016 CS 7450 58
30
Project
• Overview
Examine details on Assignments webpage
• Milestones
Teams & topics 2 weeks from Wednesday
• Topic ideas
Fall 2016 CS 7450 59
Project Teams
• 3-4 people (3 preferred)
• Self-forming or designated
• Students wiki page on t-square
Add your info by Weds.
• Email me if you want me to pair you
Email header: [7450 team]
Fall 2016 CS 7450 60

31
What are you Listening to?
• Represent music listening histories
• What would you want to show?
• How might you visualize it?
Fall 2016 CS 7450 61
Nice exampleof a project
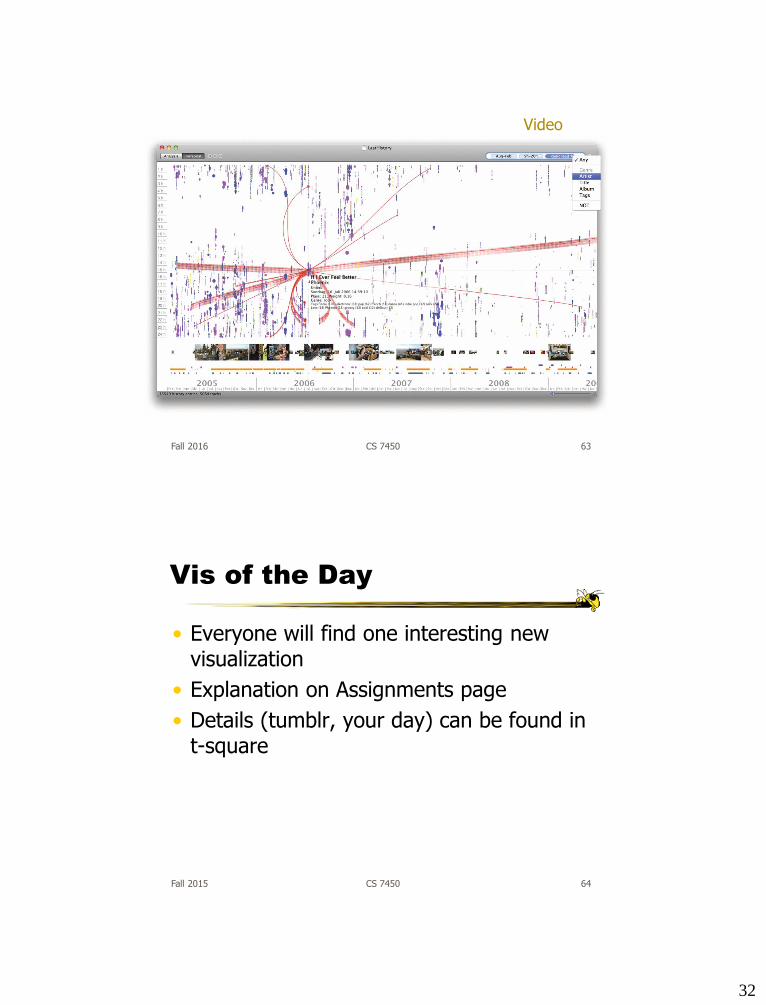
LastHistory
• Visualizing a person’s listening history from last.fm
• Want to support
Analysis
Reminiscing
• Potential to synchronize with photos and calendar entries from that time
Fall 2016 CS 7450 62
Baur et alTVCG (InfoVis) ‘10
32
Fall 2016 CS 7450 63
Video
Vis of the Day
• Everyone will find one interesting new visualization
• Explanation on Assignments page
• Details (tumblr, your day) can be found in t-square
Fall 2015 CS 7450 64

33
Reading
• Dear Data website
Fall 2016 CS 7450 65
Fall 2016 CS 7450 66
Upcoming
• Statistical Charts & Graphs
• No class: Labor Day

34
Fall 2016 CS 7450 67
Sources Used
Few bookCMS bookReferenced articlesMarti Hearst SIMS 247 lecturesKosslyn ‘89 articleA. Marcus, Graphic Design for Electronic Documents
and User InterfacesW. Cleveland, The Elements of Graphing Data