Embed Size (px)
Citation preview

www.elsevier.com/locate/humpath
Human Pathology (2012) 43, 2167–2176
Original contribution
Multiplex high-throughput gene mutation analysis in acutemyeloid leukemiaJennifer Dunlap MDa, Carol Beadling PhDb,c, Andrea Warrick BS c, Tanaya Neff MS c,William H. Fleming MD, PhDb,c,d, Marc Loriaux MD, PhDa,c,Michael C. Heinrich MD, PhDb,c,e, Tibor Kovacsovics MDb,c,Katalin Kelemen MD, PhDa, Nicky Leeborg MDa, Ken Gatter MDa,Rita M. Braziel MDa,c, Richard Press MD, PhDa,c,Christopher L. Corless MD, PhDa,c, Guang Fan MD, PhDa,⁎
aDepartment of Pathology, Oregon Health & Science University, Portland, OR 97239bDivision of Hematology and Medical Oncology, Oregon Health & Science University, Portland, OR 97239cKnight Cancer Institute, Oregon Health & Science University, Portland, OR 97239dDepartment of Pediatrics, Oregon Health & Science University, Portland, OR 97239ePortland Veterans Affairs Medical Center, Portland, OR 97239
Received 29 November 2011; revised 24 February 2012; accepted 2 March 2012
0h
Keywords:Acute myeloid leukemia;Molecular;Genetics;Gene mutation
Summary Classification of acute myeloid leukemia increasingly depends on genetic analysis. However,the number of known mutations in acute myeloid leukemia is expanding rapidly. Therefore, we tested ahigh-throughput screening method for acute myeloid leukemia mutation analysis using a multiplex massspectrometry–based approach. To our knowledge, this is the first reported application of this approachto genotype leukemias in a clinical setting. One hundred seven acute myeloid leukemia cases werescreened for mutations using a panel that covers 344 point mutations across 31 genes known to beassociated with leukemia. The analysis was performed by multiplex polymerase chain reaction formutations in genes of interest followed by primer extension reactions. Products were analyzed on aSequenom MassARRAY system (San Diego, CA). The multiplex panel yielded mutations in 58% ofacute myeloid leukemia cases with normal cytogenetics and 21% of cases with abnormal cytogenetics.Cytogenetics and routine polymerase chain reaction–based screening of NPM1, CEBPA, FLT3-ITD,and KIT was also performed on a subset of cases. When combined with the results of these standardpolymerase chain reaction–based tests, the mutation frequency reached 78% in cases with normalcytogenetics. Of these, 42% harbored multiple mutations primarily involving NPM1 with NRAS, KRAS,CEBPA, PTPN11, IDH1, or FLT3. In contrast, cases with abnormal cytogenetics rarely harbored morethan 1 mutation (1.5%), suggesting different underlying biology. This study demonstrates the feasibilityand utility of broad-based mutation profiling of acute myeloid leukemia in a clinical setting. Thisapproach will be helpful in defining prognostic subgroups of acute myeloid leukemia and contribute tothe selection of patients for enrollment into trials with novel inhibitors.© 2012 Elsevier Inc. All rights reserved.
⁎ Corresponding author.E-mail address: [email protected] (G. Fan).
046-8177/$ – see front matter © 2012 Elsevier Inc. All rights reservedttp://dx.doi.org/10.1016/j.humpath.2012.03.002
.

2168 J. Dunlap et al.
1. Introduction
The classification, therapy, and prognosis of acutemyeloid leukemia (AML) increasingly depend on molecularand cytogenetic analysis. Cytogenetic analysis stratifiespatients into favorable, intermediate, and adverse prognosticgroups. Approximately 40% to 50% of patients with AMLhave normal cytogenetics (CN-AML) and fall within theintermediate prognostic group in this classification system.However, there remains significant clinical heterogeneity ineach cytogenetic group, particularly among patients withCN-AML.
In addition to cytogenetic abnormalities, a number ofgenetic mutations relevant to the pathogenesis of AML havebeen detected by traditional sequencing and polymerasechain reaction (PCR) methods and have become an integralpart of routine clinical testing in AML. Mutation testing inconjunction with cytogenetics has provided insight intoAML disease biology, defined prognostic subgroups,directed therapeutic decisions, and identified potentialtherapeutic targets. Somatic mutations in AML are broadlydivided into 2 groups: class I and class II mutations. Class Imutations (FLT3, KIT, FMS, Ras-Braf pathway genes, etc)are activating mutations, which often target kinase pathways.Class II mutations (NPM1, CEBPA, chromosomal trans-locations, etc) are loss of function mutations involving genesimportant in transcription. An accepted model of AMLpathogenesis proposes a multistep acquisition and collabo-ration of mutations where class II mutations occur early andblock differentiation and class I mutations occur later indisease and promote survival and proliferation [1]. Chromo-somal translocations affecting genes involved in transcrip-tion are now a part of the 2008 World Health Organizationclassification of AML and have prognostic significance.Similarly, mutations in several genes including NPM1,FLT3, and CEBPA have important prognostic as well astherapeutic implications in AML [2]. Isolated NPM1 andCEBPA mutations confer a favorable prognosis, whereasFLT3-ITD mutations have been associated with a worseoverall survival [3]. Moreover, AML with NPM1 or CEBPAmutations have been incorporated in the 2008 World HealthOrganization classification as provisional diagnostic entities.Treatment is also guided by mutation status; patients with anNPM1 mutation who are FLT3-ITD negative have beenshown not to benefit from transplant [4], and clinical trialsinvestigating FLT3 inhibitors in patients with a FLT3-ITDmutation are currently underway. In addition, mutations inRAS; TET2; IDH1/2; and, most recently, DNMT3A havealso been identified in AML [5-8]. The current recommen-dation is that molecular testing for NPM1, FLT3, andCEBPA mutations be routinely performed [9].
Cancer genomics in AML is a rapidly growing field aidedby powerful and evolving genomic technologies. This raisesthe question of how best to perform large-scale mutationscreening in the clinical setting with a limited amount of
clinical sample, reasonable turnaround time, and affordablecost. In this study, we report our experience in AMLgenotyping using a high-throughput multiplex mass spec-trometry–based approach.
2. Materials and methods
2.1. Patients and tissues
All samples were collected from the archives of thepathology and hematology-oncology departments, OregonHealth and Science University from 2008 to 2011. The studywas approved by the Oregon Health and Science UniversityInstitutional Review Board. Peripheral blood or bonemarrow aspirate was analyzed using a multiplex massspectrometry–based approach (MassARRAY system;Sequenom, San Diego, CA) in 107 patients with AML. Asingle case of paraffin-embedded tonsillar myeloid sarcomawithout peripheral blood or bone marrow involvement wasincluded. Age, white blood cell count at diagnosis, AMLsubclassification, and results of additional molecular andcytogenetic studies were recorded (Table 1).
2.2. Multiplex mutation screening
DNA was extracted and purified from peripheral blood,bone marrow, or formalin-fixed, paraffin-embedded tissue.Multiplex mutation screening was performed using theSequenom MassARRAY system, as previously described[10]. Assay Designer software (Sequenom, San Diego CA,USA) was used to design multiplex PCR's targeting pointmutations in genes known to be associated with leukemia(Table 2). Initial PCR reactions used 10 ng DNA permultiplex in a total volume of 5 μL, with 100 nmol/Lprimers, 2 mmol/L MgCl2, 500 μmol/L dNTPs, and 0.1 UTaq polymerase. Amplification included 1 cycle at 94°C for4 minutes, followed by 45 cycles at 94°C for 20 seconds,56°C for 30 seconds, and 72°C for 1 minute, and 1 final cycleat 72°C for 3 minutes. Unincorporated nucleotides wereinactivated by addition of 0.3 U shrimp alkaline phosphataseand incubation at 37°C for 40 minutes, followed by heatinactivation of shrimp alkaline phosphatase at 85°C for 5minutes. Single base primer extension reactions were carriedout with 0.625 to 1.25 μmol/L extension primer and 1.35 UTypePLEX thermosequenase DNA polymerase (Sequenom).Extension cycling included 1 cycle at 94°C for 30 secondsand 40 cycles at 94°C for 5 seconds, with 5 cycles at 52°C for5 seconds and 80°C for 5 seconds, followed by 1 cycle at72°C for 3 minutes. Extension products were purified with anion exchange resin, and approximately 10 nL of product wasspotted onto SpectroChip II matrices (Sequenom). A Brukermatrix-assisted laser desorption/ionization time of flightmass spectrometer (MassARRAY Compact; Sequenom) wasused to resolve extension products. MassARRAY Typer

2169Mutation analysis in acute myeloid leukemia
Analyzer software (Sequenom) was used for automated dataanalysis, accompanied by visual inspection of extensionproducts. Mutations detected by mass spectrometry wereconfirmed by conventional bidirectional DNA sequencing.
2.3. KIT method
KIT gene exons 8 and 17 were screened by a combination ofreal-time PCR and high-resolution melting curve analysis on aRocheLightcycler LC480 (Indianapolis, IN,USA). The primersused were as follows: exon 8 forward GACATATGGC-CATTTCTGTTT; exon 8 reverse GAATCCTGCTGCCACA-CATT; exon 17 forward TCGGATCACAAAGATTTGTG;exon 17 reverse GCAGGACTGTCAAGCAGAGA. Amplifi-cations were performed with 100 ng DNA in 20 μL reactionsusing the Roche LightCycler 480 ProbesMaster MixcontainingLC+ green dye. Cycling was as follows: 94°C for 8 minutes,followed by 40 cycles at 94°C for 20 seconds, 58°C for 2seconds, and 72°C for 10 seconds. All suspected mutationswere confirmed by direct DNA sequencing.
2.4. CEBPA method
For the assay performed in our laboratory, DNA isextracted from blood or bone marrow. PCR amplification ofthe entire CEBPA coding sequence (1 large exon; dividedinto 2 separate PCR products) is followed by direct DNAsequencing (with 8 different sequencing primers) to detectthe presence or absence of mutations [11]. The low-levelsensitivity limit of sequencing is approximately 20%, suchthat a mutant allele population below this detection limit isnot reliably detected.
2.5. FLT3-ITD and NPM1 methods
The detection of the internal tandem duplicationmutation inthe FLT3 gene was assessed by PCR amplification of thejuxtamembrane domain (with fluorescent primers) and deter-mining the size of the resulting FLT3 amplicons (by capillaryelectrophoresis). The NPM1 C-terminal insertion mutationcausing cytoplasmic localization was assessed by PCRamplification and direct DNA sequencing of NPM1 exon 12.
2.6. Cytogenetics
Standard cytogenetic karyotype analysis was performedby the OHSU Cytogenetics Laboratory on peripheral bloodor bone marrow aspirate/biopsy material. The specimen wascultured for 24 to 48 hours in complete RPMI 1640 medium(Invitrogen, Carlsbad, CA) with 10% fetal bovine serum(Irvine Scientific, Santa Ana, CA). Cells were harvested, andslides were prepared according to standard laboratoryprotocol. Slides were treated with 10% trypsin (Invitrogen)for 40 to 55 seconds followed by Wright stain (Sigma, StLouis, MO) for 2 minutes and 30 seconds. These Trypsin-
Wright (GTW)-banded preparations were analyzed on aNikon Eclipse E800 microscope (Nikon Instruments,Melville, NY) with Applied Imaging CytoVysion software(Genetix, San Jose, CA). When possible, at least 20metaphase cells were examined for each case.
2.7. Statistics
Statistical analysis was performed using the χ2 test.
3. Results
3.1. Patient demographics
Bone marrow aspirate, peripheral blood, or soft tissue wasanalyzed in 107 patients. The cohort consisted of 43 femalesand 64 males with a median age of 57 years. The white bloodcell count ranged from 0.7 to 359.4 with a median value of16.25. De novo and relapsed AML accounted for 64% (68/107) and 20% (21/107) of the cases, respectively. Sixteenpercent (17/107) of cases were transformed AML arisingfrom previously diagnosed myelodysplastic syndromes(MDSs), chronic myelomonocytic leukemia (CMML), orchronic myelogenous leukemia. A single case of tonsillarmyeloid sarcoma without documented peripheral blood orbone marrow involvement was included. Patients werestratified into favorable, intermediate, and adverse cytoge-netic risk groups according to published guidelines [9].Favorable cytogenetic abnormalities accounted for 12% (13/107) of cases including inversion 16, t(8;21) and t(15;17).The intermediate-risk group comprised 62% (65/107) of totalcases. Of these, 37% (40/107) had normal cytogenetics. Mostof the normal cytogenetic cases had routine karyotypes withat least 20 metaphases analyzed as well as concomitantfluorescence in situ hybridization analysis. In 4 cases, lessthan 20 metaphases were analyzed: of these, 1 case had 16, 2had 8, and 1 had only 1 metaphase. All of these cases,however, were normal by interphase fluorescence in situhybridization panel analysis [includes probes for chromo-some 5, chromosome 7, t(15;17), t(8;21), t(9;22), t(16;16)/inv16, and MLL(11q23)]. Finally, 27% (29/107) of casesharbored high-risk cytogenetic abnormalities includingcomplex karyotype, monosomy 7, and MLL rearrangements.
3.2. Results of multiplex mutation screening
Wepreviously developed amultiplexedmass spectrometry–based panel for screening oncogene mutations in solid tumors[10]. Mass spectrometry supports a rapid, quantitative readoutwith a lower limit of sensitivity of approximately 10% mutantallele. For this study, we developed a similar panel consisting of270 assays covering 344 mutations across 31 genes known toplay a role in hematologic malignancies (Table 2). Among the344 mutations represented on the panel, 128 were validated by

Table 1 Characteristics of cases with mutations detected by multiplex analysis
Case Age Sex WBC Diagnosis Mutatedgene(s)
Codon Chromosome Start(hg18)
End (hg18) Ref Var Additional mutations detected bystandard PCR-based testing
Cytogenetics
1 76 M 1 AML-M2 PTPN11 T73I 12 111372585 111372585 C T ND NormalFLT3 D835A 13 27490641 27490641 T GNPM1 W288fs⁎12 5 170770153 170770153 G TCTGG
2 41 M 0.8 AML NPM W288fs⁎12 5 170770153 170770153 G TCTGG ND NormalIDH1 R132H 2 208821357 208821357 C T
3 46 F 70 AML-M2 NPM1 W288fs⁎12 5 170770153 170770153 G TCTGG FLT3-ITD NormalKRAS T58I 12 25271552 25271552 G A
4 37 M 109 AML-M5 NRAS Q61H 1 115058051 115058051 T A ND NormalIDH1 R132H 2 208821357 208821357 C TNPM1 W288fs⁎12 5 170770153 170770153 G CCTGG
5 78 M 214 AML-M5 FLT3 S451F 13 27508138 27508138 G A ND NormalNPM1 W288fs⁎12 5 170770153 170770153 G TCTGG
6 75 F 277 AML-M1 NPM1 W288fs⁎12 5 170770153 170770153 G TCTGG ND Normal7 79 M 96 AML-M5 NPM1 W288fs⁎12 5 170770153 170770153 G TCTGG ND Normal8 52 M 60.5 AML-M2 NPM1 W288fs⁎12 5 170770153 170770153 G TCTGG FLT3-ITD Normal9 69 F 64.8 AML-M1 NPM1 W288fs⁎12 5 170770153 170770153 G TCTGG ND Normal10 68 F 9.3 AML-M5 NPM1 W288fs⁎12 5 170770153 170770153 G TCTGG ND Normal11 73 M 94 AML-M1 NPM1 W288FS⁎12 5 170770153 170770153 G TCTGG FLT3-ITD Normal12 61 M 26 AML-M1 NPM1 W288fs⁎12 5 170770153 170770153 G TCTGG FLT3-D835 Normal13 27 F 66.6 AML-M1 NPM1 W288fs⁎12 5 170770153 170770153 G CATGG CEBPA and FLT3-ITD Normal14 70 F 105 AML NPM1 W288fs⁎12 5 170770153 170770153 G TCTGG FLT3-ITD Normal15 17 M 90 AML-M1 NPM1 W288fs⁎12 5 170770153 170770153 G TCTGG FLT3-ITD Normal16 58 M 26.8 AML NPM1 W288fs⁎12 5 170770153 170770153 G TCTGG FLT3-ITD Normal17 36 F Normal myeloid sarcoma NPM1 W288fs⁎12 5 170770153 170770153 G TCTGG ND Normal
2170J.
Dunlapet
al.

18 60 M 65.2 AML NPM1 W288fs⁎12 5 170770153 170770153 G TCTGG FLT3-ITD Normal19 72 M 132 AML, CMML CBL R420P 11 118654461 118654461 G C ND Normal20 61 M 2.2 AML, MPN CBL C404Y 11 118654201 118654201 G A ND Normal21 66 F 4 AML-M4 NRAS G12D 1 115060270 115060270 C T ND Normal22 59 M 5 AML-M0 NRAS G13D 1 115060267 115060267 C T ND Normal23 22 M 47.3 AML-M1 IDH1 R132H 2 208821357 208821357 C T FLT3-ITD Normal24 80 F 106 AML-M4, MDS FLT3 D835Y 13 27490642 27490642 C A ND t(3;12)25 70 F 61.5 AML NPM1 W288fs⁎12 5 170770153 170770153 G TCTGG FLT3-ITD Extra isochrome
1q26 54 F Unknown AML NRAS G12D 1 115060270 115060270 C T ND 11q2327 46 F 13.4 AML-M4eo NRAS G12S 1 115060271 115060271 C T ND Inv16, trisomy 2228 23 M 280 AML-M4eo NRAS G13D 1 115060267 115060267 C T ND Inv1629 61 F 40.9 AML-M4 NRAS Q61K 1 115058053 115058053 G T ND Inv1630 76 M 105 AML-M4 KRAS G12D 12 25289551 25289551 C T ND Additional 11q
attached to 1631 72 M 174.4 AML-M5 KRAS G12V 12 25289548 25289548 C A ND Monosomy 732 53 M 1.9 AML KRAS G12V 12 25289548 25289548 C A ND Monosomy 7,8q33 40 F 12.5 AML-M3 KRAS Q61P 1 25271543 25271543 T G ND t(15;17)34 45 M 22 AML, CMML2 IDH1 R132H 2 208821357 208821357 C T ND 11;19 (involves
MLL)35 61 M 0.7 AML-M0 IDH1 R132H 2 208821357 208821357 C T ND t(9p;11p)36 24 M 3.3 AML with
myeloid sarcomaNRAS G12D 1 115060270 115060270 C T ND Inv16, trisomy
8, -YKIT D816Y 4 55294077 55294077 G C
37 37 M 2.2 AML-M0 PTPN11 E69K 12 111372572 111372572 G A ND Monosomy 7
Patient demographics and diagnoses. Abbreviations: M, male; F, female; ND, not detected.
2171Mutation
analysisin
acutemyeloid
leukemia
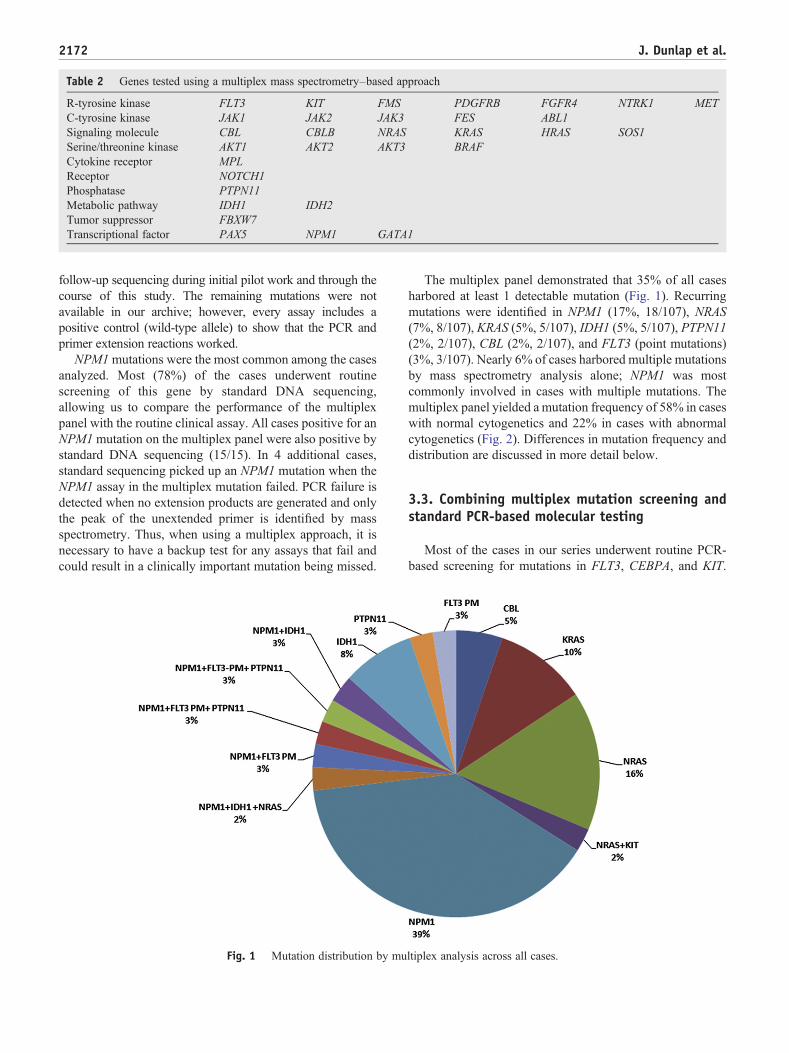
Table 2 Genes tested using a multiplex mass spectrometry–based approach
R-tyrosine kinase FLT3 KIT FMS PDGFRB FGFR4 NTRK1 METC-tyrosine kinase JAK1 JAK2 JAK3 FES ABL1Signaling molecule CBL CBLB NRAS KRAS HRAS SOS1Serine/threonine kinase AKT1 AKT2 AKT3 BRAFCytokine receptor MPLReceptor NOTCH1Phosphatase PTPN11Metabolic pathway IDH1 IDH2Tumor suppressor FBXW7Transcriptional factor PAX5 NPM1 GATA1
2172 J. Dunlap et al.
follow-up sequencing during initial pilot work and through thecourse of this study. The remaining mutations were notavailable in our archive; however, every assay includes apositive control (wild-type allele) to show that the PCR andprimer extension reactions worked.
NPM1mutations were the most common among the casesanalyzed. Most (78%) of the cases underwent routinescreening of this gene by standard DNA sequencing,allowing us to compare the performance of the multiplexpanel with the routine clinical assay. All cases positive for anNPM1mutation on the multiplex panel were also positive bystandard DNA sequencing (15/15). In 4 additional cases,standard sequencing picked up an NPM1 mutation when theNPM1 assay in the multiplex mutation failed. PCR failure isdetected when no extension products are generated and onlythe peak of the unextended primer is identified by massspectrometry. Thus, when using a multiplex approach, it isnecessary to have a backup test for any assays that fail andcould result in a clinically important mutation being missed.
Fig. 1 Mutation distribution by mu
The multiplex panel demonstrated that 35% of all casesharbored at least 1 detectable mutation (Fig. 1). Recurringmutations were identified in NPM1 (17%, 18/107), NRAS(7%, 8/107), KRAS (5%, 5/107), IDH1 (5%, 5/107), PTPN11(2%, 2/107), CBL (2%, 2/107), and FLT3 (point mutations)(3%, 3/107). Nearly 6% of cases harbored multiple mutationsby mass spectrometry analysis alone; NPM1 was mostcommonly involved in cases with multiple mutations. Themultiplex panel yielded a mutation frequency of 58% in caseswith normal cytogenetics and 22% in cases with abnormalcytogenetics (Fig. 2). Differences in mutation frequency anddistribution are discussed in more detail below.
3.3. Combining multiplex mutation screening andstandard PCR-based molecular testing
Most of the cases in our series underwent routine PCR-based screening for mutations in FLT3, CEBPA, and KIT.
ltiplex analysis across all cases.

Fig. 2 Mutation frequency by multiplex analysis. A, Normalcytogenetics. B, Abnormal cytogenetics.
2173Mutation analysis in acute myeloid leukemia
These assays complemented the multiplex panel, which is notsuitable for detecting insertions and deletions of variable length(eg, FLT3 and KIT) or loss-of-function mutations that cannotbe readily predicted (eg, CEBPA). Overall, 26% (22/85) of thecases demonstrated FLT3-ITD mutations, with 18 cases in theintermediate cytogenetic risk group and only 4 in the high-riskcytogenetic group. KIT mutations in exons 8 and 17 werescreened in 57 cases; 10% (6/57) were positive for eitherdeletion/insertion mutations in exon 8 or point mutations inexon 17. Interestingly, 83% (5/6) of theKITmutation–positivecases were within the inversion 16 cytogenetic group. Finally,CEBPA mutations were detected in 16% (5/31) of the tumors;all but 1 case were in the normal cytogenetic group.
With the addition of routine testing for FLT3-ITD,CEBPA, and KIT, the mutation frequency in the normal
cytogenetic group increased to 78%, predominantly due toadditional FLT3-ITD and CEBPA mutations (Fig. 3). In theabnormal cytogenetic risk group, the mutation frequencyreached 42%, mostly due to FLT3-ITD mutations in thehigh-risk group and KIT mutations in the low-risk group.
3.4. Comparison of mutation frequency anddistribution among cytogenetic risk groups
There was a distinctly different mutation frequency anddistribution between the normal and abnormal cytogeneticrisk groups. Multiplex mutation analysis demonstratedmutations in 58% (23/40) of cases with normal cytogenetics,including NPM1 (40%, 16/40), NRAS (8%, 3/40), IDH1(8%, 3/40), and CBL (5%, 2/40). When combined withresults of standard PCR-based tests, 78% of cases withnormal cytogenetics had a detectable mutation. Of these,41% harbored multiple mutations primarily involving NPM1together with NRAS, KRAS, CEBPA, PTPN11, IDH1, orFLT3. As depicted in Fig. 4, the normal cytogenetic groupdemonstrated a significantly higher total mutation frequency(P b .001) as well as more NPM1 mutations (P b .001),FLT3-ITD/NPM1 concurrent mutations (P b .001), andmultiple mutations (P b .001). IDH1 mutations were alsomore common in cases with normal cytogenetics, althoughthis did not reach statistical significance.
In contrast, multiplex mutation analysis demonstratedmutations in only 21% (14/67) of AML with abnormalcytogenetics, including IDH1 (3%, 2/67), NRAS (7%, 5/67),and KRAS (6%, 4/67). The mutation frequency reached 42%when combined with standard PCR based tests. Only 2NPM1 mutations were identified in this group, and 1CEBPA-positive case was seen. On the other hand, KIT(P b .05), RAS and isolated FLT3-ITD mutations were morefrequent in cases with abnormal cytogenetics. In contrast tocases with normal cytogenetics, only 1 case (1.5%) harboringmultiple mutations was detected, which had concomitantKIT and RAS mutations, an uncommon example ofcoexisting class I mutations.
The mutation distribution in all 107 cases among thedifferent cytogenetic risk groups is summarized in Fig. 5. Inthe low-risk group, only KIT and RAS mutations were seen,with most of them in association with inversion 16 (corebinding factor leukemia). One KRAS mutation was found inacute promyelocytic leukemia. The intermediate-risk groupwas the largest group in our study, including normalcytogenetics, trisomy 8, and other non–high-risk cytogeneticchanges. NPM1 was the most frequent mutation in thenormal cytogenetic group occurring as a sole mutation(30%), in combination with FLT3-ITD (60%), or incombination with a FLT3 point mutation (10%). Over-lapping NPM1-IDH1 mutations were identified in 1 case.Interestingly, the mutation frequency was much lower in thehigh-risk cytogenetic groups, and most mutations were classI mutations involving KIT, RAS, PTPN11, and FLT3-ITD.

Fig. 3 Additional mutations detected by routine molecular testing in cases with normal cytogenetics.
2174 J. Dunlap et al.
These results suggest that different molecular mechanismsare involved in different cytogenetic groups.
4. Discussion
Our understanding of molecular genetics in AML isadvancing, and as the number of known mutations in AMLwith prognostic and predictive utility continues to grow, sodoes the need for efficient methods for routine genotyping inthe clinical setting. Practically speaking, it is time consumingand expensive to use multiple different assays in thediagnostic workup of a patient with AML. Moreover, thenumber of individual assays that can be performed is oftenlimited by sample size. In this study, we report ourexperience in AML genotyping using a multiplex massspectrometry–based approach. Previous panels built on thistechnology have been used primarily to study solid tumors
Fig. 4 Comparison of mutation distribution betwee
[10,12,13]. To our knowledge, this is the first reportedapplication of this approach focused on the study ofleukemia. The platform is ideal for clinical specimens, as itrequires a relatively small amount of DNA and can be usedwith DNA extracted from blood, bone marrow, and fresh/frozen tissue and formalin-fixed, paraffin-embedded tissue.The sensitivity is approximately 10% mutant allele [10].Using this approach, we were able to quickly and efficientlyscreen for 344 mutations across 31 genes as a means togenotype AML.
Our genotyping studies identified recurring mutations inNPM1, RAS, IDH1, PTPN11, and CBL (Fig. 1). There was adistinctly different mutation frequency and distributionbetween the normal and abnormal cytogenetic risk groups,strongly suggesting differences in underlying biology (Figs. 4and 5). In combination with standard PCR-based tests(CEBPA, FLT3-ITD, NPM1, and KIT), the normal cytoge-netic risk group had a mutation frequency of 78%, nearly
n normal and abnormal cytogenetic risk groups.

Fig. 5 Distribution of mutations across cytogenetic risk groups *t(15;17).
2175Mutation analysis in acute myeloid leukemia
twice that seen in abnormal cytogenetics. Our mutationfrequency in normal cytogenetics was slightly lower thanwhat has been reported (85%), although prior studies alsoincluded MLL–partial tandem duplications and WT-1 muta-tions, not analyzed in this study [9]. Key differences inmutation distribution include more frequent IDH1, NPM1,and NPM1-FLT3 overlapping mutations in the normalcytogenetic group and increased RAS, KIT, and isolatedFLT3-ITD mutations in the abnormal cytogenetic group.
Another striking difference arose when comparingconcurrent mutations between cases with abnormal andnormal cytogenetics. Concurrent mutations in 2 or moregenes were seen almost exclusively in patients with normalcytogenetics. Of 40 cases with normal cytogenetics, 17(42%) harbored more than 1 mutation, whereas this was truefor only 1 case (1/67, 1.5%) with abnormal cytogenetics.Different patterns of overlapping mutations were alsoevident. Within the low-risk cytogenetic group, KIT andNRAS mutations were only seen in cases with inversion 16and did not occur with other mutations. In cases with normalcytogenetics, FLT3, NPM1, IDH1, and CEBPA mutationswere commonly seen in the context of multiple mutationsand rarely occurred in isolation.
An understanding of what mutations occur togetherprovides important prognostic information. The associationbetween FLT3-ITD and NPM1 mutations is a good example.Patients with NPM1 have a good prognosis, which isabrogated in the setting of a concomitant FLT3-ITDmutation. Other similar relationships have been proposed.Mutations in IDH1, a metabolic enzyme, have been reportedin approximately 7% to 16% of CN-AML [7,14,15]. IDH1mutations are often seen with other mutations especiallyNPM1 and have been shown to be associated with a worseprognosis when they occur with unmutated NPM1 [16],although an adverse prognosis in the setting of mutatedNPM1 has also been reported [17]. Several recent studieshave integrated gene mutations and gene expression profilesto improve on the current risk stratification in AML [18-20].
Acquisition of RAS mutations has been shown to beassociated with progression of MDS to AML [21], although
multiple large studies have not demonstrated prognosticsignificance of RAS mutations in AML [4,22,23]. However,a recent study suggested that RAS mutations may predict thesensitivity of tumors to MEK inhibitors [24], and clinicaltrials investigating MEK inhibitors in myeloid malignancieswith NRAS and/or KRAS mutations are currently underway.In our study, RAS mutations were identified in 40% (4/10) ofcases with inversion 16; 2 mutations were identified at aminoacid 12, 1 at 13, and 1 at 61. Similar results have beenreported by others who also found that the cytogeneticgroups inv16/t(16;16) and inv3/t(3;3) showed a higherfrequency of NRAS mutations (37.6% and 26.8%, respec-tively) as compared with other cytogenetic groups [22]. Alsoconsistent with previously published data, the RASmutationsin this study most frequently occurred at amino acid 12(50%, 4/8).
In summary, using a multiplexed mass spectrometry–based approach, we were able to quickly screen for 344mutations across 31 genes known to be associated withleukemia. This approach allows for genotyping of AML witha clinically useful turnaround time and limited sample.Moreover, in CN-AML, we demonstrate a mutation frequen-cy nearly twice that seen in cases with abnormal cytogeneticswith concurrent mutations occurring almost exclusively inCN-AML strongly suggesting differences in underlyingpathogenic mechanisms between these 2 groups. Finally,we demonstrate molecular heterogeneity within CN-AML,which our current risk stratification scheme in AML does notaccount for; however, investigations are underway. Broad-based mutation profiling of AML will not only provideinsight into disease biology and define prognostic subgroupsbut is being used now to guide therapy and select patients forenrollment into clinical trials with novel inhibitors.
Acknowledgment
Special thanks to all of our colleagues in the PathologyTranslational Research Laboratory, Oregon Health &Science University/Knight Diagnostic Laboratories for

2176 J. Dunlap et al.
their excellent work in the development and validation of theSequenom MassARRAY system in acute leukemia.
References
[1] Kelly LM, Gilliland DG. Genetics of myeloid leukemias. Annu RevGenomics Hum Genet 2002;3:179-98.
[2] Betz BL, Hess JL. Acute myeloid leukemia diagnosis in the 21stcentury. Arch Pathol Lab Med 2010;134:1427-33.
[3] Gale RE, Green C, Allen C, et al. The impact of FLT3 internal tandemduplication mutant level, number, size, and interaction with NPM1mutations in a large cohort of young adult patients with acute myeloidleukemia. Blood 2008;111:2776-84.
[4] Schlenk RF, Dohner K, Krauter J, et al. Mutations and treatmentoutcome in cytogenetically normal acute myeloid leukemia. N Engl JMed 2008;358:1909-18.
[5] Tefferi A, Lim KH, Abdel-Wahab O, et al. Detection of mutant TET2in myeloid malignancies other than myeloproliferative neoplasms:CMML, MDS, MDS/MPN and AML. Leukemia 2009;23:1343-5.
[6] Ley TJ, Ding L, Walter MJ, et al. DNMT3A mutations in acutemyeloid leukemia. N Engl J Med 2010;363:2424-33.
[7] Mardis ER, Ding L, Dooling DJ, et al. Recurring mutations found bysequencing an acute myeloid leukemia genome. N Engl J Med2009;361:1058-66.
[8] Marcucci G, Haferlach T, Dohner H. Molecular genetics of adult acutemyeloid leukemia: prognostic and therapeutic implications. J ClinOncol 2011;29:475-86.
[9] Dohner H, Estey EH, Amadori S, et al. Diagnosis and management ofacute myeloid leukemia in adults: recommendations from aninternational expert panel, on behalf of the European LeukemiaNet.Blood 2010;115:453-74.
[10] Beadling C, Heinrich MC, Warrick A, et al. Multiplex mutationscreening by mass spectrometry evaluation of 820 cases from apersonalized cancer medicine registry. J Mol Diagn 2011;13:504-13.
[11] Pabst T, Eyholzer M, Fos J, et al. Heterogeneity within AML withCEBPA mutations; only CEBPA double mutations, but not singleCEBPA mutations are associated with favourable prognosis. Br JCancer 2009;100:1343-6.
[12] MacConaill LE, Campbell CD, Kehoe SM, et al. Profiling critical cancergene mutations in clinical tumor samples. PLoS One 2009;4:e7887.
[13] Thomas RK, Baker AC, Debiasi RM, et al. High-throughput oncogenemutation profiling in human cancer. Nat Genet 2007;39:347-51.
[14] Ho PA, Alonzo TA, Kopecky KJ, et al. Molecular alterations of theIDH1 gene in AML: a Children's Oncology Group and SouthwestOncology Group study. Leukemia 2010;24:909-13.
[15] Patel KP, Ravandi F, Ma D, et al. Acute myeloid leukemia with IDH1or IDH2 mutation: frequency and clinicopathologic features. Am JClin Pathol 2011;135:35-45.
[16] Schnittger S, Haferlach C, Ulke M, et al. IDH1 mutations are detectedin 6.6% of 1414 AML patients and are associated with intermediaterisk karyotype and unfavorable prognosis in adults younger than 60years and unmutated NPM1 status. Blood 2010;116:5486-96.
[17] Paschka P, Schlenk RF, Gaidzik VI, et al. IDH1 and IDH2 mutationsare frequent genetic alterations in acute myeloid leukemia and conferadverse prognosis in cytogenetically normal acute myeloid leukemiawith NPM1 mutation without FLT3 internal tandem duplication. J ClinOncol 2010;28:3636-43.
[18] Damm F, Heuser M, Morgan M, et al. Integrative prognostic risk scorein acute myeloid leukemia with normal karyotype. Blood 2011;117:4561-8.
[19] Rockova V, Abbas S, Wouters BJ, et al. Risk stratification ofintermediate-risk acute myeloid leukemia: integrative analysis of amultitude of gene mutation and gene expression markers. Blood2011;118:1069-76.
[20] Shen Y, Zhu YM, Fan X, et al. Gene mutation patterns and theirprognostic impact in a cohort of 1185 patients with acute myeloidleukemia. Blood 2011;118:5593-603.
[21] Shih LY, Huang CF, Wang PN, et al. Acquisition of FLT3 or N-rasmutations is frequently associated with progression of myelodysplasticsyndrome to acute myeloid leukemia. Leukemia 2004;18:466-75.
[22] Bacher U, Haferlach T, Schoch C, et al. Implications of NRASmutations in AML: a study of 2502 patients. Blood 2006;107:3847-53.
[23] Bowen DT, Frew ME, Hills R, et al. RAS mutation in acute myeloidleukemia is associated with distinct cytogenetic subgroups but does notinfluence outcome in patients younger than 60 years. Blood 2005;106:2113-9.
[24] Kiessling MK, Oberholzer PA, Mondal C, et al. High-throughputmutation profiling of CTCL samples reveals KRAS and NRASmutations sensitizing tumors toward inhibition of the RAS/RAF/MEKsignaling cascade. Blood 2011;117:2433-40.


![[Ghiduri][Cancer]Acute Myeloid Leukemia](https://img.dokumen.tips/doc/110x75/55cf9686550346d0338c0f55/ghiduricanceracute-myeloid-leukemia.jpg)