Embed Size (px)
Citation preview
MyelodysplasiaAcute Myeloid Leukemia
Chronic Myelogenous LeukemiaNon Hodgkin Lymphoma
Chronic Lymphocytic LeukemiaPlasma Cell (Multiple) Myeloma
Hodgkin Lymphoma
• Case• Pathophysiology• Diagnosis• Prognosis• Epidemology/Statistics• Clinical• Treatment
Overview
Louis F. Diehl, MDProfessor of MedicineDuke University Medical Center
Patrick J. Buckley, MD, PhDProfessor of PathologyDuke University Medical Center
Pathology Clinical
Hematopoietic Neoplasms
Introduction
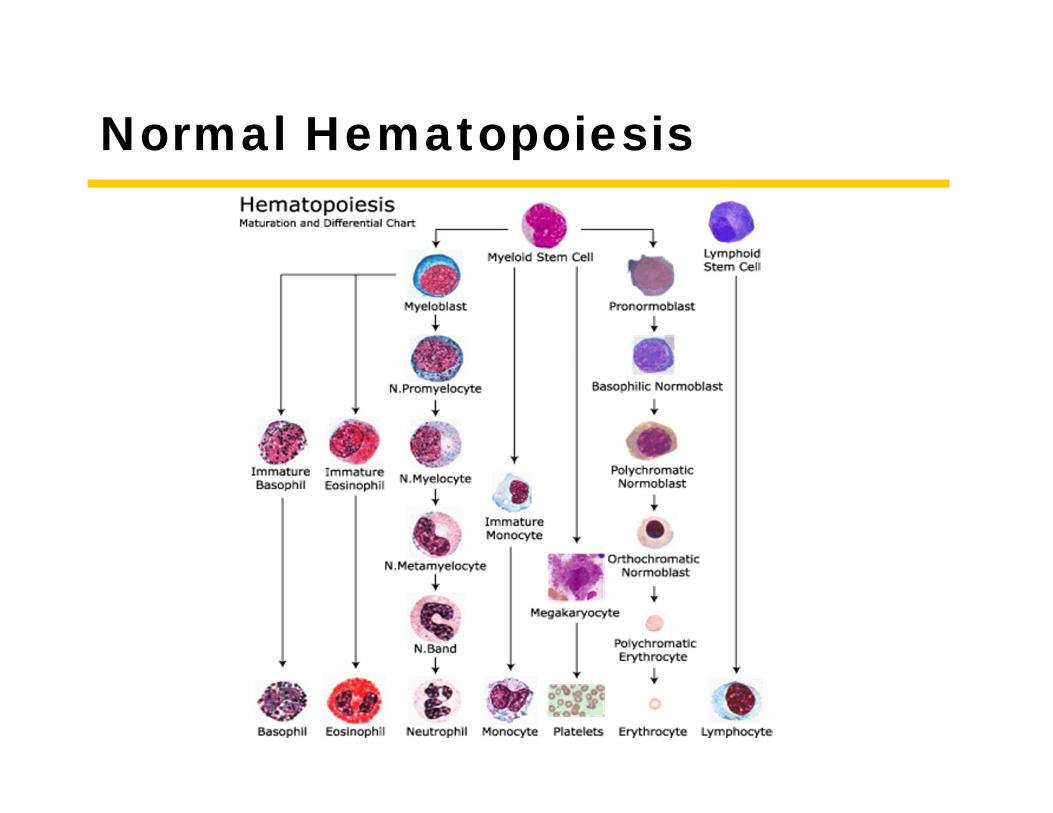
Normal Hematopoiesis
Leukemia
• Monoclonal neoplasm of bone marrow cells typically characterized by a proliferation of immature cells (blasts) in bone marrow/blood
• Major types are lymphoid and nonlymphoid (the latter commonly called “myeloid” leukemia)
• Divided into acute (develops over weeks to months) and chronic (develops over months to years)
Lymphoma
• Monoclonal neoplasm of lymphocytes• These lymphocyte proliferations usually
form tumors (-omas) in lymph nodes and/or in extranodal lymphoid tissues
• Major categories are T-cell lymphomas and B-cell lymphomas
Tools
Tools of the Trade
Techniques used for the diagnosis of hematopoietic and lymphoid disorders
Morphology
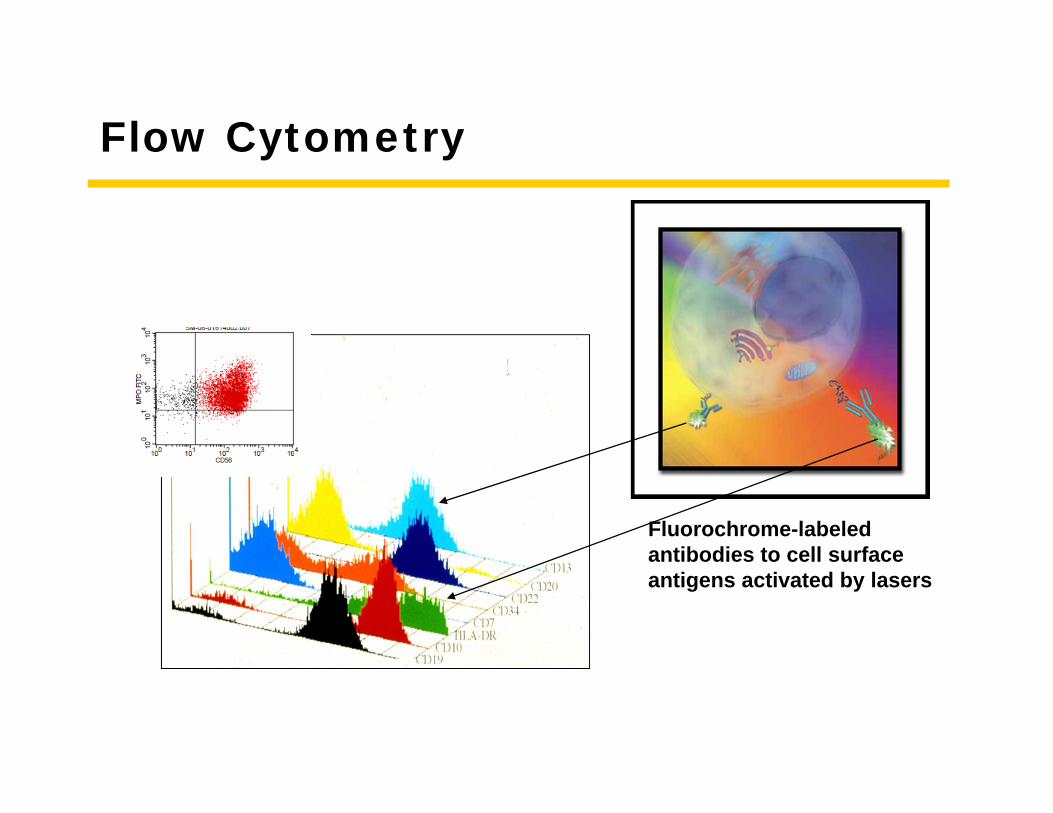
Flow Cytometry
Fluorochrome-labeled antibodies to cell surface antigens activated by lasers
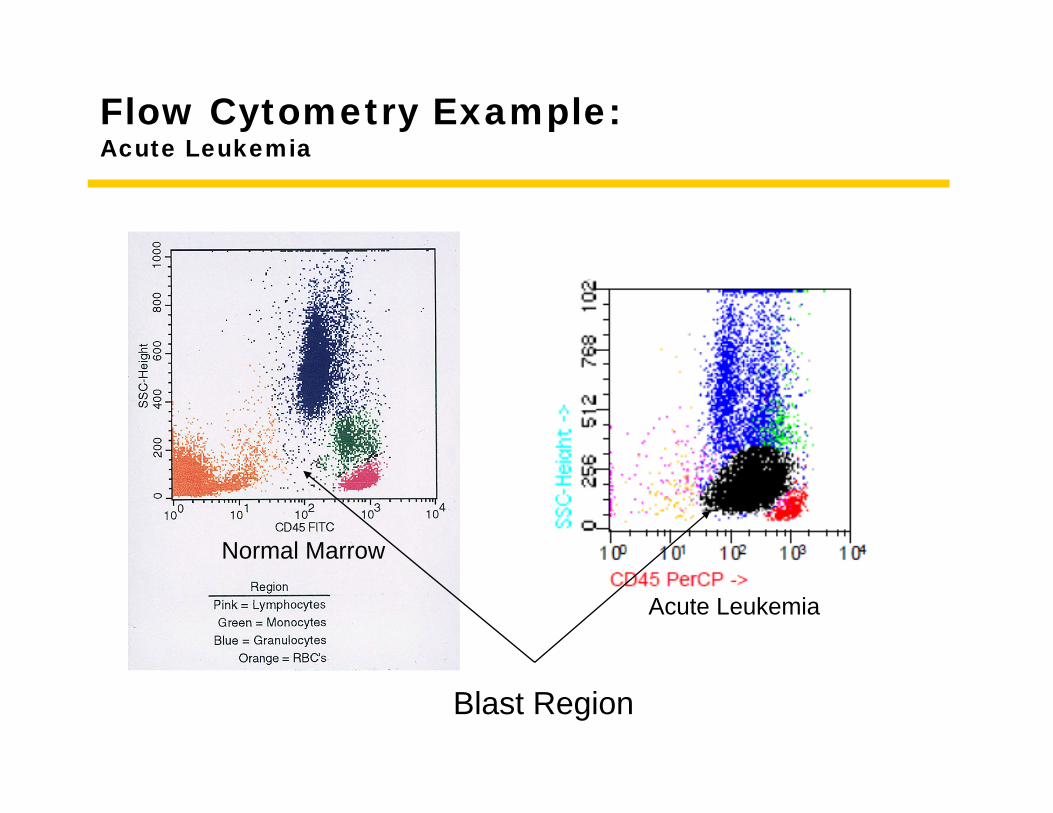
Flow Cytometry Example:Acute Leukemia
Normal Marrow
Acute Leukemia
Blast Region
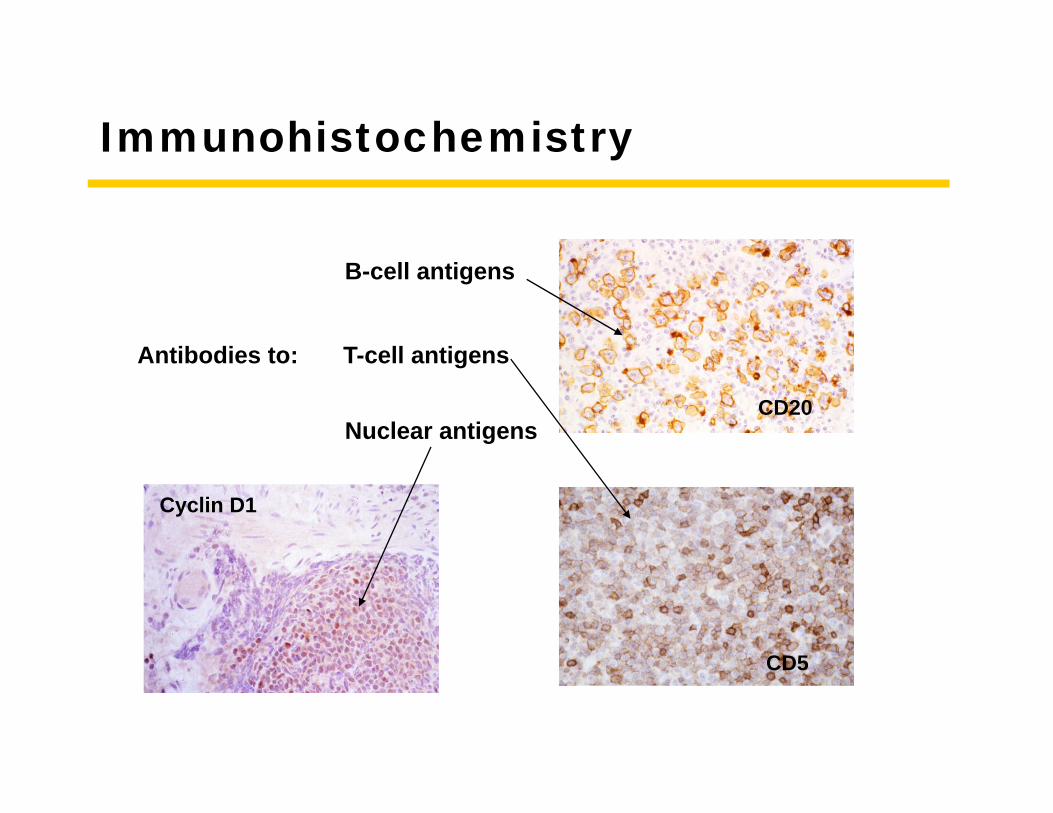
Immunohistochemistry
Cyclin D1
CD20
CD5
Antibodies to:
B-cell antigens
T-cell antigens
Nuclear antigens
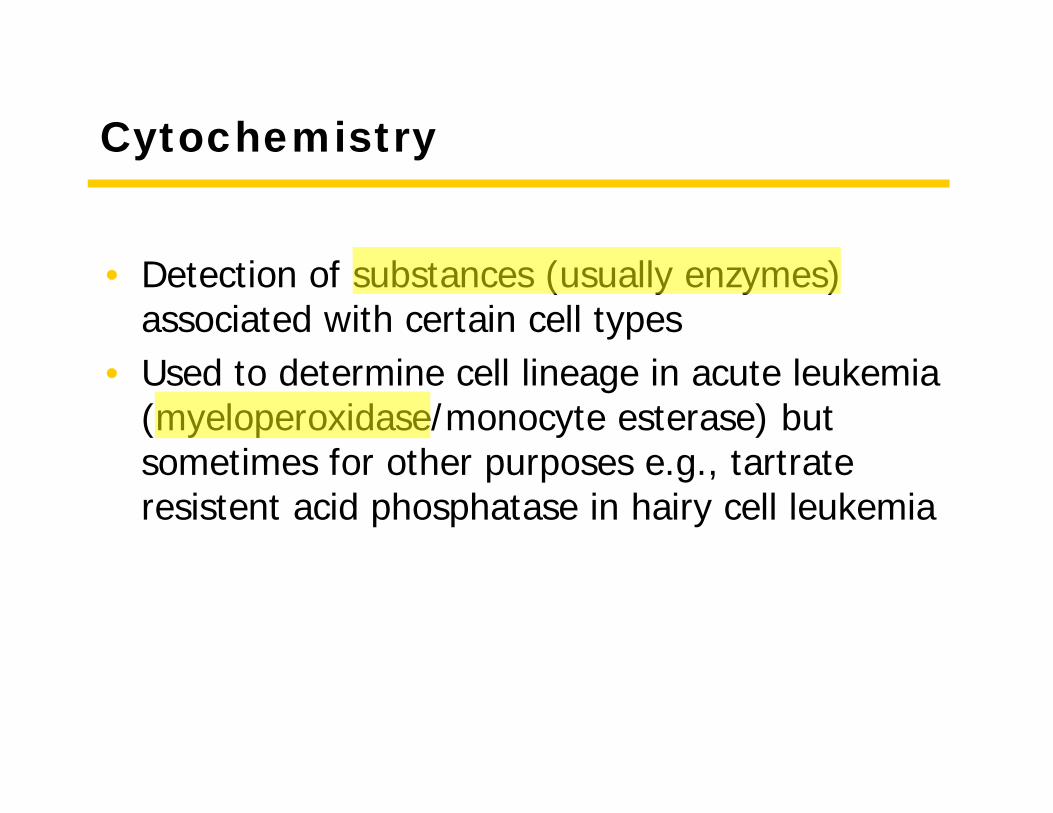
Cytochemistry
• Detection of substances (usually enzymes) associated with certain cell types
• Used to determine cell lineage in acute leukemia (myeloperoxidase/monocyte esterase) but sometimes for other purposes e.g., tartrate resistent acid phosphatase in hairy cell leukemia
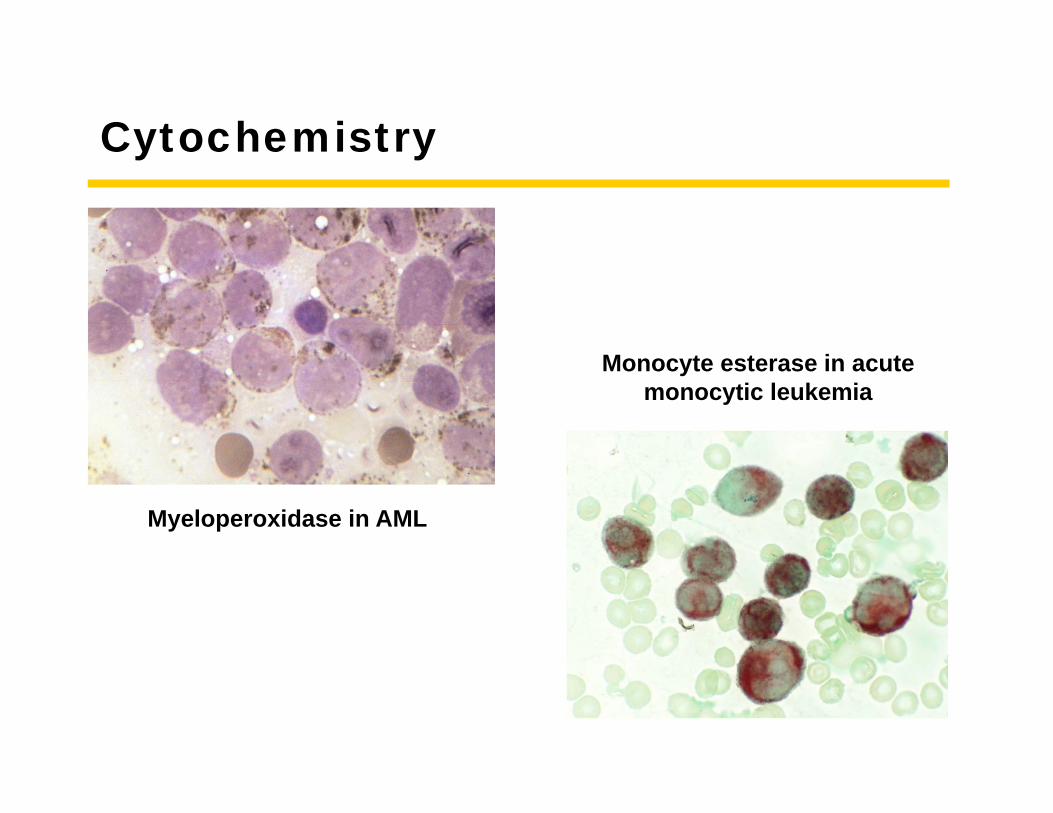
Cytochemistry
Myeloperoxidase in AML
Monocyte esterase in acute monocytic leukemia
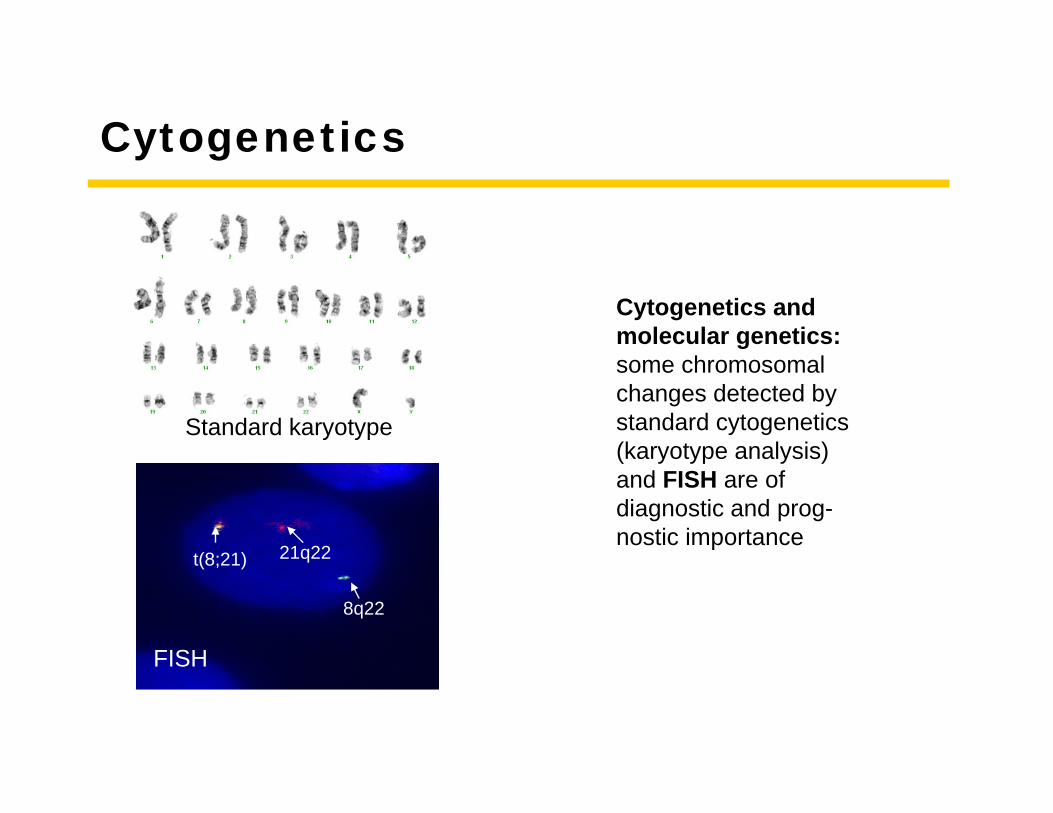
Cytogenetics
Cytogenetics and molecular genetics: some chromosomal changes detected by standard cytogenetics (karyotype analysis) and FISH are of diagnostic and prog-nostic importance
Standard karyotype
FISH
8q22
21q22t(8;21)
Molecular Techniques
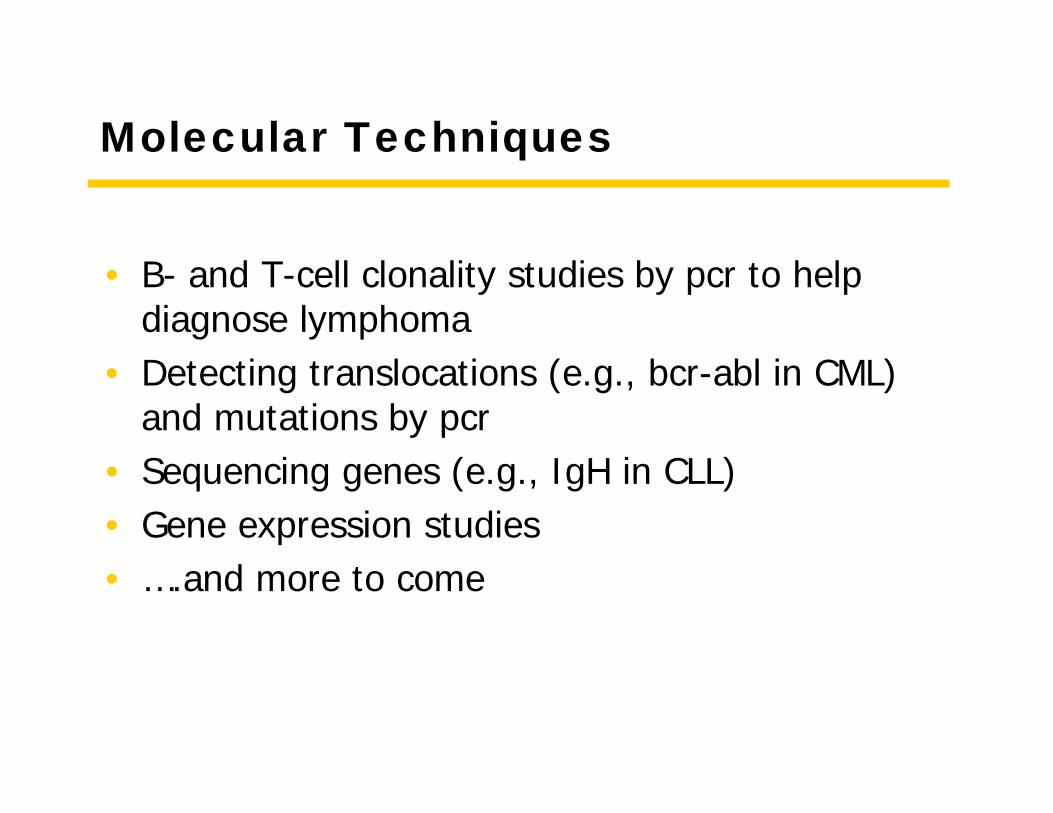
• B- and T-cell clonality studies by pcr to help diagnose lymphoma
• Detecting translocations (e.g., bcr-abl in CML) and mutations by pcr
• Sequencing genes (e.g., IgH in CLL)• Gene expression studies• ….and more to come
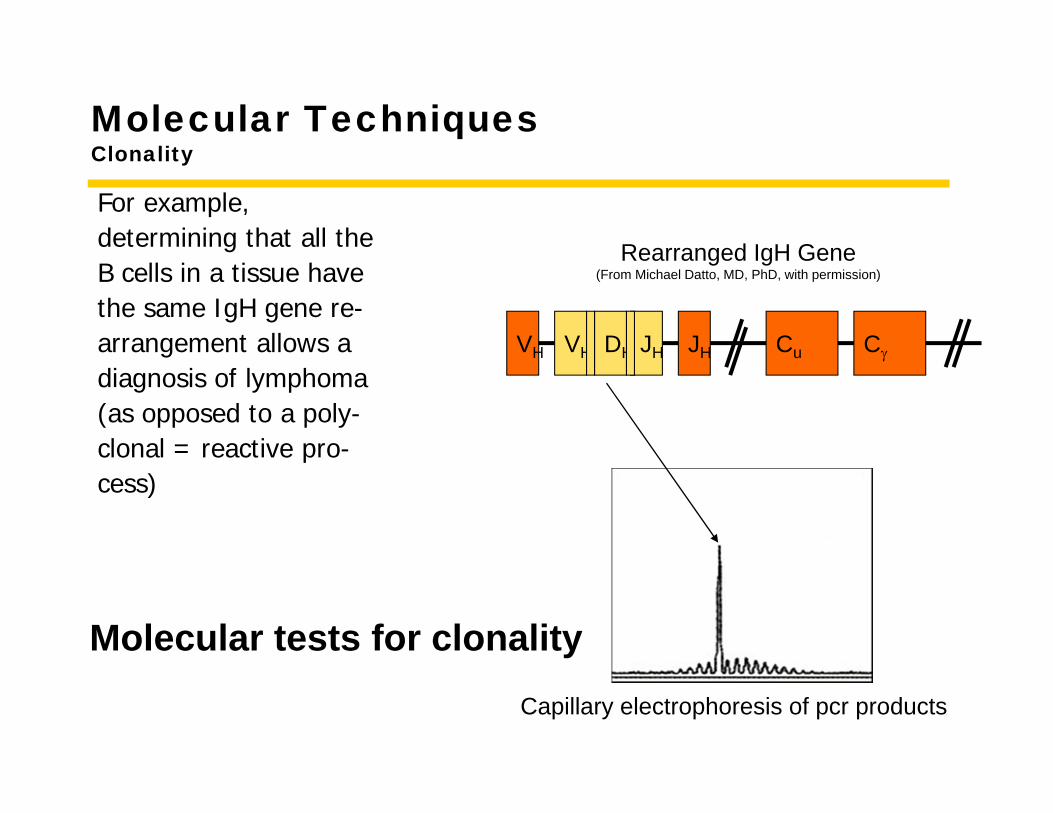
Molecular TechniquesClonality
For example,determining that all theB cells in a tissue havethe same IgH gene re-arrangement allows adiagnosis of lymphoma(as opposed to a poly-clonal = reactive pro-cess)
VH VH DH JH JH CCu
Rearranged IgH Gene(From Michael Datto, MD, PhD, with permission)
Capillary electrophoresis of pcr products
Molecular tests for clonality
Disease 1
Myelodysplasia
Case 1
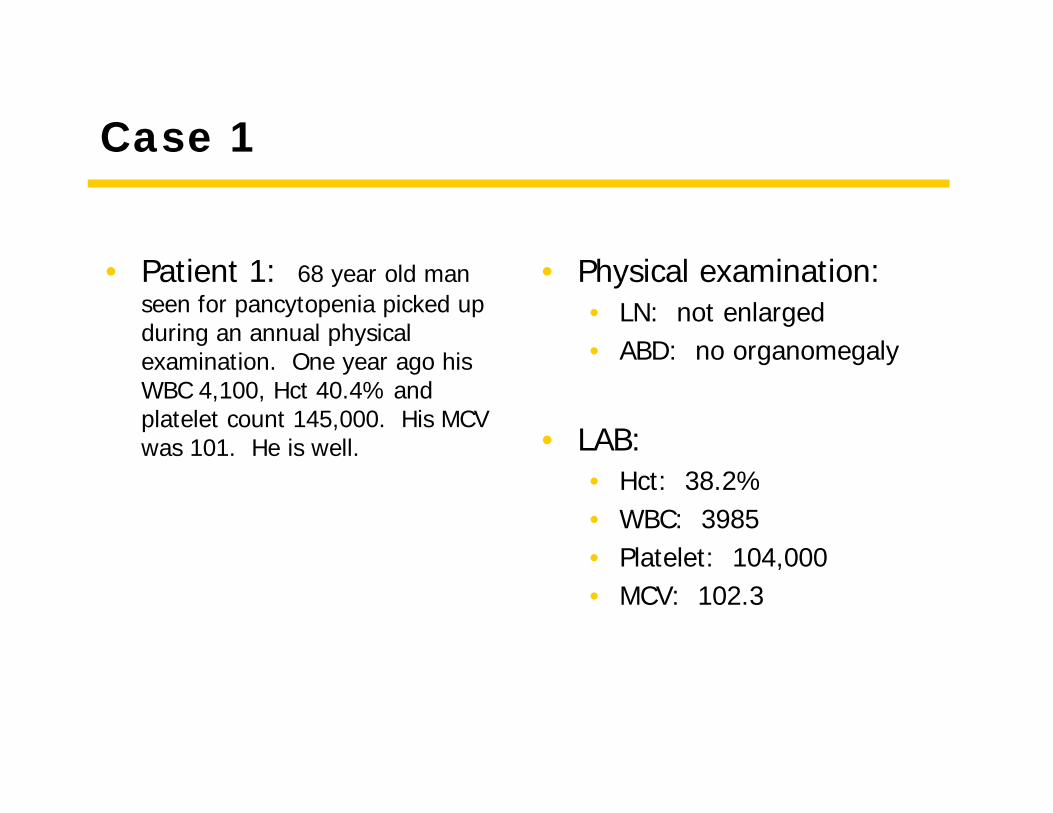
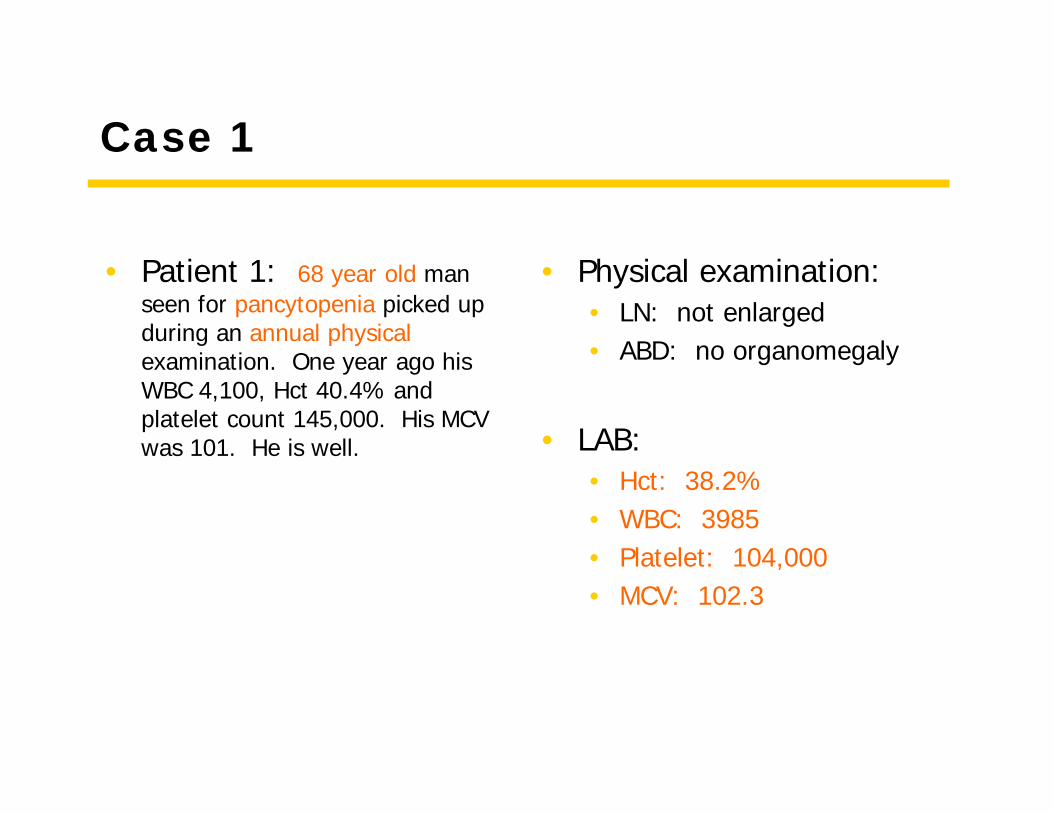
• Patient 1: 68 year old man seen for pancytopenia picked up during an annual physical examination. One year ago his WBC 4,100, Hct 40.4% and platelet count 145,000. His MCV was 101. He is well.
• Physical examination:• LN: not enlarged• ABD: no organomegaly
• LAB:• Hct: 38.2%• WBC: 3985• Platelet: 104,000• MCV: 102.3
Case 1
• Patient 1: 68 year old man seen for pancytopenia picked up during an annual physicalexamination. One year ago his WBC 4,100, Hct 40.4% and platelet count 145,000. His MCV was 101. He is well.
• Physical examination:• LN: not enlarged• ABD: no organomegaly
• LAB:• Hct: 38.2%• WBC: 3985• Platelet: 104,000• MCV: 102.3
Case 1
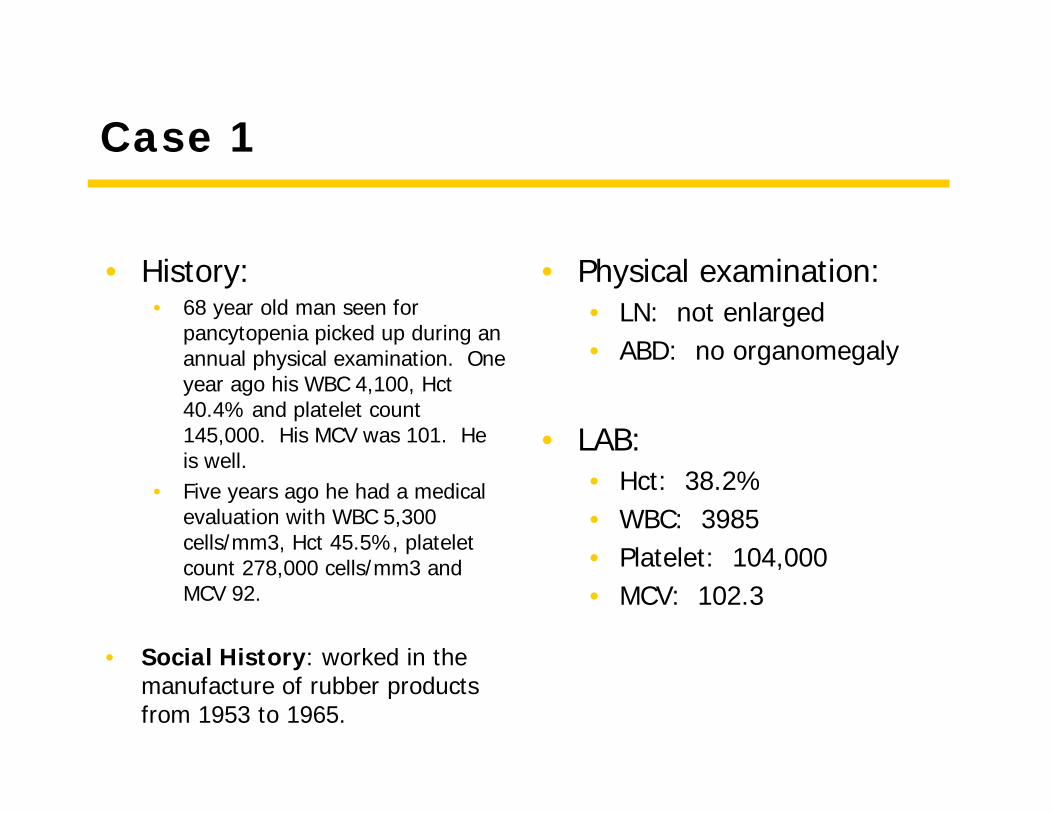
• History: • 68 year old man seen for
pancytopenia picked up during an annual physical examination. One year ago his WBC 4,100, Hct 40.4% and platelet count 145,000. His MCV was 101. He is well.
• Five years ago he had a medical evaluation with WBC 5,300 cells/mm3, Hct 45.5%, platelet count 278,000 cells/mm3 and MCV 92.
• Social History: worked in the manufacture of rubber products from 1953 to 1965.
• Physical examination:• LN: not enlarged• ABD: no organomegaly
• LAB:• Hct: 38.2%• WBC: 3985• Platelet: 104,000• MCV: 102.3
Case 1
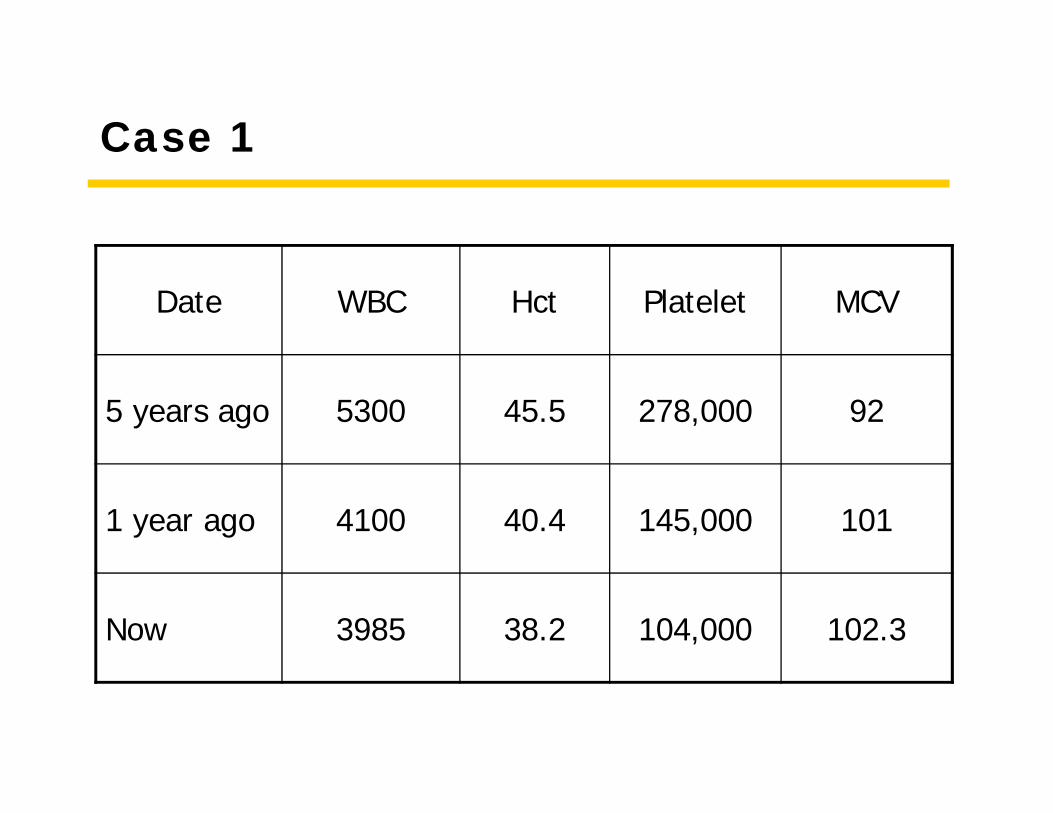
Date WBC Hct Platelet MCV
5 years ago 5300 45.5 278,000 92
1 year ago 4100 40.4 145,000 101
Now 3985 38.2 104,000 102.3
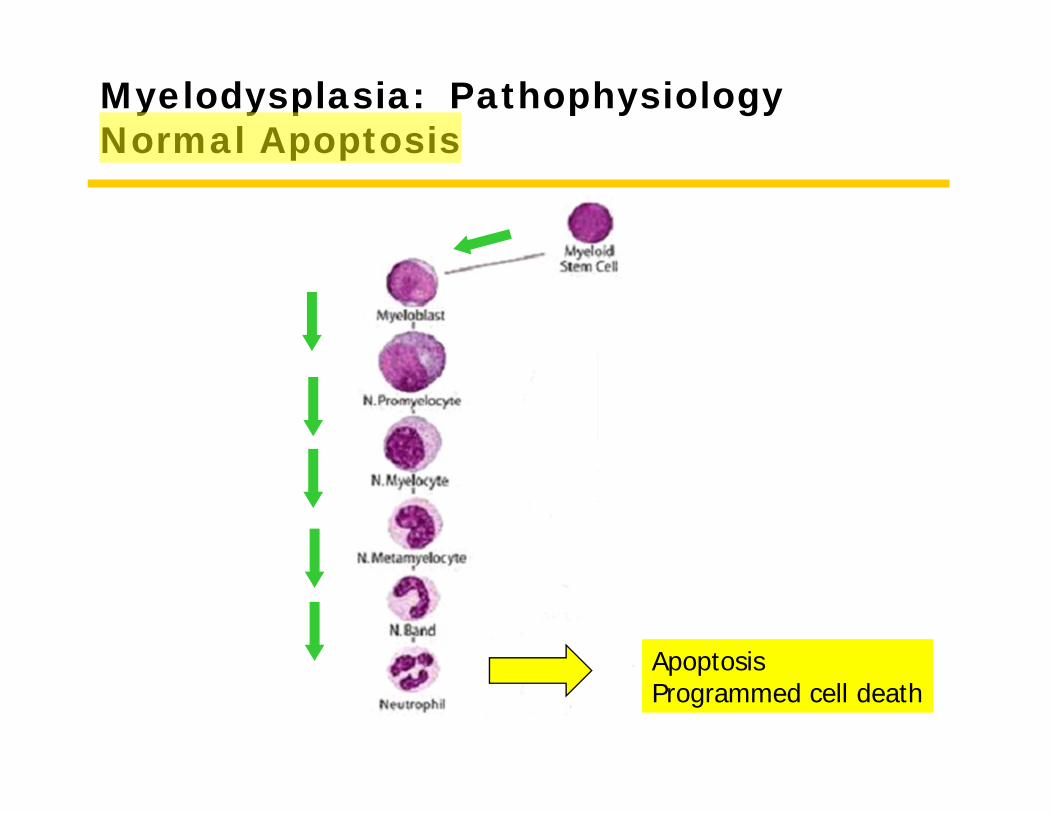
Myelodysplasia: PathophysiologyNormal Apoptosis
ApoptosisProgrammed cell death
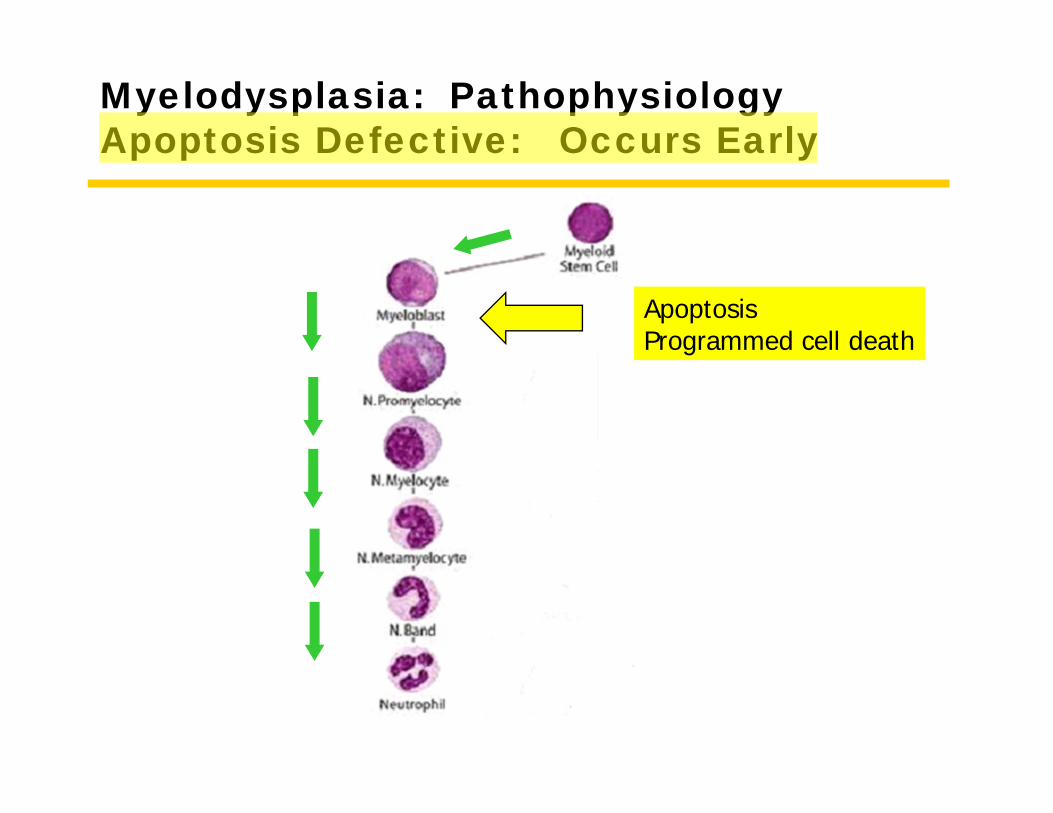
Myelodysplasia: Pathophysiology Apoptosis Defective: Occurs Early
ApoptosisProgrammed cell death
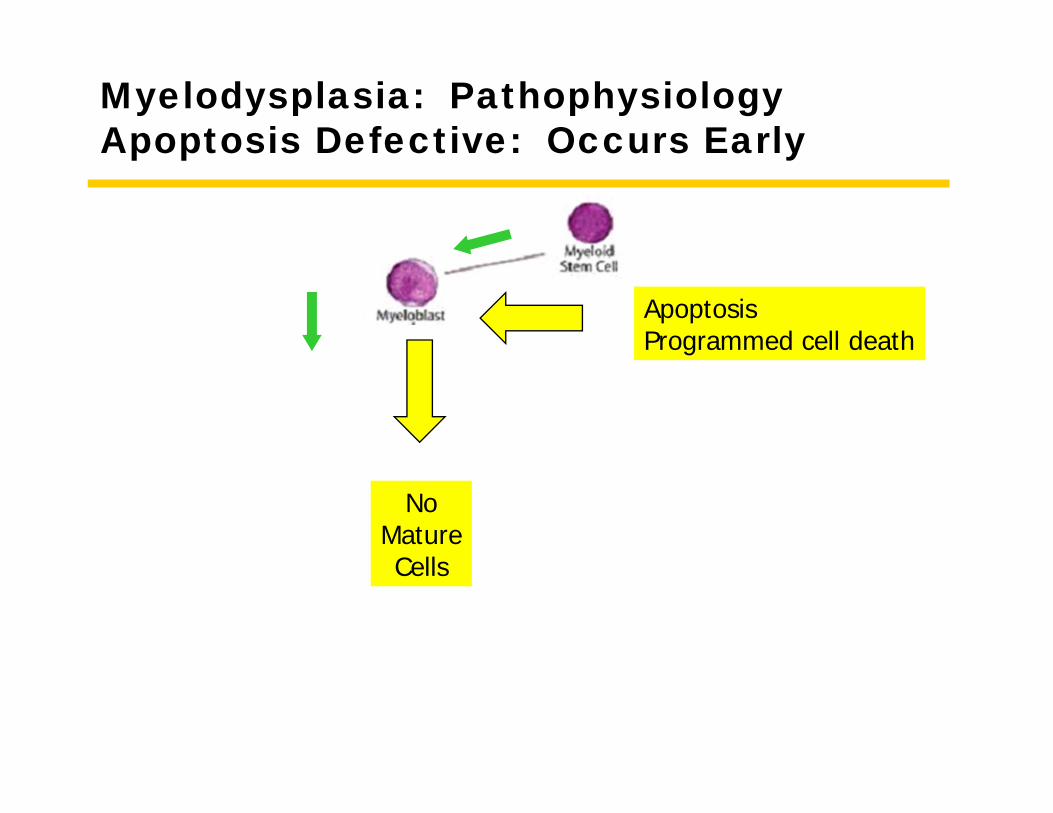
Myelodysplasia: Pathophysiology Apoptosis Defective: Occurs Early
ApoptosisProgrammed cell death
NoMatureCells
Definition - Standard
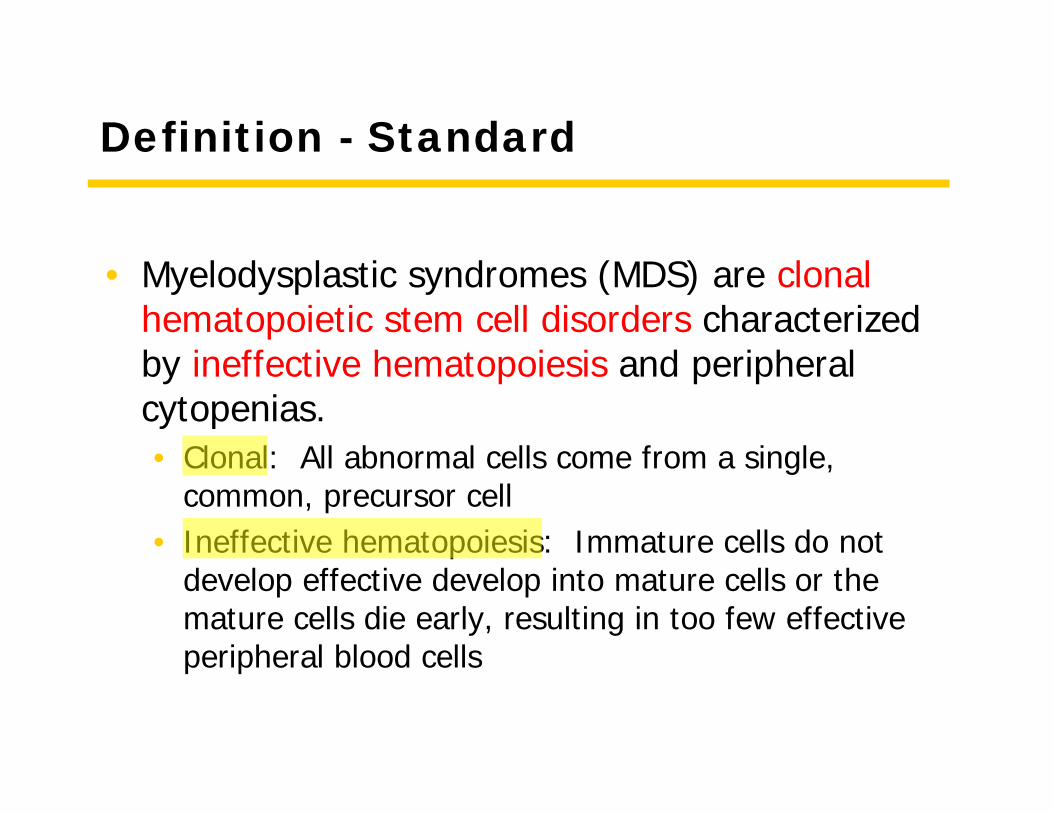
• Myelodysplastic syndromes (MDS) are clonal hematopoietic stem cell disorders characterized by ineffective hematopoiesis and peripheral cytopenias. • Clonal: All abnormal cells come from a single,
common, precursor cell• Ineffective hematopoiesis: Immature cells do not
develop effective develop into mature cells or the mature cells die early, resulting in too few effective peripheral blood cells
Definition - Explanatory
• The developing hematopoietic cell dies before it reaches maturity.
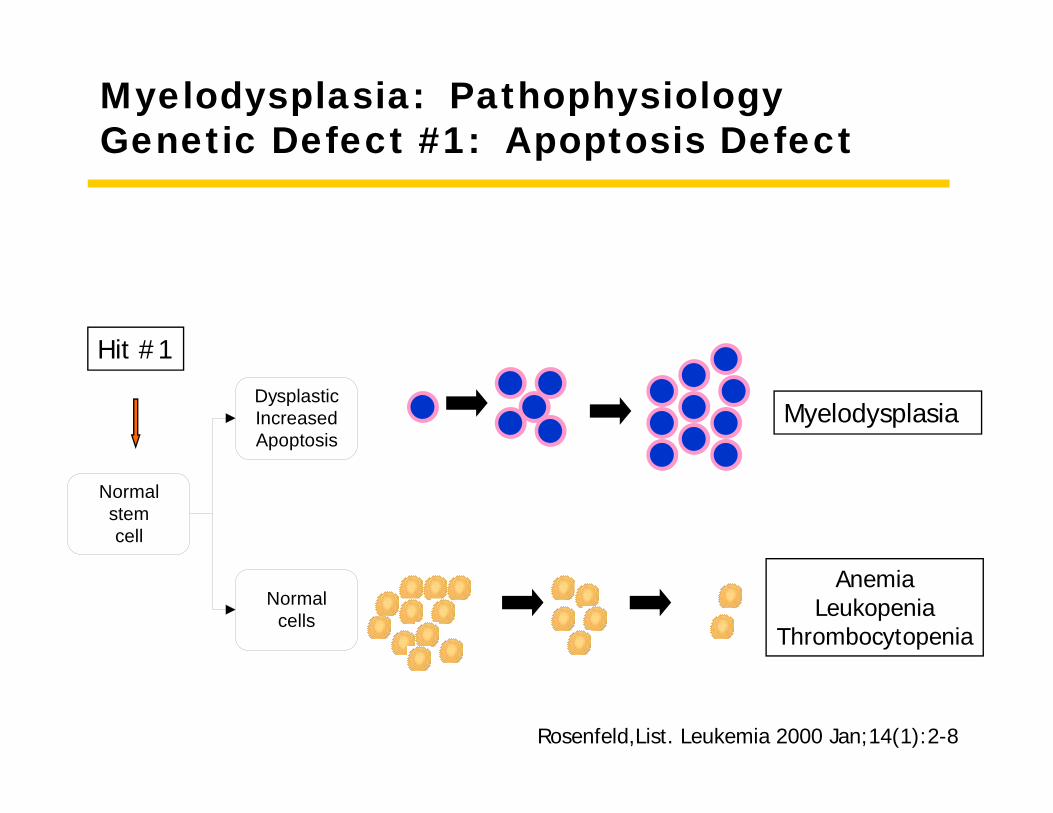
Myelodysplasia: PathophysiologyGenetic Defect #1: Apoptosis Defect
AnemiaLeukopenia
Thrombocytopenia
Normal stem cell
Dysplastic Increased Apoptosis
Normal cells
Hit #1
Myelodysplasia
Rosenfeld,List. Leukemia 2000 Jan;14(1):2-8
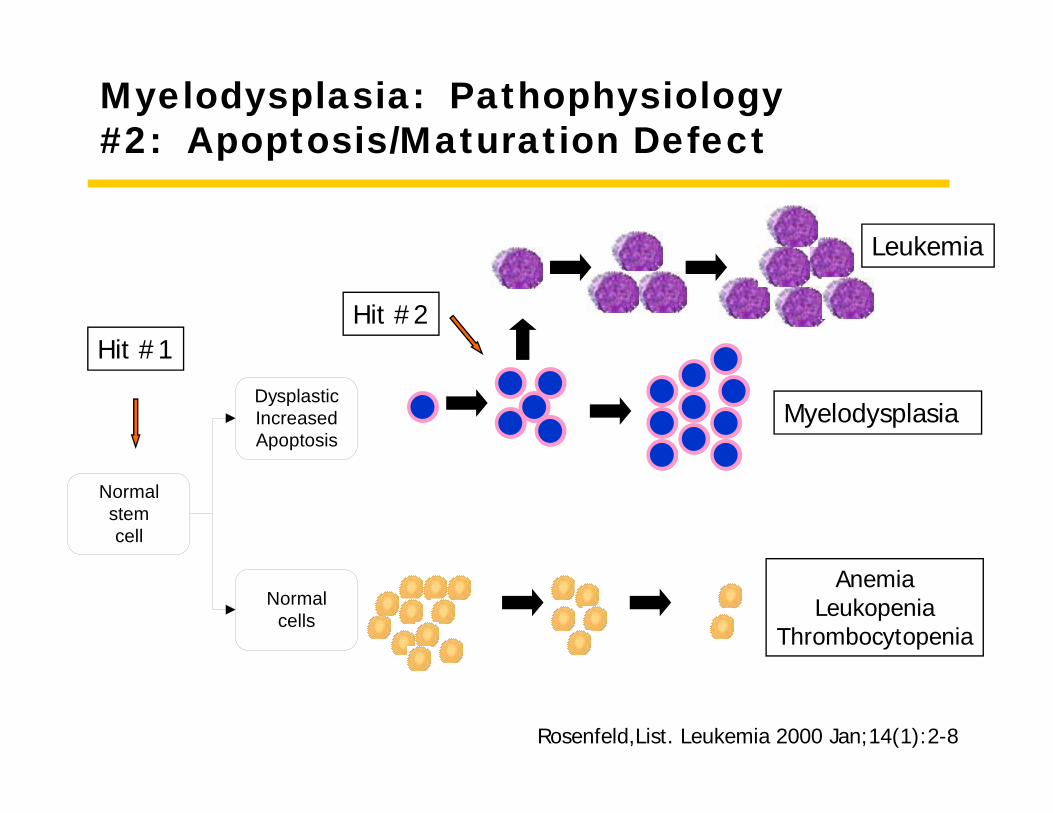
Myelodysplasia: Pathophysiology#2: Apoptosis/Maturation Defect
AnemiaLeukopenia
Thrombocytopenia
Normal stem cell
Dysplastic Increased Apoptosis
Normal cells
Hit #1Hit #2
Leukemia
Myelodysplasia
Rosenfeld,List. Leukemia 2000 Jan;14(1):2-8
MyelodysplasiaDiagnosis
• Morphology• Cytogenetics
MyelodysplasiaDiagnosis
Pathology
Myelodysplasia
Morphology
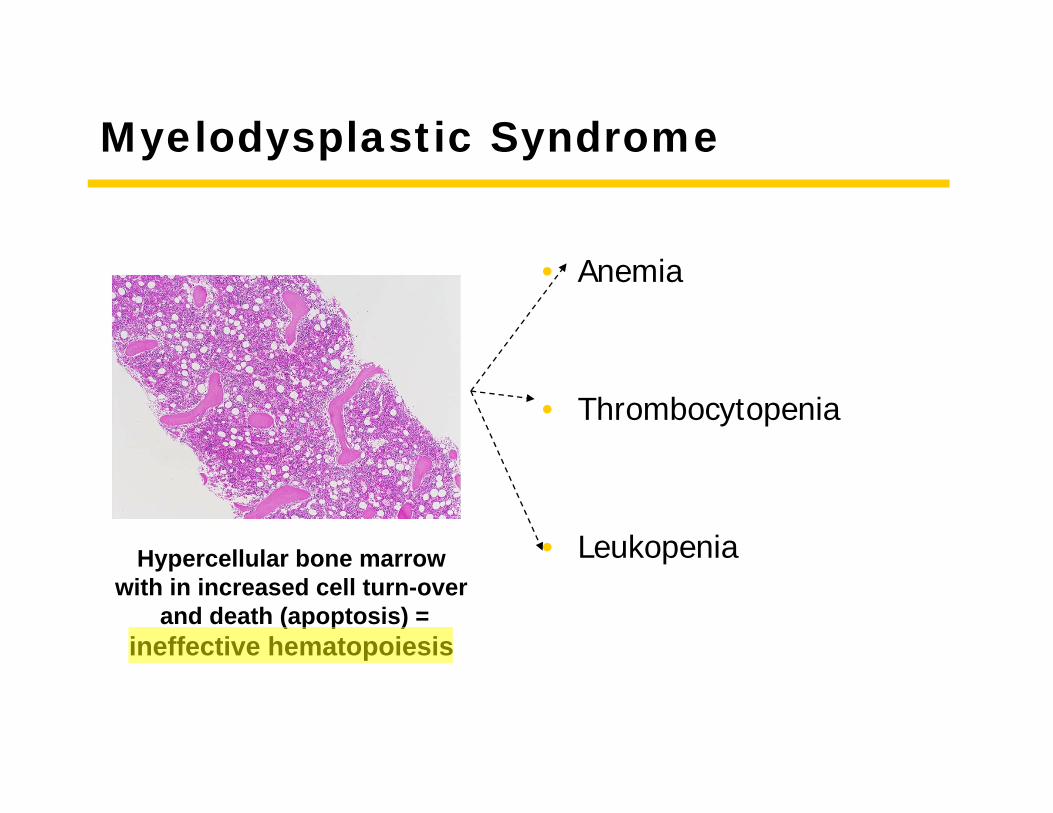
Myelodysplastic Syndrome
• Anemia
• Thrombocytopenia
• LeukopeniaHypercellular bone marrowwith in increased cell turn-over
and death (apoptosis) = ineffective hematopoiesis
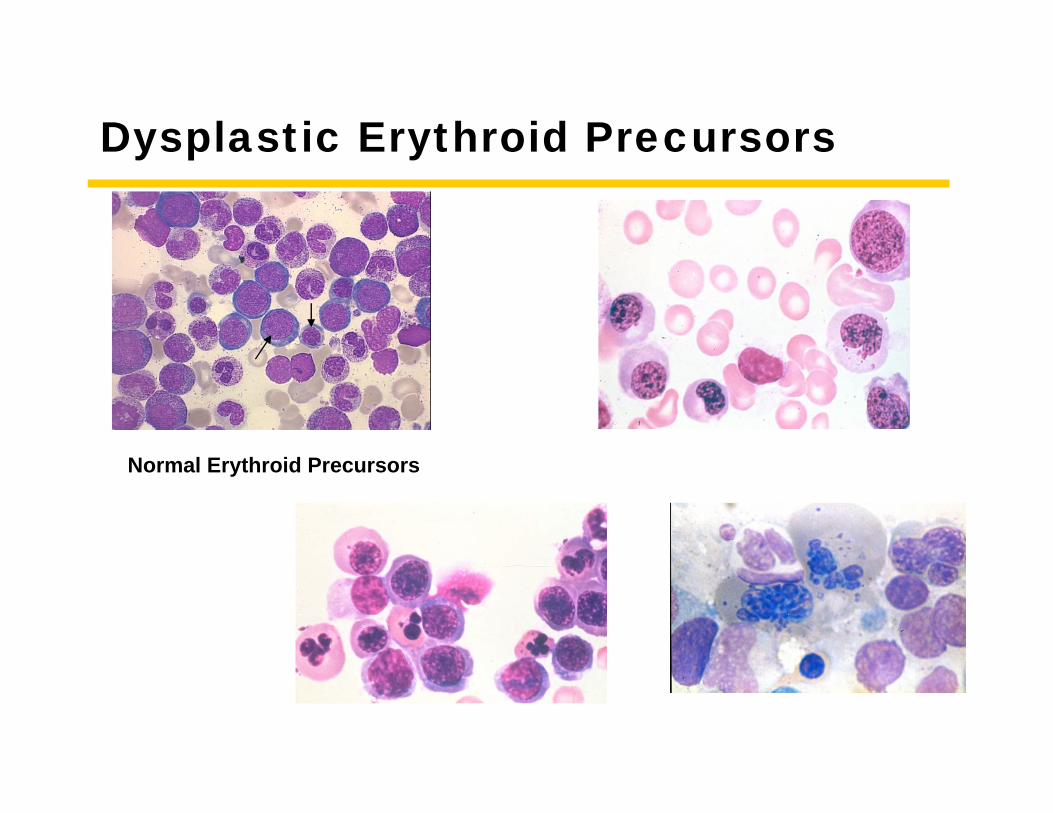
Dysplastic Erythroid Precursors
Normal Erythroid Precursors
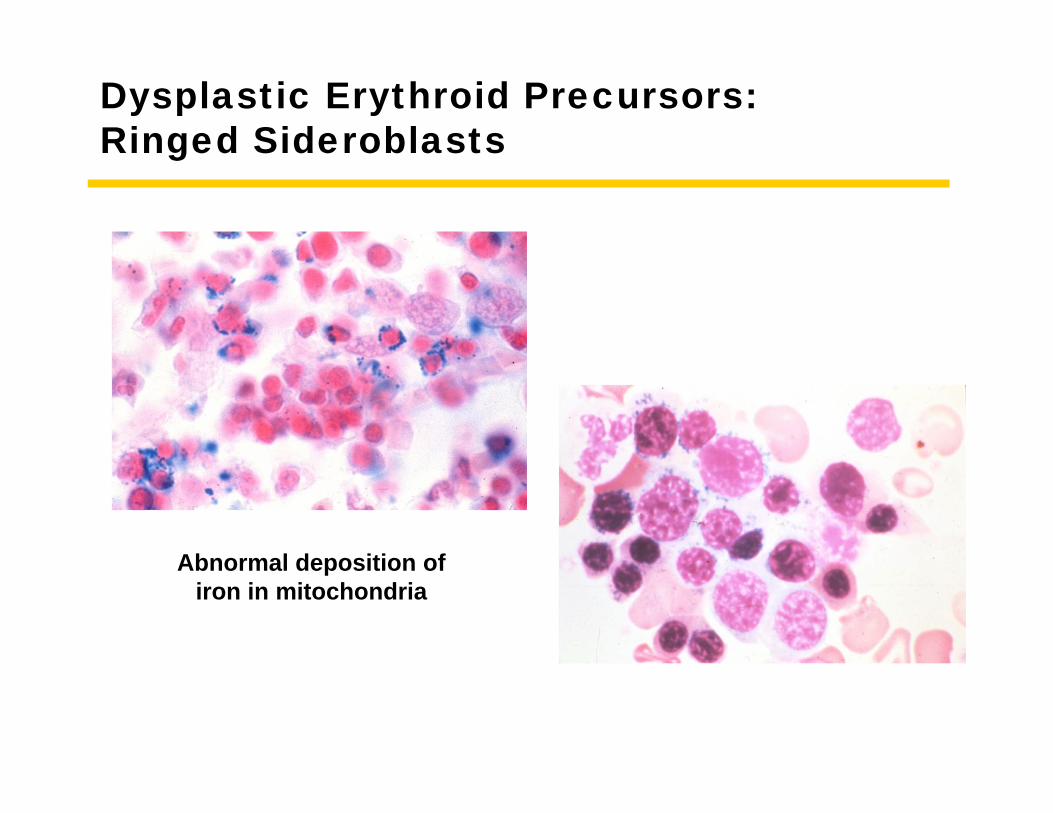
Dysplastic Erythroid Precursors:Ringed Sideroblasts
Abnormal deposition ofiron in mitochondria
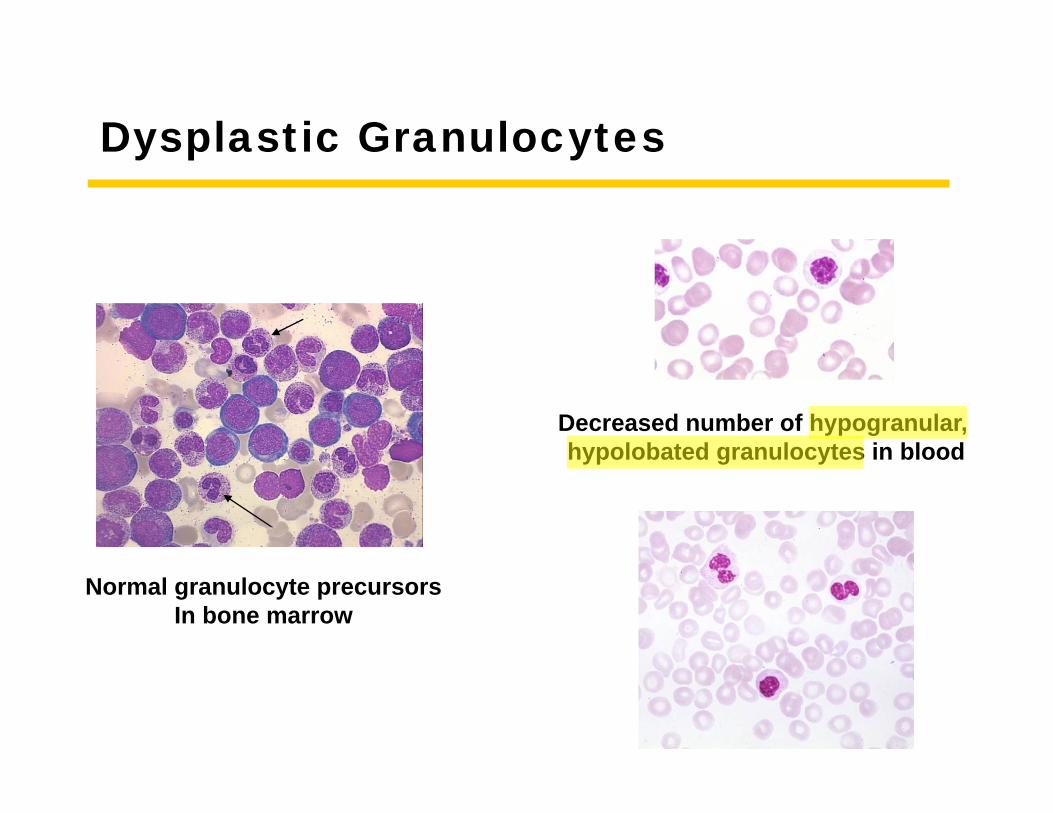
Dysplastic Granulocytes
Normal granulocyte precursorsIn bone marrow
Decreased number of hypogranular, hypolobated granulocytes in blood
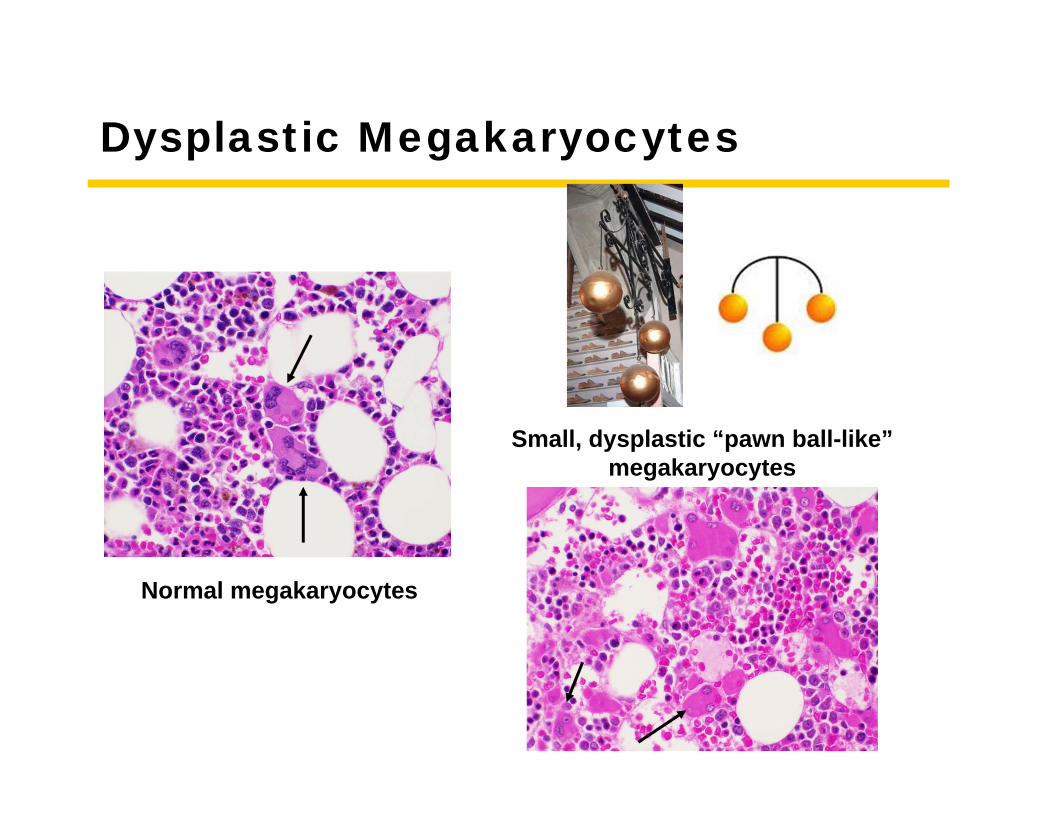
Dysplastic Megakaryocytes
Normal megakaryocytes
Small, dysplastic “pawn ball-like”megakaryocytes
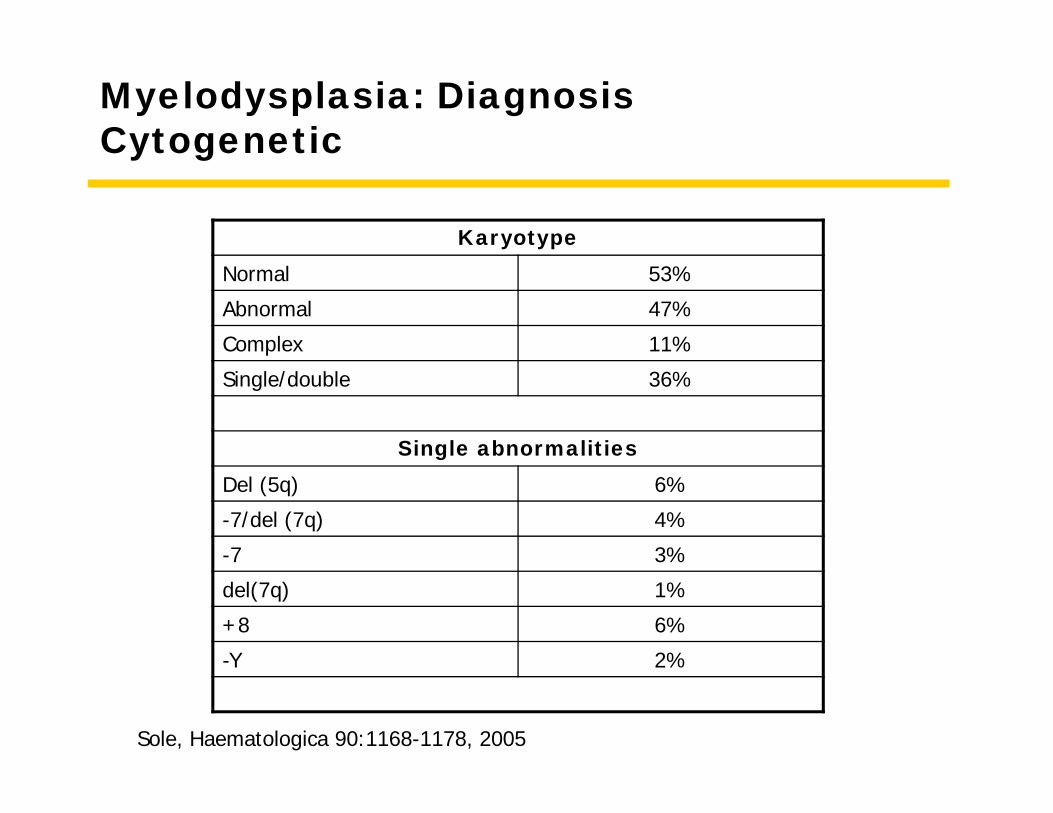
Myelodysplasia: Diagnosis Cytogenetic
KaryotypeNormal 53%
Abnormal 47%
Complex 11%
Single/double 36%
Single abnormalitiesDel (5q) 6%
-7/del (7q) 4%
-7 3%
del(7q) 1%
+8 6%
-Y 2%
Sole, Haematologica 90:1168-1178, 2005
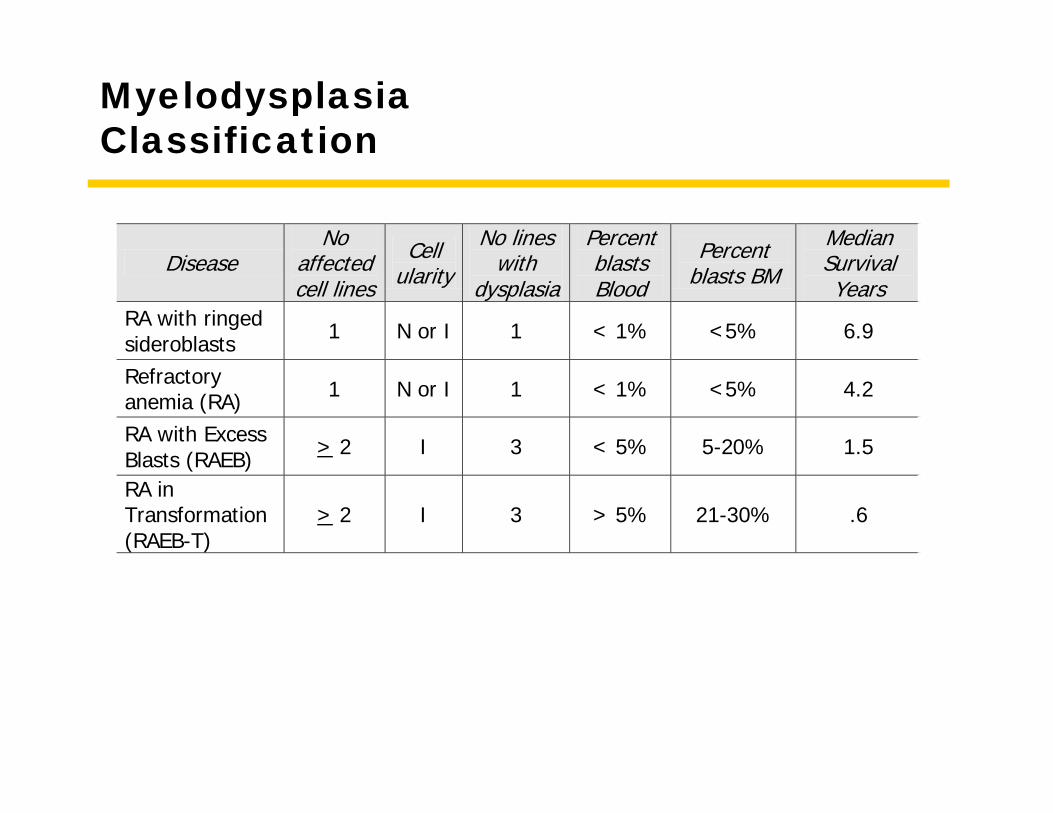
MyelodysplasiaClassification
Disease No
affected cell lines
Cell ularity
No lines with
dysplasia
Percent blasts Blood
Percent blasts BM
Median Survival Years
RA with ringed sideroblasts 1 N or I 1 < 1% <5% 6.9
Refractory anemia (RA) 1 N or I 1 < 1% <5% 4.2
RA with Excess Blasts (RAEB) > 2 I 3 < 5% 5-20% 1.5
RA in Transformation (RAEB-T)
> 2 I 3 > 5% 21-30% .6
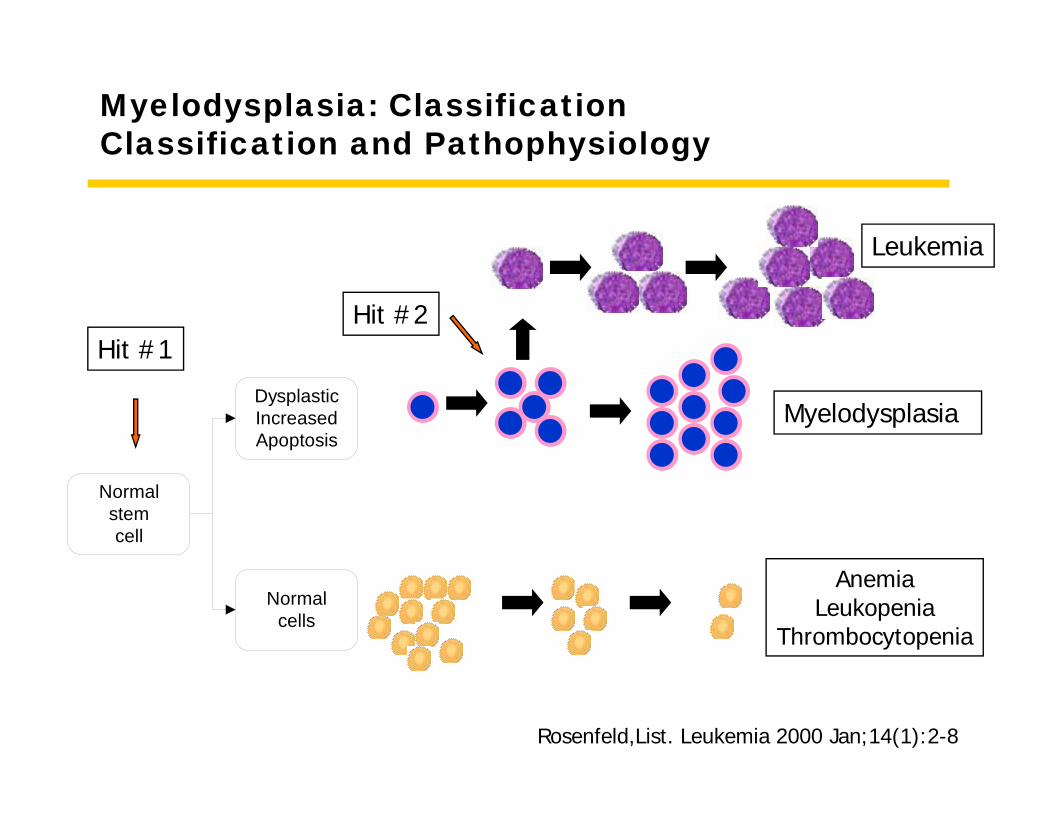
Myelodysplasia: Classification Classification and Pathophysiology
AnemiaLeukopenia
Thrombocytopenia
Normal stem cell
Dysplastic Increased Apoptosis
Normal cells
Hit #1Hit #2
Leukemia
Myelodysplasia
Rosenfeld,List. Leukemia 2000 Jan;14(1):2-8
Classification & Prognosis
• Classification• Cell lines affected• Blasts in bone marrow
• Prognosis• Blasts• Cytogenetics• Cytopenias
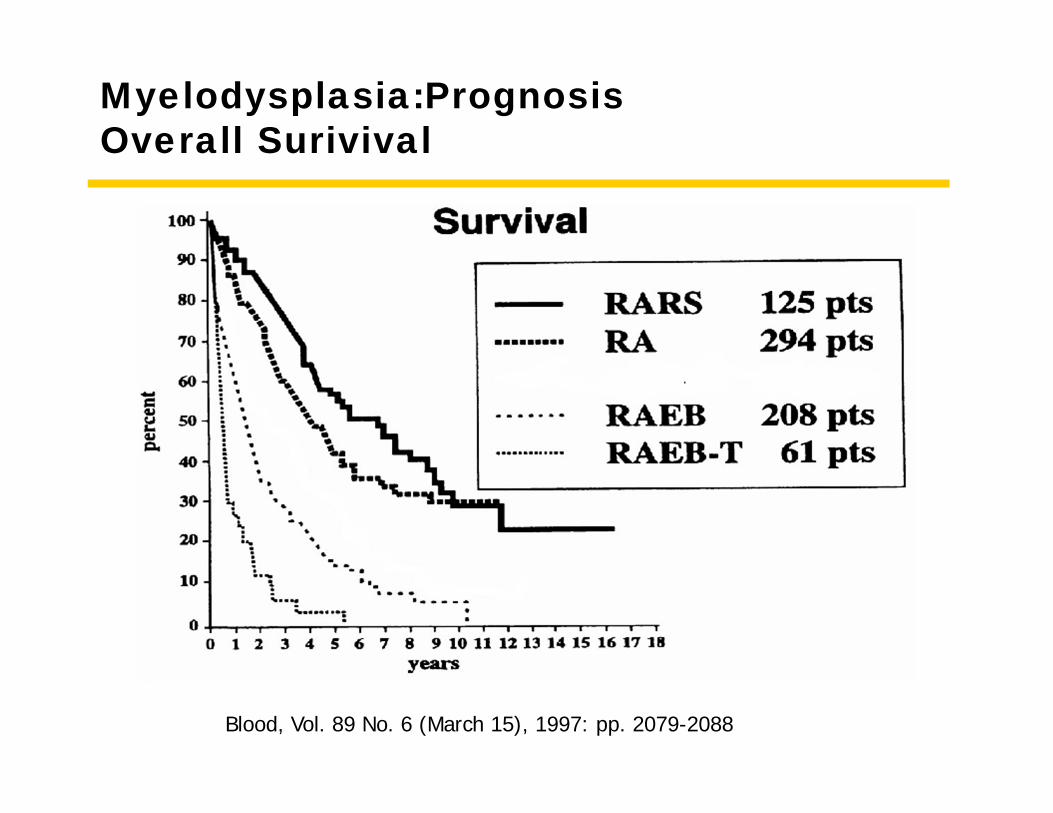
Myelodysplasia:PrognosisOverall Surivival
Blood, Vol. 89 No. 6 (March 15), 1997: pp. 2079-2088
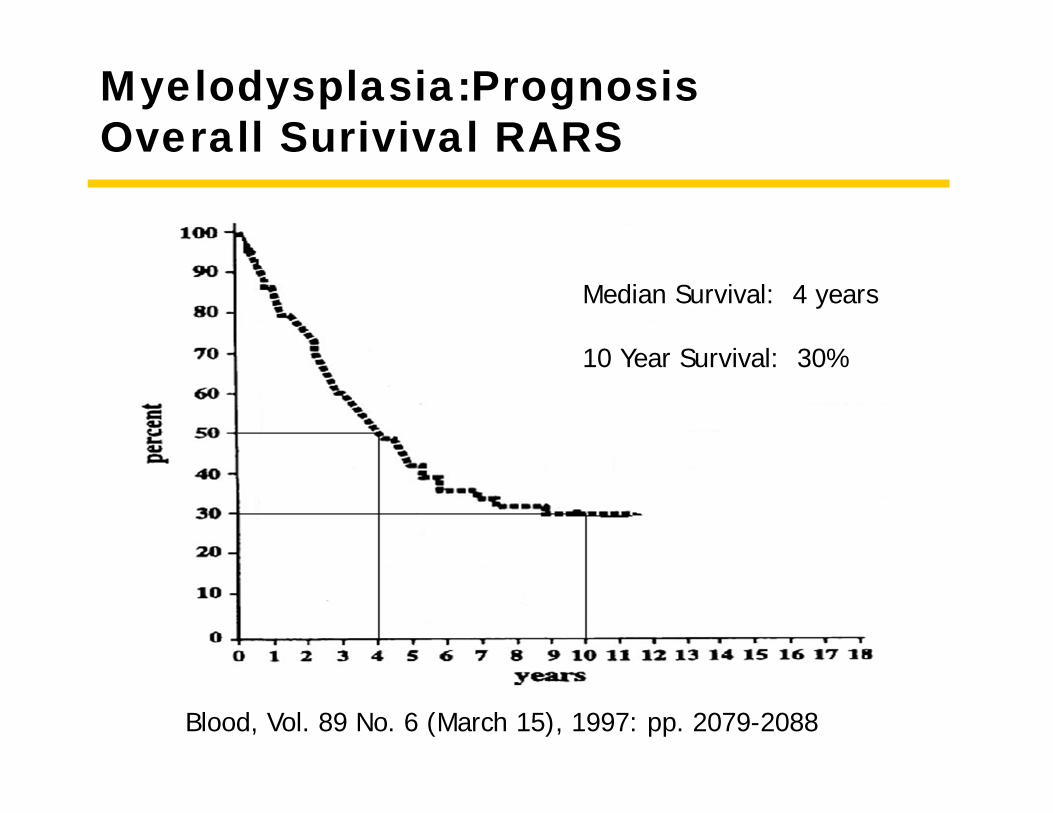
Myelodysplasia:PrognosisOverall Surivival RARS
Blood, Vol. 89 No. 6 (March 15), 1997: pp. 2079-2088
Median Survival: 4 years
10 Year Survival: 30%
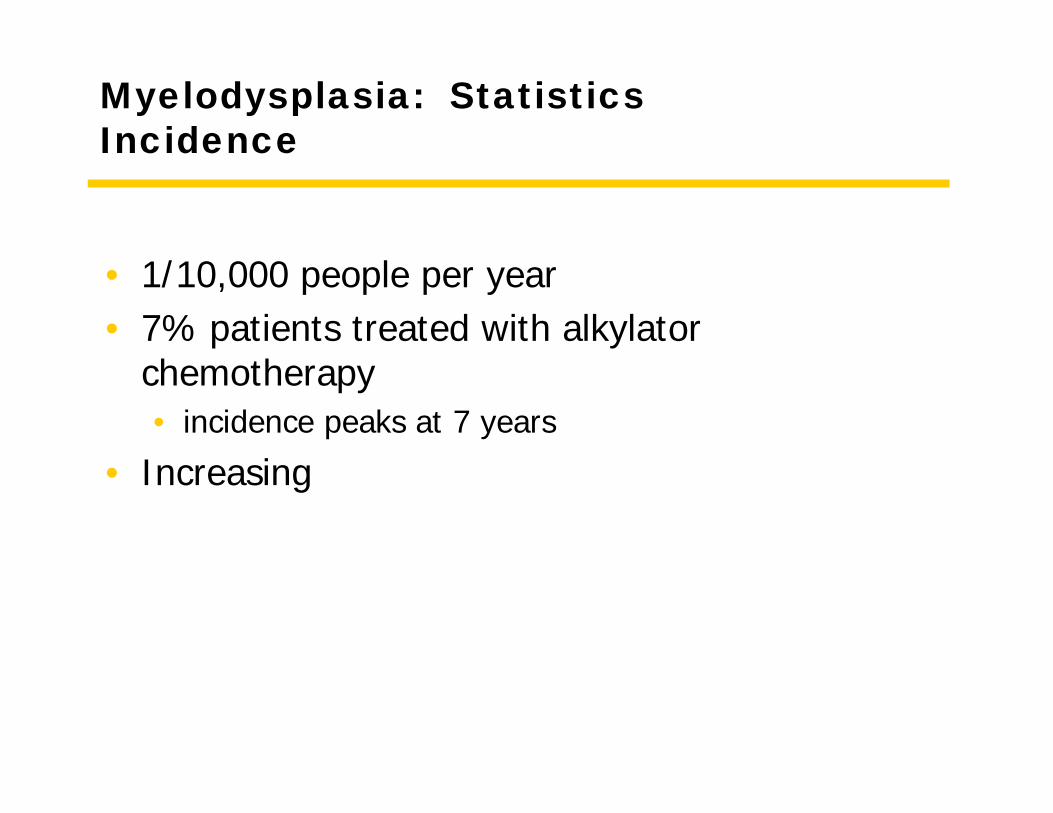
Myelodysplasia: StatisticsIncidence
• 1/10,000 people per year• 7% patients treated with alkylator
chemotherapy• incidence peaks at 7 years
• Increasing
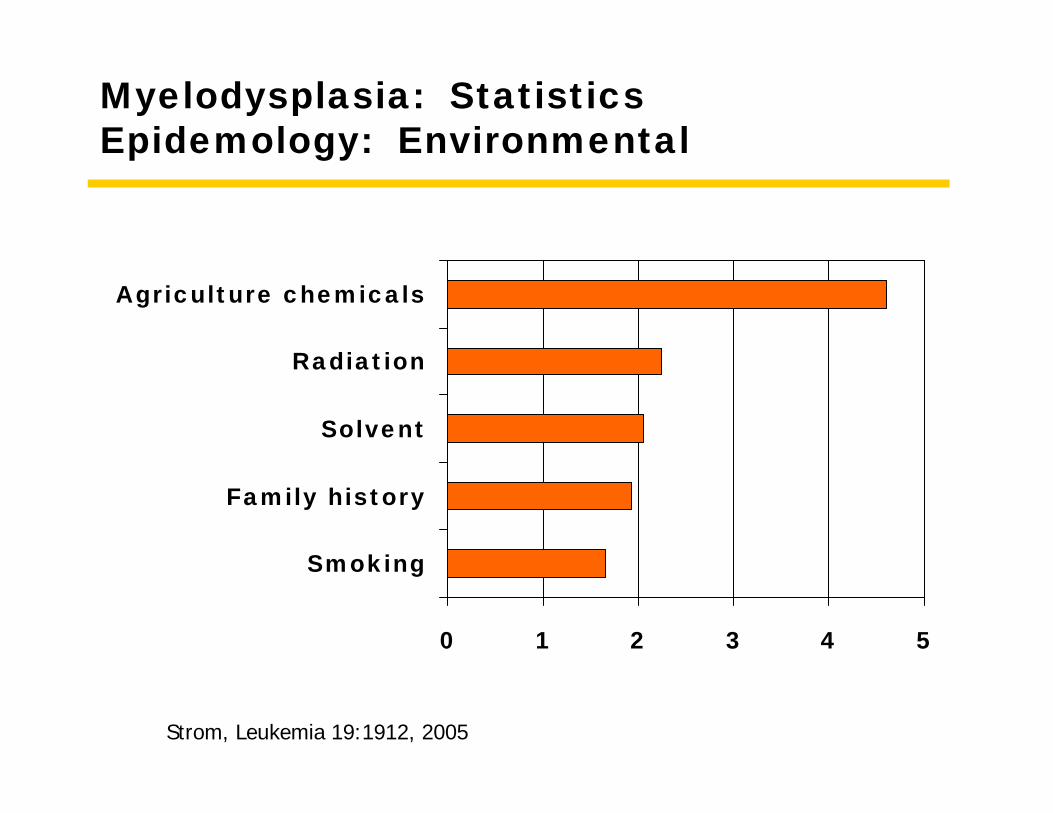
Myelodysplasia: Statistics Epidemology: Environmental
0 1 2 3 4 5
Smoking
Family history
Solvent
Radiation
Agriculture chemicals
Strom, Leukemia 19:1912, 2005
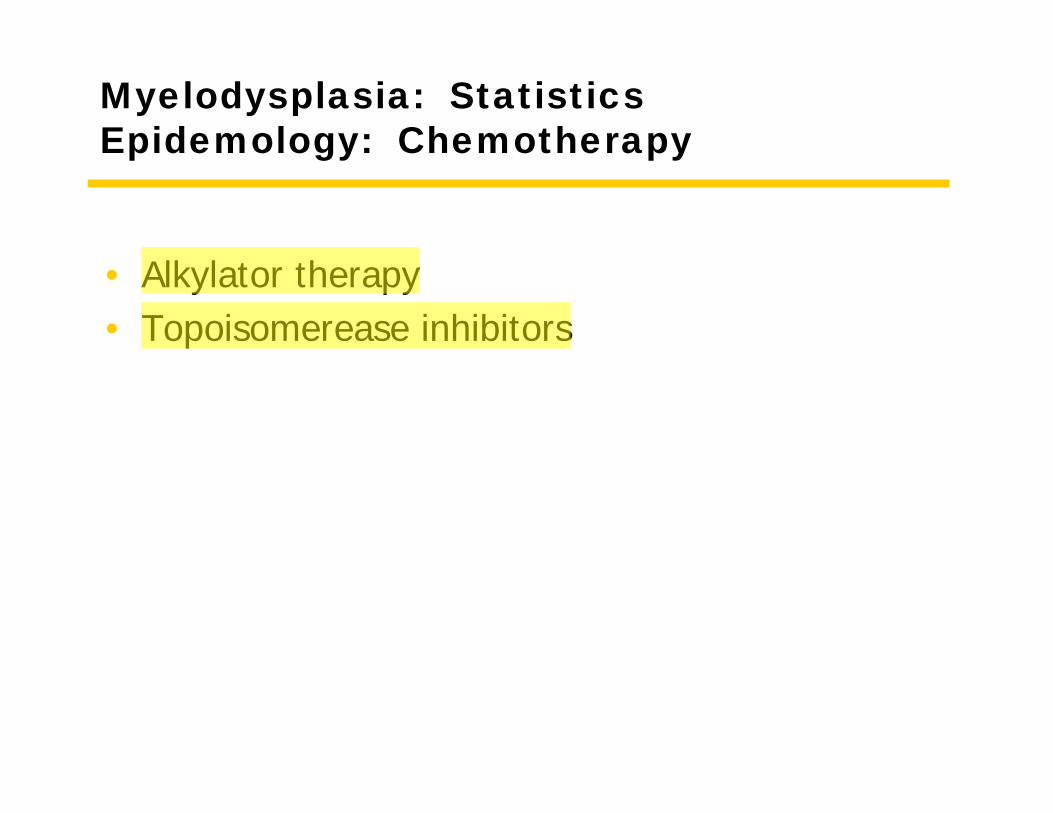
Myelodysplasia: Statistics Epidemology: Chemotherapy
• Alkylator therapy• Topoisomerease inhibitors
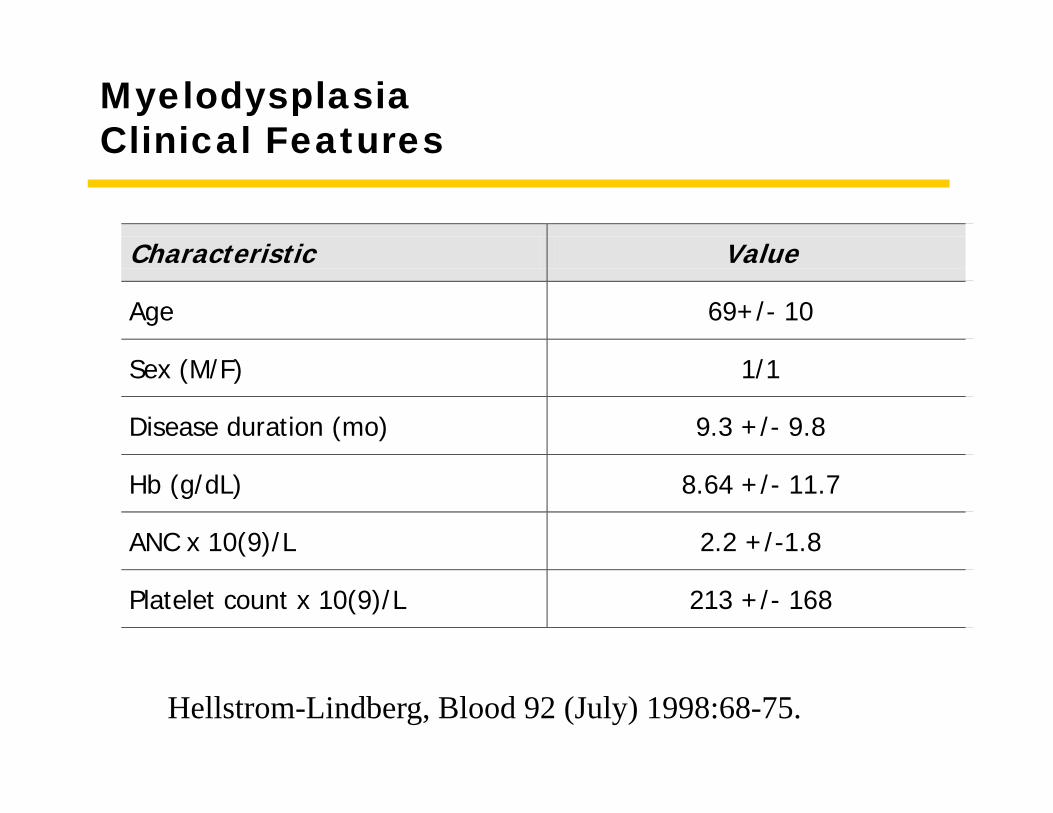
MyelodysplasiaClinical Features
Characteristic Value
Age 69+/- 10
Sex (M/F) 1/1
Disease duration (mo) 9.3 +/- 9.8
Hb (g/dL) 8.64 +/- 11.7
ANC x 10(9)/L 2.2 +/-1.8
Platelet count x 10(9)/L 213 +/- 168
Hellstrom-Lindberg, Blood 92 (July) 1998:68-75.
Myelodysplasia:Treatment
• Supportive care• Growth factors
• Transfusions• Red blood cells• platelets
• Infection treatment• Drug therapy
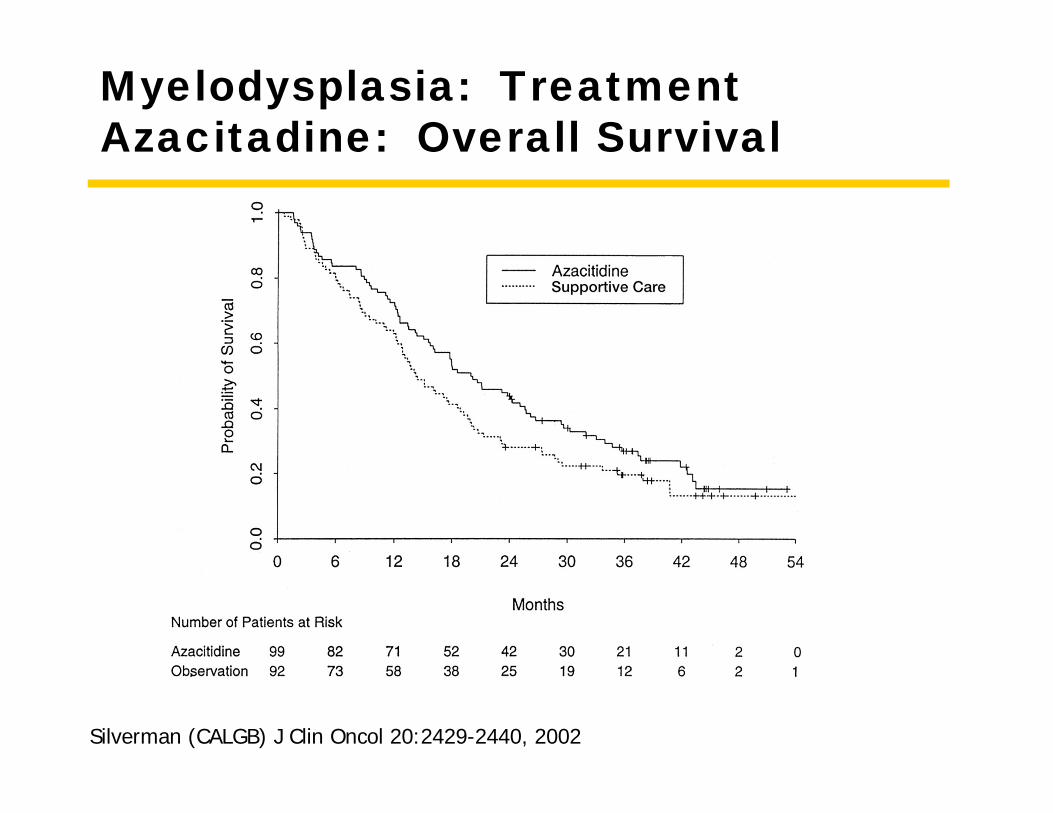
Myelodysplasia: TreatmentAzacitadine: Overall Survival
Silverman (CALGB) J Clin Oncol 20:2429-2440, 2002

Myelodysplasia: TreatmentAzacitadine: Overall Survival
Silverman (CALGB) J Clin Oncol 20:2429-2440, 2002
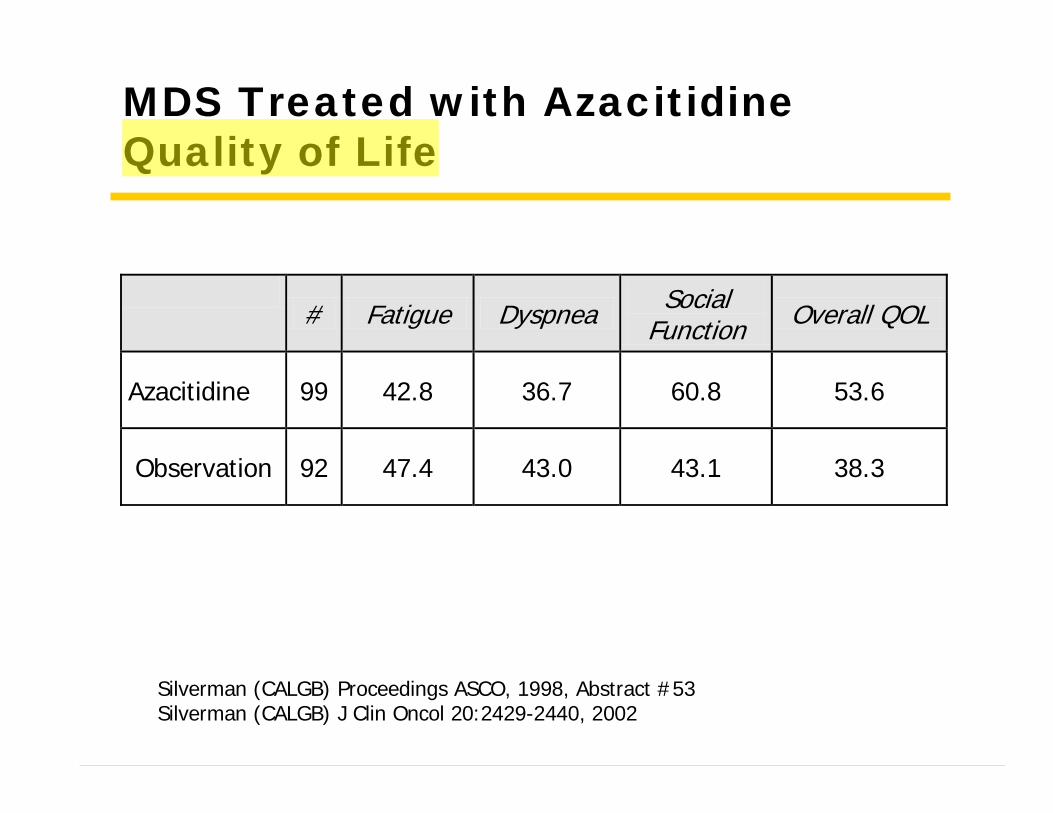
MDS Treated with AzacitidineQuality of Life
# Fatigue Dyspnea Social
Function Overall QOL
Azacitidine 99 42.8 36.7 60.8 53.6
Observation 92 47.4 43.0 43.1 38.3
Silverman (CALGB) Proceedings ASCO, 1998, Abstract #53Silverman (CALGB) J Clin Oncol 20:2429-2440, 2002
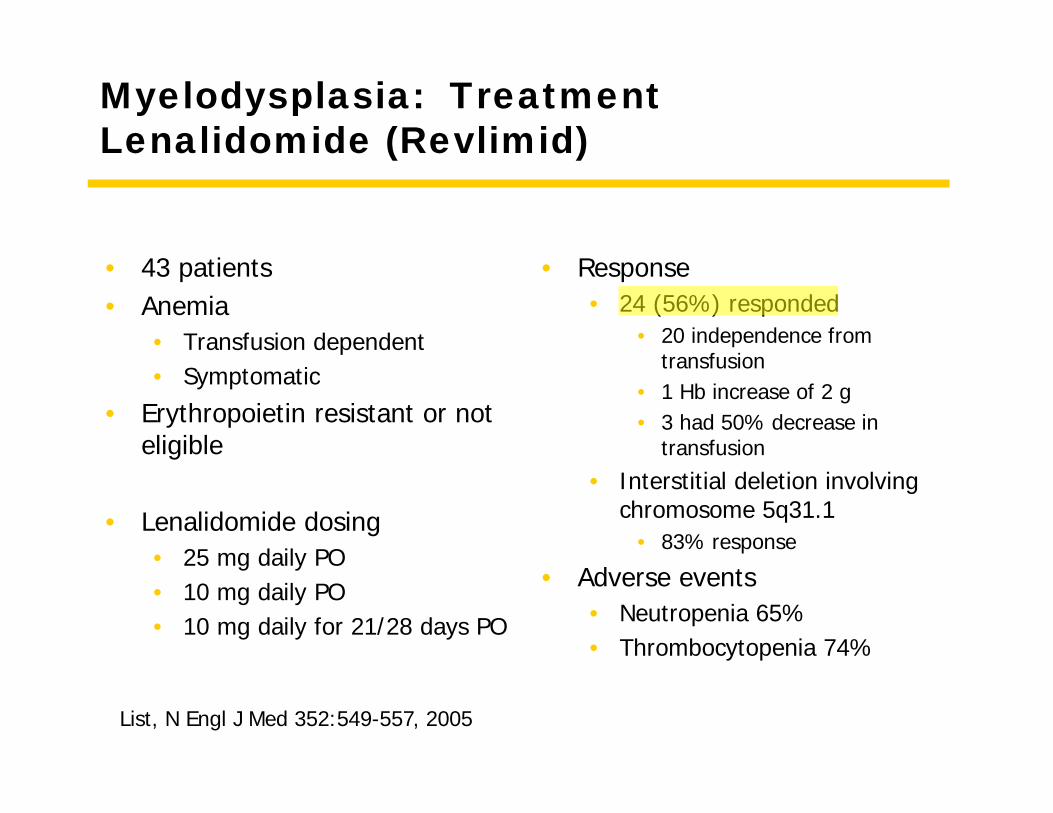
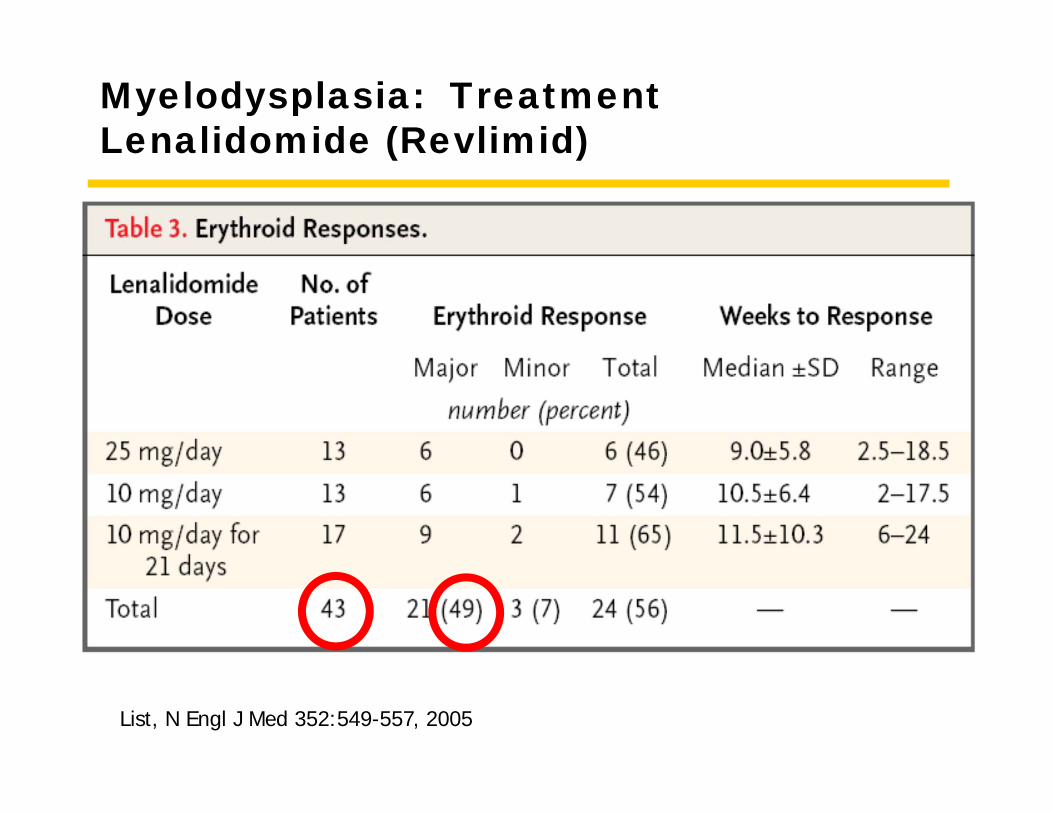
Myelodysplasia: TreatmentLenalidomide (Revlimid)
• 43 patients• Anemia
• Transfusion dependent• Symptomatic
• Erythropoietin resistant or not eligible
• Lenalidomide dosing• 25 mg daily PO• 10 mg daily PO• 10 mg daily for 21/28 days PO
• Response• 24 (56%) responded
• 20 independence from transfusion
• 1 Hb increase of 2 g• 3 had 50% decrease in
transfusion
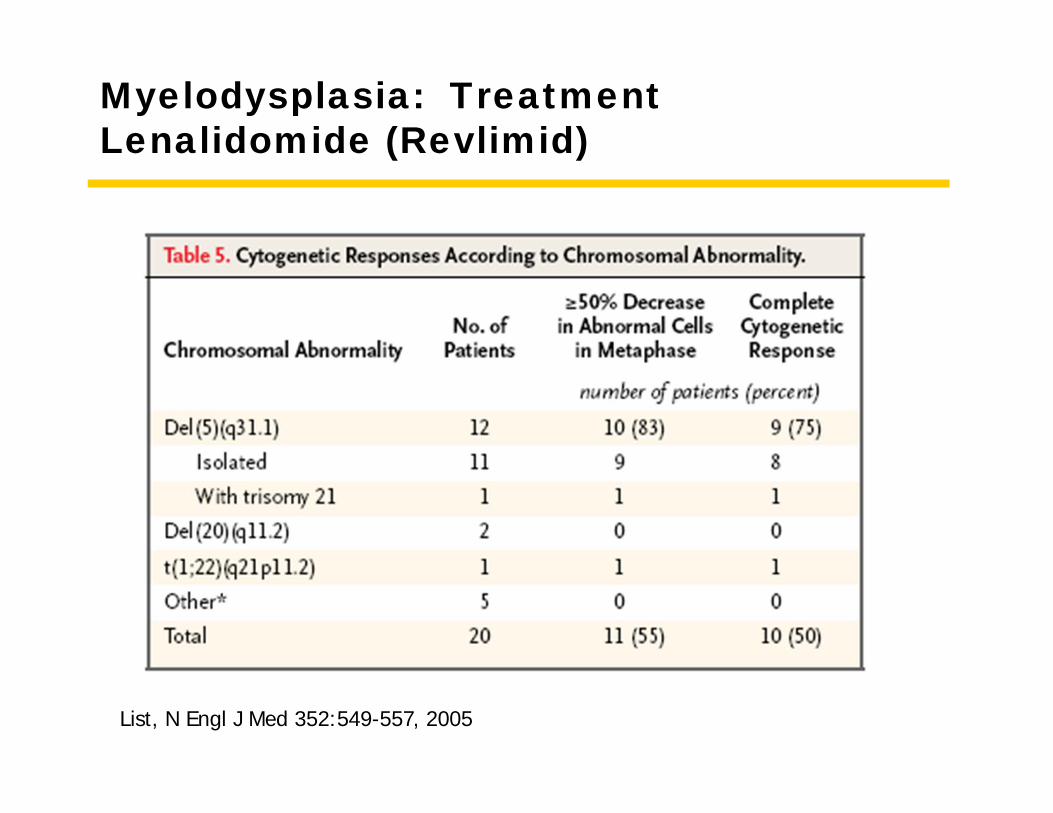
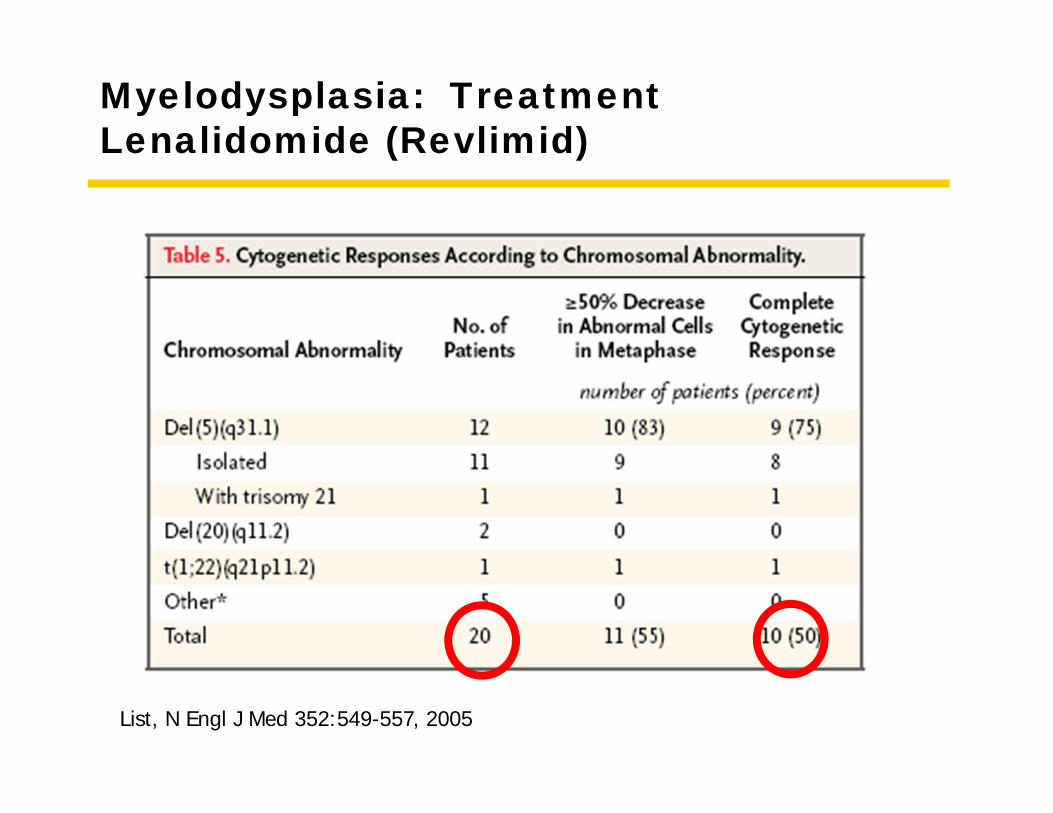
• Interstitial deletion involving chromosome 5q31.1
• 83% response
• Adverse events• Neutropenia 65%• Thrombocytopenia 74%
List, N Engl J Med 352:549-557, 2005
Myelodysplasia: TreatmentLenalidomide (Revlimid)
List, N Engl J Med 352:549-557, 2005
Myelodysplasia: TreatmentLenalidomide (Revlimid)
List, N Engl J Med 352:549-557, 2005
Myelodysplasia: Treatment Lenalidomide (Revlimid)
List, N Engl J Med 352:549-557, 2005
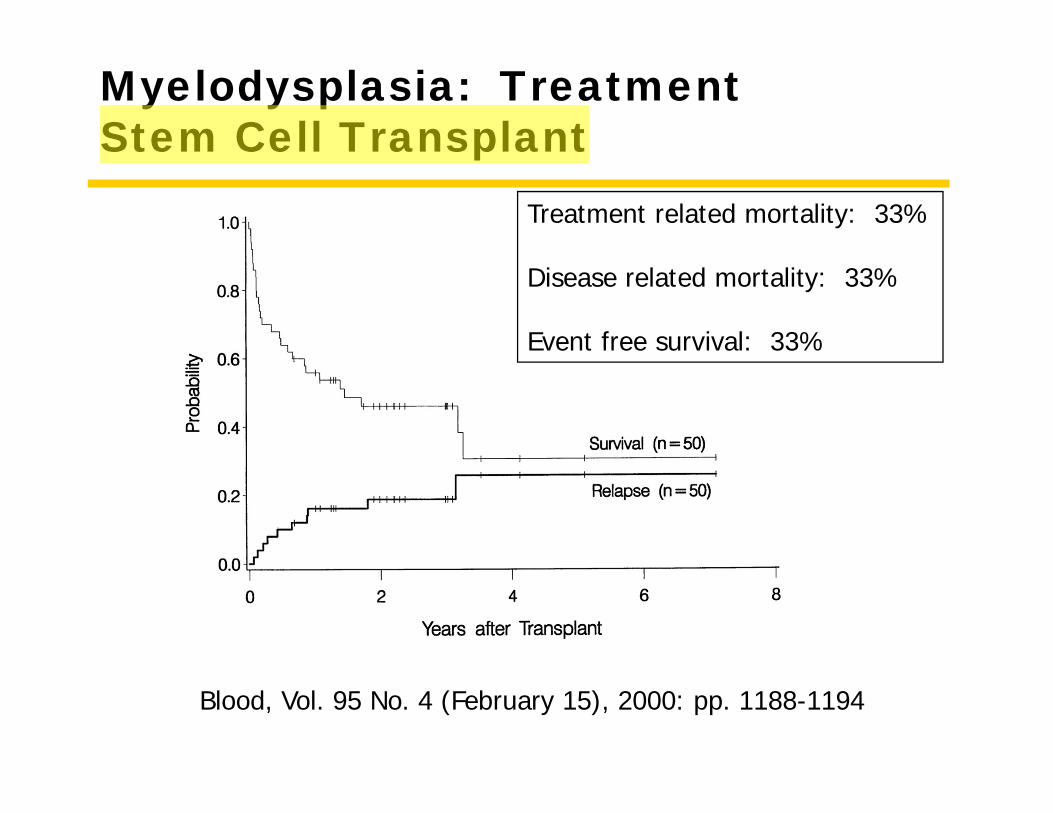
Myelodysplasia: Treatment Stem Cell Transplant
Blood, Vol. 95 No. 4 (February 15), 2000: pp. 1188-1194
Treatment related mortality: 33%
Disease related mortality: 33%
Event free survival: 33%
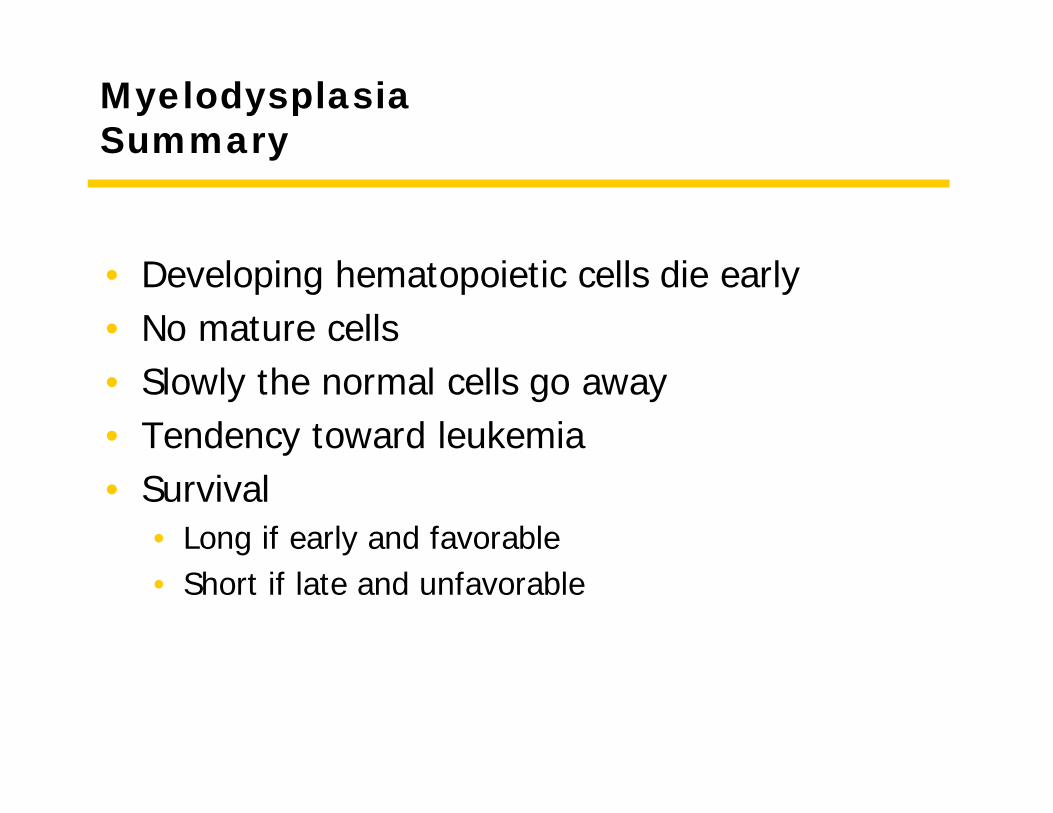
MyelodysplasiaSummary
• Developing hematopoietic cells die early• No mature cells• Slowly the normal cells go away• Tendency toward leukemia• Survival
• Long if early and favorable• Short if late and unfavorable
Disease 2
Acute Myeloid Leukemia
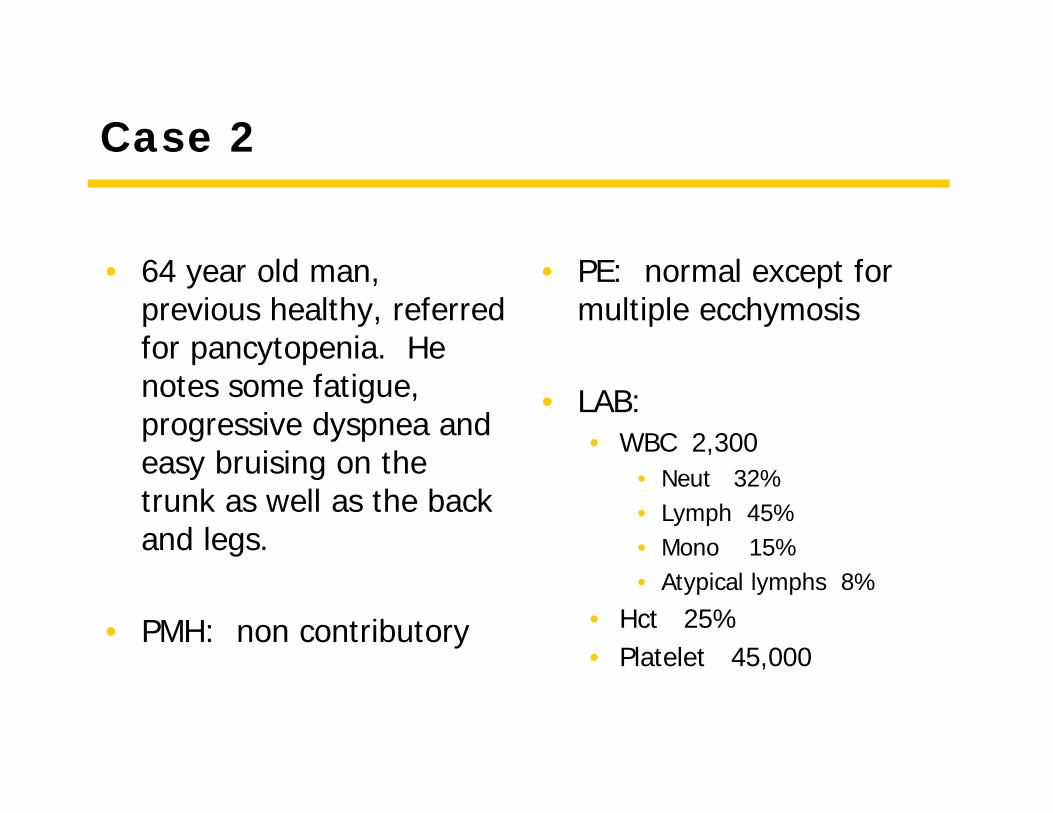
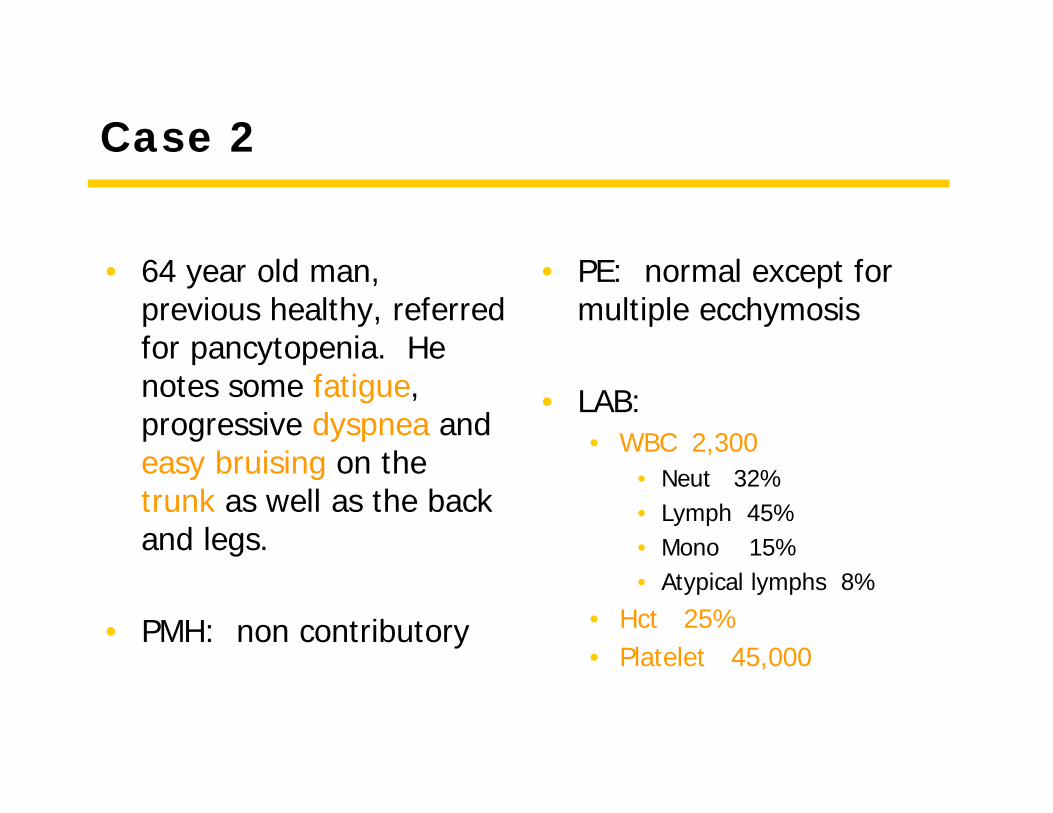
Case 2
• 64 year old man, previous healthy, referred for pancytopenia. He notes some fatigue, progressive dyspnea and easy bruising on the trunk as well as the back and legs.
• PMH: non contributory
• PE: normal except for multiple ecchymosis
• LAB:• WBC 2,300
• Neut 32%• Lymph 45%• Mono 15%• Atypical lymphs 8%
• Hct 25%• Platelet 45,000
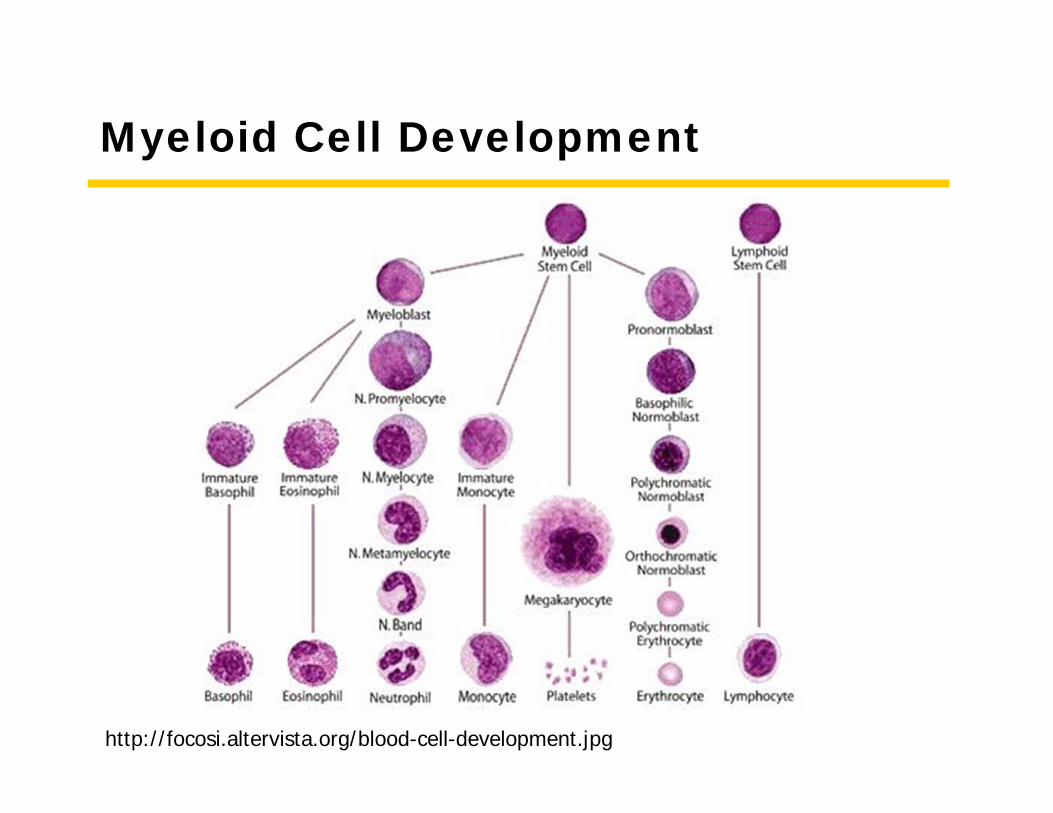
Myeloid Cell Development
http://focosi.altervista.org/blood-cell-development.jpg
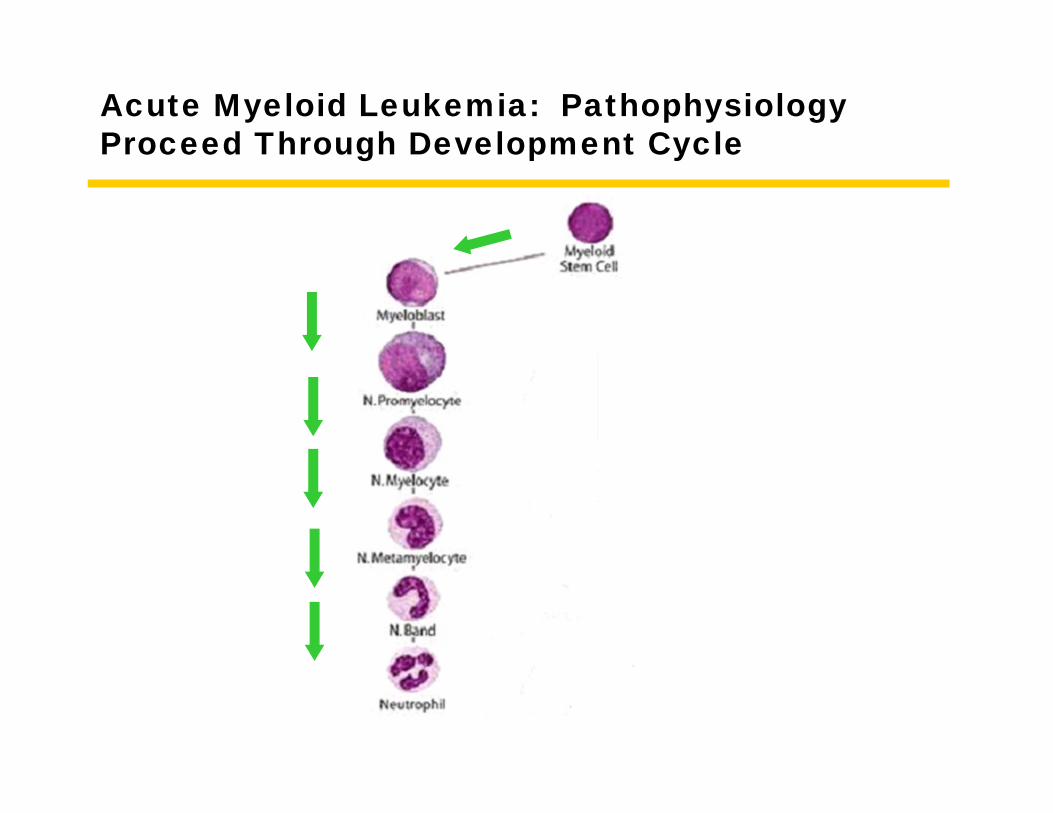
Acute Myeloid Leukemia: PathophysiologyProceed Through Development Cycle
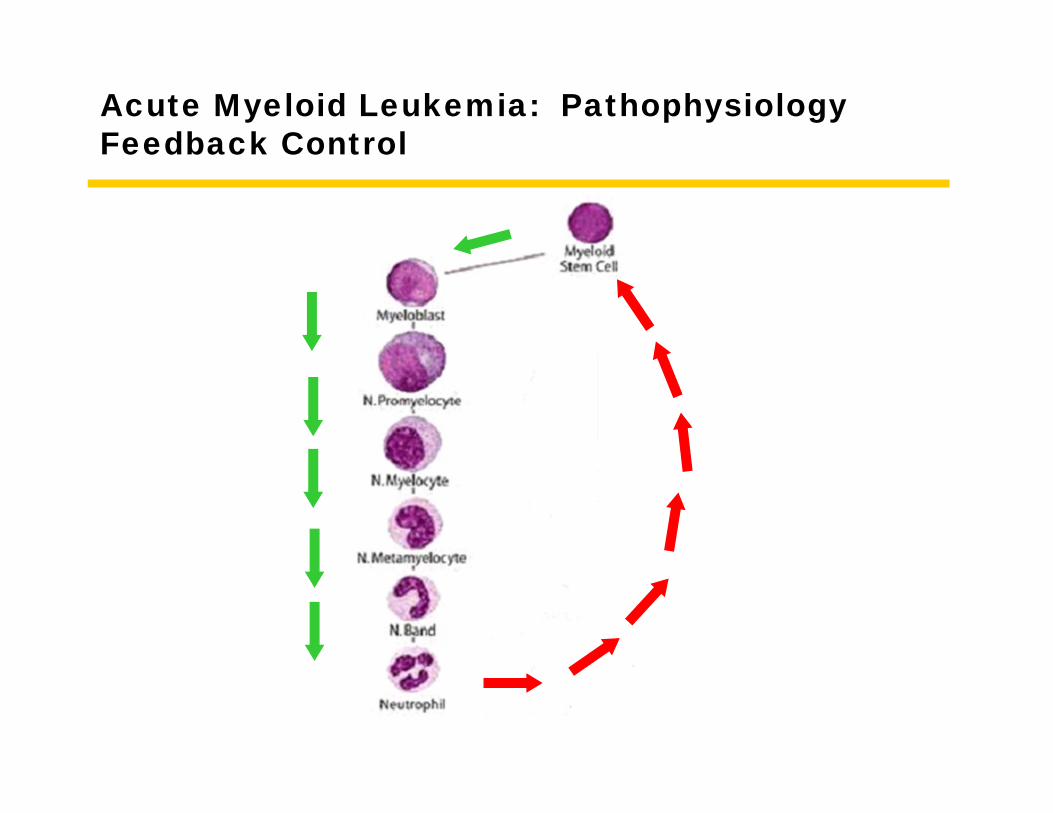
Acute Myeloid Leukemia: PathophysiologyFeedback Control
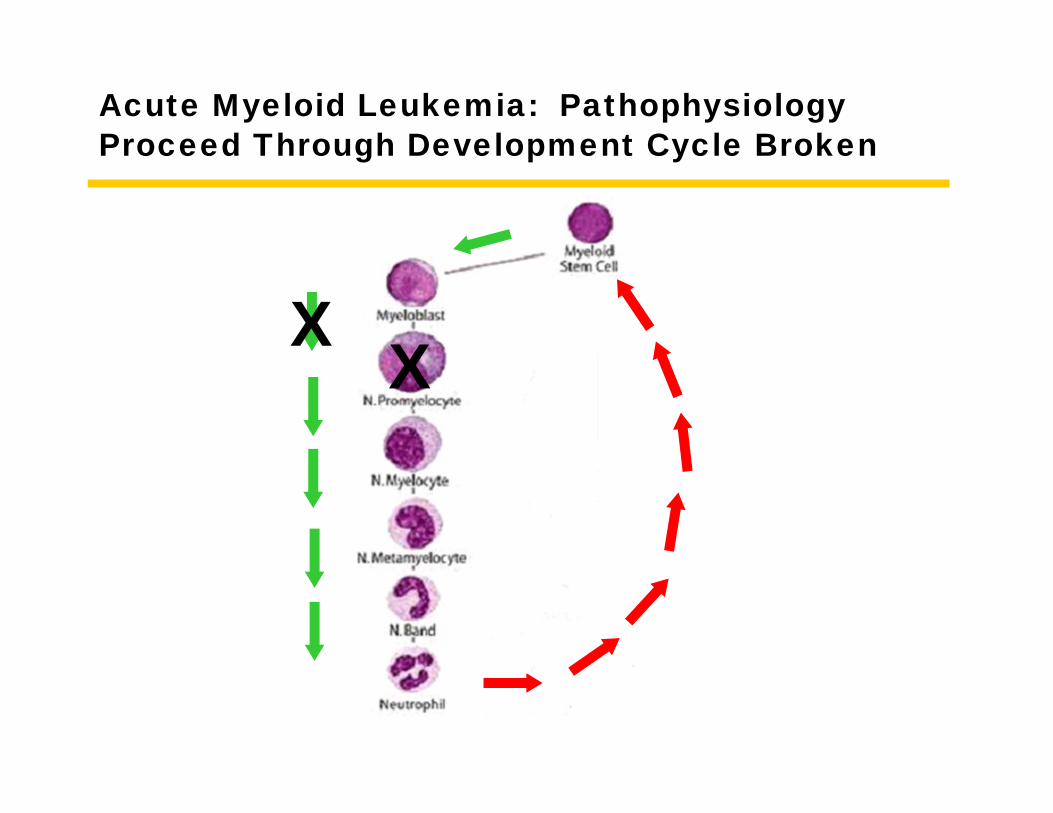
Acute Myeloid Leukemia: PathophysiologyProceed Through Development Cycle Broken
XX
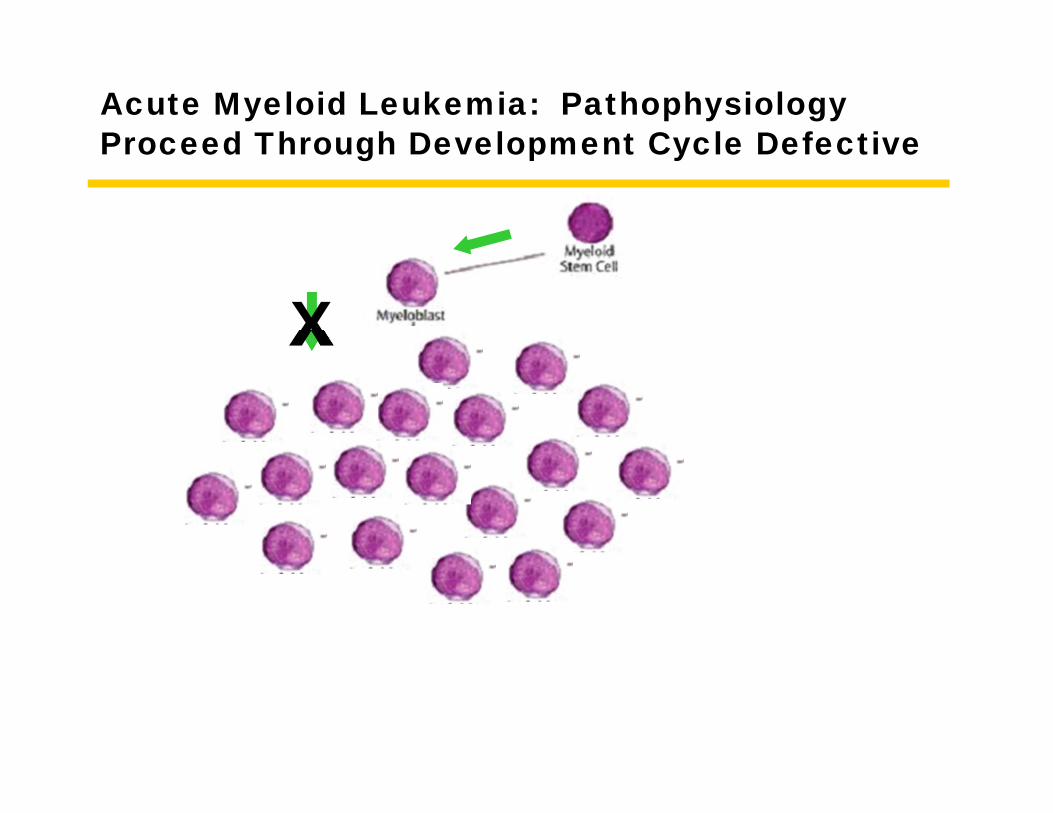
Acute Myeloid Leukemia: PathophysiologyProceed Through Development Cycle Defective
X
Definition - Explanatory
• Overproduction of an immature cell that does not develop into a normal mature cell
Acute Myelogenous Leukemia: DiagnosisDiagnosis
• Morphology• Immunophenotype• Cytogenetics
Acute Myelogenous Leukemia
Pathology
Acute Myeloid Leukemia (AML)
Classification and Morphology
AML
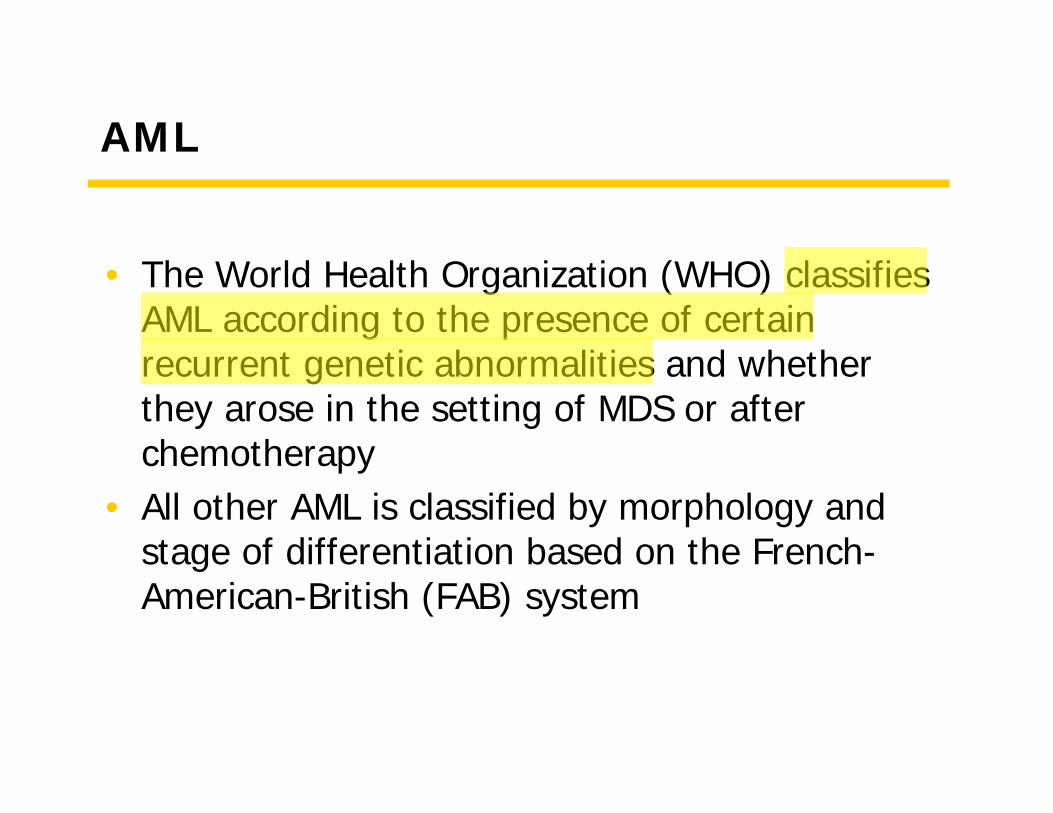
• The World Health Organization (WHO) classifies AML according to the presence of certain recurrent genetic abnormalities and whether they arose in the setting of MDS or after chemotherapy
• All other AML is classified by morphology and stage of differentiation based on the French-American-British (FAB) system
AML Without Maturation(for comparison with other subtypes)
(FAB AML M1)
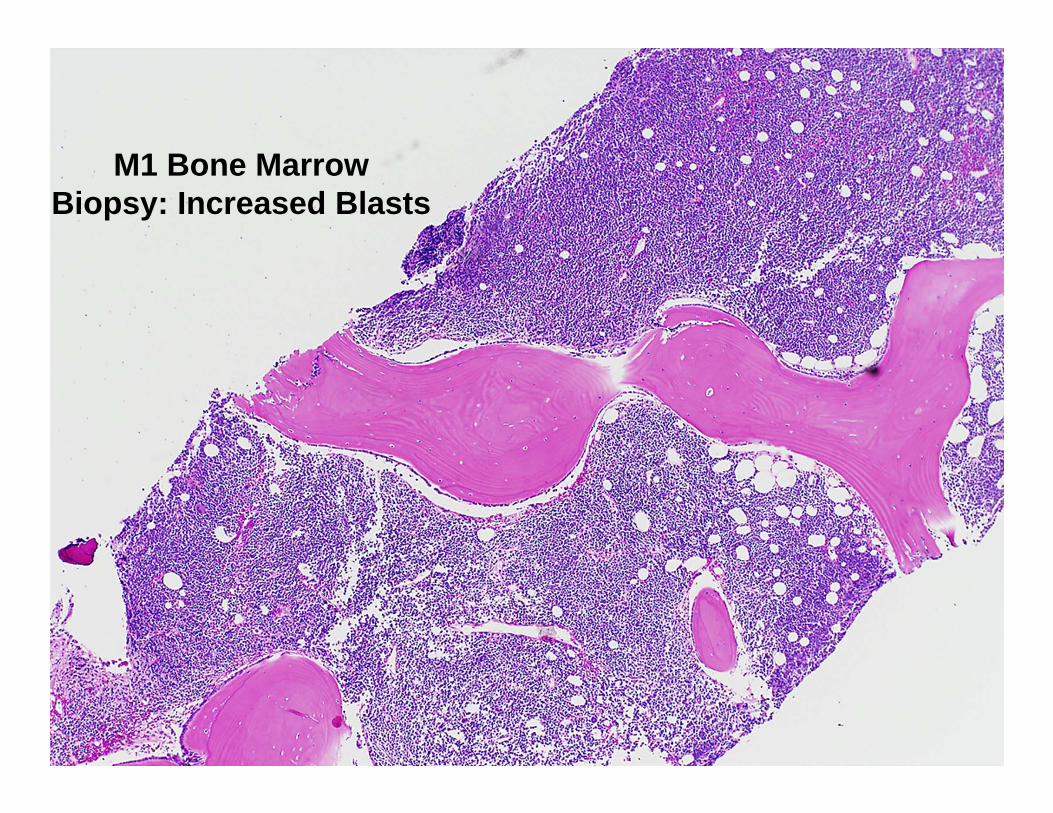
M1 Bone MarrowBiopsy: Increased Blasts
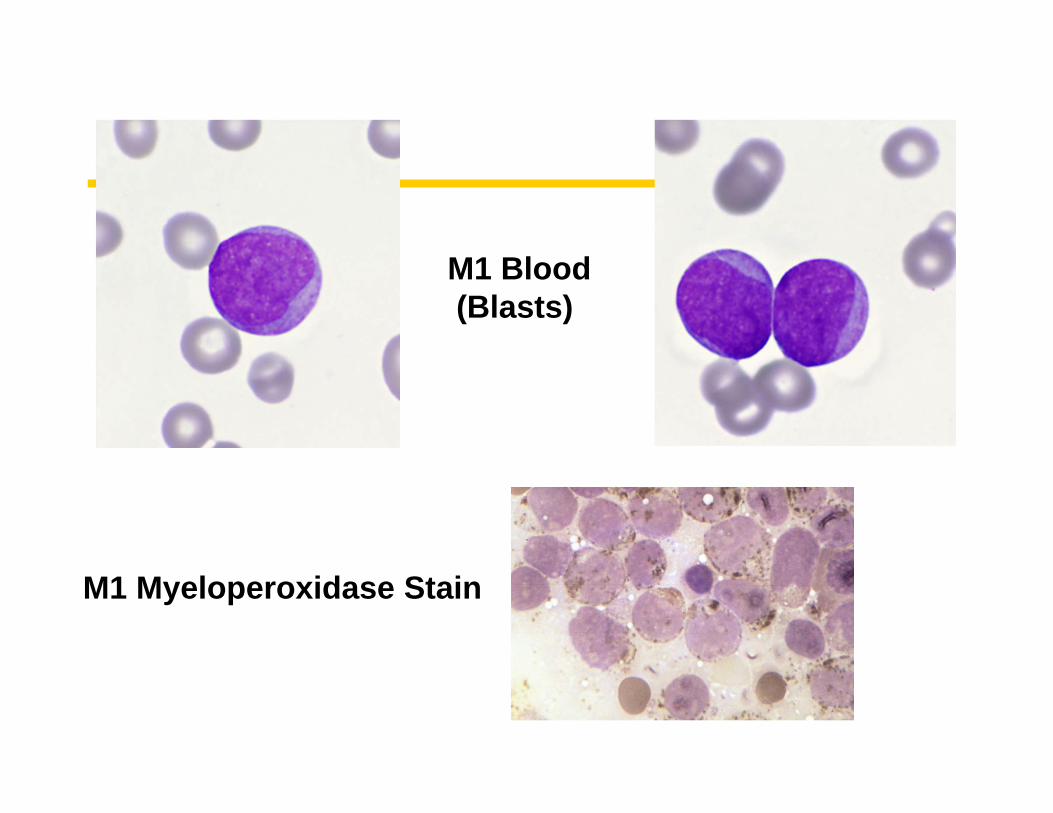
M1 Blood(Blasts)
M1 Myeloperoxidase Stain
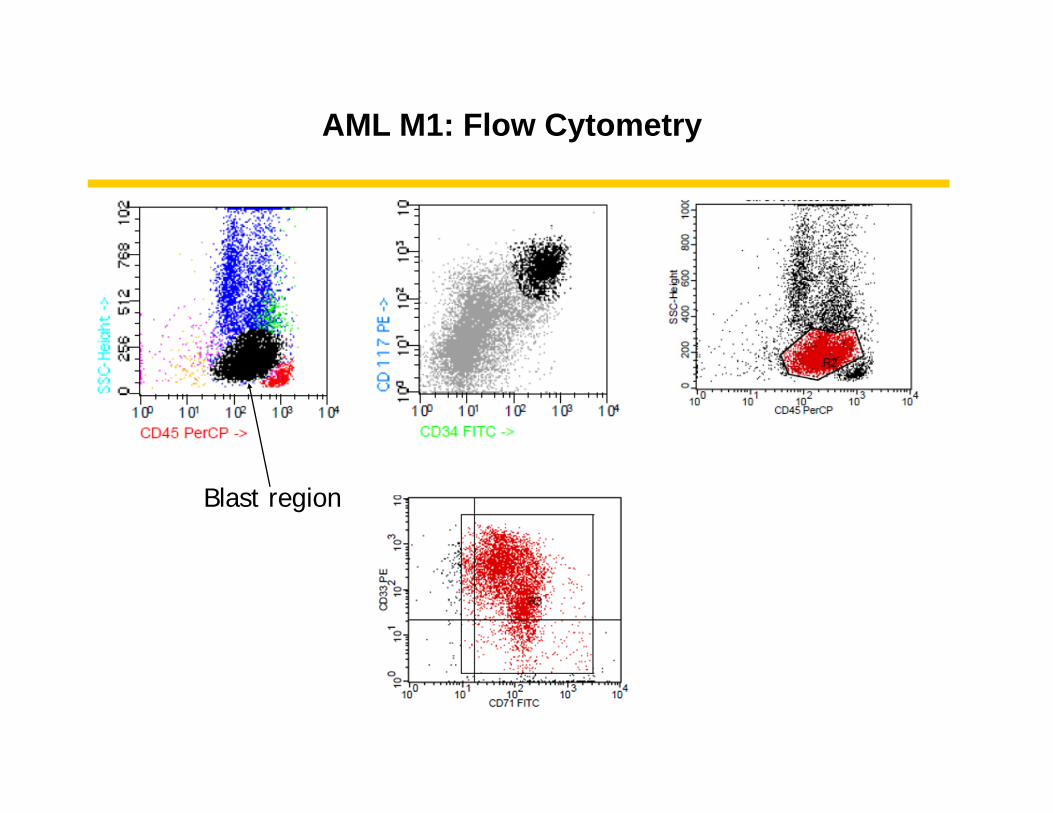
AML M1: Flow Cytometry
Blast region
AML with Recurrent Genetic Abnormalities
AML with t(8;21)(q22;q22)(Core binding factor alpha/ETO)
10% of “AML with Maturation”(FAB AML M2)
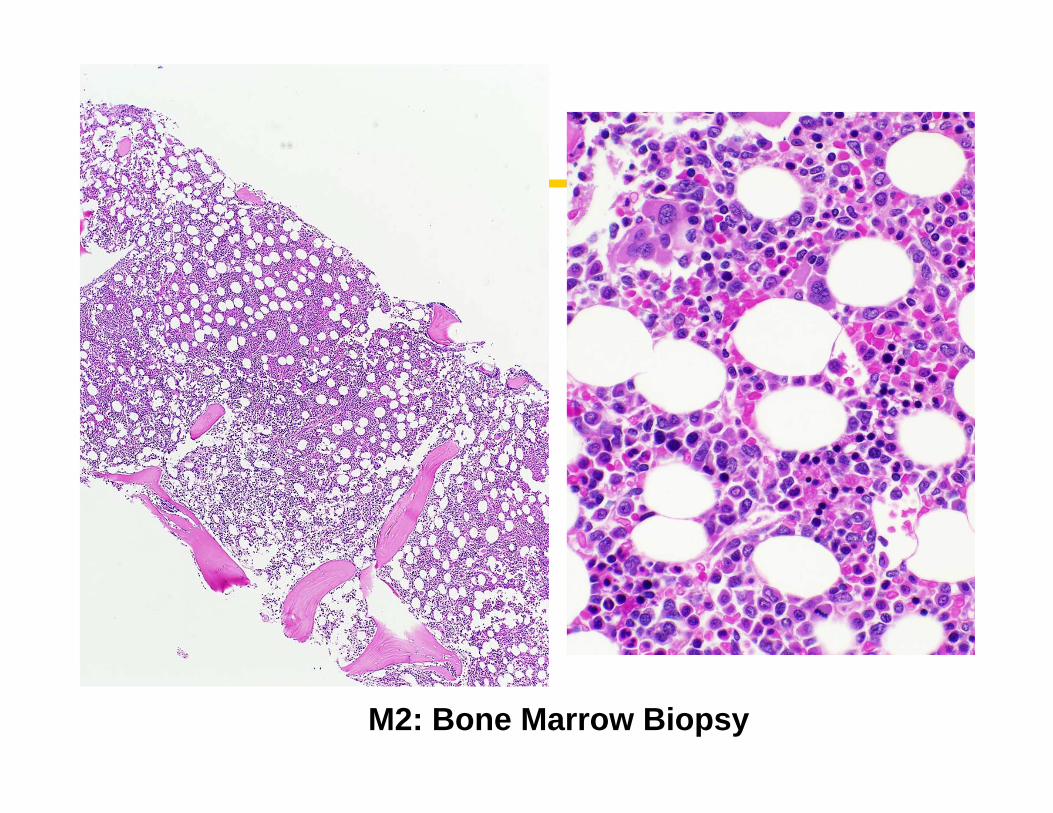
M2: Bone Marrow Biopsy
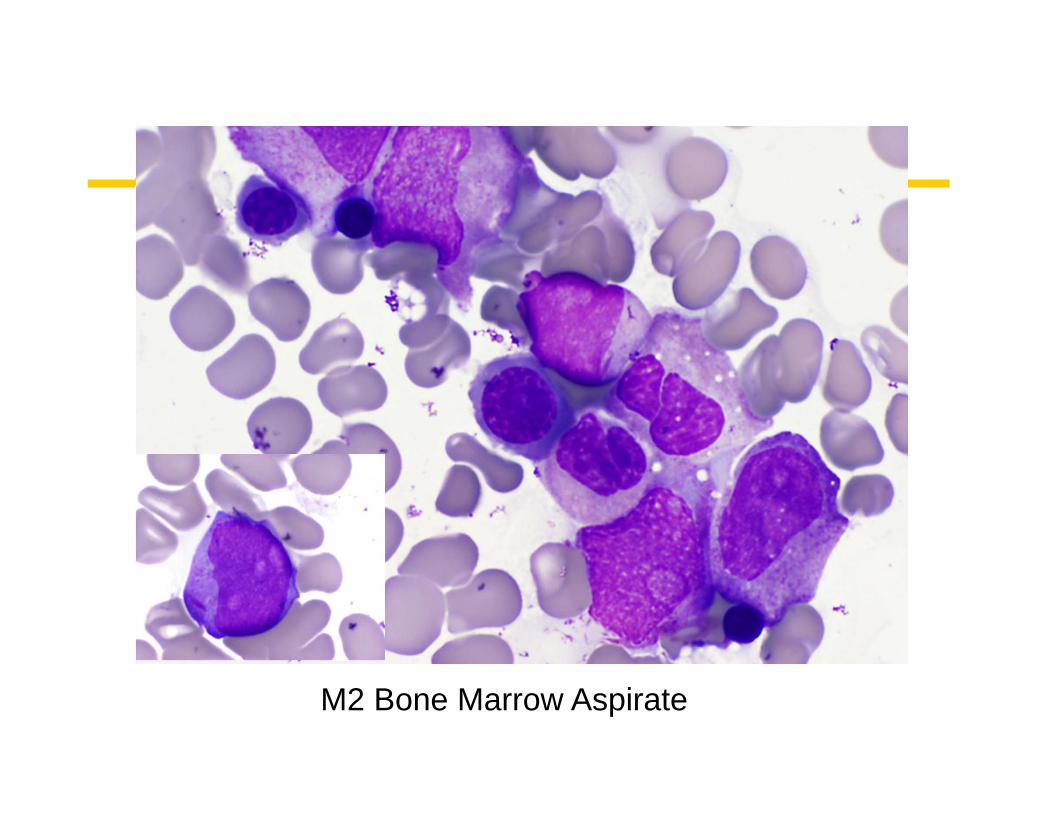
M2 Bone Marrow Aspirate
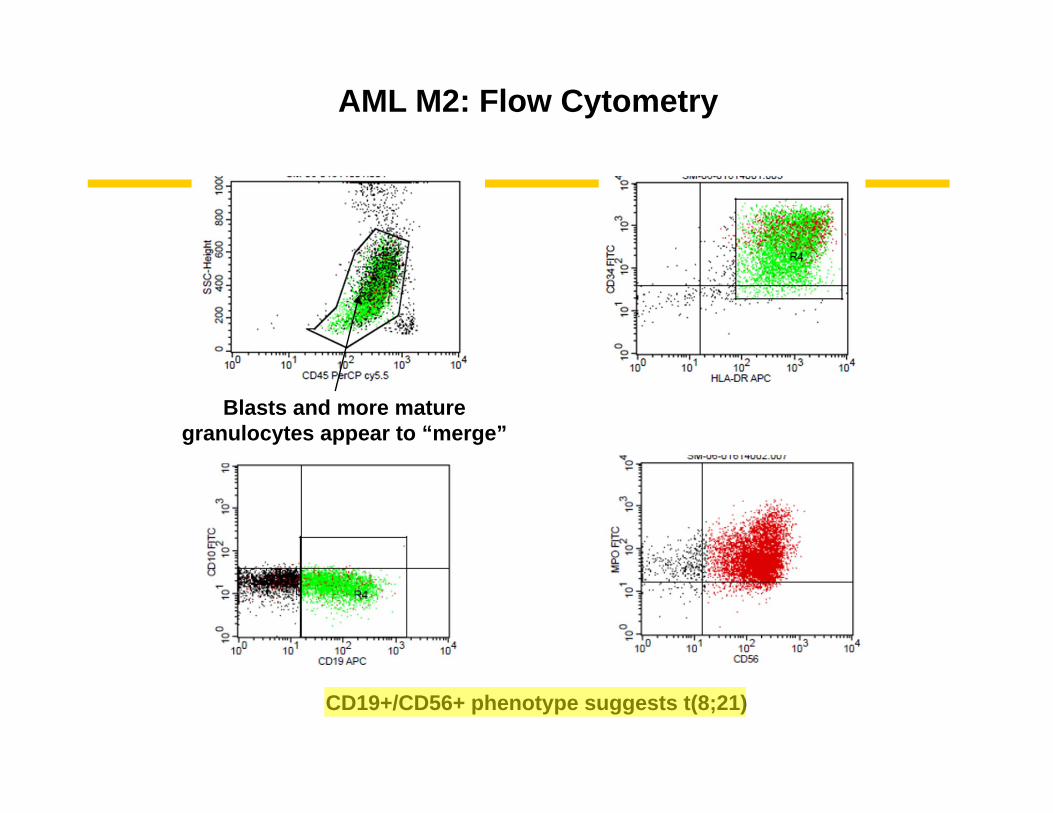
AML M2: Flow Cytometry
Blasts and more maturegranulocytes appear to “merge”
CD19+/CD56+ phenotype suggests t(8;21)
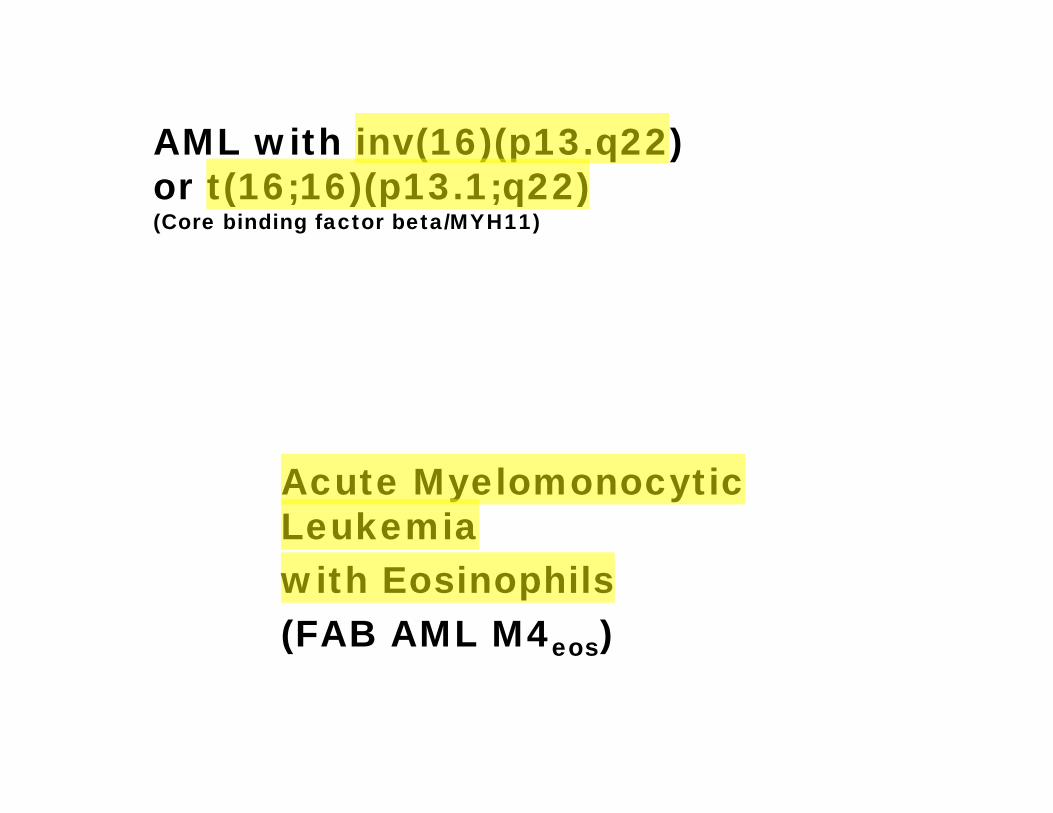
AML with inv(16)(p13.q22)or t(16;16)(p13.1;q22)(Core binding factor beta/MYH11)
Acute Myelomonocytic Leukemiawith Eosinophils(FAB AML M4eos)
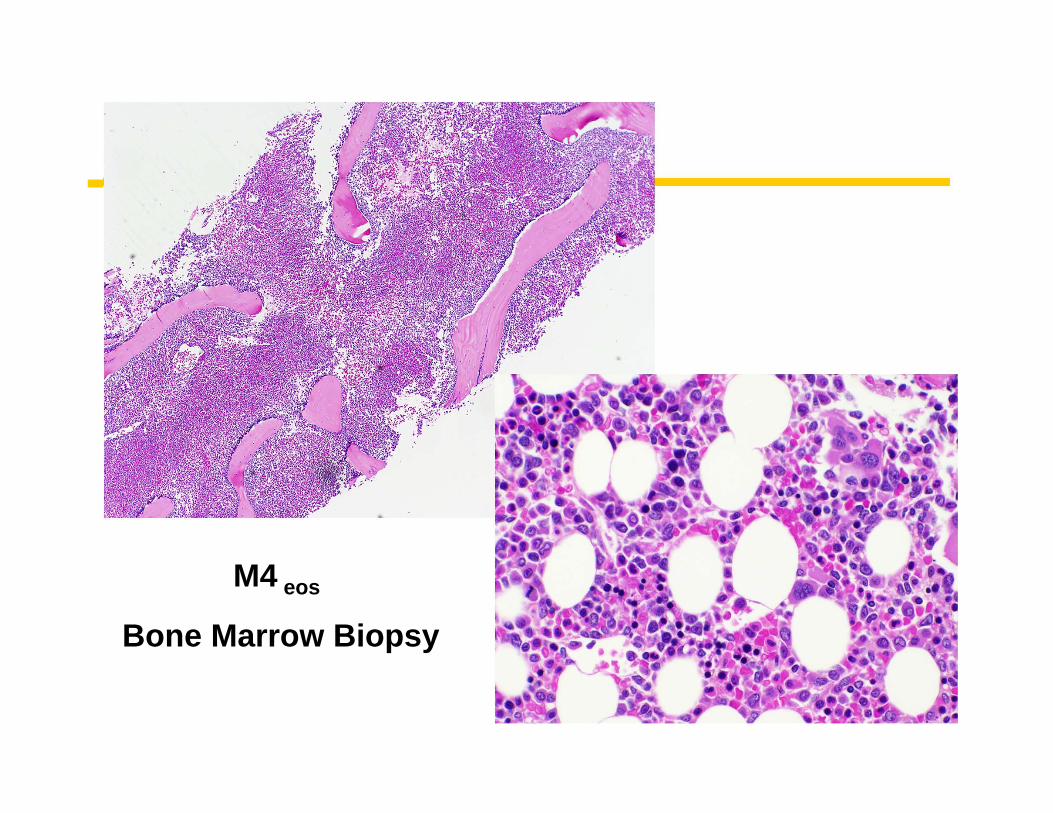
M4 eos
Bone Marrow Biopsy
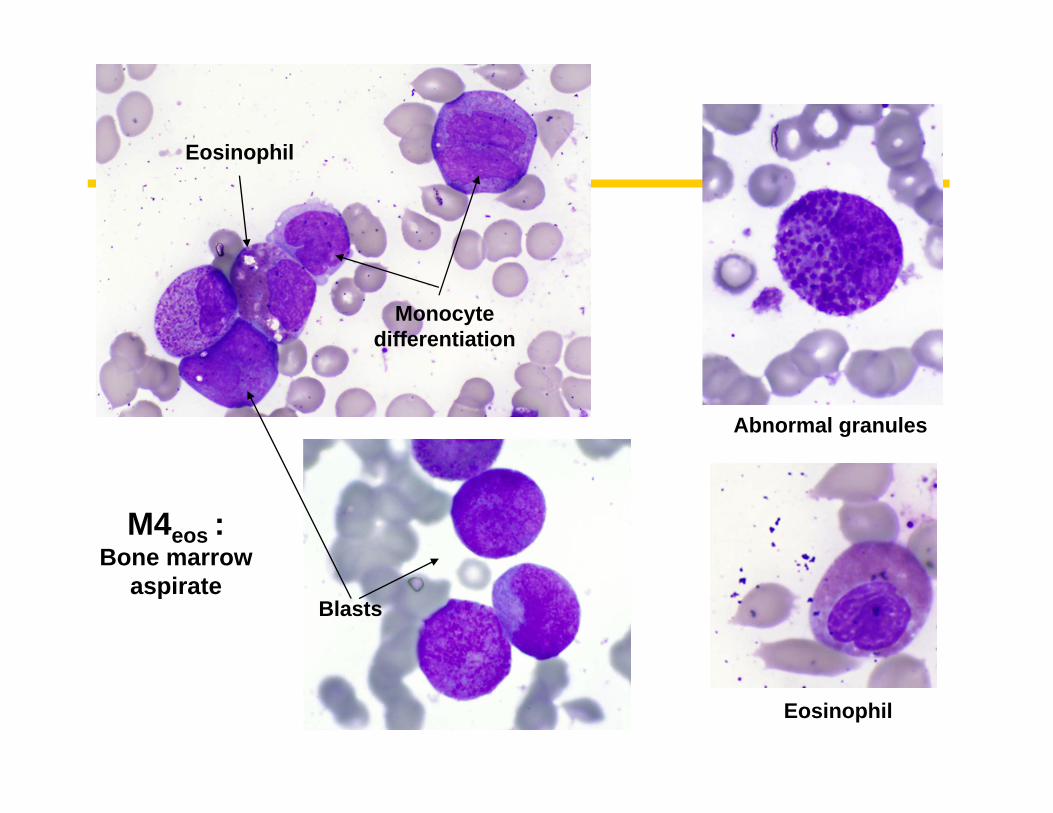
Monocyte differentiation
Eosinophil
Eosinophil
Abnormal granules
M4eos :Bone marrow
aspirateBlasts
AML with t(15;17)(q22;q12)(PML/RARA)
Acute Promyelocytic Leukemia (FAB AML M3)
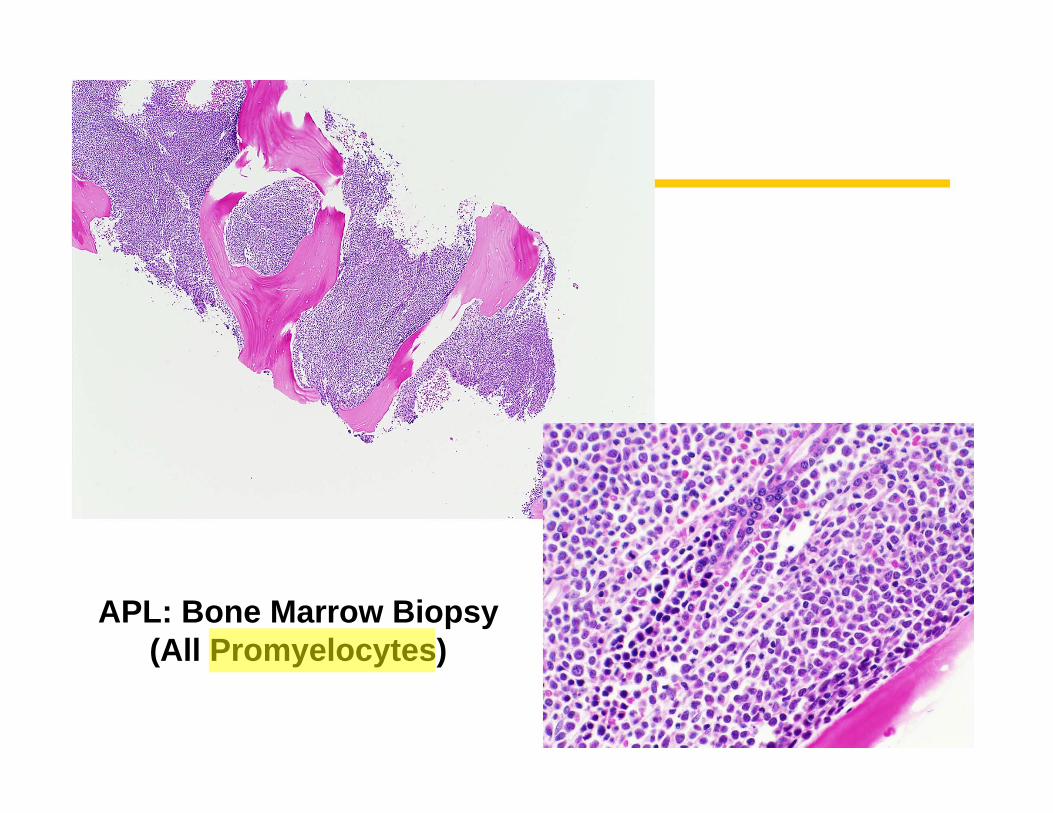
APL: Bone Marrow Biopsy(All Promyelocytes)
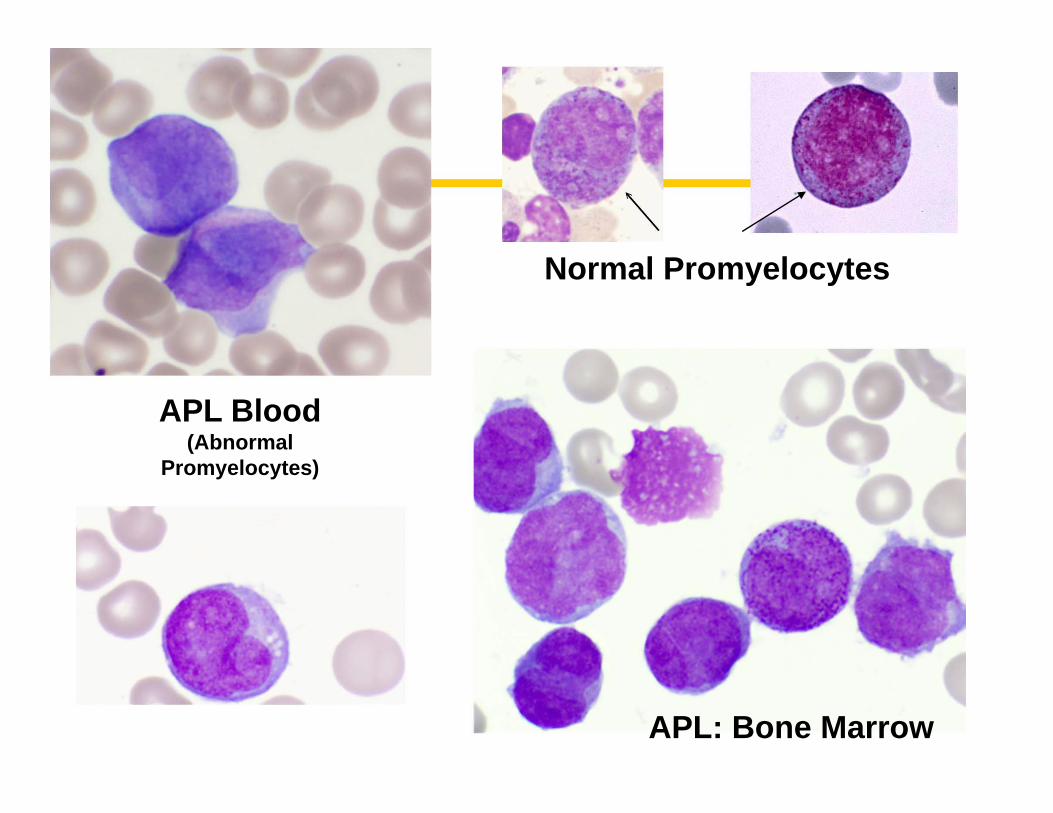
APL Blood (Abnormal
Promyelocytes)
APL: Bone Marrow
Normal Promyelocytes
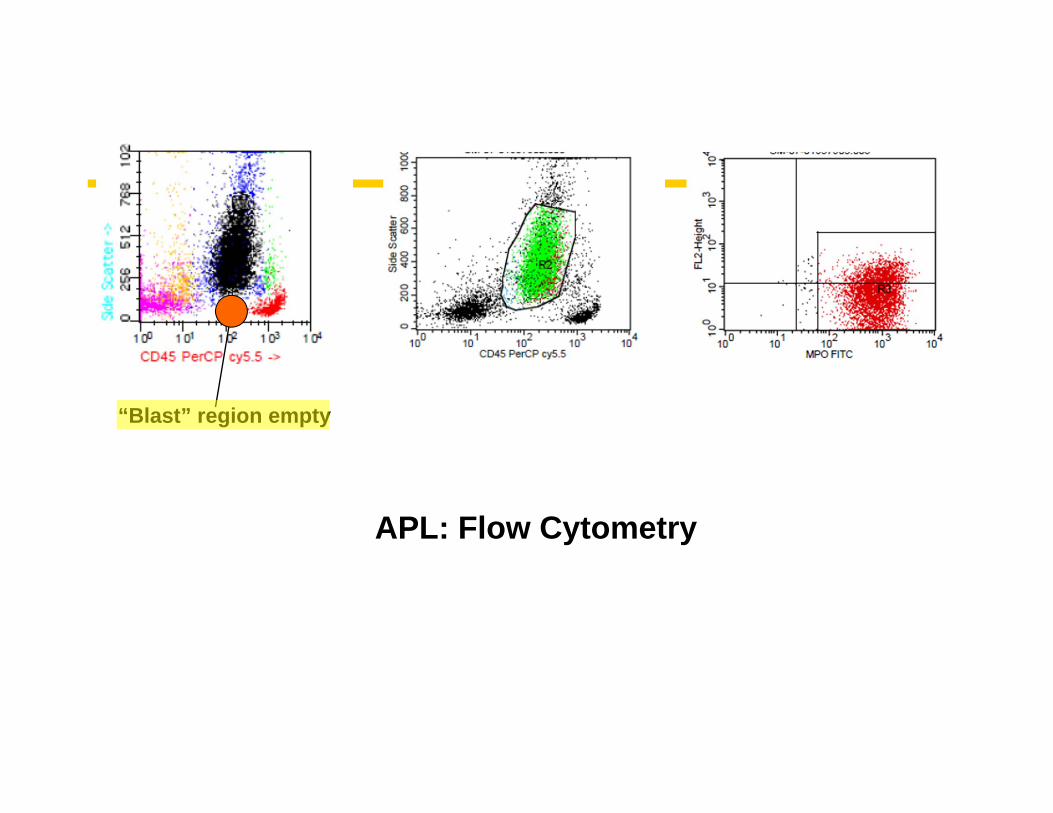
APL: Flow Cytometry
“Blast” region empty
Acute Monocytic Leukemia(associated with translocations of 11q23 in some cases, especially children)
(FAB AML M5)
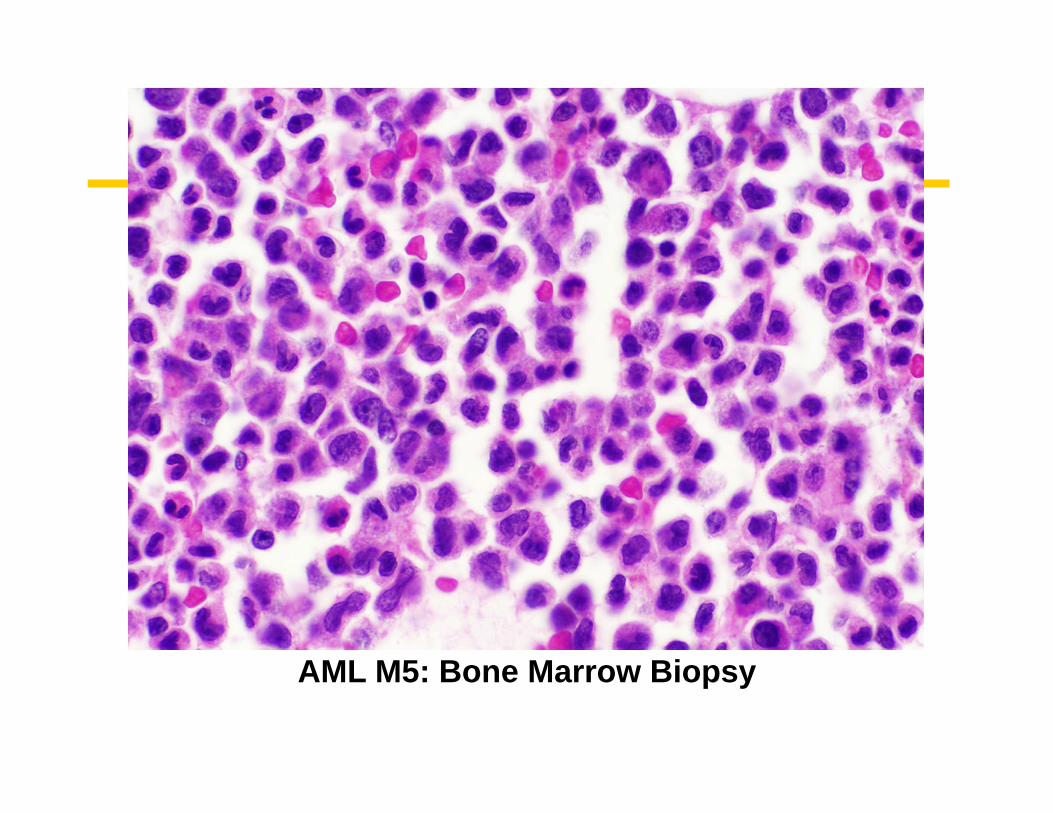
AML M5: Bone Marrow Biopsy
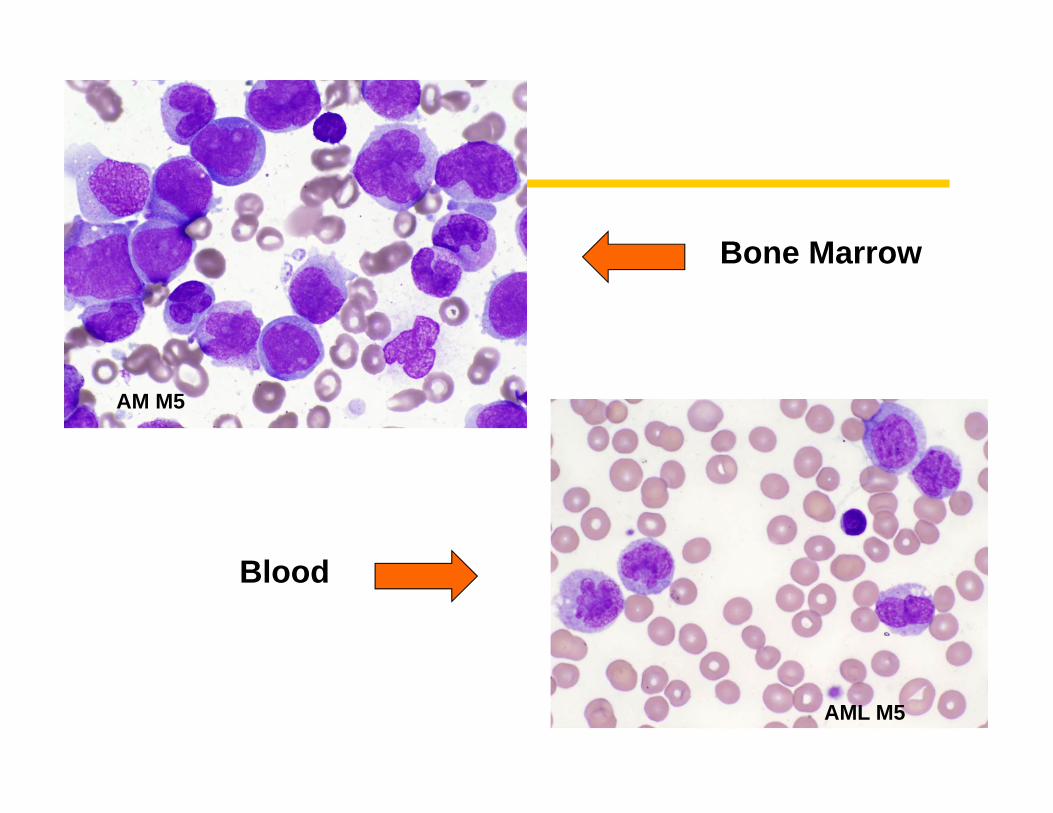
Bone Marrow
Blood
AM M5
AML M5
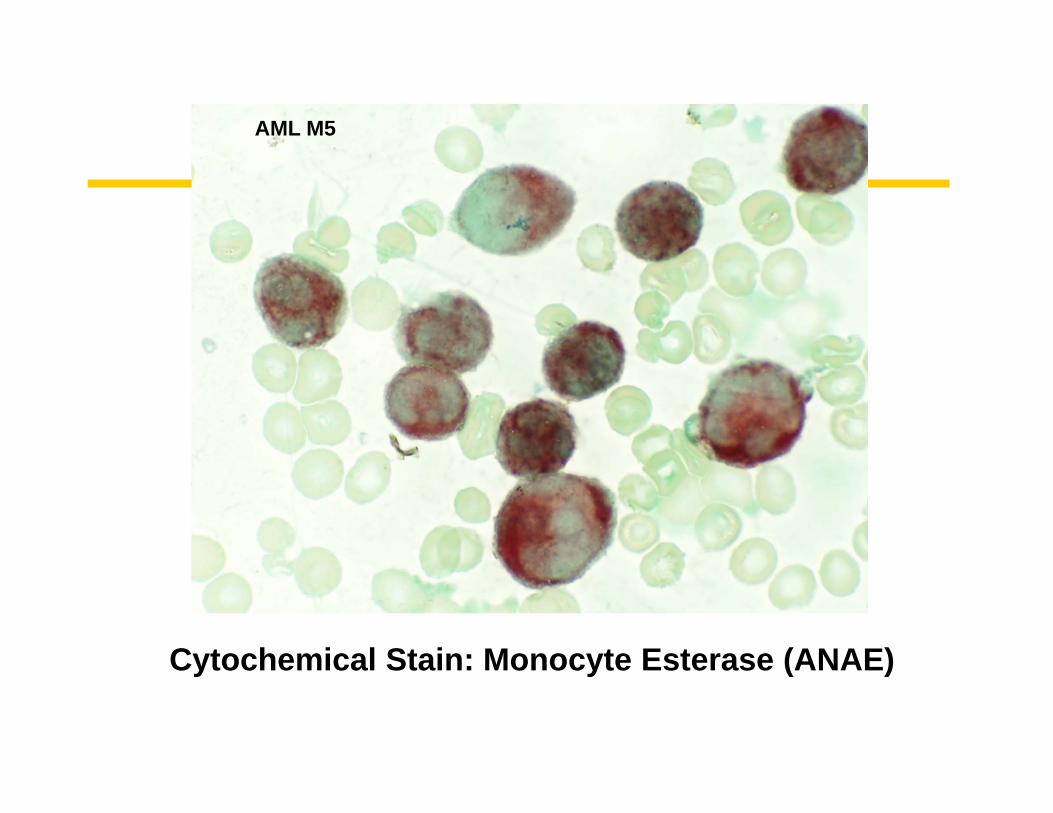
Cytochemical Stain: Monocyte Esterase (ANAE)
AML M5
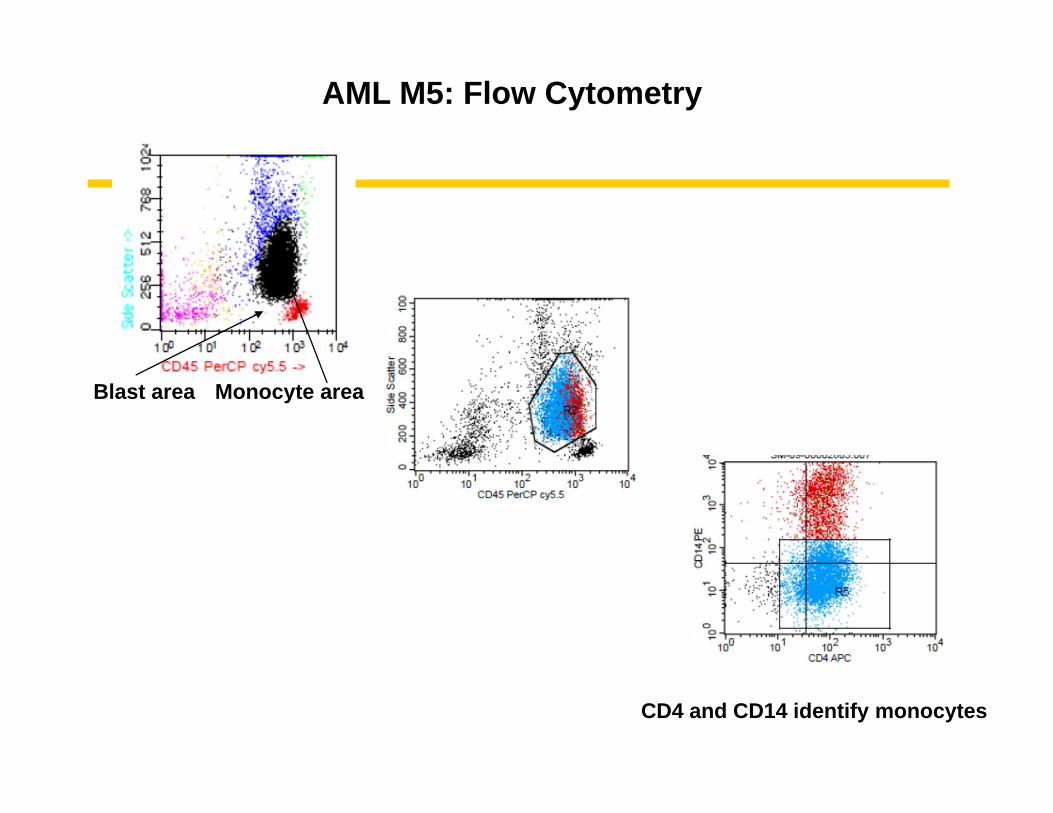
AML M5: Flow Cytometry
Blast area Monocyte area
CD4 and CD14 identify monocytes
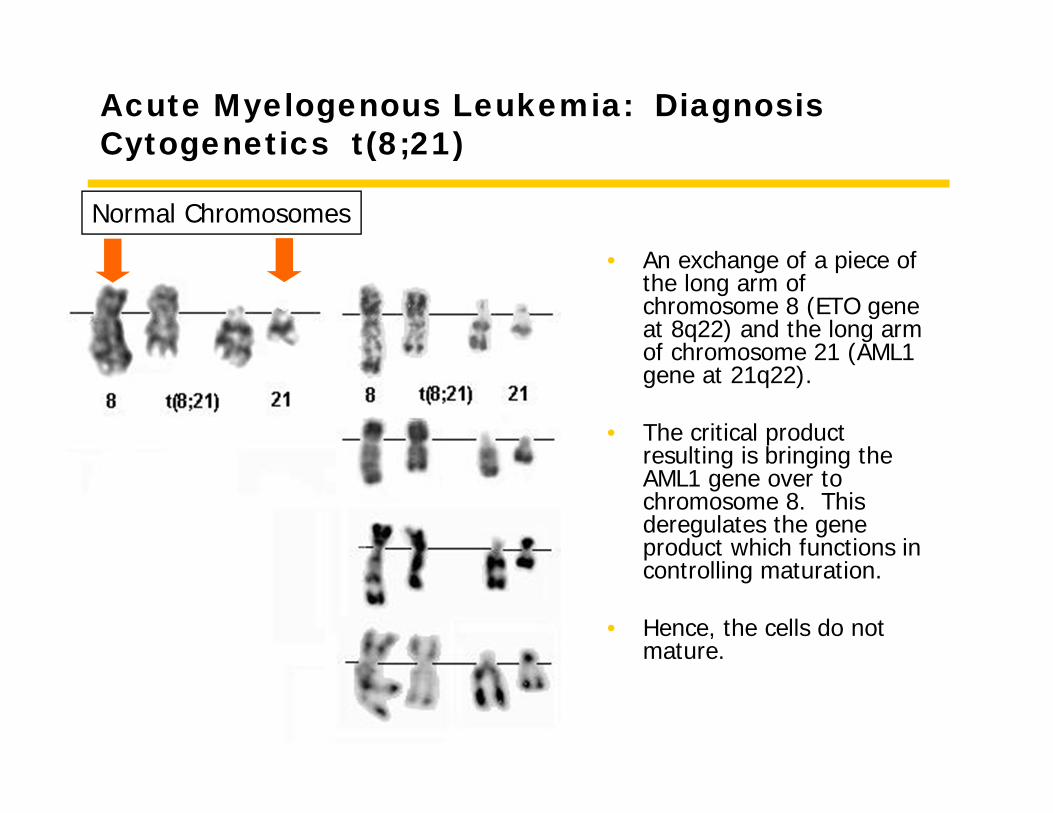
Acute Myelogenous Leukemia: DiagnosisCytogenetics t(8;21)
• An exchange of a piece of the long arm of chromosome 8 (ETO gene at 8q22) and the long arm of chromosome 21 (AML1 gene at 21q22).
• The critical product resulting is bringing the AML1 gene over to chromosome 8. This deregulates the gene product which functions in controlling maturation.
• Hence, the cells do not mature.
Normal Chromosomes
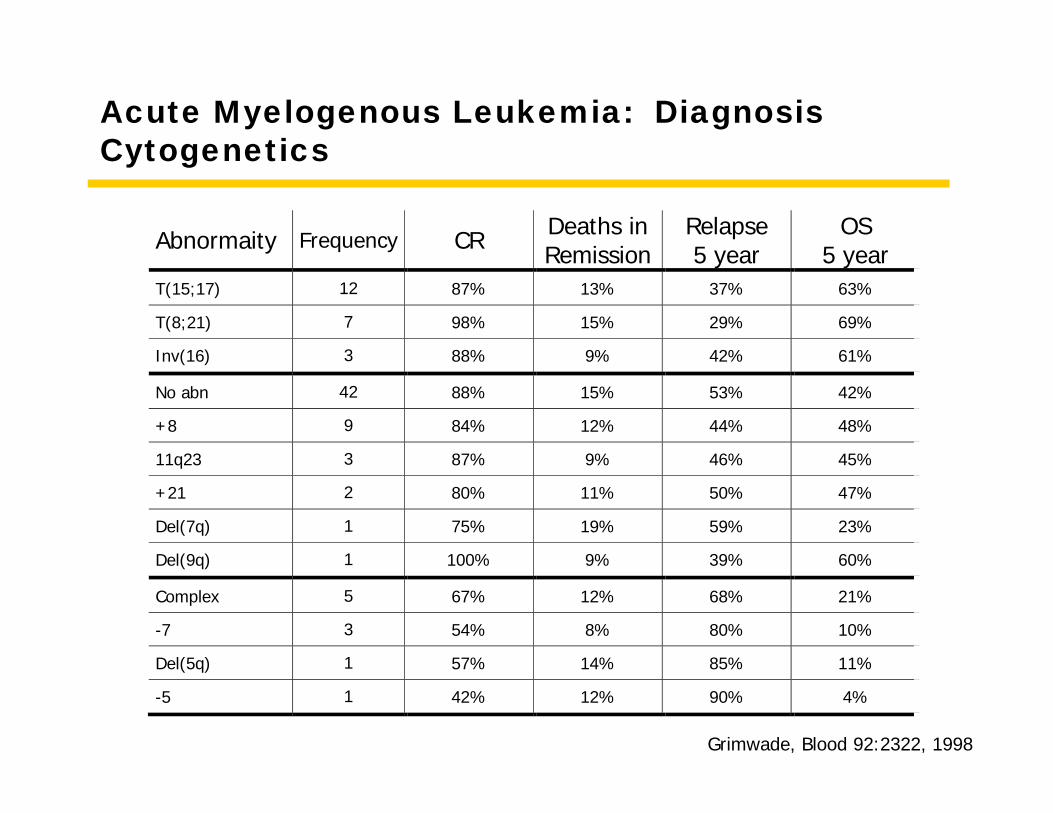
Acute Myelogenous Leukemia: DiagnosisCytogenetics
Abnormaity Frequency CR Deaths in Remission
Relapse 5 year
OS 5 year
T(15;17) 12 87% 13% 37% 63%
T(8;21) 7 98% 15% 29% 69%
Inv(16) 3 88% 9% 42% 61%
No abn 42 88% 15% 53% 42%
+8 9 84% 12% 44% 48%
11q23 3 87% 9% 46% 45%
+21 2 80% 11% 50% 47%
Del(7q) 1 75% 19% 59% 23%
Del(9q) 1 100% 9% 39% 60%
Complex 5 67% 12% 68% 21%
-7 3 54% 8% 80% 10%
Del(5q) 1 57% 14% 85% 11%
-5 1 42% 12% 90% 4%
Grimwade, Blood 92:2322, 1998
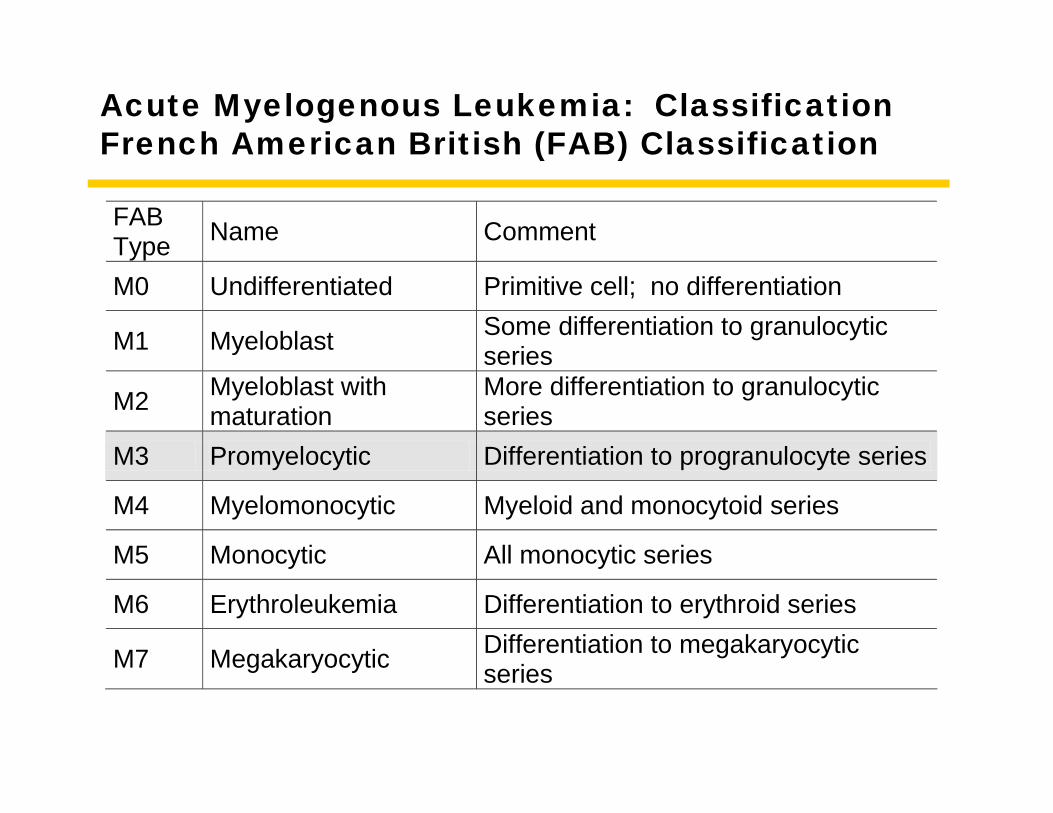
Acute Myelogenous Leukemia: ClassificationFrench American British (FAB) Classification
FAB Type Name Comment
M0 Undifferentiated Primitive cell; no differentiation
M1 Myeloblast Some differentiation to granulocytic series
M2 Myeloblast with maturation
More differentiation to granulocytic series
M3 Promyelocytic Differentiation to progranulocyte series
M4 Myelomonocytic Myeloid and monocytoid series
M5 Monocytic All monocytic series
M6 Erythroleukemia Differentiation to erythroid series
M7 Megakaryocytic Differentiation to megakaryocytic series
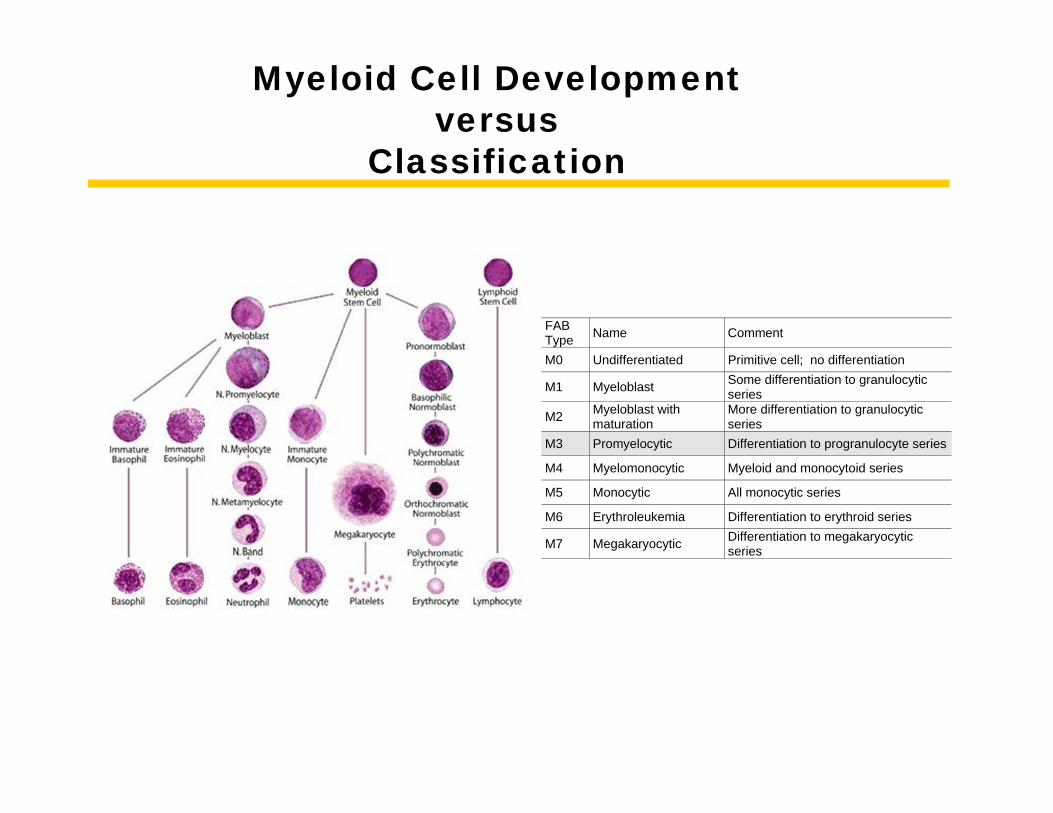
Myeloid Cell Development versus
Classification
FAB Type Name Comment
M0 Undifferentiated Primitive cell; no differentiation
M1 Myeloblast Some differentiation to granulocytic series
M2 Myeloblast with maturation
More differentiation to granulocytic series
M3 Promyelocytic Differentiation to progranulocyte series
M4 Myelomonocytic Myeloid and monocytoid series
M5 Monocytic All monocytic series
M6 Erythroleukemia Differentiation to erythroid series
M7 Megakaryocytic Differentiation to megakaryocytic series
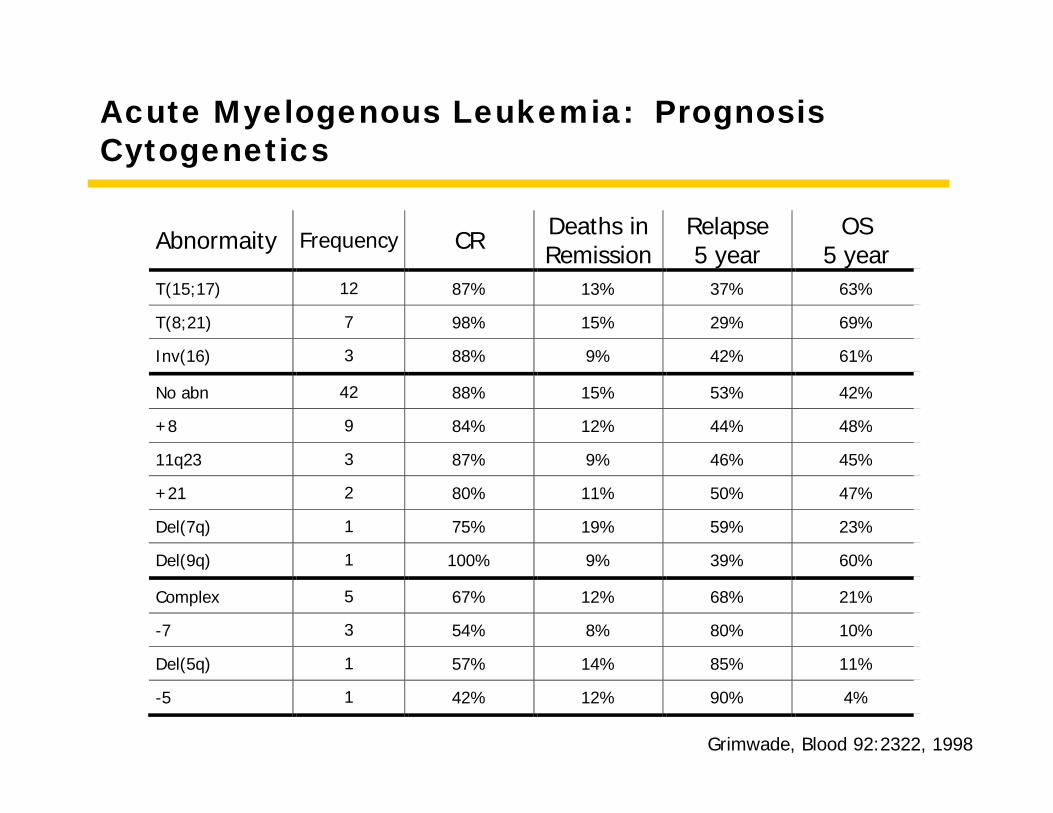
Acute Myelogenous Leukemia: PrognosisCytogenetics
Abnormaity Frequency CR Deaths in Remission
Relapse 5 year
OS 5 year
T(15;17) 12 87% 13% 37% 63%
T(8;21) 7 98% 15% 29% 69%
Inv(16) 3 88% 9% 42% 61%
No abn 42 88% 15% 53% 42%
+8 9 84% 12% 44% 48%
11q23 3 87% 9% 46% 45%
+21 2 80% 11% 50% 47%
Del(7q) 1 75% 19% 59% 23%
Del(9q) 1 100% 9% 39% 60%
Complex 5 67% 12% 68% 21%
-7 3 54% 8% 80% 10%
Del(5q) 1 57% 14% 85% 11%
-5 1 42% 12% 90% 4%
Grimwade, Blood 92:2322, 1998
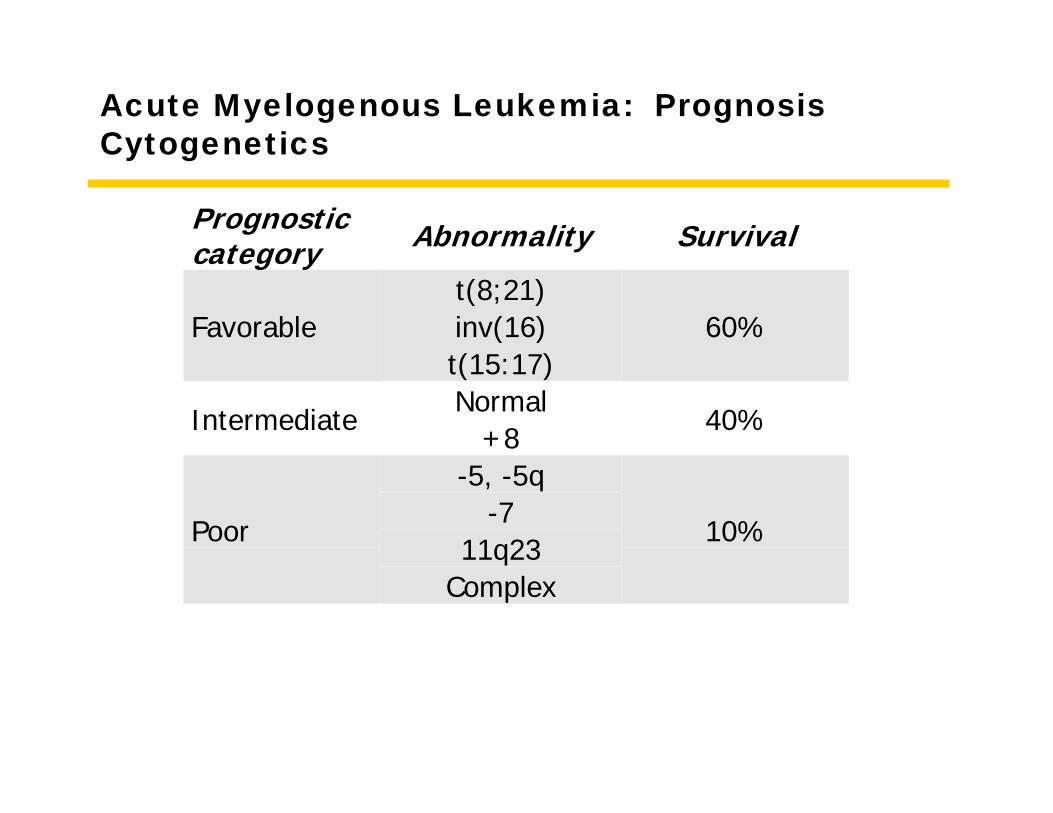
Acute Myelogenous Leukemia: PrognosisCytogenetics
Prognosticcategory Abnormality Survival
t(8;21)inv(16)Favorablet(15:17)
60%
NormalIntermediate
+840%
-5, -5q-7
11q23Poor
Complex
10%
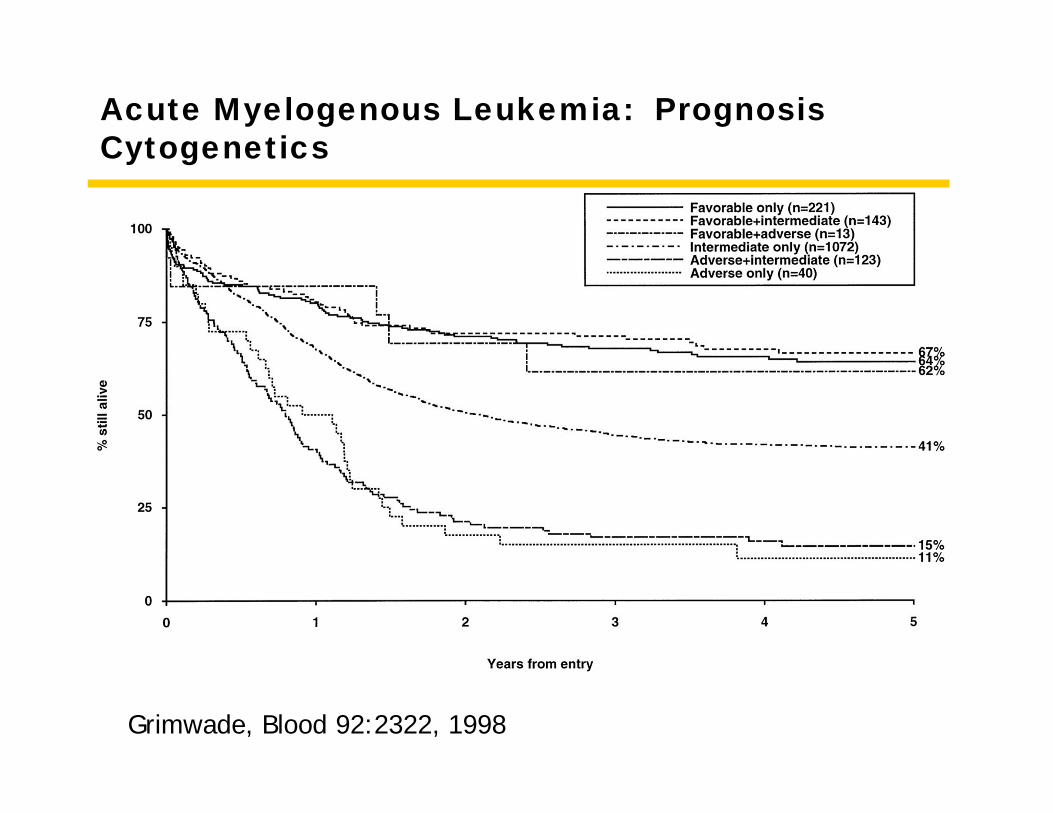
Acute Myelogenous Leukemia: PrognosisCytogenetics
Grimwade, Blood 92:2322, 1998
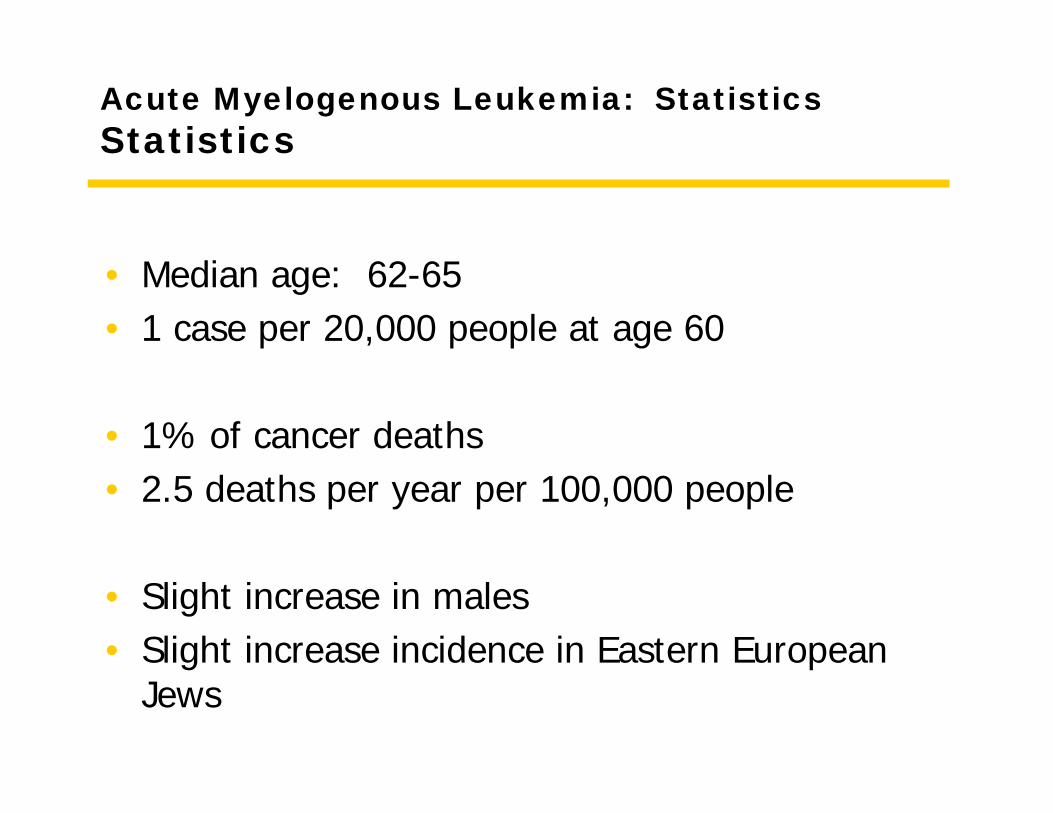
Acute Myelogenous Leukemia: StatisticsStatistics
• Median age: 62-65• 1 case per 20,000 people at age 60
• 1% of cancer deaths• 2.5 deaths per year per 100,000 people
• Slight increase in males• Slight increase incidence in Eastern European
Jews
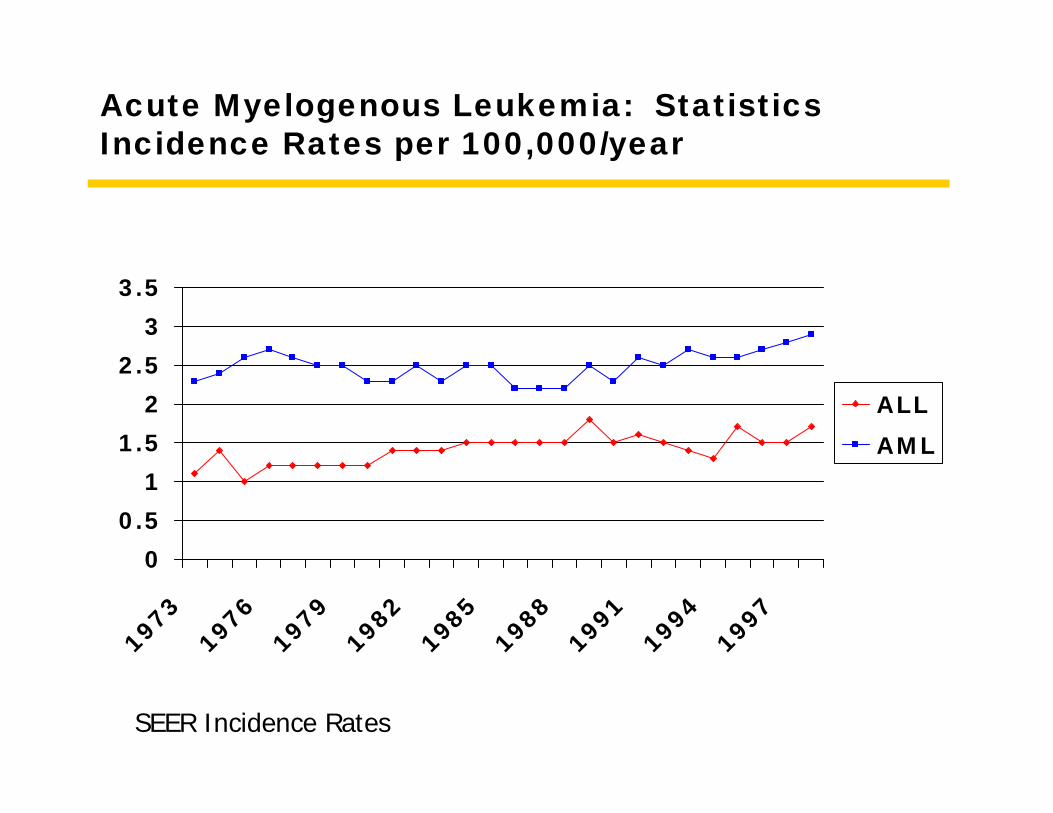
Acute Myelogenous Leukemia: StatisticsIncidence Rates per 100,000/year
00.5
11.5
22.5
33.5
197319761979198219851988199119941997
ALLAML
SEER Incidence Rates
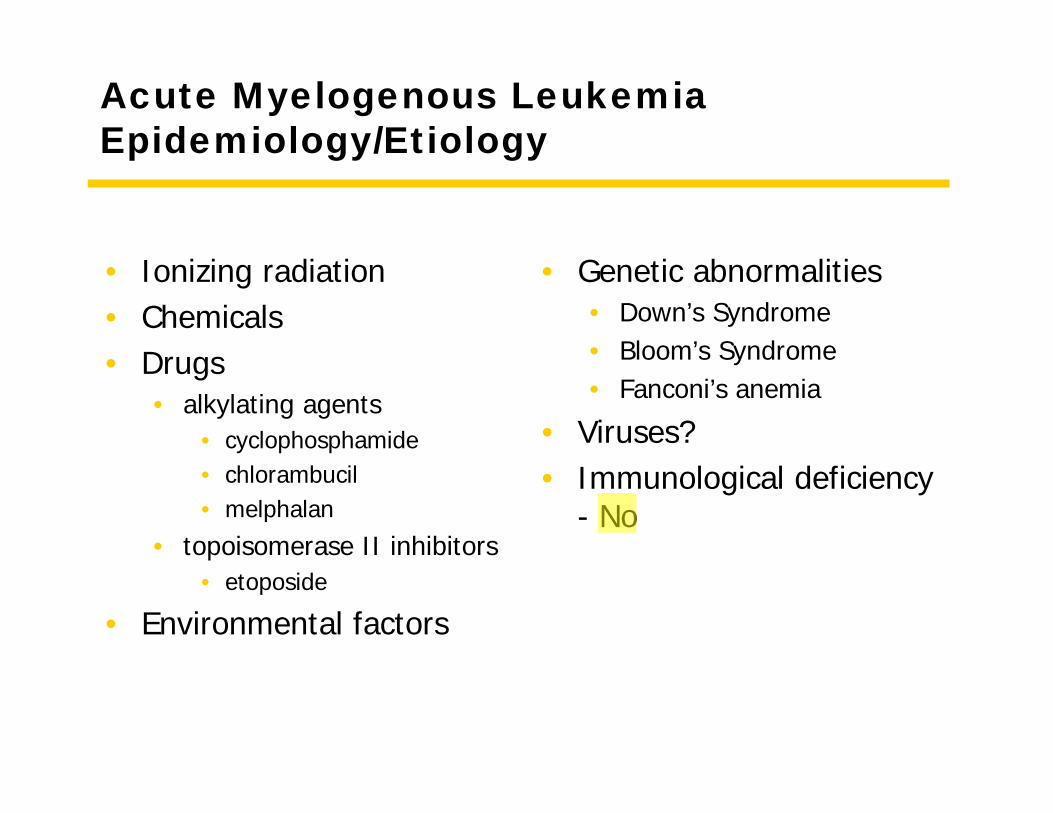
Acute Myelogenous LeukemiaEpidemiology/Etiology
• Genetic abnormalities• Down’s Syndrome• Bloom’s Syndrome• Fanconi’s anemia
• Viruses?• Immunological deficiency
- No
• Ionizing radiation• Chemicals• Drugs
• alkylating agents• cyclophosphamide• chlorambucil• melphalan
• topoisomerase II inhibitors• etoposide
• Environmental factors
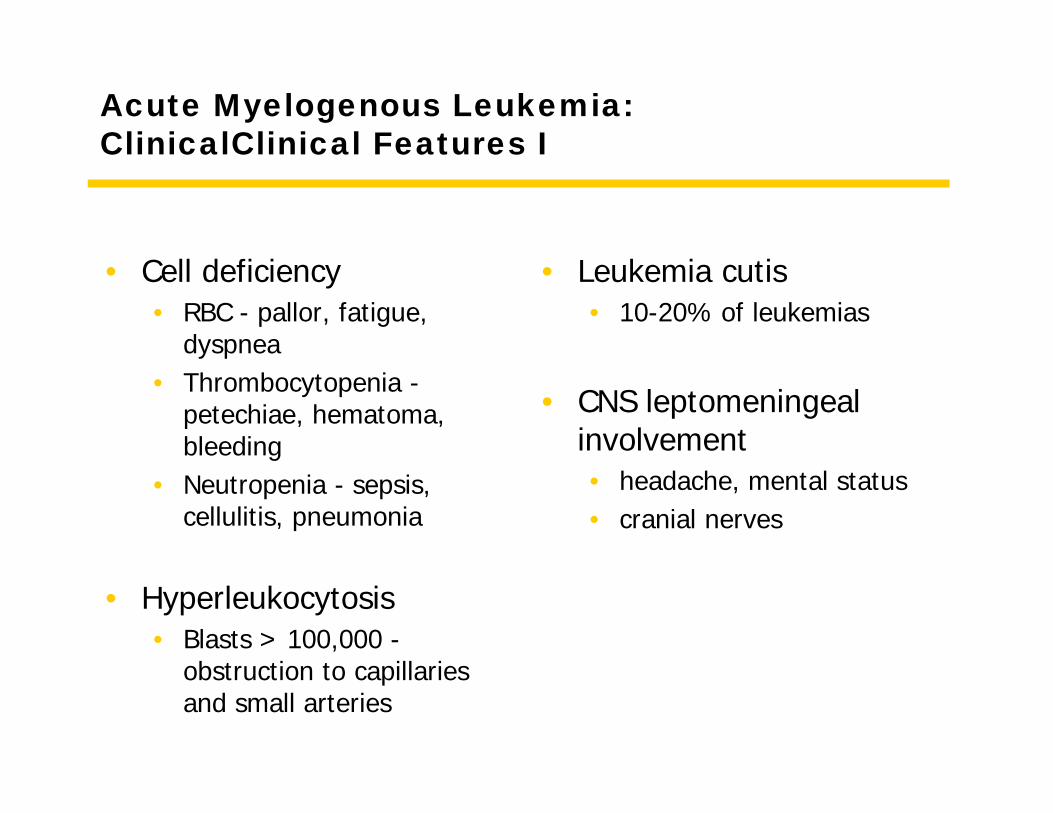
Acute Myelogenous Leukemia: ClinicalClinical Features I
• Cell deficiency• RBC - pallor, fatigue,
dyspnea• Thrombocytopenia -
petechiae, hematoma, bleeding
• Neutropenia - sepsis, cellulitis, pneumonia
• Hyperleukocytosis• Blasts > 100,000 -
obstruction to capillaries and small arteries
• Leukemia cutis• 10-20% of leukemias
• CNS leptomeningeal involvement• headache, mental status• cranial nerves
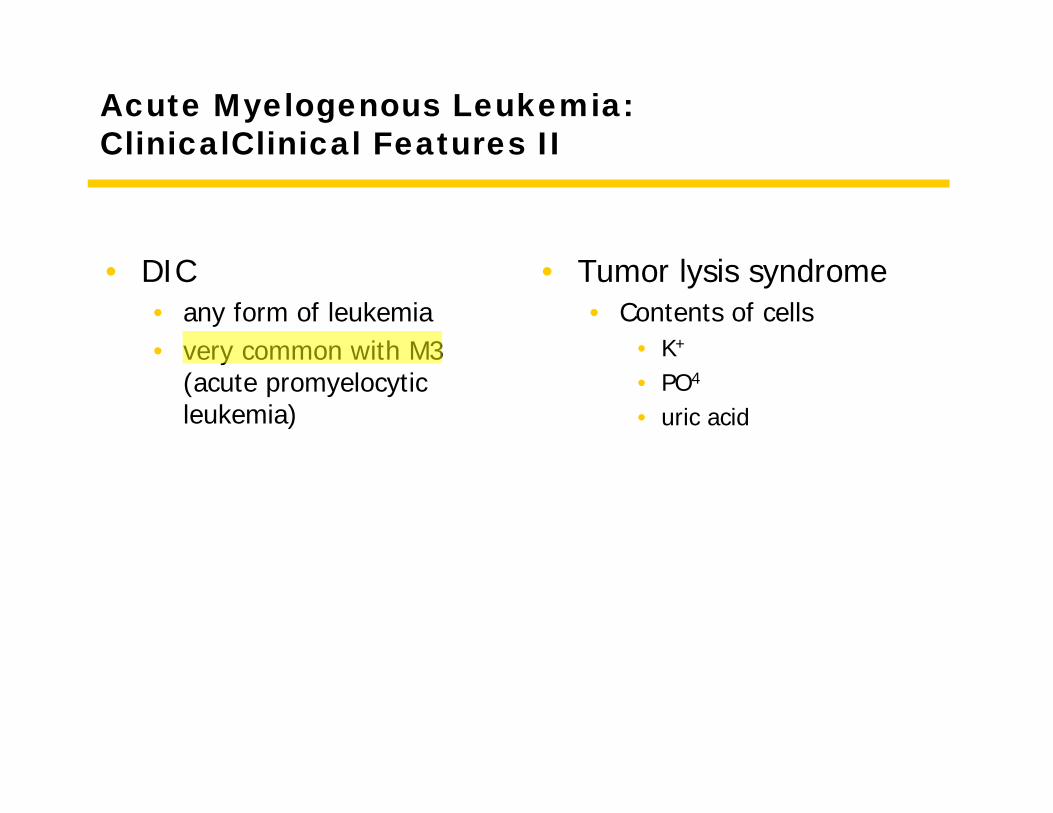
Acute Myelogenous Leukemia: ClinicalClinical Features II
• DIC• any form of leukemia• very common with M3
(acute promyelocytic leukemia)
• Tumor lysis syndrome• Contents of cells
• K+
• PO4
• uric acid
Acute Myelogenous Leukemia: ClinicalClinical Features III
• Leukocytosis
• low pO(2)
• low glucose
• high potassium
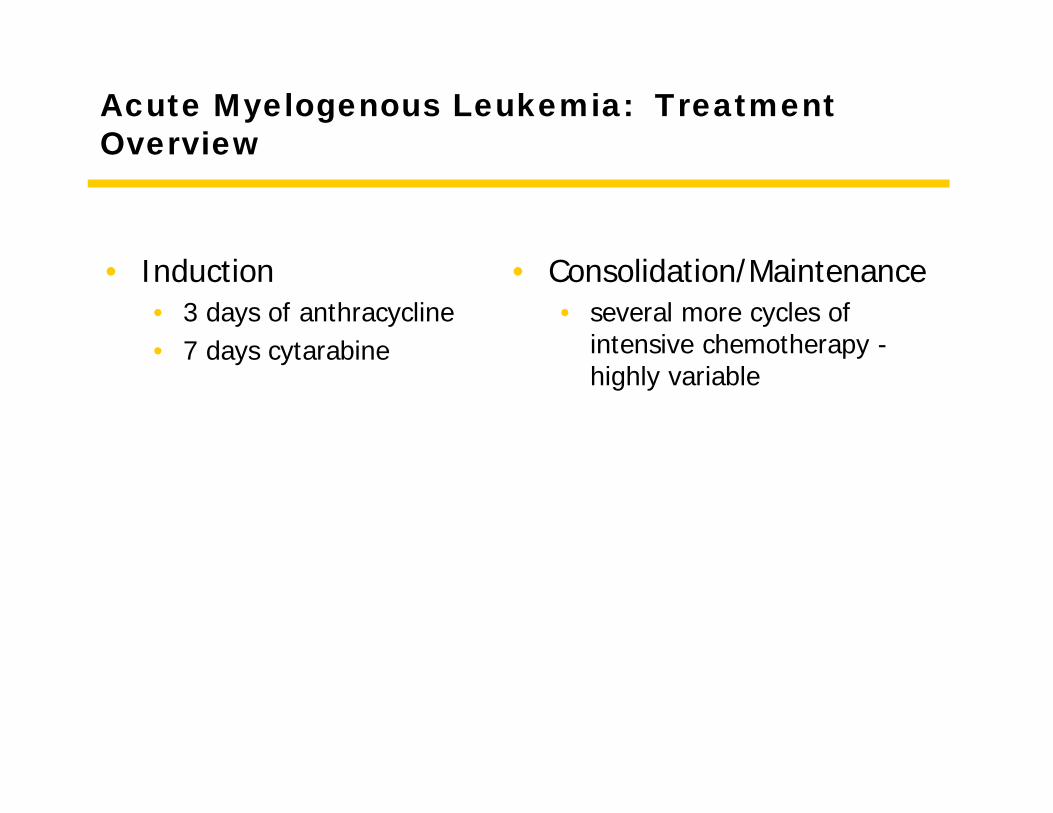
Acute Myelogenous Leukemia: TreatmentOverview
• Induction• 3 days of anthracycline• 7 days cytarabine
• Consolidation/Maintenance• several more cycles of
intensive chemotherapy -highly variable
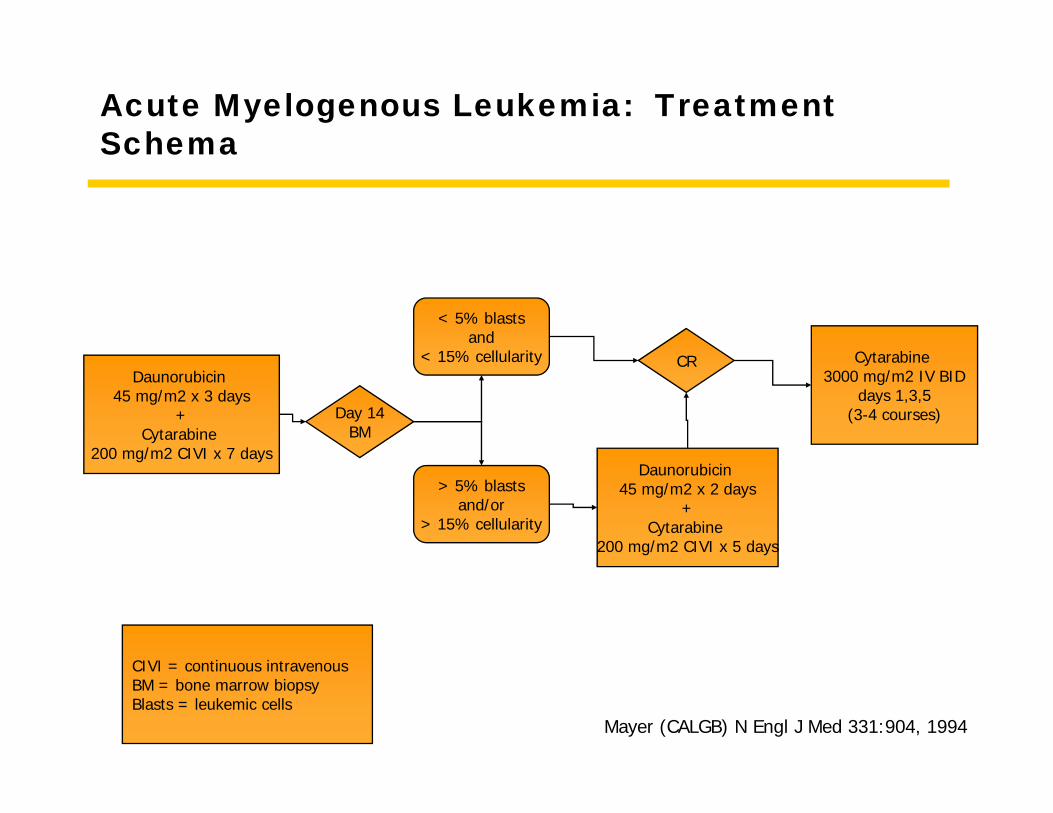
Acute Myelogenous Leukemia: TreatmentSchema
Mayer (CALGB) N Engl J Med 331:904, 1994
Daunorubicin 45 mg/m2 x 3 days
+Cytarabine
200 mg/m2 CIVI x 7 days
Day 14BM
< 5% blastsand
< 15% cellularity
> 5% blastsand/or
> 15% cellularity
CR
Daunorubicin 45 mg/m2 x 2 days
+Cytarabine
200 mg/m2 CIVI x 5 days
Cytarabine 3000 mg/m2 IV BID
days 1,3,5(3-4 courses)
CIVI = continuous intravenousBM = bone marrow biopsyBlasts = leukemic cells
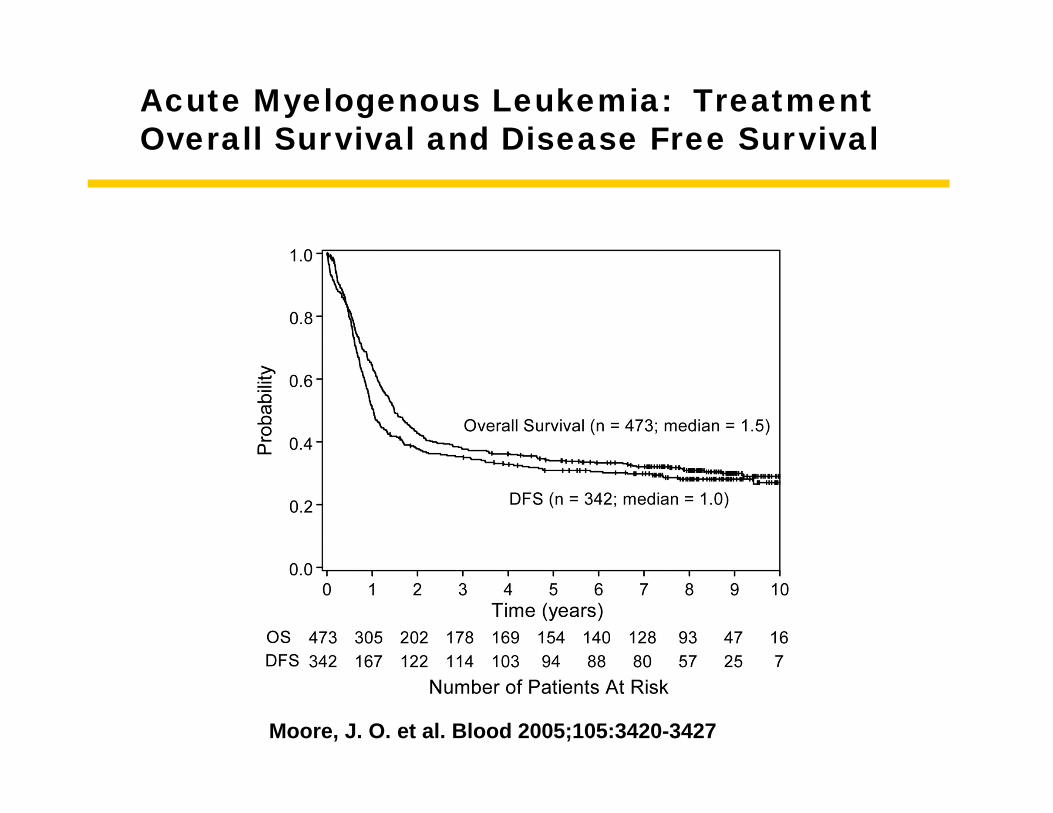
Moore, J. O. et al. Blood 2005;105:3420-3427
Acute Myelogenous Leukemia: TreatmentOverall Survival and Disease Free Survival
Acute Myelogenous LeukemiaSummary
• Cells do not mature and do not die• Older individual (can be young)• Fatigue• Normal physicial exam• Pancytopenia• Aggressive chemotherapy• 30% survival