Embed Size (px)
Citation preview
Multiple Task Learning for Cantaloupe Melon HarvestForecasting
Daniel L. SilverAcadia University
27 University Ave, Carnegie Hall 310Wolfveille, Nova Scotia B4P2R6
Geo�rey MasonAcadia University
27 University Ave., Carnegie Hall 310Wolfveille, Nova Scotia B4P2R6
Mac MacLeodScotia Weather Services Inc.11 �ornhill Dr., Suite 240
Dartmouth, Nova Scotia [email protected]
David ColvilleNova Scotia Community College
Annapolis Valley CampusMiddleton, Nova Scotia B0S 1P0
Andy VermeulenVermeulen Farms Limited48 Rabbit Square Road
Canning, Nova Scotia B0P [email protected]
ABSTRACT�is project takes a data mining with multiple task learning ap-proach to develop a forecast model that predicts cantaloupe melonharvest (number of melons) each day for up to 14 days for �eldslocated in the Annapolis Valley of Nova Scotia. �e �nal predictivemodel forecasts tomorrows expected cumulative yield as well as theexpected growing degree days (GDD) given the current day of theyear, observed and forecasted GDD and recent harvest data. �emodel iteratively predicts these outcomes one day into the futurefor 14 days using the current weather forecast. �e model’s pre-dicted GDD is used in those rare cases where the forecasted weatheris not available from the weather service. �e model was deployedin the summer of 2014, with a harvest forecast being mailed outtwice a week to the farmer starting in late July. �e results showthat the model was particularly helpful in accurately forecastingyield during the start of the season, allowing the farmer greatertime to plan logistics for harvest and delivery to market. Duringthe season, the model signi�cantly overestimated the number ofmelons picked because of (1) an anomaly in melon planting timesand (2) marketing factors that were not factored into the model. Anumber of useful recommendations were developed by the teamfor future studies.
CCS CONCEPTS•Computingmethodologies→Supervised learning by regres-sion; Neural networks; •Applied computing →Agriculture;
KEYWORDSdata mining, predictive modeling, harvest forecasting, multiple tasklearning, neural networks.
Permission to make digital or hard copies of part or all of this work for personal orclassroom use is granted without fee provided that copies are not made or distributedfor pro�t or commercial advantage and that copies bear this notice and the full citationon the �rst page. Copyrights for third-party components of this work must be honored.For all other uses, contact the owner/author(s).KDD-2017, Halifax, Nova Scotia, Canada© 2017 Copyright held by the owner/author(s). 123-4567-24-567/08/06. . .$15.00DOI: 10.475/123 4
ACM Reference format:Daniel L. Silver, Geo�rey Mason, Mac MacLeod, David Colville, and AndyVermeulen. 2017. Multiple Task Learning for Cantaloupe Melon HarvestForecasting. In Proceedings of KDD 2017 Halifax conference, Halifax, NovaScotia, Canada, August 2017 (KDD-2017), 8 pages.DOI: 10.475/123 4
1 INTRODUCTIONSuccess in the harvest of crops and their delivery to market dependson knowing when the produce is ready to be picked and the plan-ning of human and material resources to maximize crop yield [10].Cantaloupe melons are particularly challenging, as the harvest pe-riod is short and the required human and transportation resourcesdemanding [9]. �is requires careful planning and logistics based onthe best possible prediction of crop yield. Scotia Weather ServicesInc (SWS) wishes to extend their abilities in weather forecastingto provide forecasts of crop yield to the agri-food industry - fromfarmers to markets [2, 4, 5, 7].
�is project takes a data mining approach and uses mutilpletask machine learning technology to develop forecast models thatpredict melon harvest (number of melons) per day up to two weeksin advance. �e predictive models forecast daily harvest given thecurrent day of the year, observed and forecasted weather data and�eld information [1, 6, 8]. Vermeulen Farms (VF) of Canning, NSprovided domain expertise and melon harvest data from 2007 to2013. In addition, we obtained (1) observed weather data from En-vironment Canada as well as an existing Nova Scotia CommunityCollege (NSCC) weather station proximal to Vermeulen Farms, and(2) high quality weather forecast data from the Weather Networkand Scotia Weather Services for two weeks in advance. �e majorchallenge anticipated in the project was making accurate harvestpredictions out over the two week period so that the advance in-formation would be useful for farm and market planning. We alsoinstalled and tested automated weather and photography equip-ment during the 2014 harvest season so as to more accurately record�eld data.
Based on the results of this project, we anticipate collaboratingwith SWS to develop the requirements for a fully automated fore-casting system. �e long-term goal is to develop a cloud-basedharvest forecasting system for a variety of crops. �is project is
KDD-2017, August 2017, Halifax, Nova Scotia, Canada D. Silver et al.
a signi�cant step toward SWS being able to develop a unique andinnovative crop forecasting service in Canada ultimately bene�tingSWS and the agricultural industry as a whole.
1.1 Objectives�e project had four objectives: (1) To determine the best way toformulate the data mining problem and the most important predic-tor variables. (2) To build more accurate predictive models and testthem live during the 2014 growing season using a semi-automateddelivery method that sends forecasts to Vermeulen Farms by email.�e predictive model will forecast daily harvest up to 14 days inadvance given the day of the year, observed and forecasted weatherdata as inputs. (3)To install and test automated weather and pho-tography equipment in the �eld so as to more accurately record�eld data during the 2014 season. (4) To develop recommendationsfor future work in this applied area.
1.2 ApproachA standard data mining approach was used to develop and test thepredictive models. We enriched the observed weather data we hadwith additional soil temperature and moisture and solar radiationdata from a NSCC weather station as well as high quality dailyweather forecast data from SWS. Historic melon yield data fromVermeulen Farms was also reviewed, cleaned and consolidated.�is data was used to develop and test arti�cial neural networkmodels that predict the crop yield for up to 14 days in advance. Acon�dence interval was estimated for each daily prediction.
Beginning in mid-July the best model was deployed to make fore-casts for the 2014 growing season. A semi-automated approach wastaken, whereby daily observed weather and new weather forecasts,obtained from the weather station and SWS, respectfully, were usedto make yield predictions. �ese daily forecasts were delivered toVermeulen Farms by email for their decision making. �e machinelearning methods we employed are tried and proven in the litera-ture [6]. Innovation occurred in the areas of data representation,the handling of missing weather values and model developmentfor predictions up to two weeks in advance. Following the �nalharvests in September, the results were analyzed and a report wasprepared by the team.
Raw weather data was collected from the weather station andprepared for model development. Because of missing data in thehistoric records, work had to be done to impute values based onbest estimates from nearby weather stations. Two new cameras(with temperature loggers) were set up in the melon �eld. �is newequipment provided a means of measuring the temperature in the�eld and the growth of the melons over the 2014 growing season.�e camera images were analyzed to monitor melon growth overthe season and capture temperature changes and �eld activities.
Notes were made during the project and in November the teamcompleted a requirements analysis that resulted in a series of rec-ommendations for future work.
�e remainder of this paper will follow the CRISP Data Min-ing methodology, reporting on the six major steps undertakenby the project: business understanding, data understanding, datapreparation and analysis, model development, model evaluation,deployment, summary and recommendations.
2 BUSINESS UNDERSTANDING�e ability to accurately forecast melon harvest data is directlydependent on access to weather forecast data. Current NumericalWeather Prediction (NWP) models are able to generate weatherforecasts up to 14 days into the future. �is was determined to bethe practical limit for our melon forecasts. Vermeulen Farms feltthat this would be more than enough to meet their farm planningneeds, although their markets would prefer even more advancedforecasts.
�e energy provided by the sun to plants is well understoodto be the dominant factor in their growth and production of fruit.Speci�cally, the growing degree days (GDDs) metric is consideredthe best indicator of plant growth in the agricultural �eld. GDDis de�ned as [(Maximum temperature of day) + (Minimum tem-perature of day)]/2 - (Base temperature); where negative valuesare treated as zero, and Base temperature for cantaloupes is 10 ◦C(varies for each crop). Most crops become ripe for harvesting oncethe GDDs accumulated from the time of planting exceeds a certainvalue. Other factors that we assumed would play a major role basedon our literature survey were solar radiation, total precipitationand relative humidity.
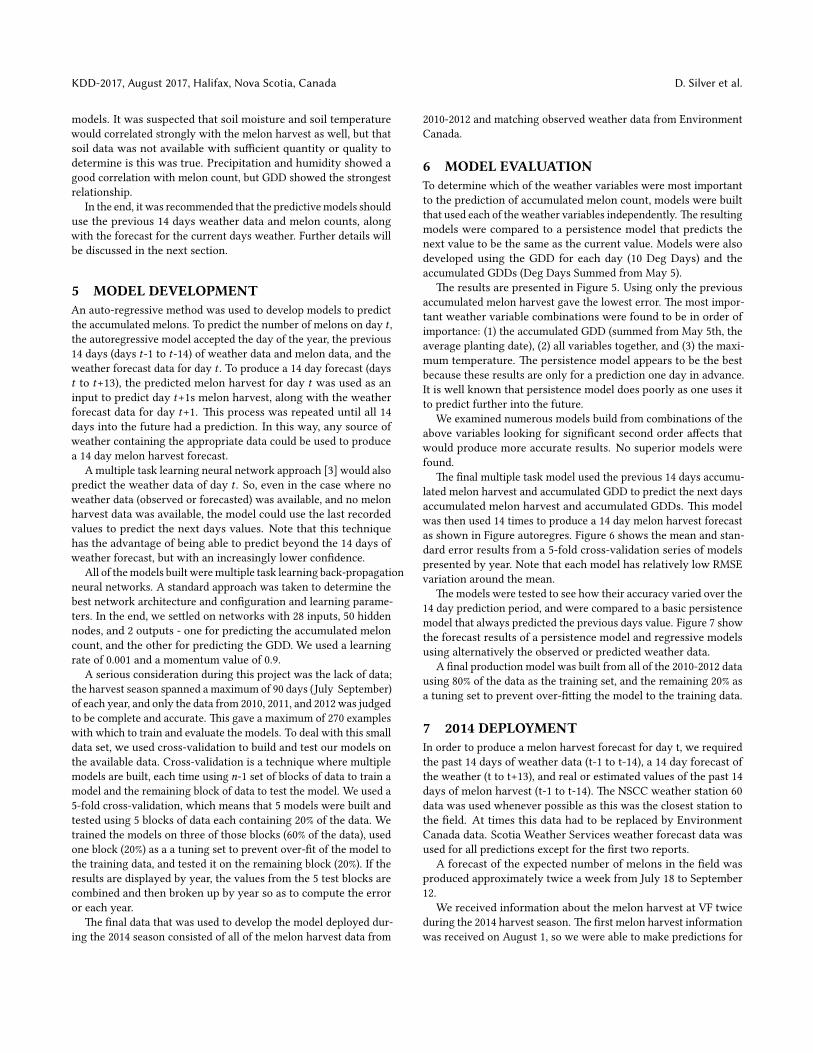
We came to realize that observed and forecasted weather data,and harvest data may be unavailable at times. �is meant that oursystem would have to be robust enough to handle missing data. Oursolution was to create a multiple task predictive model [3] that esti-mated all required input values for the next melon forecast interval.�ese estimates could be used to replace any missing input valuesrequired by the model. More speci�cally, as shown in Figure 3, wewould develop a model that accepted the previous 14 days weatherinformation and melon harvest, and predicted the current daysweather and melon harvest. �is is referred to as an auto-regressivemodel. By using this model iteratively, we could predict as far outas desired, interchangeably using our own previously predictedvalues of weather or melon yield as replacements, if the actual datawas unavailable.
3 DATA UNDERSTANDING�e harvest information obtained from Vermeulen Farms was from3 �elds making up a total of about 30 acres. �ese �elds produce alarge quantity of the cantaloupe melons sold in Nova Scotia. �edata contained information about the number of melons harvestedat each size, however an analysis of the records indicate a number ofuncertainties in the breakdown of the total melon count. VermeulenFarms recommended that for this initial project that we focus onpredicting the total number of melons independent of size.
It was our understanding going into the project that the count ofmelons harvested was driven largely by the plant yield in the �eld,and that the major problem for the project team was predictingthis yield. �is is a factor of considerable importance that will berevisited later.
4 DATA PREPARATION AND ANALYSIS�e data used in the project can be broadly divided into melonharvest data and weather data. �e initial preparation and analysisof these data sets was done independently, before combining them.
Multiple Task Learning for Cantaloupe Melon Harvest Forecasting KDD-2017, August 2017, Halifax, Nova Scotia, Canada
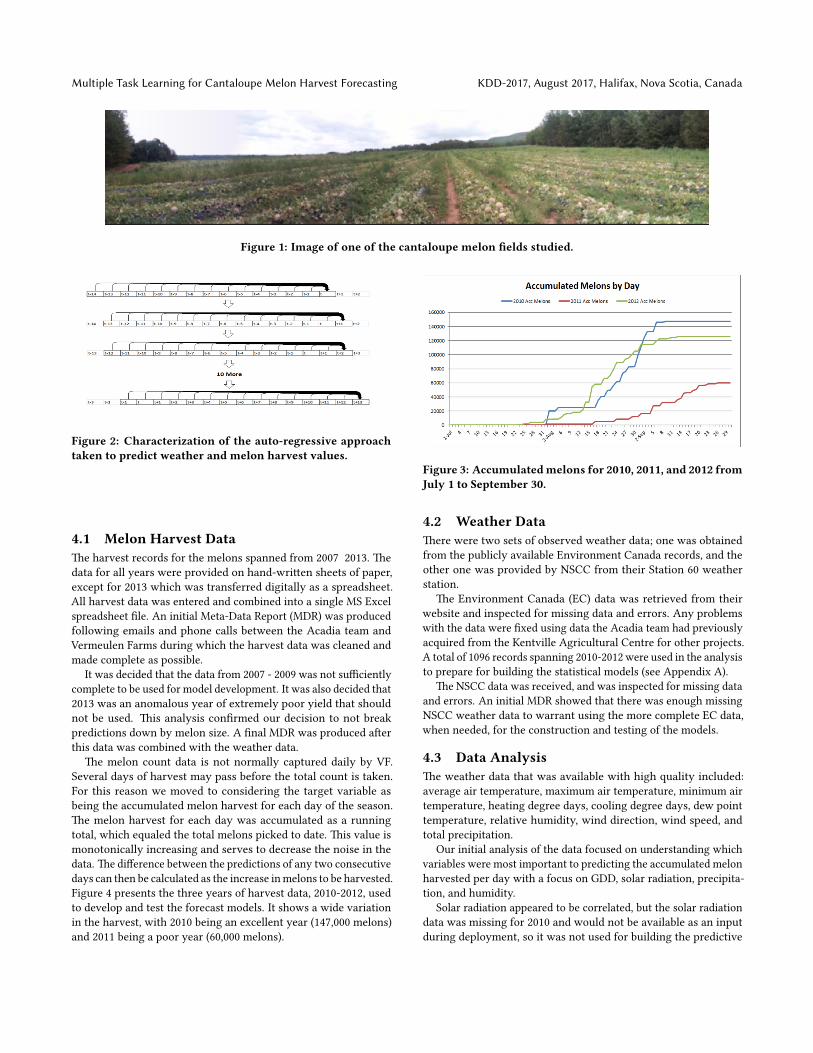
Figure 1: Image of one of the cantaloupe melon �elds studied.
Figure 2: Characterization of the auto-regressive approachtaken to predict weather and melon harvest values.
4.1 Melon Harvest Data�e harvest records for the melons spanned from 2007 2013. �edata for all years were provided on hand-wri�en sheets of paper,except for 2013 which was transferred digitally as a spreadsheet.All harvest data was entered and combined into a single MS Excelspreadsheet �le. An initial Meta-Data Report (MDR) was producedfollowing emails and phone calls between the Acadia team andVermeulen Farms during which the harvest data was cleaned andmade complete as possible.
It was decided that the data from 2007 - 2009 was not su�cientlycomplete to be used for model development. It was also decided that2013 was an anomalous year of extremely poor yield that shouldnot be used. �is analysis con�rmed our decision to not breakpredictions down by melon size. A �nal MDR was produced a�erthis data was combined with the weather data.
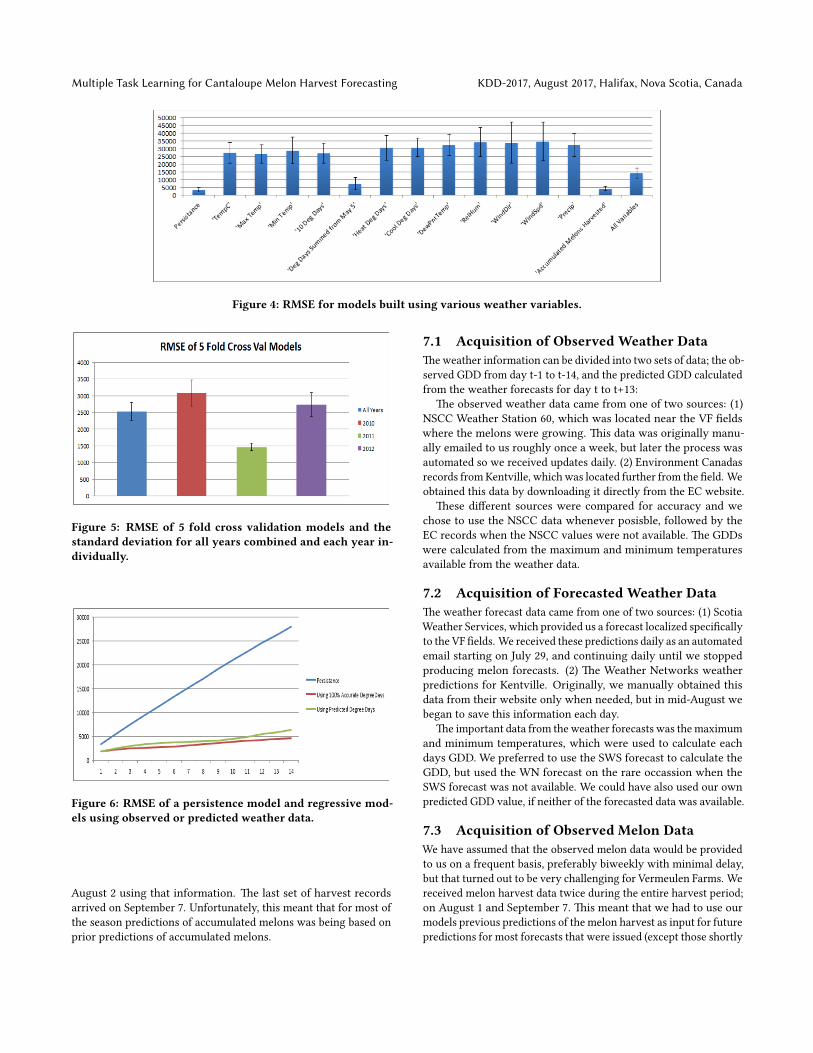
�e melon count data is not normally captured daily by VF.Several days of harvest may pass before the total count is taken.For this reason we moved to considering the target variable asbeing the accumulated melon harvest for each day of the season.�e melon harvest for each day was accumulated as a runningtotal, which equaled the total melons picked to date. �is value ismonotonically increasing and serves to decrease the noise in thedata. �e di�erence between the predictions of any two consecutivedays can then be calculated as the increase inmelons to be harvested.Figure 4 presents the three years of harvest data, 2010-2012, usedto develop and test the forecast models. It shows a wide variationin the harvest, with 2010 being an excellent year (147,000 melons)and 2011 being a poor year (60,000 melons).
Figure 3: Accumulatedmelons for 2010, 2011, and 2012 fromJuly 1 to September 30.
4.2 Weather Data�ere were two sets of observed weather data; one was obtainedfrom the publicly available Environment Canada records, and theother one was provided by NSCC from their Station 60 weatherstation.
�e Environment Canada (EC) data was retrieved from theirwebsite and inspected for missing data and errors. Any problemswith the data were �xed using data the Acadia team had previouslyacquired from the Kentville Agricultural Centre for other projects.A total of 1096 records spanning 2010-2012 were used in the analysisto prepare for building the statistical models (see Appendix A).
�e NSCC data was received, and was inspected for missing dataand errors. An initial MDR showed that there was enough missingNSCC weather data to warrant using the more complete EC data,when needed, for the construction and testing of the models.
4.3 Data Analysis�e weather data that was available with high quality included:average air temperature, maximum air temperature, minimum airtemperature, heating degree days, cooling degree days, dew pointtemperature, relative humidity, wind direction, wind speed, andtotal precipitation.
Our initial analysis of the data focused on understanding whichvariables were most important to predicting the accumulated melonharvested per day with a focus on GDD, solar radiation, precipita-tion, and humidity.
Solar radiation appeared to be correlated, but the solar radiationdata was missing for 2010 and would not be available as an inputduring deployment, so it was not used for building the predictive
KDD-2017, August 2017, Halifax, Nova Scotia, Canada D. Silver et al.
models. It was suspected that soil moisture and soil temperaturewould correlated strongly with the melon harvest as well, but thatsoil data was not available with su�cient quantity or quality todetermine is this was true. Precipitation and humidity showed agood correlation with melon count, but GDD showed the strongestrelationship.
In the end, it was recommended that the predictivemodels shoulduse the previous 14 days weather data and melon counts, alongwith the forecast for the current days weather. Further details willbe discussed in the next section.
5 MODEL DEVELOPMENTAn auto-regressive method was used to develop models to predictthe accumulated melons. To predict the number of melons on day t ,the autoregressive model accepted the day of the year, the previous14 days (days t-1 to t-14) of weather data and melon data, and theweather forecast data for day t . To produce a 14 day forecast (dayst to t+13), the predicted melon harvest for day t was used as aninput to predict day t+1s melon harvest, along with the weatherforecast data for day t+1. �is process was repeated until all 14days into the future had a prediction. In this way, any source ofweather containing the appropriate data could be used to producea 14 day melon harvest forecast.
A multiple task learning neural network approach [3] would alsopredict the weather data of day t . So, even in the case where noweather data (observed or forecasted) was available, and no melonharvest data was available, the model could use the last recordedvalues to predict the next days values. Note that this techniquehas the advantage of being able to predict beyond the 14 days ofweather forecast, but with an increasingly lower con�dence.
All of themodels built weremultiple task learning back-propagationneural networks. A standard approach was taken to determine thebest network architecture and con�guration and learning parame-ters. In the end, we se�led on networks with 28 inputs, 50 hiddennodes, and 2 outputs - one for predicting the accumulated meloncount, and the other for predicting the GDD. We used a learningrate of 0.001 and a momentum value of 0.9.
A serious consideration during this project was the lack of data;the harvest season spanned a maximum of 90 days (July September)of each year, and only the data from 2010, 2011, and 2012 was judgedto be complete and accurate. �is gave a maximum of 270 exampleswith which to train and evaluate the models. To deal with this smalldata set, we used cross-validation to build and test our models onthe available data. Cross-validation is a technique where multiplemodels are built, each time using n-1 set of blocks of data to train amodel and the remaining block of data to test the model. We used a5-fold cross-validation, which means that 5 models were built andtested using 5 blocks of data each containing 20% of the data. Wetrained the models on three of those blocks (60% of the data), usedone block (20%) as a a tuning set to prevent over-�t of the model tothe training data, and tested it on the remaining block (20%). If theresults are displayed by year, the values from the 5 test blocks arecombined and then broken up by year so as to compute the erroror each year.
�e �nal data that was used to develop the model deployed dur-ing the 2014 season consisted of all of the melon harvest data from
2010-2012 and matching observed weather data from EnvironmentCanada.
6 MODEL EVALUATIONTo determine which of the weather variables were most importantto the prediction of accumulated melon count, models were builtthat used each of the weather variables independently. �e resultingmodels were compared to a persistence model that predicts thenext value to be the same as the current value. Models were alsodeveloped using the GDD for each day (10 Deg Days) and theaccumulated GDDs (Deg Days Summed from May 5).
�e results are presented in Figure 5. Using only the previousaccumulated melon harvest gave the lowest error. �e most impor-tant weather variable combinations were found to be in order ofimportance: (1) the accumulated GDD (summed from May 5th, theaverage planting date), (2) all variables together, and (3) the maxi-mum temperature. �e persistence model appears to be the bestbecause these results are only for a prediction one day in advance.It is well known that persistence model does poorly as one uses itto predict further into the future.
We examined numerous models build from combinations of theabove variables looking for signi�cant second order a�ects thatwould produce more accurate results. No superior models werefound.
�e �nal multiple task model used the previous 14 days accumu-lated melon harvest and accumulated GDD to predict the next daysaccumulated melon harvest and accumulated GDDs. �is modelwas then used 14 times to produce a 14 day melon harvest forecastas shown in Figure autoregres. Figure 6 shows the mean and stan-dard error results from a 5-fold cross-validation series of modelspresented by year. Note that each model has relatively low RMSEvariation around the mean.
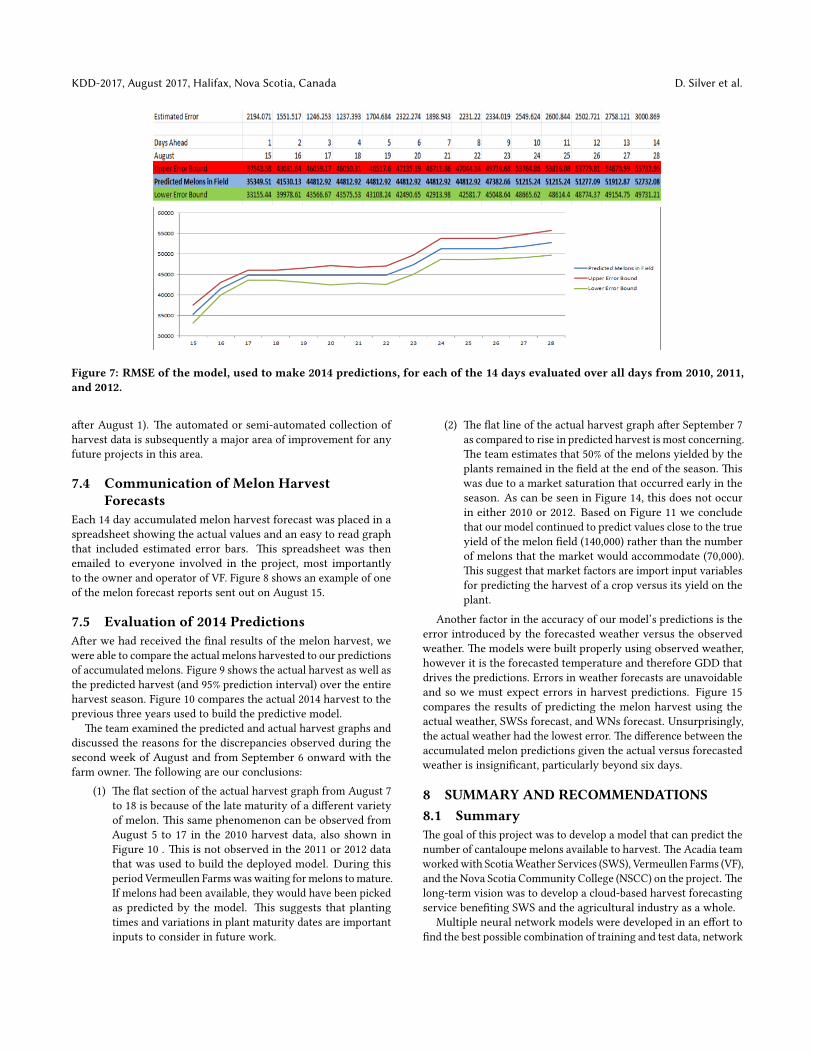
�e models were tested to see how their accuracy varied over the14 day prediction period, and were compared to a basic persistencemodel that always predicted the previous days value. Figure 7 showthe forecast results of a persistence model and regressive modelsusing alternatively the observed or predicted weather data.
A �nal production model was built from all of the 2010-2012 datausing 80% of the data as the training set, and the remaining 20% asa tuning set to prevent over-��ing the model to the training data.
7 2014 DEPLOYMENTIn order to produce a melon harvest forecast for day t, we requiredthe past 14 days of weather data (t-1 to t-14), a 14 day forecast ofthe weather (t to t+13), and real or estimated values of the past 14days of melon harvest (t-1 to t-14). �e NSCC weather station 60data was used whenever possible as this was the closest station tothe �eld. At times this data had to be replaced by EnvironmentCanada data. Scotia Weather Services weather forecast data wasused for all predictions except for the �rst two reports.
A forecast of the expected number of melons in the �eld wasproduced approximately twice a week from July 18 to September12.
We received information about the melon harvest at VF twiceduring the 2014 harvest season. �e �rst melon harvest informationwas received on August 1, so we were able to make predictions for
Multiple Task Learning for Cantaloupe Melon Harvest Forecasting KDD-2017, August 2017, Halifax, Nova Scotia, Canada
Figure 4: RMSE for models built using various weather variables.
Figure 5: RMSE of 5 fold cross validation models and thestandard deviation for all years combined and each year in-dividually.
Figure 6: RMSE of a persistence model and regressive mod-els using observed or predicted weather data.
August 2 using that information. �e last set of harvest recordsarrived on September 7. Unfortunately, this meant that for most ofthe season predictions of accumulated melons was being based onprior predictions of accumulated melons.
7.1 Acquisition of Observed Weather Data�eweather information can be divided into two sets of data; the ob-served GDD from day t-1 to t-14, and the predicted GDD calculatedfrom the weather forecasts for day t to t+13:
�e observed weather data came from one of two sources: (1)NSCC Weather Station 60, which was located near the VF �eldswhere the melons were growing. �is data was originally manu-ally emailed to us roughly once a week, but later the process wasautomated so we received updates daily. (2) Environment Canadasrecords fromKentville, which was located further from the �eld. Weobtained this data by downloading it directly from the EC website.
�ese di�erent sources were compared for accuracy and wechose to use the NSCC data whenever posisble, followed by theEC records when the NSCC values were not available. �e GDDswere calculated from the maximum and minimum temperaturesavailable from the weather data.
7.2 Acquisition of Forecasted Weather Data�e weather forecast data came from one of two sources: (1) ScotiaWeather Services, which provided us a forecast localized speci�callyto the VF �elds. We received these predictions daily as an automatedemail starting on July 29, and continuing daily until we stoppedproducing melon forecasts. (2) �e Weather Networks weatherpredictions for Kentville. Originally, we manually obtained thisdata from their website only when needed, but in mid-August webegan to save this information each day.
�e important data from the weather forecasts was themaximumand minimum temperatures, which were used to calculate eachdays GDD. We preferred to use the SWS forecast to calculate theGDD, but used the WN forecast on the rare occassion when theSWS forecast was not available. We could have also used our ownpredicted GDD value, if neither of the forecasted data was available.
7.3 Acquisition of Observed Melon DataWe have assumed that the observed melon data would be providedto us on a frequent basis, preferably biweekly with minimal delay,but that turned out to be very challenging for Vermeulen Farms. Wereceived melon harvest data twice during the entire harvest period;on August 1 and September 7. �is meant that we had to use ourmodels previous predictions of the melon harvest as input for futurepredictions for most forecasts that were issued (except those shortly
KDD-2017, August 2017, Halifax, Nova Scotia, Canada D. Silver et al.
Figure 7: RMSE of the model, used to make 2014 predictions, for each of the 14 days evaluated over all days from 2010, 2011,and 2012.
a�er August 1). �e automated or semi-automated collection ofharvest data is subsequently a major area of improvement for anyfuture projects in this area.
7.4 Communication of Melon HarvestForecasts
Each 14 day accumulated melon harvest forecast was placed in aspreadsheet showing the actual values and an easy to read graphthat included estimated error bars. �is spreadsheet was thenemailed to everyone involved in the project, most importantlyto the owner and operator of VF. Figure 8 shows an example of oneof the melon forecast reports sent out on August 15.
7.5 Evaluation of 2014 PredictionsA�er we had received the �nal results of the melon harvest, wewere able to compare the actual melons harvested to our predictionsof accumulated melons. Figure 9 shows the actual harvest as well asthe predicted harvest (and 95% prediction interval) over the entireharvest season. Figure 10 compares the actual 2014 harvest to theprevious three years used to build the predictive model.
�e team examined the predicted and actual harvest graphs anddiscussed the reasons for the discrepancies observed during thesecond week of August and from September 6 onward with thefarm owner. �e following are our conclusions:
(1) �e �at section of the actual harvest graph from August 7to 18 is because of the late maturity of a di�erent varietyof melon. �is same phenomenon can be observed fromAugust 5 to 17 in the 2010 harvest data, also shown inFigure 10 . �is is not observed in the 2011 or 2012 datathat was used to build the deployed model. During thisperiod Vermeullen Farmswas waiting for melons tomature.If melons had been available, they would have been pickedas predicted by the model. �is suggests that plantingtimes and variations in plant maturity dates are importantinputs to consider in future work.
(2) �e �at line of the actual harvest graph a�er September 7as compared to rise in predicted harvest is most concerning.�e team estimates that 50% of the melons yielded by theplants remained in the �eld at the end of the season. �iswas due to a market saturation that occurred early in theseason. As can be seen in Figure 14, this does not occurin either 2010 or 2012. Based on Figure 11 we concludethat our model continued to predict values close to the trueyield of the melon �eld (140,000) rather than the numberof melons that the market would accommodate (70,000).�is suggest that market factors are import input variablesfor predicting the harvest of a crop versus its yield on theplant.
Another factor in the accuracy of our model’s predictions is theerror introduced by the forecasted weather versus the observedweather. �e models were built properly using observed weather,however it is the forecasted temperature and therefore GDD thatdrives the predictions. Errors in weather forecasts are unavoidableand so we must expect errors in harvest predictions. Figure 15compares the results of predicting the melon harvest using theactual weather, SWSs forecast, and WNs forecast. Unsurprisingly,the actual weather had the lowest error. �e di�erence between theaccumulated melon predictions given the actual versus forecastedweather is insigni�cant, particularly beyond six days.
8 SUMMARY AND RECOMMENDATIONS8.1 Summary�e goal of this project was to develop a model that can predict thenumber of cantaloupe melons available to harvest. �e Acadia teamworkedwith ScotiaWeather Services (SWS), Vermeullen Farms (VF),and the Nova Scotia Community College (NSCC) on the project. �elong-term vision was to develop a cloud-based harvest forecastingservice bene�ting SWS and the agricultural industry as a whole.
Multiple neural network models were developed in an e�ort to�nd the best possible combination of training and test data, network
Multiple Task Learning for Cantaloupe Melon Harvest Forecasting KDD-2017, August 2017, Halifax, Nova Scotia, Canada
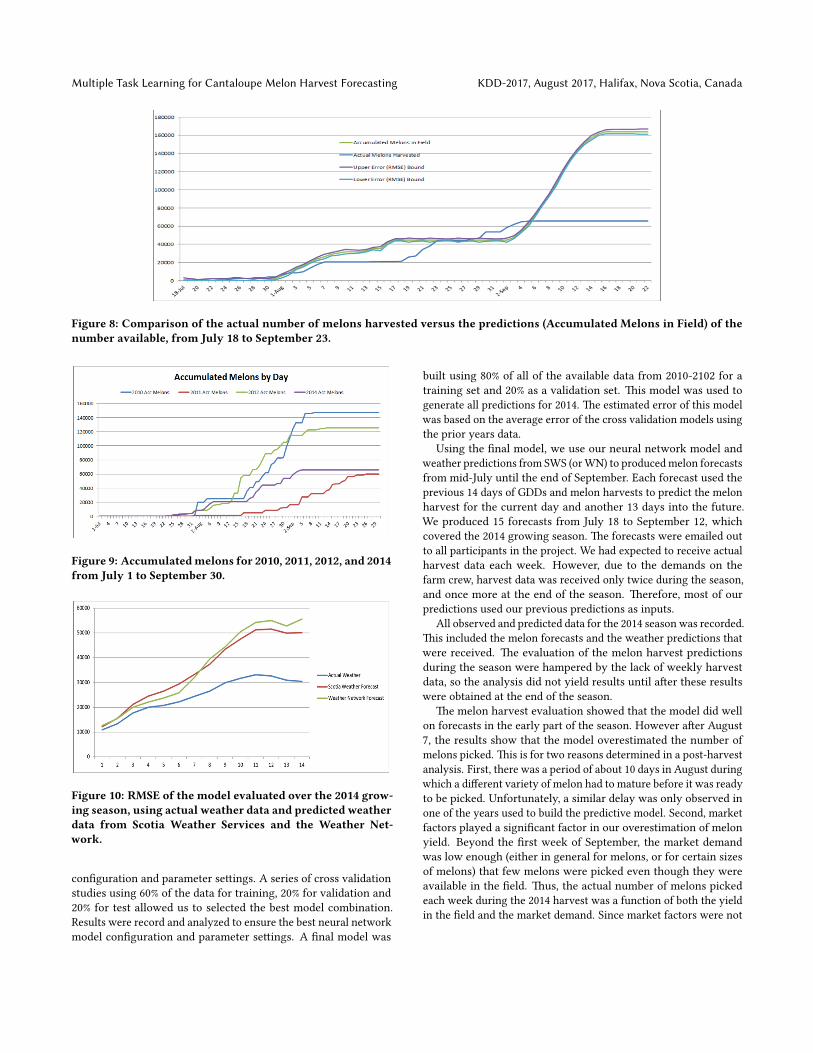
Figure 8: Comparison of the actual number of melons harvested versus the predictions (Accumulated Melons in Field) of thenumber available, from July 18 to September 23.
Figure 9: Accumulatedmelons for 2010, 2011, 2012, and 2014from July 1 to September 30.
Figure 10: RMSE of the model evaluated over the 2014 grow-ing season, using actual weather data and predicted weatherdata from Scotia Weather Services and the Weather Net-work.
con�guration and parameter se�ings. A series of cross validationstudies using 60% of the data for training, 20% for validation and20% for test allowed us to selected the best model combination.Results were record and analyzed to ensure the best neural networkmodel con�guration and parameter se�ings. A �nal model was
built using 80% of all of the available data from 2010-2102 for atraining set and 20% as a validation set. �is model was used togenerate all predictions for 2014. �e estimated error of this modelwas based on the average error of the cross validation models usingthe prior years data.
Using the �nal model, we use our neural network model andweather predictions from SWS (orWN) to producedmelon forecastsfrom mid-July until the end of September. Each forecast used theprevious 14 days of GDDs and melon harvests to predict the melonharvest for the current day and another 13 days into the future.We produced 15 forecasts from July 18 to September 12, whichcovered the 2014 growing season. �e forecasts were emailed outto all participants in the project. We had expected to receive actualharvest data each week. However, due to the demands on thefarm crew, harvest data was received only twice during the season,and once more at the end of the season. �erefore, most of ourpredictions used our previous predictions as inputs.
All observed and predicted data for the 2014 season was recorded.�is included the melon forecasts and the weather predictions thatwere received. �e evaluation of the melon harvest predictionsduring the season were hampered by the lack of weekly harvestdata, so the analysis did not yield results until a�er these resultswere obtained at the end of the season.
�e melon harvest evaluation showed that the model did wellon forecasts in the early part of the season. However a�er August7, the results show that the model overestimated the number ofmelons picked. �is is for two reasons determined in a post-harvestanalysis. First, there was a period of about 10 days in August duringwhich a di�erent variety of melon had to mature before it was readyto be picked. Unfortunately, a similar delay was only observed inone of the years used to build the predictive model. Second, marketfactors played a signi�cant factor in our overestimation of melonyield. Beyond the �rst week of September, the market demandwas low enough (either in general for melons, or for certain sizesof melons) that few melons were picked even though they wereavailable in the �eld. �us, the actual number of melons pickedeach week during the 2014 harvest was a function of both the yieldin the �eld and the market demand. Since market factors were not
KDD-2017, August 2017, Halifax, Nova Scotia, Canada D. Silver et al.
inputs to the model, the model did not take into consideration theira�ect.
We found that our yield forecasts generally became less accurateand had less con�dence as we predicted further days into the future.However, there was an interesting stabilization of accuracy beyond10 days (see Figure 8). �e cause for this is uncertain, but it may berelated to a similar stabilization of the temperature forecast (andtherefore the GDD) that were used as input to our model.
8.2 Recommendations�e following are the recommendations from this project e�ort asdetermined by the project partners:
(1) When harvesting a crop by hand on a busy farm thereare challenges to accurately recording and communicatingyield on a daily basis. Automated methods of capturing theyield at the �eld or grading warehouse are needed. �ereneeds to be a cultural shi� toward valuing automated orsemi-automated methods of data capture.
(2) If market demand is a signi�cant factor then it shouldbe considered in future harvest estimation studies. Onehas to be sure what the training data actually represents- a decline in yield or a decline in produce demand. Onewould have to have access to historical produce marketfactors, in order to develop models that took such factorsinto consideration.
(3) �e use of automated cameras is a tremendous resourcefor capturing agricultural activities and interventions overextended periods of time. �e images can be reviewed forundocumented activity, animal intrusions, severe weatherimpacts, and vandalism.
(4) Having a basic weather station or weather logged in each�eld that can accurate record air and soil temperature(min/max over each day), humidity, precipitation, and so-lar radiation are important. Air temperature is the mostimportant factor.
(5) A study is needed to determine the true market for harvestpredictions and the dollar value of this information. VFvalued the information and would consider paying for itin the future given improvements.
(6) �e time of delivery of harvest yield predictions, its contentand its format is very important to the success of the fore-cast information being used by the recipient. VF reviewedand used our predictions only once or twice during theseason. �is had mostly to do with the time of its arrival.
(7) At the outset we thought that precipitation and humiditywould have played a signi�cant role in the harvest forecast.�ese variables were dropped based on them making nosigni�cant contribution to accumulated melon predictionsfor the next day. We suspect we should have looked morecarefully at their contribution to predictions for days 7-14into the future. �is should be considered in future studies.
Acknowledgement: We would like to acknowlege funding pro-vided by the National Research Council through their IRAP Programand by NSERC through their Engage Grant Program.
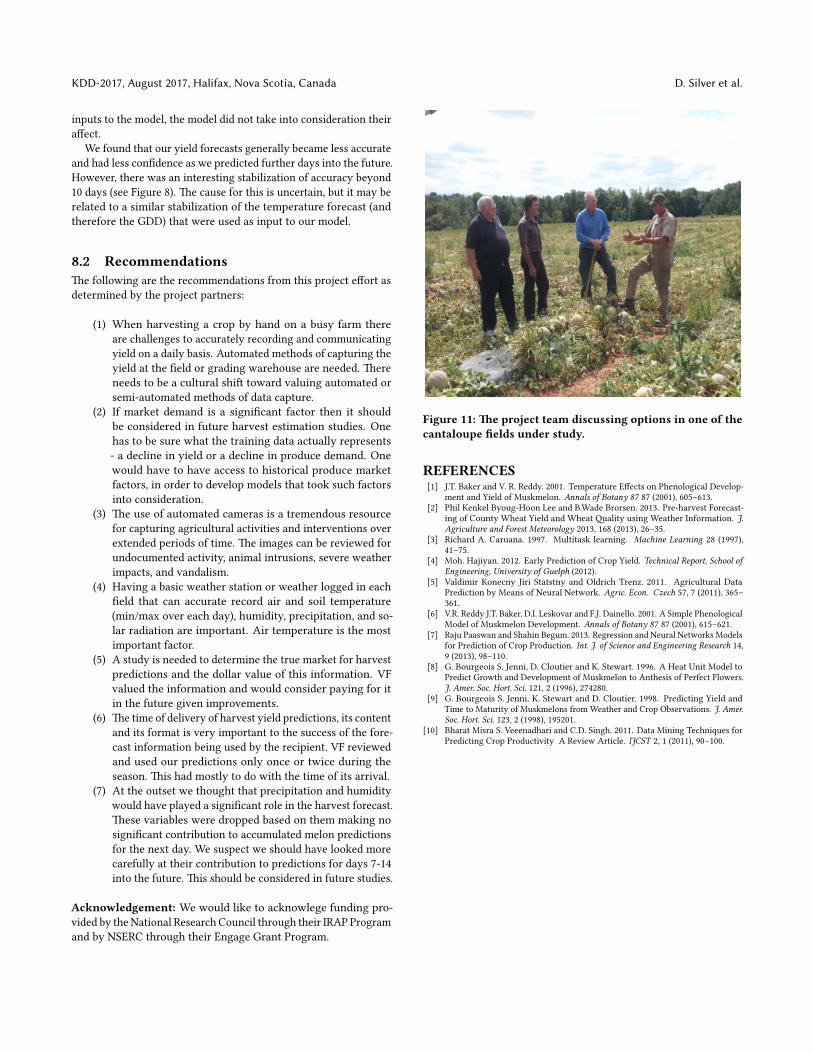
Figure 11: �e project team discussing options in one of thecantaloupe �elds under study.
REFERENCES[1] J.T. Baker and V. R. Reddy. 2001. Temperature E�ects on Phenological Develop-
ment and Yield of Muskmelon. Annals of Botany 87 87 (2001), 605–613.[2] Phil Kenkel Byoug-Hoon Lee and B.Wade Brorsen. 2013. Pre-harvest Forecast-
ing of County Wheat Yield and Wheat �ality using Weather Information. J.Agriculture and Forest Meteorology 2013, 168 (2013), 26–35.
[3] Richard A. Caruana. 1997. Multitask learning. Machine Learning 28 (1997),41–75.
[4] Moh. Hajiyan. 2012. Early Prediction of Crop Yield. Technical Report, School ofEngineering, University of Guelph (2012).
[5] Valdimir Konecny Jiri Statstny and Oldrich Trenz. 2011. Agricultural DataPrediction by Means of Neural Network. Agric. Econ. Czech 57, 7 (2011), 365–361.
[6] V.R. Reddy J.T. Baker, D.I. Leskovar and F.J. Dainello. 2001. A Simple PhenologicalModel of Muskmelon Development. Annals of Botany 87 87 (2001), 615–621.
[7] Raju Paaswan and Shahin Begum. 2013. Regression and Neural Networks Modelsfor Prediction of Crop Production. Int. J. of Science and Engineering Research 14,9 (2013), 98–110.
[8] G. Bourgeois S. Jenni, D. Cloutier and K. Stewart. 1996. A Heat Unit Model toPredict Growth and Development of Muskmelon to Anthesis of Perfect Flowers.J. Amer. Soc. Hort. Sci. 121, 2 (1996), 274280.
[9] G. Bourgeois S. Jenni, K. Stewart and D. Cloutier. 1998. Predicting Yield andTime to Maturity of Muskmelons from Weather and Crop Observations. J. Amer.Soc. Hort. Sci. 123, 2 (1998), 195201.
[10] Bharat Misra S. Veeenadhari and C.D. Singh. 2011. Data Mining Techniques forPredicting Crop Productivity A Review Article. IJCST 2, 1 (2011), 90–100.