Embed Size (px)
Citation preview
Multifocus microscopy with precise color multi-phase diffractive optics applied in functional
neuronal imaging
Sara Abrahamsson,1,2,* Rob Ilic,2 Jan Wisniewski,3 Brian Mehl,3 Liya Yu,2 Lei Chen,2 Marcelo Davanco,2 Laura Oudjedi,4 Jean-Bernard Fiche,4 Bassam Hajj,3,7 Xin Jin,1
Joan Pulupa,5 Christine Cho,1 Mustafa Mir,3,6 Mohamed El Beheiry,3,7 Xavier Darzacq,3,6 Marcelo Nollmann,4 Maxime Dahan,3,7 Carl Wu,3 Timothée Lionnet,3
J. Alexander Liddle,2 and Cornelia I. Bargmann1 1HHMI and Lulu and Anthony Wang Laboratory of Neural Circuits and Behavior, The Rockefeller University, New
York, NY 10065, USA 2Center for Nanoscale Science and Technology, National Institute of Standards and Technology, Gaithersburg, MD
20899, USA 3Transcription Imaging Consortium, HHMI Janelia Research Campus, Ashburn, VA 20147, USA
4Centre de Biochimie Structurale, CNRS UMR5048, INSERM U1054, Université de Montpellier, 29 rue de Navacelles, 34090 Montpellier, France
5Laboratory of Cellular Biophysics, The Rockefeller University, New York, NY 10065, USA 6University of California, Berkeley, CA 94720, USA
7Laboratoire Physico Chimie, Institut Curie, CNRS UMR 168, Université Pierre et Marie Curie-Paris 6, 11 rue Pierre et Marie Curie, 75005 Paris France
Abstract: Multifocus microscopy (MFM) allows high-resolution instantaneous three-dimensional (3D) imaging and has been applied to study biological specimens ranging from single molecules inside cells nuclei to entire embryos. We here describe pattern designs and nanofabrication methods for diffractive optics that optimize the light-efficiency of the central optical component of MFM: the diffractive multifocus grating (MFG). We also implement a “precise color” MFM layout with MFGs tailored to individual fluorophores in separate optical arms. The reported advancements enable faster and brighter volumetric time-lapse imaging of biological samples. In live microscopy applications, photon budget is a critical parameter and light-efficiency must be optimized to obtain the fastest possible frame rate while minimizing photodamage. We provide comprehensive descriptions and code for designing diffractive optical devices, and a detailed methods description for nanofabrication of devices. Theoretical efficiencies of reported designs is ≈90% and we have obtained efficiencies of > 80% in MFGs of our own manufacture. We demonstrate the performance of a multi-phase MFG in 3D functional neuronal imaging in living C. elegans.
©2016 Optical Society of America
OCIS codes: (180.6900) Three-dimensional microscopy; (260.5430) Polarization; (110.4190) Multiple imaging; (050.1970) Diffractive optics; (180.2520) Fluorescence microscopy.
References and links
1. L. Schermelleh, R. Heintzmann, and H. Leonhardt, “A guide to super-resolution fluorescence microscopy,” J. Cell Biol. 190(2), 165–175 (2010).
2. S. Abrahamsson, J. Chen, B. Hajj, S. Stallinga, A. Y. Katsov, J. Wisniewski, G. Mizuguchi, P. Soule, F. Mueller, C. Dugast Darzacq, X. Darzacq, C. Wu, C. I. Bargmann, D. A. Agard, M. Dahan, and M. G. Gustafsson, “Fast multicolor 3D imaging using aberration-corrected multifocus microscopy,” Nat. Methods 10(1), 60–63 (2012).
3. P. M. Blanchard and A. H. Greenaway, “Simultaneous multiplane imaging with a distorted diffraction grating,” Appl. Opt. 38(32), 6692–6699 (1999).
#253387 Received 20 Nov 2015; revised 10 Jan 2016; accepted 3 Feb 2016; published 16 Feb 2016 (C) 2016 OSA 1 Mar 2016 | Vol. 7, No. 3 | DOI:10.1364/BOE.7.000855 | BIOMEDICAL OPTICS EXPRESS 855

4. J. Wisniewski, B. Hajj, J. Chen, G. Mizuguchi, H. Xiao, D. Wei, M. Dahan, and C. Wu, “Imaging the fate ofhistone Cse4 reveals de novo replacement in S phase and subsequent stable residence at centromeres,” eLife 3, e02203 (2014).
5. C. S. Smith, S. Preibisch, A. Joseph, S. Abrahamsson, B. Rieger, E. Myers, R. H. Singer, and D. Grunwald,“Nuclear accessibility of β-actin mRNA is measured by 3D single-molecule real-time tracking,” J. Cell Biol.209(4), 609–619 (2015).
6. B. Hajj, J. Wisniewski, M. El Beheiry, J. Chen, A. Revyakin, C. Wu, and M. Dahan, “Whole-cell, multicolorsuperresolution imaging using volumetric multifocus microscopy,” Proc. Natl. Acad. Sci. U.S.A. 111(49),17480–17485 (2014).
7. S. Abrahamsson, M. McQuilken, S. B. Mehta, A. Verma, J. Larsch, R. Ilic, R. Heintzmann, C. I. Bargmann, A.S. Gladfelter, and R. Oldenbourg, “MultiFocus Polarization Microscope (MF-PolScope) for 3D polarizationimaging of up to 25 focal planes simultaneously,” Opt. Express 23(6), 7734–7754 (2015).
8. M. Broxton, L. Grosenick, S. Yang, N. Cohen, A. Andalman, K. Deisseroth, and M. Levoy, “Wave optics theoryand 3-D deconvolution for the light field microscope,” Opt. Express 21(21), 25418–25439 (2013).
9. R. Prevedel, Y.-G. Yoon, M. Hoffmann, N. Pak, G. Wetzstein, S. Kato, T. Schrödel, R. Raskar, M. Zimmer, E.S. Boyden, and A. Vaziri, “Simultaneous whole-animal 3D imaging of neuronal activity using light-fieldmicroscopy,” Nat. Methods 11(7), 727–730 (2014).
10. P. C. Montgomery and A. Leong-Hoi, “Emerging optical nanoscopy techniques,” Nanotechnol. Sci. Appl. 8, 31–44 (2015).
11. J. N. Mait, “Understanding diffractive optic design in the scalar domain,” J. Opt. Soc. Am. A 12(10), 2145–2158(1995).
12. Patent Application #20130176622, Abrahamsson and Gustafsson, “Multi-Dimensional Imaging Using Multi-Focus Microscopy” (2013) .
13. M. Born and E. Wolf, “Diffraction gratings,” in Principles of Optics, 7th (expanded) edition, (Cambridge, 2002),pp. 446–461.
14. J. W. Goodman, “Diffractive Optical Elements,” in Introduction to Fourier Optics, Third edition, (Roberts &Co), pp. 212–218.
15. S. Abrahamsson, “Design your own diffractive Fourier optics in MATLAB,” figshare (2015) [retrieved 18November 2015], Code File 1: http://dx.doi.org/10.6084/m9.figshare.2005857 Code File 2:http://dx.doi.org/10.6084/m9.figshare.2005860 Code File 3: http://dx.doi.org/10.6084/m9.figshare.2005863 CodeFile 4: http://dx.doi.org/10.6084/m9.figshare.2005866
16. S. Kato, H. S. Kaplan, T. Schrödel, S. Skora, T. H. Lindsay, E. Yemini, S. Lockery, and M. Zimmer, “Globalbrain dynamics embed the motor command sequence of Caenorhabditis elegans,” Cell 163(3), 656–669 (2015).
17. N. Chronis, M. Zimmer, and C. I. Bargmann, “Microfluidics for in vivo imaging of neuronal and behavioralactivity in Caenorhabditis elegans,” Nat. Methods 4(9), 727–731 (2007).
18. J. Akerboom, T. W. Chen, T. J. Wardill, L. Tian, J. S. Marvin, S. Mutlu, N. C. Calderón, F. Esposti, B. G.Borghuis, X. R. Sun, A. Gordus, M. B. Orger, R. Portugues, F. Engert, J. J. Macklin, A. Filosa, A. Aggarwal, R.A. Kerr, R. Takagi, S. Kracun, E. Shigetomi, B. S. Khakh, H. Baier, L. Lagnado, S. S. Wang, C. I. Bargmann, B.E. Kimmel, V. Jayaraman, K. Svoboda, D. S. Kim, E. R. Schreiter, and L. L. Looger, “Optimization of a GCaMPcalcium indicator for neural activity imaging,” J. Neurosci. 32(40), 13819–13840 (2012).
19. M. Fujiwara, T. Ishihara, and I. Katsura, “A novel WD40 protein, CHE-2, acts cell-autonomously in theformation of C. elegans sensory cilia,” Development 126(21), 4839–4848 (1999).
20. J. Larsch, S. W. Flavell, Q. Liu, A. Gordus, D. R. Albrecht, and C. I. Bargmann, “A circuit for gradient climbingin C. elegans chemotaxis,” Cell Reports 12(11), 1748–1760 (2015).
21. J. Schindelin, I. Arganda-Carreras, E. Frise, V. Kaynig, M. Longair, T. Pietzsch, S. Preibisch, C. Rueden, S.Saalfeld, B. Schmid, J. Y. Tinevez, D. J. White, V. Hartenstein, K. Eliceiri, P. Tomancak, and A. Cardona, “Fiji:an open-source platform for biological-image analysis,” Nat. Methods 9(7), 676–682 (2012).
22. A. Edelstein, N. Amodaj, K. Hoover, R. Vale, and N. Stuurman, “Computer control of microscopes usingµManager,” Curr. Protoc. Mol. Biol. 14, 20 (2010), www.micro-manager.org.
23. S. Abrahamsson, “MFM functional neuronal imaging data set of C. elegans,” figshare (2016) [retrieved Jan 10 2016], Dataset 1: http://dx.doi.org/10.6084/m9.figshare.2062047
24. http://genisys-gmbh.com
1. Introduction
One of the main challenges in modern biological research is three-dimensional (3D) imaging of living specimens. Classical microscopy methods – such as confocal, two-photon and wide-field microscopy – all record 3D information sequentially using optical or mechanical scanning in the axial (z) direction. In wide-field microscopy the 3D image volume is composed of multiple sequentially recorded 2D image planes referred to as a focal series or focal stack. There is an intrinsic conflict between spatial and temporal resolution and the acquisition speed of scanning 3D imaging methods can be insufficient for live imaging of very fast events and of extended sample volumes. 3D imaging is also fundamentally more
#253387 Received 20 Nov 2015; revised 10 Jan 2016; accepted 3 Feb 2016; published 16 Feb 2016 (C) 2016 OSA 1 Mar 2016 | Vol. 7, No. 3 | DOI:10.1364/BOE.7.000855 | BIOMEDICAL OPTICS EXPRESS 856
demanding of the photon budget compared to two-dimensional (2D) imaging. Enough photons to obtain acceptable signal to noise ratio (SNR) must be recorded to form an image of each 2D focal plane in the 3D focal series. Photon budget thus scales with the number of images in the focal stack, but can be somewhat improved by 3D deconvolution [1]. 3D deconvolution can also increase contrast in the data, which is desirable since MFM is a wide-field imaging technique and as such does not have optical sectioning capability. Increasing the excitation illumination to obtain higher signal may induce photobleaching of fluorophores and photodamage in the specimen. Light efficiency in 3D imaging systems is thus crucial both to improve biocompatibility and to allow fast imaging.
We recently reported the multifocus microscope (MFM), an instantaneous 3D imaging system based on diffractive Fourier optics. MFM eliminates the need for scanning in z by forming an entire wide-field focal series of 2D images in a single camera shot. Light from the specimen is multiplexed by a specially designed diffractive Fourier optic – the multifocus grating (MFG) – and each beam is focus shifted so that an instant focal series is obtained, laid out in an array of 2D images of different focal planes on the camera. By using an aberration-free refocusing function based on the Abbe sine condition, deep refocusing (tens of microns) can be obtained without the introduction of depth-induced aberrations as long as the refractive index is properly matched [2]. Another central component of MFM is the chromatic correction module that corrects for the strong chromatic dispersion introduced by the MFG. This dispersion would otherwise deteriorate image quality even across the relatively narrow wavelength bandwidth of a single fluorophore. Earlier multi-plane imaging approaches did not combine aberration-free refocusing with chromatic correction and therefore had limited resolution [3]. MFM has been applied by biological research groups to image the 3D dynamics of centrosomes, transcriptional complexes and single mRNA molecules diffusing through the nucleus [4–6] as well as cell division in the developing C. elegans embryo [7]. Implementations with nine and 25 focal planes respectively have been used for imaging different specimens. Since the optical transfer function support of the microscope objective is maintained, single-snapshot 3D images are recorded at the full native resolution of the microscope used. MFM is therefore also suitable for super-resolution microscopy, and has been combined with photo-activated localization microscopy (PALM) and stochastic optical reconstruction microscopy (STORM) to study transcription [6] and another specialized imaging method, fluorescence polarization anisotropy, to study protein assembly dynamics in yeast [7]. Another noteworthy instant 3D imaging method is light-field microscopy (LFM). LFM however inherently sacrifices some of the resolution of the native optical system, and image reconstruction of microscopy data is not trivial [8,9]. In MFM no special data reconstruction is necessary. Well-behaved wide-field images are formed directly and data can be assembled into a 3D focal stack (Fig. 1) using existing free open-source or commercial software. Interesting developments in 3D imaging are also ongoing in the field of holography [10].
In previously reported nine focal-plane MFM systems, the bottleneck for light efficiency was the MFG, which was implemented as a binary phase optic [2]. We here explore the implementation of two alternative MFG designs: a multi-phase MFG for nine focal planes with improved light efficiency, and a new binary phase MFG for seven focal planes with increased signal strength in each focal plane for imaging slightly smaller specimens. As has been shown in theory [11] an evenly distributed 3 × 3 fan-out array of diffractive orders can be generated with a maximum light-collection efficiency of 67% by a binary phase only diffraction grating, while efficiencies of ≈90% can be obtained with multi-phase gratings. Previous MFM implementations used binary gratings fabricated at their theoretical maximum efficiency [2]. We here further improve the sensitivity of MFM by fabricating MFGs with eight phase levels, using a grating function design previously described in theory in a patent application by Abrahamsson and Gustafsson [12]. These devices, theoretically capable of obtaining photon count efficiencies up to ≈89%, allow even faster and gentler imaging of
#253387 Received 20 Nov 2015; revised 10 Jan 2016; accepted 3 Feb 2016; published 16 Feb 2016 (C) 2016 OSA 1 Mar 2016 | Vol. 7, No. 3 | DOI:10.1364/BOE.7.000855 | BIOMEDICAL OPTICS EXPRESS 857

small, sensitive or dim fluorescently labeled specimens. We also report the design and implementation of a simple binary MFG design with high photon count efficiency (≈79%) for simultaneously imaging seven focal planes. This layout is intended for brighter imaging in thinner samples, such as cultured mammalian cell nuclei and yeast. By distributing light between fewer focal planes, higher signal is obtained in each plane.
While commercially mass-producing simple plastic diffraction gratings can be cheap, applications such as live fluorescence microscopy demand highly efficient custom devices, preferably made of glass, that are more difficult and expensive to fabricate. We here report the design and manufacture of diffractive optical devices with high light efficiency and optical performance. The described fabrication processes were used with some modifications (adapted to the tools at hand) at two different nanofabrication user facilities: CNF (Cornell University, Ithaca, NY) and CNST (National Institute for Standards and Technology, NIST, Gaithersburg, MD).
For a demonstration of the new devices, we apply the multi-phase MFG in a functional neuronal imaging experiment in C. elegans. Functional neuronal imaging using calcium indicators directly visualizes neuronal activity, and MFM makes it possible to instantaneously image activity in entire 3D neuronal networks. We also describe a “precise color” MFM layout for optimized multi-color imaging of multiple fluorophores simultaneously.
2. Improved sensitivity MFG designs for faster and gentler 3D imaging
MFM can be implemented as a module containing a train of optical components that is appended to one of the camera ports of a high-resolution wide-field microscope. Light from the specimen is intercepted before it reaches the final image plane by a specially designed diffractive optical element: the MFG (Fig. 1). The MFG splits the light from the sample into multiple beams, and refocuses each of these beams so that a focal series of images of different focal planes – evenly spaced throughout the sample – is formed simultaneously on the camera (Fig. 1(a)). Each time-point of an MFM movie is thus an instantaneously formed 3D image of the specimen (Fig. 1(b)-1(c)). No scanning is required to capture the 3D data, and there is no mechanical movement or temporal ambiguity.
#253387 Received 20 Nov 2015; revised 10 Jan 2016; accepted 3 Feb 2016; published 16 Feb 2016 (C) 2016 OSA 1 Mar 2016 | Vol. 7, No. 3 | DOI:10.1364/BOE.7.000855 | BIOMEDICAL OPTICS EXPRESS 858

Fig. 1. “Precise color” MFM. (a) Layout of MFM system with two arms, separated by a dichroic beam-splitting mirror. Each arm contains an MFG tailored to the wavelength spectrum of the fluorophore imaged to maximize signal strength and obtain equal focal shift in both colors simultaneously. The Chromatic Correction Module (CCM) consists of a multi-panel blazed grating that is specially designed to compensate for the dispersion of the MFG, and a multi-faceted prism to direct the images to their proper positions on the camera. (b) Layout of MFM data as acquired on the camera. (c) MFM data layout from b cropped out and arranged as a 3D volume. (d) Point spread functions (PSFs) of 100 ± 7.2 nm fluorescent beads emitting across a wide wavelength spectrum recorded in a dual-arm MFM appended to a commercial microscope with a 100 × NA = 1.45 oil objective (Nikon). Beads were imaged simultaneously in two colors, chosen to match the dyes and fluorescent proteins used in our transcription imaging experiments with orange 590/40 nm and red 676/30 nm emission filters in the respective arms. Pixel size and z-scan step was ≈81 nm to obtain isotropic voxels. Above: PSF of a single fluorescent bead simultaneously measured on the two cameras, with orange and red emission filters in each optical arm respectively. Each z-step was as an average of 4 images before proceeding to the next z-step. Below: Separation distance between each focal plane was measured as an average of 10 beads for each color. Standard deviation of each point is ≈20 nm. Linear regression determined a slope of 407 nm for both orange and red channels with R > 0.99. While the z spacing is the same in the two arms, the focus points are here slightly shifted (≈100 nm) relative to each other thus the points are not overlaid. Scale bar in d represents 1 μm.
2.1 “Precise color” MFM layout
Chromatic correction is a key component of any diffractive imaging system that is used to image wavelength bands wider than a few nanometers. Even the light from a single fluorophore imaged in a microscope with a typical ≈20 nm to 50 nm wide wavelength emission spectrum will be dispersed and blurred, destroying resolution and contrast in the image. We previously reported a highly effective chromatic correction module, consisting of a combination of one diffractive and one refractive element, that provides precise correction of the chromatic dispersion across the visible spectrum. The same chromatic correction module is used in this work. Since the zeroth order beam is not diffracted in the MFG, it needs no
#253387 Received 20 Nov 2015; revised 10 Jan 2016; accepted 3 Feb 2016; published 16 Feb 2016 (C) 2016 OSA 1 Mar 2016 | Vol. 7, No. 3 | DOI:10.1364/BOE.7.000855 | BIOMEDICAL OPTICS EXPRESS 859

dispersion correction and travels through a blank panel in the chromatic correction module. Diffracted orders experience chromatic dispersion in the MFG and in the chromatic correction module encounter a blazed grating that corrects their dispersion by reversing it. However, the blazed grating also introduces a light-intensity loss of ≈5%. To compensate for this effect and obtain uniform intensity distribution between focal planes in the final image, the zeroth diffraction order intensity in the MFG grating function is slightly suppressed (Figs. 2 and 3).
In the previously implemented MFM layout, a single MFG (designed for 515 nm green light) was used for imaging different color fluorophores in a simple layout where a large custom-made dichroic beam-splitter was placed after the MFG and chromatic correction module to split the different wavelengths between multiple cameras [2]. This approach produces images with high resolution and can be used for many multi-color imaging experiments; however there will be small differences in performance between the color channels arising in the MFG. Both the magnitude of the focus shift and the signal intensity distribution into the multiple focal planes is wavelength-dependent. A perfect overlay in 3D space of two different color channels will therefore not be obtained, but slightly different focal planes will be imaged in each channel. A difference in the light intensity distribution between diffractive orders (focal planes in the multifocus image) also arises as a function of wavelength, destroying the even distribution of signal planes. The chromatic correction module cannot compensate for these differences. In our original two-color MFM layout it was therefore not possible to precisely combine multiple color-channels, but data had to be calibrated and corrected computationally. For experiments that require optimal sensitivity and high z-resolution precision in multiple colors simultaneously, we have here implemented a “precise color” layout that ensures nearly identical optical performance in each color simultaneously. By splitting the color channels before the multifocus optical components, two (or more) separate color arms can contain MFGs tailored to different fluorophore wavelengths (Fig. 1). The chromatic correction module is still used in each arm to maintain resolution. In the precise color MFM layout, light-intensity distribution between focal planes is uniform (within a few percent) and images have the same focus shift (within a few nanometers) in all colors simultaneously (Fig. 1(d)). In addition to improving imaging accuracy, this simplifies data reconstruction – the different color multifocus images can be directly assembled into a multicolored 3D focal stack.
2.2 Multi-phase MFG for nine focal planes at 89% efficiency
Diffractive Fourier optics is a powerful method for modifying the output of an imaging or illumination system. Light can be guided into one or several diffracted beams, whose wavefronts can be precisely controlled by the introduction of a geometrical distortion function to an otherwise periodic grating function (grating pattern) of the optic. Resolution and sensitivity (photon count efficiency) are paramount in optical devices. In MFM, optimal resolution is maintained by aberration-free refocusing [2]. For optimal sensitivity, a good MFG must direct the maximum amount of light into the diffractive orders selected for imaging (total diffraction efficiency), and distribute the signal intensity optimally between these selected orders (uniform signal intensity distribution).
Previous implementations of nine-plane MFM used binary MFGs with a limited theoretical maximum transmission efficiency of ≈67%. Here, we describe the design and fabrication of a multi-phase MFG with ≈89% theoretical maximum efficiency. Diffraction by a phase-only grating can be modeled numerically using the Fast Fourier Transform (FFT) [13,14]. The previously described “pixelflipper” algorithm [2] generates well-behaved grating functions with efficiencies consistent with theoretical optima [11] as we show in Code File 1, [15]. Patterns consisting of layers of smooth and continuous geometrical shapes (Fig. 2(a)-2(d)) are suitable for manufacturing using photolithography masks and successive rounds of etching. The 32-phase pattern in Fig. 2(a) can in theory obtain up to ≈94% efficiency. In practice, while theoretical diffraction efficiency incrementally increases with the number of
#253387 Received 20 Nov 2015; revised 10 Jan 2016; accepted 3 Feb 2016; published 16 Feb 2016 (C) 2016 OSA 1 Mar 2016 | Vol. 7, No. 3 | DOI:10.1364/BOE.7.000855 | BIOMEDICAL OPTICS EXPRESS 860

levels (Fig. 2(a)-2(c)), fabrication becomes more challenging. Losses and scattering at edges due to device imperfections eventually decrease actual performance. We chose to compromise at a grating function with eight phase levels, with a theoretical maximum efficiency of ≈89% (Fig. 2(c)-2(f)). When passing through the grating, light from the microscope specimen is distributed evenly between the two (positive and negative) first 2D diffractive orders, while the intensity in the zeroth order is slightly suppressed to compensate for unevenness in transmission in the chromatic correction module.
Fig. 2. Optimal light distribution for nine-plane MFM is obtained by multiplexing an incoming light beam evenly into 3 × 3 diffractive orders with minimal light loss. Grating functions with a larger number of phase steps have better theoretical performance, but each step level makes fabrication of devices more challenging. (a) 32-phase grating function with ≈94% theoretical light efficiency. (b) 16-phase grating function with ≈93% theoretical light efficiency. (c) Eight-phase grating function with ≈89% theoretical light efficiency. (d) 3D perspective plot of the pattern in c to show the steps of the optic (not to scale). (e) Distribution of light into the nine central orders that will form the multifocus image. (f) Bar diagram showing the theoretical relative light intensity distribution of the 3 × 3 center orders in e produced by the device pattern in c and d, expressed in percent of the light intensity of the incoming beam. The zeroth order (i.e. the central image tile, i.e. the nominal focal plane) is intentionally suppressed to compensate for losses in the non-zero orders in the chromatic correction element. Code to generate MFG grating functions like these is included in Code File 1 [15].
2.3 Seven-plane binary MFG with further improved signal intensity in each plane
We recently reported a 25-plane MFM for imaging larger specimens, intended for use in applications such as embryology and functional neuronal imaging [7]. For collaborators studying transcription in thinner samples such as yeast or mammalian cells, we have here implemented an MFM that has only seven focal planes (Fig. 3). When studying the diffusion of single molecules in the nucleus of cultured cells, imaging a smaller number of focal planes with higher signal strength in each plane generates faster and brighter 3D movies at lower excitation light dose.
Binary phase grating functions can reach higher diffraction efficiencies than the ≈67% obtainable in a 3 × 3 system if the light is distributed into a different set of diffractive orders. Here we have implemented a seven-plane MFG using a simple binary grating function in the shape of an oval (Fig. 3) that obtains light efficiency of ≈79%. For comparison, signal intensity in each focal plane of the seven-plane MFM is ≈34% higher than the binary nine-plane MFM we originally reported [2]. Since the light is distributed between fewer planes, signal strength in each focal plane is increased (≈14% higher) even compared to the 3 × 3
#253387 Received 20 Nov 2015; revised 10 Jan 2016; accepted 3 Feb 2016; published 16 Feb 2016 (C) 2016 OSA 1 Mar 2016 | Vol. 7, No. 3 | DOI:10.1364/BOE.7.000855 | BIOMEDICAL OPTICS EXPRESS 861

multi-phase design of ≈89% total efficiency (Fig. 2). In summary, for applications where the number of focal planes can be reduced to seven, brighter images are obtained by omitting the first and last plane of the 2D focal stack that constitutes the 3D image.
Fig. 3. (a) Grating function of binary MFG for 7-plane MFM with increased image brightness. (b) Diffraction of the pattern in a generates seven diffraction orders with ≈79% total efficiency. Compared to the nine-plane MFM, the first and last image tiles are blank. (c) Signal strength response of each diffractive order in b plotted in a bar diagram. As in the nine-plane system, the zeroth order (central image tile) is intentionally suppressed to compensate for uneven losses in the chromatic correction element. (d) Two 100 nm fluorescent beads mounted in agarose, imaged in the 7-plane MFM with a 150 × glycerin immersion NA = 1.35 objective (Zeiss). Beads are in focus in the nominal focal plane and the gradually decreasing out-of-focus signal can be seen in the other six focal planes. The z-step between successive focal planes in the multifocus image is ≈300 nm. (e) Projection of a focal stack of a single bead shows the diffraction-limited PSF of the MFM system in each image tile. Scale bars in d and e represent 2 μm.
3. Functional imaging of C. elegans sensory neurons in 3D
Functional neuronal imaging allows direct visualization of activity in neural circuits in living animals. C. elegans is used as a model organism in neurobiology due to its powerful genetics and well-studied behaviors such as chemotaxis. It is also an excellent microscopy specimen due to its small size and optical transparency. Though spinning disk confocal microscopy has recently been demonstrated in functional neuronal imaging [16], one of the main challenges in the functional imaging field is recording data with sufficient acquisition speed in 3D. It is highly desirable to image entire neuronal networks simultaneously in order to visualize interactions between multiple individual neurons. The capability of MFM is here demonstrated in capturing sensory neuron responses during olfactory stimulation in 3D in living adult C. elegans. Data is shown in Fig. 4, Visualization 1 and Dataset 1, [23].
C. elegans specimens were live mounted in a microfluidic device that permits controlled olfactory stimulation of the animal by liquids flowed past its nose. In the device, the animal is immersed in buffer and imaged through a cover slip. Approximately two dozen sensory neurons were labeled with a genetically-encoded, nuclear-localized calcium indicator (GCaMP6s) whose fluorescence increases when a neuron is active [18], expressed as a transgene from a 0.65 kilobase promoter sequence from the che-2 gene [19]. For further material on GCaMP imaging in C. elegans we suggest Larsch et al. [20]. Each nucleus is ≈3 μm in diameter, and the bilaterally symmetrical left and right clusters of sensory neurons
#253387 Received 20 Nov 2015; revised 10 Jan 2016; accepted 3 Feb 2016; published 16 Feb 2016 (C) 2016 OSA 1 Mar 2016 | Vol. 7, No. 3 | DOI:10.1364/BOE.7.000855 | BIOMEDICAL OPTICS EXPRESS 862
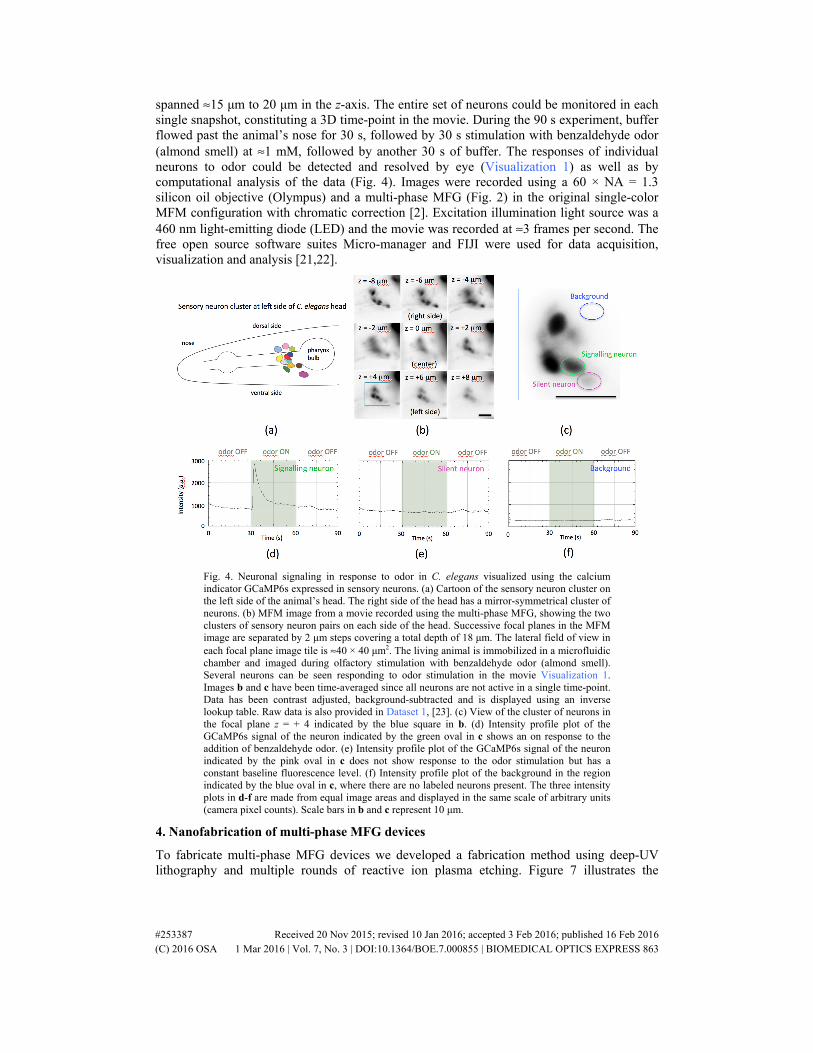
spanned ≈15 μm to 20 μm in the z-axis. The entire set of neurons could be monitored in each single snapshot, constituting a 3D time-point in the movie. During the 90 s experiment, buffer flowed past the animal’s nose for 30 s, followed by 30 s stimulation with benzaldehyde odor (almond smell) at ≈1 mM, followed by another 30 s of buffer. The responses of individual neurons to odor could be detected and resolved by eye (Visualization 1) as well as by computational analysis of the data (Fig. 4). Images were recorded using a 60 × NA = 1.3 silicon oil objective (Olympus) and a multi-phase MFG (Fig. 2) in the original single-color MFM configuration with chromatic correction [2]. Excitation illumination light source was a 460 nm light-emitting diode (LED) and the movie was recorded at ≈3 frames per second. The free open source software suites Micro-manager and FIJI were used for data acquisition, visualization and analysis [21,22].
Fig. 4. Neuronal signaling in response to odor in C. elegans visualized using the calcium indicator GCaMP6s expressed in sensory neurons. (a) Cartoon of the sensory neuron cluster on the left side of the animal’s head. The right side of the head has a mirror-symmetrical cluster of neurons. (b) MFM image from a movie recorded using the multi-phase MFG, showing the two clusters of sensory neuron pairs on each side of the head. Successive focal planes in the MFM image are separated by 2 μm steps covering a total depth of 18 μm. The lateral field of view in each focal plane image tile is ≈40 × 40 μm2. The living animal is immobilized in a microfluidic chamber and imaged during olfactory stimulation with benzaldehyde odor (almond smell). Several neurons can be seen responding to odor stimulation in the movie Visualization 1. Images b and c have been time-averaged since all neurons are not active in a single time-point. Data has been contrast adjusted, background-subtracted and is displayed using an inverse lookup table. Raw data is also provided in Dataset 1, [23]. (c) View of the cluster of neurons in the focal plane z = + 4 indicated by the blue square in b. (d) Intensity profile plot of the GCaMP6s signal of the neuron indicated by the green oval in c shows an on response to the addition of benzaldehyde odor. (e) Intensity profile plot of the GCaMP6s signal of the neuron indicated by the pink oval in c does not show response to the odor stimulation but has a constant baseline fluorescence level. (f) Intensity profile plot of the background in the region indicated by the blue oval in c, where there are no labeled neurons present. The three intensity plots in d-f are made from equal image areas and displayed in the same scale of arbitrary units (camera pixel counts). Scale bars in b and c represent 10 μm.
4. Nanofabrication of multi-phase MFG devices
To fabricate multi-phase MFG devices we developed a fabrication method using deep-UV lithography and multiple rounds of reactive ion plasma etching. Figure 7 illustrates the
#253387 Received 20 Nov 2015; revised 10 Jan 2016; accepted 3 Feb 2016; published 16 Feb 2016 (C) 2016 OSA 1 Mar 2016 | Vol. 7, No. 3 | DOI:10.1364/BOE.7.000855 | BIOMEDICAL OPTICS EXPRESS 863

workflow of the fabrication process. Detailed design and fabrication strategies are described in the following sub-sections.
4.1 Fabrication methods for producing phase-only diffraction gratings
Diffractive optics can be fabricated using different methods, such as direct laser writing, electron beam lithography or deep-UV lithography. Proper device design involves choosing an appropriate fabrication method and taking its limitations into consideration. Binary devices, such as the seven-plane MFG in Fig. 3, can be made using direct laser writing followed by wet or dry etching directly on a chrome-coated quartz substrate. This is a quick production method that yields excellent results. Multi-phase devices with increased diffraction efficiencies are more challenging to fabricate. We chose to implement a process consisting of successive rounds of deep-UV lithography and etching. E-beam lithography could also yield devices of high quality, but was not practical to implement due to high cost and long write-time.
4.2 Lithography mask generation
Lithography masks were written using a direct write lithography system on 150 mm × 150 mm × 6.3 mm chrome-coated quartz substrates with photoresist at 4 × magnification. To minimize the number of fabrication steps, we used a 2N approach compressing the eight-level multi-phase grating function into three binary masks (Fig. 5(a)-5(c)). This has the advantage of minimizing the number of etch steps during fabrication. When the three masks are etched (to π, π/2 and π/4 phase depth respectively) with partial overlap, devices with eight phase levels are obtained (with 7π/4, 3π/2, 5π/4, π, 3π/4, π/2, π/4 and 0 phase steps). Pattern files were generated as bitmaps that were converted to Graphic Data System (GDS) files [24]. The GDS files were then converted to the laser writer machine format using its native software.
To facilitate for other optical researchers who wish to make their own MFGs from scratch we provide our complete code for every step of the design process to generate the MFG bitmap files. This includes scripts for designing binary or multi-phase grating functions using the pixelflipper algorithm (Code File 1), separating multi-level grating functions into binary lithography mask (Code File 2), and computing the final MFG device patterns using aberration-free refocusing (Code File 3 and Code File 4) [15]. For a guide to assembling the MFM system, we refer to a previous publication describing the relay optics and optical alignment [5].
(a) (b) (c) (d)
Fig. 5. Compressed (2N) lithography masks for fabricating multi-phase MFGs from fused silica (glass) wafers. Multiple etch rounds use the different masks to successively shape the MFG patterns. (a) Multi-phase grating function for nine-plane MFG calculated using the pixelflipper algorithm [2]. (b) Lithography masks for manufacturing the eight-layer pattern in a, compressed into N = 3 masks (23 = 8) with active areas that partially overlap during the three successive etch rounds. (c) Multiple solutions to a desired energy distribution are sometimes found during grating function design. For example, this pattern provides an intensity distribution that is effectively identical to that of the pattern in a. By exploring different shapes and different layer orders one can find patterns suited for the manufacturing process. (d) Lithography masks for the pattern in c.
4.4 Lithography and glass etching
MFG devices were made from substrates of ≈100 mm diameter ≈0.5 mm thick polished fused silica wafers, coated with photoresist as described in Fig. 6. Lithography masks were used in a
#253387 Received 20 Nov 2015; revised 10 Jan 2016; accepted 3 Feb 2016; published 16 Feb 2016 (C) 2016 OSA 1 Mar 2016 | Vol. 7, No. 3 | DOI:10.1364/BOE.7.000855 | BIOMEDICAL OPTICS EXPRESS 864

248 nm deep UV-lithography stepper to lithographically define the MFG pattern on the substrates. Substrates were etched using Fluorine-based plasma chemistry in a parallel plate reactive ion etcher. Due to the low thermal conductivity of glass (≈100 times lower than silicon), insufficient cooling during the energetic reactive ion etch process is a concern when working with glass substrates. Induced heat during etching enhances resist erosion and substrate heating yields increased surface roughness, producing frosted or “grassy” etch surfaces that can reduce transparency. We found that etching in two-minute intervals followed by a one-minute delay time for the substrate to cool off worked well. The etching process was repeated for the three etch levels, with the etch time adjusted to provide etch depths corresponding to a phase shift of π, π/2 and π/4 for transmitted light at the design wavelength. For the stepper to detect the transparent glass wafers and align them during successive etch steps, overlay marks were defined using an opaque chrome (Cr) metal layer. Stepper pre-alignment primary marks (PM) were etched into the glass substrate to a depth of ≈120 nm. Wafers were cleaned and a blanket layer of Cr was sputtered onto the glass substrate. Using a negative resist process, a wet-chemical Cr etch was used to remove Cr from the substrate, except at the PM marks. To evaluate the fabrication process we inspected the MFGs in an upright, wide-field inspection microscope with different magnification air objectives under transmitted and reflected illumination to screen for errors. Devices were also imaged with AFM (atomic force microscopy) to measure surface quality and etch depth (Fig. 7). AFM measurements indicated that etch depths between devices in different batches were within ≈10 nm of the target value. For example, for the three etch steps that produced the eight phase levels in the MFG shown in Fig. 6, optimized for orange light at 590 nm, AFM measurements indicated ≈159 nm, ≈318 nm and ≈649 nm effective etch depths for target values of 160 nm, 320 nm and 641 nm, respectively.
In most MFMs we have used a nominal grating period of ≈12 μm. The same period was used in the systems described here except in the seven-plane system (Fig. 3), where instead a ≈10 μm grating period MFG was used. This adjustment allowed a shorter beam path when using a narrow wavelength spectrum, and was made in order to fit the MFM into a constrained space. The seven-plane MFM was implemented with two 200 mm lenses forming a 1:1 relay optics system and built onto a commercial Zeiss Axiovert microscope fitted with a 150 × NA = 1.35 Total Internal Reflection Fluorescence (TIRF) objective.
#253387 Received 20 Nov 2015; revised 10 Jan 2016; accepted 3 Feb 2016; published 16 Feb 2016 (C) 2016 OSA 1 Mar 2016 | Vol. 7, No. 3 | DOI:10.1364/BOE.7.000855 | BIOMEDICAL OPTICS EXPRESS 865

Fig. 6. Fabrication process for multi-level MFG devices. Complete code for generating the grating function, separating it into layers and applying the distortion function is available in Code File 1, Code File 2, Code File 3, and Code File 4 [15].
#253387 Received 20 Nov 2015; revised 10 Jan 2016; accepted 3 Feb 2016; published 16 Feb 2016 (C) 2016 OSA 1 Mar 2016 | Vol. 7, No. 3 | DOI:10.1364/BOE.7.000855 | BIOMEDICAL OPTICS EXPRESS 866

Fig. 7. (a) Visual inspection of a fused silica (glass) wafer with multiple MFG devices etched into its surface. Each individual device is visible as a lighter circular area on the wafer. (b) Image of MFG surface, showing the pattern / grating function. (c) AFM image of the MFG surface in b. Scale bars in b and c represent 12 μm.
4.7 Measurement of light distribution into diffractive orders in finished devices
Transmission and intensity distribution of MFGs was measured across the visible wavelength spectrum as described in Fig. 8. Fabricated multi-phase MFGs from different batches obtained total light efficiencies ranging from ≈74% to ≈84% of the theoretical optimum of ≈89%. Binary seven-plane MFGs obtained the theoretical efficiency of ≈79%.
Efficiency (%
)
(focal plane #) (focal plane #)
Efficiency (%
)
(a) (b)
Fig. 8. Light efficiency and light distribution uniformity of MFGs measured using an LED light source, filtered by narrowband emission filters (FWHM ≈20 nm at center wavelengths of 438 nm, 485 nm, 513 nm, 585 nm, 632 nm and 660 nm) and a digital single-lens reflex (DSLR) camera sensor (Canon). To ensure a linear response of the camera sensor, it was only used up to < 2/3 of its dynamic range. Transmission losses through the MFG substrate were ignored by comparing to a measured total light value transmitted through a blank part of the device surface. (a) Measured intensity distribution of binary MFG device for 7 focal plane imaging is ≈79% as theoretically predicted. (b) Measured intensity distribution of eight-level multi-phase MFG device for 9 focal plane imaging is lower than the ≈89% theoretically calculated, varying between ≈74% and 84% in fabricated devices from different batches. Note that the intensity of the zeroth diffraction order (the central image plane in the multifocus image) is intentionally suppressed in the MFGs in both a and b to compensate for uneven losses in the chromatic correction module. Uniformity between orders is a sensitive part of the grating function design and fabrication process, and especially the relative intensity of the zeroth order varies strongly with the effective phase shift for different wavelengths. Measurement accuracy and device uniformity was estimated jointly by inspecting three MFGs from the same batch, yielding a standard deviation of 0.3%. (Total efficiency in n = 3 measured devices in this batch averaged 79.0% with standard deviation 0.3% at the design wavelength ≈513 nm.) Measurement accuracy was also confirmed for a subset of devices with an optical power meter, yielding values consistent with the measurements made with the camera sensor within a few percent.
#253387 Received 20 Nov 2015; revised 10 Jan 2016; accepted 3 Feb 2016; published 16 Feb 2016 (C) 2016 OSA 1 Mar 2016 | Vol. 7, No. 3 | DOI:10.1364/BOE.7.000855 | BIOMEDICAL OPTICS EXPRESS 867
5. MFGs for different objectives
By using different objective magnifications, relay optics, cameras, numbers of focal planes and fields of view, MFM can be optimized to image specific specimens and events. We here outline how the MFG is designed to match to the microscope objective magnification. Microscope objectives of different magnifications (Mo) and tube lens focal lengths (fT.L.) have different focal lengths (fo) and therefore the size of their pupils (pupil diameter dp) are different. High-magnification objectives have shorter focal lengths and smaller pupil diameters than lower magnification objectives (Eq. (1)). For a specific magnification objective, the higher the NA, the larger the pupil diameter (Eq. (2)). Therefore it is possible to image for example with an MFG designed for 60 × objectives using 100 × objectives, however the resulting images will suffer from depth-induced spherical aberration, since the refocusing function is not properly applied.
. . /obj T L objf f M= (1)
2p objd NA f= ⋅ ⋅ (2)
In an MFG designed for an objective with a specific magnification (e.g. 60 × ), the refocusing function will be correct for all objectives with this magnification, even if the NA varies, as long as the MFG was designed for the highest NA used. When used with a lower NA objective, light will simply under-fill the MFG surface. However, if the MFG design is for an NA lower than that of the objective, the emission light beam will spill over the MFG edges and severely deteriorate the image. An MFG designed for the proper Mo and NA will work with any microscope brand. Objectives from different manufacturers have different primary pupil plane sizes, since the manufacturers use different tube lengths. However, the secondary pupil plane formed by the tube lens and the first MFM relay lens (L1 in Fig. 1) will have the same size, so that MFGs can be used interchangeably on different microscopes as long as the objective magnification is the same. The distortion patterns of the MFG devices can be generated using the code in the Supplementary Material. We have fabricated various combinations of MFG designs for 60 × , 100 × and 150 × objectives with seven- and nine-plane configurations for green, orange and red fluorescent light.
6. Summary
We demonstrate improved sensitivity and imaging accuracy in “precise color” multifocus imaging, using separate light paths for each fluorophore color channel, each with a tailored MFG. A multi-phase MFG with eight phase levels, capable of obtaining photon collection efficiencies up to an optimum of ≈89%, is used for nine-plane MFM, improving light efficiency performance from our previously reported binary devices. We also report a design for higher peak intensity in smaller samples, with a binary MFG producing seven focal planes with ≈79% photon collection efficiency. These significantly brighter devices enable faster and gentler live 3D imaging of sensitive biological samples. Diffractive optics fabrication work was performed in the nanofabrication user-facilities at CNF (Cornell, Ithaca, NY) and CNST (NIST, Gaithersburg, MD). Materials and methods are described so that researchers with a background in optics may be able to design and fabricate their own MFGs with the help and training provided by staff at these and other facilities. MFM system performance was evaluated using fluorescent beads to verify resolution and refocusing capabilities of instantaneous 3D imaging at the full native resolution of high-NA microscope objectives. In a live 3D imaging experiment, neuronal activity in living adult C. elegans was visualized under olfactory stimulation in a microfluidic chamber. Neuronal responses to odor stimulation were detected with the genetically-encoded calcium indicator GCaMP6s, genetically expressed in sensory neurons. Two clusters of sensory neuron pairs located on opposite sides of the head were visualized simultaneously and the activity of individual neurons was resolved.
#253387 Received 20 Nov 2015; revised 10 Jan 2016; accepted 3 Feb 2016; published 16 Feb 2016 (C) 2016 OSA 1 Mar 2016 | Vol. 7, No. 3 | DOI:10.1364/BOE.7.000855 | BIOMEDICAL OPTICS EXPRESS 868

Disclaimer
This article identifies certain commercial software, equipment, instruments, and materials to properly specify the experimental procedure used. Such identification does not imply recommendation or endorsement by the National Institute of Standards and Technology, nor does it imply that the equipment, instruments, and materials identified are necessarily the best available for the purpose.
Acknowledgments
We thank John Treichler, Daron Westley, Michael Skvarla, Gary Bordonaro, Meredith Metzler, Sam Stavis and all the excellent staff at the national user facilities CNF (Cornell, Ithaca, NY) and CNST (NIST, Gaithersburg, MD) for advice, training, help and guidance in practical nanofabrication. These and other user facilities provide an irreplaceable resource for researchers who wish to develop their theoretical inventions into novel technologies such as advanced optical systems for biological imaging. (CNF grant number: ECCS-15420819). Functional neuronal imaging data was recorded during the Neurobiology course at the Marine Biological Laboratory in Woods Hole, Cape Cod. We thank summer students Nichelle Jackson and Veronica Jove, who took part in recording the functional imaging data, and the entire MBL research community for assistance and inspiration during the course, especially Josh Zimmerberg (NIH) for letting us use his Laser. Special thanks to Uli Hoffman and Gerald Lopez at GenISys for their help in developing conversion methods for Beamer software to accommodate big MFG data files. S.A. is a Leon Levy Postdoctoral Fellow in Neuroscience at the Rockefeller University. C.I.B is an investigator of the Howard Hughes Medical Institute, and work in the lab is funded by the Howard Hughes Medical Institute. X.J. is an HHMI predoctoral fellow. J.P. is a Howard Hughes Medical Institute Gilliam Fellow. Research in M.N.’s group was supported by a European Research Council Starting Grant (ERC-Stg-260787). Funding for the Janelia Research Campus groups was provided by the Howard Hughes Medical Institute. M.M. and X.D. are funded by the California Institute for Regenerative Medicine Research Leadership Grant (LA1-08013 to X.D.). This paper is written in memory of the late Mats G.L. Gustafsson, with whom the MFM system was originally designed.
#253387 Received 20 Nov 2015; revised 10 Jan 2016; accepted 3 Feb 2016; published 16 Feb 2016 (C) 2016 OSA 1 Mar 2016 | Vol. 7, No. 3 | DOI:10.1364/BOE.7.000855 | BIOMEDICAL OPTICS EXPRESS 869


![Perspective-consistent multifocus multiview 3D ... · clude: a two-axis turntable combined with macro rail and macro photography to capture multifocus multiview images [7], calibration](https://img.dokumen.tips/doc/110x75/5f63fafeccfd990c7341d8fd/perspective-consistent-multifocus-multiview-3d-clude-a-two-axis-turntable-combined.jpg)