Embed Size (px)
Citation preview

167© Springer International Publishing Switzerland 2016 C.H. Greenberg, B.S. Collins (eds.), Natural Disturbances and Historic Range of Variation, Managing Forest Ecosystems 32, DOI 10.1007/978-3-319-21527-3_8
Chapter 8 Multi-millennial Record of Erosion and Fires in the Southern Blue Ridge Mountains, USA
David S. Leigh
Abstract Bottomland sediments from the southern Blue Ridge Mountains provide a coarse-resolution, multi-millennial stratigraphic record of past regional forest disturbance (soil erosion). This record is represented by 12 separate vertical accre-tion stratigraphic profi les that have been dated by radiocarbon, luminescence, cesium-137, and correlation methods continuously spanning the past 3,000 years of pre-settlement (pre-dating widespread European American settlement) and post- settlement strata. Post-settlement vertical accretion began in the late 1800s, appears to be about an order of magnitude faster than pre-settlement rates, and is attribut-able to widespread deforestation for timber harvest, farming, housing develop-ment, and other erosive activities of people. Natural, climate-driven, or non-anthropic forest disturbance is subtle and diffi cult to recognize in pre-settle-ment deposits. There is no indication that pre-settlement Mississippian and Cherokee agricultural activities accelerated erosion and sedimentation in the region. A continuous 11,244 years before present (BP) vertical accretion record from a meander scar in the Upper Little Tennessee River valley indicates abundant charcoal (prevalent fi res) at the very beginning of the Holocene (11,244–10,900 years BP). In contrast, moderate to very low levels of charcoal are apparent over the remaining Holocene until about 2,400 years BP when charcoal infl ux registers a pronounced increase. These data are consistent with the idea that Native Americans used fi re extensively to manage forests and to expanded agricultural activities during Woodland and later cultural periods over the past 3000 years. However, there is no indication that prehistoric intentional use of fi re and agricul-ture caused accelerated erosion and sedimentation.
Keywords Alluvium • Chronostratigraphy • Holocene • Overbank • Charcoal
D. S. Leigh (*) Department of Geography , The University of Georgia , Athens , GA 30602-2502 , USA e-mail: [email protected]

168
8.1 Introduction
Forests shelter soils on hillslopes from intense rainfall , runoff, and erosion in the southern Blue Ridge Mountains (SBRM). Without forests these mountains would be badlands, because of the highly erodible surface mantle of saprolite (weathered bedrock). Hydrologists posit that under pristine forest conditions surface erosion is minimal because there is complete infi ltration of precipitation and virtually no Hortonian overland fl ow (i.e., rainfall intensity exceeds soil infi ltration capacity); and instead, precipitation is delivered to streams via subsurface pathways and as saturation overland fl ow (Hewlett et al. 1977 ; Swift et al. 1988 ; Committee on Hydrologic Impacts of Forest Management 2008 ). However, disturbance of forest cover has occurred on a variety of spatial and temporal scales exposing bare soil, reducing infi ltration capacities, and resulting in erosion and deposition of sediment on nearby bottomlands. Natural pathways and patterns of erosional disturbance typically are driven by destructive tornado swaths and windblown tree-throws (Peterson et al. Chap. 5), landslides (Wooten et al. Chap. 9), ice storms (Lafon Chap. 7), and fi res ignited by lightning (Grissino-Mayer Chap. 6; Greenberg et al. Chap. 1, Table 1.6; Greenberg et al. Chap. 12); and the magnitude and frequency of such events is mediated by variations in climate. In contrast, human-induced distur-bance primarily includes timber harvest, land clearing for agriculture and settle-ment, and fi res ignited by humans. Floodplain deposits record both natural and human-induced modes of past forest disturbance via changes in sedimentology, which result from changes in the sediment transport and rainfall-runoff regimes, and which, in turn are mediated by changes in climate and vegetation cover. For example, timber harvest and forest clearance for croplands drastically increase sedi-ment concentrations in streamfl ow, and fl oodplain sedimentation rates (Happ 1945 ; Trimble 1974 ; Walling 1987 ; Meade et al. 1990 ; Saxton and Shiau 1990 ; Knighton 1998 ; Walling 1999 ; Knox 2006 ) because complete removal of the protective veg-etation facilitates dislodgment of soil from raindrop impact, sheetfl ow, and rilling mechanisms of soil erosion. The SBRM are no exception to this rule, because his-torical human impacts (largely by timber harvest, small farms, and home develop-ment) since the late 1800s following widespread European American settlement (post-settlement time) have created land surfaces conducive to higher sediment yields than the pre-settlement landscapes occupied by indigenous people of the Cherokee , Mississippian, and earlier cultures.
The main purpose of this chapter is to describe and explain how bottomland alluvial sediments record past fl uctuations in erosional forest disturbance of the SBRM. Paleobotanical records from wetland peat deposits are very important sedi-mentary sources of information about past forest composition and disturbance (Delcourt and Delcourt 2004 ), but they have been scarcely studied in this region and are beyond the scope of this chapter. Instead, emphasis here is on past soil erosion and its ultimate deposition on bottomlands and fl oodplains, and what sorts of infor-mation can be gleaned from these widespread stratifi ed deposits. Numerous examples and analyses are drawn from stratigraphic data originally collected by the author and his former students.
D.S. Leigh

169
The SBRM physiographic province (see Fig. 1.1 ) is the late Precambrian and early Paleozoic crystalline terrain of high relief mountains in the Blue Ridge prov-ince south of the Roanoke River in Virginia , and includes western North Carolina , eastern Tennessee , and northeastern Georgia (Fenneman 1938 ; Thornbury 1965 ). This province is broadly representative of forests in the Central Hardwood Region . Bedrock consists largely of metasedimentary rocks (micaceous gneisses and schists) with some outcrops of basement granites and granitic gneisses (Robinson 1992 ; Thigpen and Hatcher 2009 ). This highly dissected mountain range has summits up to around 2000 m above sea level and main valley bottoms at around 600 m above sea level. Hillslopes and summits commonly are mantled by 0–10 m of sandy to clayey micaceous saprolite, whereas colluvium and alluvium cover the footslopes and bot-tomlands (Hatcher 1988 ; Southworth et al. 2003 ). Stream and river channels typi-cally exhibit meandering pool and riffl e morphology with bed sediment composed of fi ne to very coarse gravel. Floodplains and recent terraces commonly have a thick vertical accretion mantle (0.5–2.0 m) overlying much thinner lateral accretion and channel lag bedload materials. Much of the data presented in this paper were drawn from the Upper Little Tennessee River valley between Franklin, North Carolina and Mountain City, Georgia (Fig. 8.1 ), which is centrally located in the SBRM.
Fig. 8.1 Map showing the southern Blue Ridge Mountains , the Upper Little Tennessee River val-ley, and other sample locations mentioned in the text
8 Multi-millennial Record of Erosion and Fires in the Southern Blue Ridge…

170
Ayers and Ashe ( 1905 ) and Glenn ( 1911 ) were perhaps the fi rst to extensively document human-induced erosive damages to forests and related fl oodplain deposi-tion in the southern Appalachians . Ayers and Ashe ( 1905 ) note that “The three agen-cies that have wrought changes in the forests of the Southern Appalachians are fi res , lumbering, and clearing of lands for farming… During heavy rains the earth of freshly burned or freshly plowed land is rapidly washed away. The streams from such lands are often more than half earth, and the amount of soil thus eroded every year is enormous.” Glenn ( 1911 ) provides excellent examples, including photo-graphs of eroded land, fl ooding, and sedimentation (Figs. 8.2 and 8.3 ) within spe-cifi c watersheds that had experienced deforestation . For example, he states “Floods on the Tuckasegee are said by old residents, some of whom have known the river for 60 years, to be generally higher, to come more suddenly, to disappear quicker, and to be much more destructive than 50 years ago. Both the river and its tributaries are said to be much muddier during fl oods and for a considerable time afterwards than they formerly were…” and “…the stream may be overloaded with waste and forced to drop a part of it until it fi lls its channel. It then fl ows here and there in irregular shifting meanders across its fl ood plain, depositing great quantities of waste and building up or aggrading the fl ood plain. Such fl ood plains rapidly become useless for agriculture .” (Glenn 1911 ).
The early 1900s were arguably the most erosive decades in history, but it is important to realize that even during the heyday of timber harvest during 1900–1910
Fig. 8.2 Photographic plate XVB from Glenn ( 1911 ), entitled “A well-dissected part of the Asheville Plateau” illustrating the deforested and cultivated appearance of hillslopes in the south-ern Blue Ridge Mountains in the early 1900s
D.S. Leigh

171
the landscape of the SBRM region still retained about 70 % forest cover at any given point in time as clear cut areas were quick to sprout saplings and begin successional reforestation (Ayers and Ashe 1905 ; Holmes 1911 ). Thus, only fractional deforesta-tion is necessary to produce very noticeable changes in the geomorphic system, a point which was recently affi rmed by Price and Leigh ( 2006a , b ).
Considerable attention has been placed on post-settlement alluvium in the Piedmont province of the southern Appalachian region (see Greenberg et al. Chap. 1 , Fig. 1.1) where row-crop agriculture has been more extensive than in the moun-tains (Fuller 1934 ; Happ 1945 ; Trimble 1974 ; Costa 1975 ; Jacobson and Coleman 1986 ; Meade et al. 1990 ; Ruhlman and Nutter 1999 ; Lichtenstein 2003 ; Jackson et al. 2005 ; Ambers et al. 2006 ; Hupp et al. 2013 ; Lecce and Pavlowsky 2014 ), and these studies generally indicate that about 1–2 m of post-settlement alluvium was delivered to river bottomlands over the span of a couple of centuries. However, very little follow-up to Glenn’s ( 1911 ) study has been done in the much less agricultural and more forested SBRM. Price and Leigh ( 2006a , b ) provided examples of how
Fig. 8.3 A USDA photo from 1901 AD of “A seven acre fi eld on Scott’s Creek, which was very badly washed by the freshet of 1901.” Scott’s Creek fl ows through Sylva, North Carolina . The photo was taken by E. Block and reproduced by David Leigh (April 2010) from US Archives photo l34Er18, caption label “25316 Inf – Infl uences, Floods, Effects, Land Damage, North Carolina” (with handwritten number 25540). Notice the thick deposits of fresh sandy alluvium along the fence line to the left and a thin drape of fi ne sediment along with fl ood gravels across much of the fl oodplain. Also, notice the steep deforested hillslopes in the background
8 Multi-millennial Record of Erosion and Fires in the Southern Blue Ridge…

172
relatively modest levels of deforestation relate to signifi cant changes in stream channel morphology and increased levels of turbidity and suspended sediment con-centrations in tributaries to the Upper Little Tennessee River. They include radiocarbon- dated stratigraphic sections showing 40–50 cm of post-settlement allu-vium. Miller et al. ( 2005 ) examined 111 years of reservoir sediment in the SBRM of western North Carolina and found that sedimentation rates progressively increased with fastest rates in the 1990s and 2000s, presumably in association with the widespread development of new house sites.
Simmons ( 1993 ) collected hundreds of suspended sediment observations from the SBRM from 1970 to 1979 as part of a statewide study entitled, “ Sediment Characteristics of North Carolina Streams, 1970–1979 .” He stratifi ed land use char-acteristics of Blue Ridge watersheds into four categories, including fully forested (F), mostly forested with minor development (D), non-agricultural rural (N), and agricultural rural (R) types. His results (Fig. 8.4 ; Table 8.1 ) clearly illustrate how the less -forested watersheds generate considerably more sediment than fully forested (‘pristine’) watersheds. It is signifi cant to note that Simmons’ three ‘pristine’ water-sheds generated an average of 15 tonnes per km 2 per year of suspended sediment (individual observations of 9.5, 15.1, 20.3 tonnes per km 2 per year), and this illus-trates the signifi cance of sediment yield from natural disturbances in the fully
Fig. 8.4 Sediment yield data of Simmons ( 1993 ) for samples collected in the southern Blue Ridge Mountains of western North Carolina in 1970–1979, with additional points from the Upper Little Tennessee River valley collected in 2001 (Oblinger 2003 ) and 2011 (Coweeta LTER unpubl). Separate linear regression lines are for the 1970s ( black ) and water year 2011 ( grey ) with respec-tive parameters and R 2 values stated to the right
D.S. Leigh

173
forested watersheds (primarily from landslides , tree-throws, and stream bank erosion sources of sediment).
Meteorological events mediated by climate are the main drivers of variations in natural erosive disturbances of forests, but recent attention has been cast on Native Americans as agents of prehistoric erosion and sedimentation. Stinchcomb et al. ( 2011 ) argued that indigenous people of the Mississippian culture (ca. 1,000–460 years BP) were responsible for a 50 % reduction in forest cover in tributaries to the Delaware River in eastern Pennsylvania and western New York (largely for maize ( Zea mays ) cultivation), and they claim to recognize the fi rst fl oodplain sediment attributed to erosive human impact on the landscape (sensu stricto ‘legacy sedi-ment’ of James 2013 ) at circa 1100–1600 AD. They referred to it stratigraphically as ‘pre-Colonial sediment’ which is distinguished by faster sedimentation rates than previous deposits, and they indicated that it may be recognizable throughout eastern North America. Delcourt and Delcourt ( 2004 ) argue that Native Americans had been managing forests for thousands of years in the southern Appalachians by use of fi re to clear understories for nut harvest and game management , and to clear plots for agriculture (also see Grissino-Mayer Chap. 6 ; Greenberg et al. Chap. 12 ). Thus, indigenous people could have caused signifi cant enough erosive impact on the land to be expressed in the pre-settlement stratigraphic record.
Although the focus of this book is on ‘natural’ disturbances, which would pri-marily relate to erosion and sedimentation prior to widespread European American settlement (pre-settlement time) (but see Greenberg et al. Chap. 1 ), this chapter emphasizes sedimentation both before and after settlement, because the later represents the end-member of maximum forest disturbance. In fact, the expression of forest disturbance usually is very subtle in the pre-settlement stratigraphic record, compared to the post-settlement record. If the ultimate objective is to manage for-ests within the realm of natural disturbance, then it is still useful to understand a frame of reference that includes the pronounced effects of human-induced distur-bance that are clearly outside of the natural range of variation . Furthermore, since it has been argued that indigenous people caused signifi cant disturbance to forests via intentional burning and cultivation for agriculture (see Greenberg et al. Chap. 12 ), understanding sedimentary products of post-settlement forest disturbance is critical for framing the possible impact that indigenous people had on the sedimentary record. Finally, from an academic perspective, “…understanding the timescales and
Table 8.1 Mean and standard deviation values of specifi c sediment yield of Blue Ridge Mountain streams in North Carolina , 1970–1979 (From Simmons 1993 )
Land use class Sediment yield (tonnes/km 2 /year) n =
±1 SD (tonnes)
F – Entirely forested (‘pristine’) 15 3 5 D – Mostly forested with minor development 45 4 22 N – Rural with non-agricultural development 79 12 54 R – Rural with agricultural development 82 12 39
8 Multi-millennial Record of Erosion and Fires in the Southern Blue Ridge…

174
pathways for response and recovery of rivers and fl oodplains to episodic changes in erosion and sedimentation has been a long standing issue in fl uvial geomorphology” (Knox 2006 ).
8.2 Distinction Between Pre-settlement Versus Post- settlement Strata
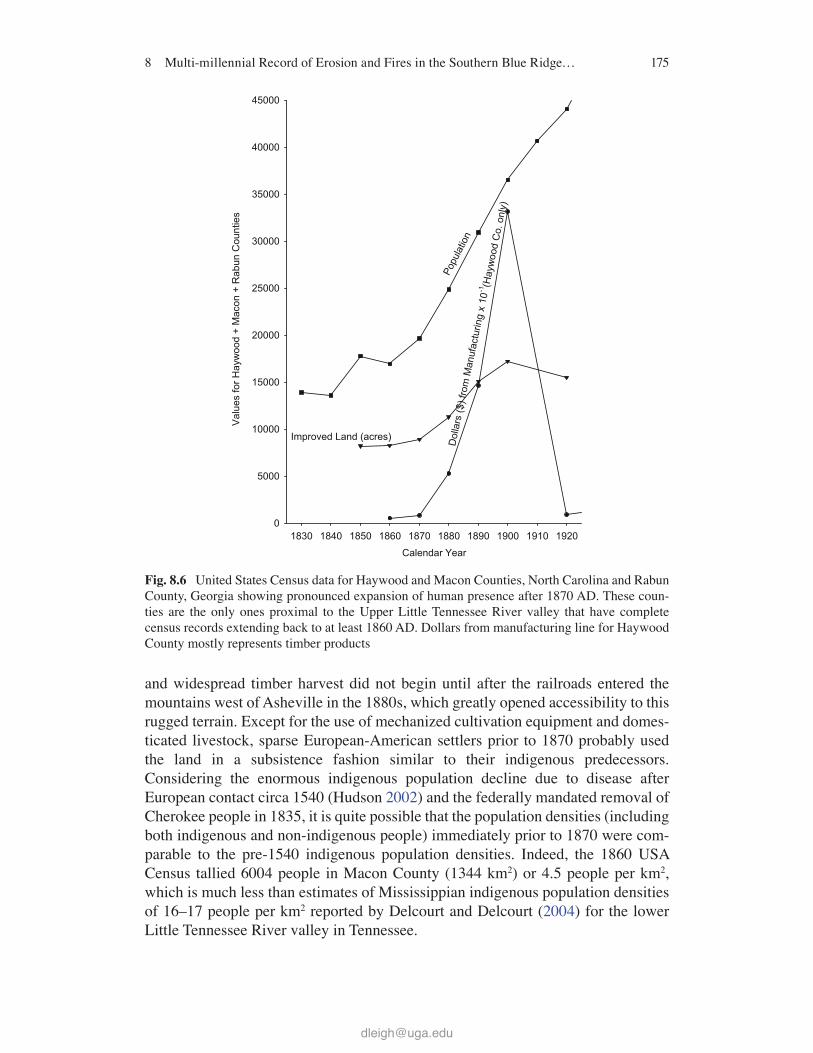
Signifi cant human impact on the fl uvial system in North America did not begin until after immigration and settlement of large numbers of non-indigenous people, and the time-stratigraphic designations before and after such settlement have been referred to as pre-settlement and post-settlement units (Trimble 1974 ; Jacobson and Coleman 1986 ; Knox 1972 , 1977 , 1987 ; Wilkinson and McElroy 2007 ), though prehistoric and historic time-stratigraphic designations also are commonly used. In many localities the stratigraphic boundary between pre- and post-settlement allu-vium is demarcated by a buried paleosol where the upper surface of the buried A horizon represents the soil surface that existed and was buried by the fi rst post- settlement alluvium (Fig. 8.5 ). Leigh ( 2010 ) established a date of 1870 AD (±10 years) for this stratigraphic boundary in the Upper Little Tennessee valley, primarily based on correlation with historical records and census data (Leigh 2010 ) indicating that population, improved land in farms, and value of products in manufacturing in the region did not begin to expand until about 1870 AD (Fig. 8.6 ). Also, intensive
Fig. 8.5 Photograph of the river cutbank stratigraphic section at the Riverside-1 site along the Little Tennessee River showing the stratigraphic boundary of pre- and post-settlement alluvium atop a prominent buried A horizon, which dates to circa AD 1870
D.S. Leigh
175
and widespread timber harvest did not begin until after the railroads entered the mountains west of Asheville in the 1880s, which greatly opened accessibility to this rugged terrain. Except for the use of mechanized cultivation equipment and domes-ticated livestock, sparse European-American settlers prior to 1870 probably used the land in a subsistence fashion similar to their indigenous predecessors. Considering the enormous indigenous population decline due to disease after European contact circa 1540 (Hudson 2002 ) and the federally mandated removal of Cherokee people in 1835, it is quite possible that the population densities (including both indigenous and non-indigenous people) immediately prior to 1870 were com-parable to the pre-1540 indigenous population densities. Indeed, the 1860 USA Census tallied 6004 people in Macon County (1344 km 2 ) or 4.5 people per km 2 , which is much less than estimates of Mississippian indigenous population densities of 16–17 people per km 2 reported by Delcourt and Delcourt ( 2004 ) for the lower Little Tennessee River valley in Tennessee.
Fig. 8.6 United States Census data for Haywood and Macon Counties , North Carolina and Rabun County, Georgia showing pronounced expansion of human presence after 1870 AD. These coun-ties are the only ones proximal to the Upper Little Tennessee River valley that have complete census records extending back to at least 1860 AD. Dollars from manufacturing line for Haywood County mostly represents timber products
8 Multi-millennial Record of Erosion and Fires in the Southern Blue Ridge…

176
Many studies have found signifi cant differences in the character of overbank alluvium of post-settlement versus pre-settlement periods, such as in sediment tex-tures (particle size), sedimentology (bedding structures ), and sedimentation rates (Lecce 1997 ; Knox 1977 , 1987 , 2001 , 2006 ; Benedetti 2003 ; Leigh 2010 ). That is, post-settlement overbank alluvium generally is coarser, redder in color (more oxi-dized), and has sedimentation rates that greatly exceed those of pre-settlement time (Orbock et al. 1993 ; Knox 2001 , 2006 ; Benedetti 2003 ).
In addition to the physical characteristics, chemical and paleobotanical charac-teristics can distinguish post-settlement from pre-settlement alluvium . For example, the lead and zinc content in overbank sediments increased greatly in the upper Mississippi River valley during the 1800s due to mining activities (Knox 1987 , 2006 ). Mercury and gold concentrations are distinctively higher in post-settlement alluvium of the gold belt spanning from northern Georgia through western North Carolina , because gold mining that began in the 1830s involved mercury amalgama-tion to recover gold from sediment sluices (Leigh 1994 , 1997 ; Lecce et al. 2008 ). However, such chemical indicators of human agency commonly do not enter into the stratigraphic record until several decades subsequent to the stratigraphic bound-ary between pre-settlement and post-settlement alluvium, and therefore are not very useful for discriminating the initial onset (or lower boundary) of the post-settlement stratigraphic unit. Pollen preserved within the sediment can help to distinguish the boundary by recognition of the infl ux of non-native species and weeds indicative of land clearance (Delcourt and Delcourt 2004 ), but pollen preservation can be poor within the oxidized fl uvial sediments due to decay of the organic matter.
Usage of the terminology ‘legacy sediment’ has become very popular within the last decade, and usually it is intended to denote sediment resulting from distinct human-induced erosion of the landscape . Thus, it can be synonymous with the chro-nostratigraphic terminology of post-settlement alluvium . However, James ( 2013 ) recently clarifi ed the defi nition of ‘legacy sediment’ to relate to any recognizable human impact. Indeed, one of the important questions posed in this chapter is whether or not prehistoric Native Americans engaged in suffi cient human impact on the landscape to register a sedimentary signature of ‘legacy sediment.’ Thus, pre- and post-settlement are used throughout this chapter, because they are chronostrati-graphic terms that have more precise meaning and distinguish a time of signifi cant population growth of non-indigenous settlers to the region whose land use practices were very erosive.
8.3 Methods
Research presented here relies on 12 stratigraphic sections where both the pre- settlement and post-settlement units occur in the exact same stratigraphic section, and where both units have been well dated by a combination of radiocarbon, luminescence , 137 Cs, or correlation dating techniques. The majority of these dated stratigraphic sections are from the Upper Little Tennessee River catchment in
D.S. Leigh

177
northeast Georgia and western North Carolina between Franklin, North Carolina and Mountain City, Georgia (Fig. 8.1 , Table 8.2 ) where they were collected in asso-ciation with the Coweeta Long-Term Ecological Research (Coweeta LTER) pro-gram ( http://coweeta.uga.edu/ ). Exceptions include the Brasstown stratigraphic section (Leigh 1996 ), which came from the valley of Brasstown Creek in the upper Hiawassee drainage of northern Georgia, and another two sections (at archaeologi-cal site 31GH457) that came from the valley of West Buffalo Creek, a tributary to Lake Santeetlah near Robbinsville, North Carolina (Leigh 2011 ). Ten of these 12 stratigraphic sections are composed entirely of late Holocene alluvium younger than 3,500 years BP, which is most appropriate for comparison of the recent post-settlement alluvium to its immediate predecessor of pre-settlement alluvium. Other stratigraphic sections have been collected in the region (Leigh and Webb 2006 ; Leigh and Rogers 2007 ), but do not contain the both the pre-settlement and post-settlement strata in the same section.
Table 8.2 Location and attributes of study sites
Site name
Latitude (decimal degrees)
Longitude (decimal degrees)
Drainage area (km 2 ) Profi le type Reference
Keener-1 34.933053° −83.437982° 7 7.6 cm giddings core
Price and Leigh ( 2006a ), Wang and Leigh ( 2012 )
Keener-4 34.932923° −83.438349° 7 7.6 cm giddings core
Price and Leigh ( 2006a )
Skeenah-2 35.110998° −83.404813° 15 7.6 cm giddings core
Price and Leigh ( 2006a )
Skeenah-4 35.110858° −83.404828° 15 7.6 cm giddings core
Price and Leigh ( 2006a )
31GH457-1 35.310047° −83.912289° 28 7.6 cm hand auger
Leigh ( 2011 )
31GH457-2 35.310247° −83.912211° 28 7.6 cm hand auger
Leigh ( 2011 )
Brasstown-20 34.949807° −83.850598° 65 Backhoe pit #20
Leigh ( 1996 )
State Line-1 34.998003° −83.380416° 146 Right stream cutbank
Leigh ( 2007 ), Wang and Leigh ( 2012 )
Creamery-70SW- 1
35.012233° −83.384814° 171 7.6 cm giddings core
Leigh ( 2007 )
Otto/Smith-1 35.058677° −83.385510° 213 Left stream cutbank
Leigh ( 2007 )
Riverside-1 35.091003° −83.382106° 313 Right stream cutbank
Leigh ( 2007 ), Wang and Leigh ( 2012 )
Stiles-1 35.101464° −83.384691° 319 7.6 cm giddings core
Leigh this paper
8 Multi-millennial Record of Erosion and Fires in the Southern Blue Ridge…
178
Radiocarbon dating methods mainly involved samples of small angular charcoal or bulk sediment (micro-charcoal fractions and humus) using the accelerator mass spectrometry (AMS) method at the University of Georgia ’s Center for applied iso-tope studies. In a few instances large pieces of uncarbonized wood were dated by the conventional scintillation counting method, and the Beta Analytic, Inc. lab was used for the two samples at the Brasstown-20 site (Table 8.3 ). Charcoal fragments were cleaned and leached of possible carbonates with an acid-alkali-acid pretreat-ment (1 N HCl-1 N NaOH-1 N HCl) prior to 14 C dating. Bulk sediment material was dated following ultrasonic dispersion and sieving through a 125 μm mesh and clean-ing with 1 N HCl to remove possible carbonates. Calendar year calibrations were calculated using the program CLAM (Blaauw 2010 ) based on the IntCal-13 calibra-tion curve (Reimer et al. 2013 ) and the delta 13 C corrected 14 C ages. The calendar years before present (years BP) reference 1950 AD as ‘present.’ Sedimentation rates were calculated by linear interpolation with the program CLAM (‘classical’ age modeling of Blaauw 2010 ), which considers the probability distributions of the separate calibrated ages to produce the most probable match for linear interpolation between the two samples. Thus, CLAM produces long-term-average sedimentation rates. Only vertical- accretion facies were used for estimates of sedimentation rates. In cases where lateral accretion facies were dated beneath the vertical accretion, that date was assigned as the basal boundary of the vertical accretion unit, because lat-eral accretion deposition occurs very rapidly and immediately prior to being over-lain by vertical accretion deposits (Bridge 2003 ).
Although it is possible that charcoal may be detritus and can thereby produce erroneous ages for the actual time of sedimentation, care was taken to selectively date the largest angular fragments of charcoal that exhibit minimal traits of abrasion and rounding. One paired set of radiocarbon samples from the Riverside site (both from 142 to 144.5 cm depth) included dating results from the <125 μm bulk sedi-ment versus charcoal isolated from the <125 μm fraction by fl otation separation in sodium polytungstate at 1.7 g per cm 3 . Both samples produced almost exactly the same age, 1,650 ± 25 versus 1,710 ± 25 14 C years BP, respectively (Table 8.3 ), and they exhibit overlap at 1,555–1,615 years BP upon calendar year calibrations with two standard deviations. Although, comprehensive conclusions cannot be drawn from only one sample, this single example demonstrates that charcoal is not neces-sarily much older than associated humus in overbank sediments. It is sensible that charcoal is slightly older than humus, because it has great potential for inheriting ages older than the actual time of sedimentation (i.e., charcoal may have been from tree rings that were hundreds of years older than tree death, transit time of charcoal from the fi re site to the deposition site may have taken hundreds of years). Therefore, the bulk sediment date was preferentially used for age-depth modeling in this case and it yielded a best estimate of 1,552 years BP (Table 8.3 ).
Luminescence dating was applied in a few instances when radiocarbon dating was not feasible, based on the samples of Wang and Leigh ( 2012 ). Samples were col-lected by pounding light-tight PVC tubes (about 15 cm long by 4 cm diameter) into the outcrop and sealing the ends with duct tape upon removal. Ages were measured from sediment extracted from the center of the tubes at the University of Georgia Luminescence Dating Laboratory using the single‐aliquot regenerative‐dose proto-
D.S. Leigh

179
Tabl
e 8.
3 R
aw d
ata
for
sam
ples
use
d fo
r ag
e de
term
inat
ions
in e
ach
indi
vidu
al s
trat
igra
phic
sec
tion
or s
ite
Site
L
ab #
Sam
ple
dept
h (c
m)
Plot
po
int
dept
h (c
m)
Uni
t &
faci
es
Frac
tion
of
VA
uni
t th
ickn
ess
(0 =
bot
tom
, 1
= to
p)
Dat
ing
met
hod
Mat
eria
l dat
ed
Mat
eria
l is
otop
ic
del 13
C
14 C
ye
ars
BP
Non
- 14C
ag
e es
timat
e ca
l. ye
ar
BP
±1
SD
Bes
t age
E
st. (
cal.
year
s B
P)
Inte
r-
sam
ple
rate
(m
m/
year
)
Kee
ner-
1 n.
a.
0 0.
0 2V
A
1.00
G
S Su
rfac
e 20
05
n.a.
n.
a.
−55
1
−56
n.
a.
Kee
ner-
1 n.
a.
12–1
4 13
.0
2VA
0.
70
Cs1
37
Floo
d se
dim
ent
n.a.
n.
a.
−13
10
−
13
3.02
K
eene
r-1
n.a.
43
43
.0
1/2V
A
0 or
1
CO
RR
To
p of
Ab
hori
zon
n.a.
n.
a.
80
10
79
3.26
Kee
ner-
1 U
GA
-09O
SL- 6
72
105–
109
107.
0 1V
A
0.36
O
SL
Sand
y lo
am
n.a.
n.
a.
1300
50
1,
297
0.53
K
eene
r-1
UG
A- 1
4484
12
5 12
5.0
1VA
0.
18
C14
C
harc
oal
−26
.25
1,62
0 n.
a.
40
1,47
4 1.
02
Kee
ner-
1 U
GA
- 144
85
167
143.
0 1L
A
0.00
C
14
Aco
rn (
unca
rb.)
−
25.7
9 1,
630
n.a.
40
1,
546
2.53
K
eene
r-4
n.a.
0
0.0
2VA
1.
00
GS
Surf
ace
2005
n.
a.
n.a.
−
55
1 −
55
n.a.
K
eene
r-4
n.a.
44
44
.0
1/2V
A
0 or
1
CO
RR
To
p of
Ab
hori
zon
n.a.
n.
a.
80
10
80
3.24
Kee
ner-
4 U
GA
- 144
82
133
106.
0 1V
A
0.00
C
14
Cha
rcoa
l −
26.4
4 60
0 n.
a.
40
599
1.19
Sk
eena
h-2
n.a.
0
0.0
2VA
1.
00
GS
Surf
ace
2003
n.
a.
n.a.
−
53
1 −
53
n.a.
Sk
eena
h-2
n.a.
10
–15
13.0
2V
A
0.52
C
s137
Fl
ood
sedi
men
t n.
a.
n.a.
−
13
10
−13
3.
23
Skee
nah-
2 n.
a.
27
27.0
1/
2VA
0
or 1
C
OR
R
Top
of A
b ho
rizo
n n.
a.
n.a.
80
10
80
1.
51
Skee
nah-
2 U
GA
- 130
68
113
81.0
1L
A
0.00
C
14
Woo
d −
25.3
1 1,
580
n.a.
40
1,
469
0.39
Sk
eena
h-4
n.a.
0
0.0
2VA
1.
00
GS
Surf
ace
2003
n.
a.
n.a.
−
53
1 −
53
n.a.
Sk
eena
h-4
n.a.
40
40
.0
1,2V
A
0 or
1
CO
RR
To
p of
Ab
hori
zon
n.a.
n.
a.
80
10
80
3.00
Skee
nah-
4 U
GA
- 130
67
125
112.
0 1L
A
0.00
C
14
Woo
d −
24.9
24
40
n.a.
28
0 2,
494
0.30
31
GH
457-
1 n.
a.
0 0.
0 2V
A
1.00
G
S Su
rfac
e 20
09
n.a.
n.
a.
−59
1
−59
n.
a.
31G
H45
7-1
n.a.
56
56
.0
1/2V
A
0.00
C
OR
R
Top
of A
b ho
rizo
n n.
a.
n.a.
80
10
80
4.
02
(con
tinue
d)
8 Multi-millennial Record of Erosion and Fires in the Southern Blue Ridge…

180
Tabl
e 8.
3 (c
ontin
ued)
31G
H45
7-1
UG
AM
S- 84
61
158
158.
0 1V
A
0.14
C
14
Cha
rcoa
l −
26.7
5,
270
n.a.
30
6,
057
0.17
31
GH
457-
2 n.
a.
0 0.
0 2V
A
1.00
G
S Su
rfac
e 20
09
n.a.
n.
a.
−59
1
−59
n.
a.
31G
H45
7-2
n.a.
37
37
.0
1/2V
A
0 or
1
CO
RR
To
p of
Ab
hori
zon
n.a.
n.
a.
80
10
80
2.67
31G
H45
7-2
UG
AM
S- 84
62
77
77.0
1V
A
0.73
C
14
Cha
rcoa
l −
27.1
3,
170
n.a.
25
3,
401
0.12
B
rass
tow
n-20
n.
a.
0 0.
0 2V
A
1.00
G
S Su
rfac
e 19
93
n.a.
n.
a.
−43
1
−43
n.
a.
Bra
ssto
wn-
20
n.a.
40
40
.0
1/2V
A
0 or
1
CO
RR
To
p of
Ab
hori
zon
n.a.
n.
a.
80
10
80
3.26
Bra
ssto
wn-
20
BE
TA- 6
5972
49
–51
50.0
1V
A
0.78
C
14
Cha
rcoa
l n.
a.
640
n.a.
60
60
9 0.
19
Bra
ssto
wn-
20
BE
TA- 6
5973
17
2–17
5 96
.0
1VA
0.
00
C14
W
ood/
limb
(unc
arb.
) n.
a.
1,88
0 n.
a.
70
1,81
1 0.
38
Stat
e L
ine-
1 n.
a.
0 0.
0 2V
A
1.00
C
OR
R
Surf
ace
2005
n.
a.
n.a.
−
55
1 −
55
n.a.
St
ate
Lin
e-1
n.a.
73
73
.0
2VA
0.
54
Cs1
37
Floo
d se
dim
ent
n.a.
n.
a.
−13
10
−
13
17.2
4 St
ate
Lin
e-1
n.a.
14
4 14
4.0
2VA
0.
09
CO
RR
Fl
ood
sedi
men
t n.
a.
n.a.
48
10
48
11
.77
Stat
e L
ine-
1 n.
a.
159
159.
0 1/
2VA
0
or 1
C
OR
R
Top
of A
b ho
rizo
n n.
a.
n.a.
80
10
80
4.
65
Stat
e L
ine-
1 U
GA
-09O
SL- 6
70
225
225.
0 1V
A
0.50
O
SL
Sand
y lo
am
sedi
men
t n.
a.
n.a.
11
00
50
1,10
0 0.
65
Stat
e L
ine-
1 U
GA
- 144
80
312
290.
0 1L
A
0.00
C
14
Lea
f st
em
−26
.18
1,38
0 n.
a.
40
1,30
1 3.
24
Cre
amer
y-70
SW- 1
n.
a.
0 0.
0 2V
A
1.00
G
S Su
rfac
e 20
06
n.a.
n.
a.
−56
1
−56
n.
a.
Cre
amer
y-70
SW- 1
n.
a.
37.5
–42
.5
40.0
2V
A
0.69
C
s137
Fl
ood
sedi
men
t n.
a.
n.a.
−
13
10
−13
9.
26
Site
Lab
#
Sam
ple
dept
h (c
m)
Plot
po
int
dept
h (c
m)
Uni
t &
faci
es
Frac
tion
of
VA
uni
t th
ickn
ess
(0 =
bot
tom
, 1
= to
p)D
atin
g m
etho
dM
ater
ial d
ated
Mat
eria
l is
otop
ic
del 13
C
14C
ye
ars
BP
Non
- 14C
ag
e es
timat
e ca
l. ye
ar
BP
±1
SD
Bes
t age
E
st. (
cal.
year
s B
P)
Inte
r-
sam
ple
rate
(m
m/
year
)
D.S. Leigh

181
Cre
amer
y-70
SW- 1
n.
a.
129
129.
0 1/
2VA
0
or 1
C
OR
R
Top
of A
b ho
rizo
n n.
a.
n.a.
80
10
80
9.
62
Cre
amer
y-70
SW- 1
U
GA
MS-
0350
1 13
4 13
4.0
1VA
0.
88
C14
C
harc
oal
−26
.7
895
n.a.
25
82
9 0.
07
Cre
amer
y-70
SW- 1
U
GA
MS-
1762
3 14
5–14
7 14
6.0
1VA
0.
60
C14
<
125
um
sedi
men
t −
26.3
1,
300
n.a.
20
1,
238
0.29
Cre
amer
y-70
SW- 1
U
GA
MS-
1762
4 20
4–21
1 17
2.0
1LA
0.
00
C14
C
harc
oal
−26
.1
1,40
0 n.
a.
20
1,30
9 3.
64
Otto
/Sm
ith-1
n.
a.
0 0.
0 2V
A
1.00
G
S Su
rfac
e 20
06
n.a.
n.
a.
−56
1
−56
n.
a.
Otto
/Sm
ith-1
n.
a.
62.5
–67
.5
65.0
2V
A
0.68
C
s137
Fl
ood
sedi
men
t n.
a.
n.a.
−
13
10
−13
15
.15
Otto
/Sm
ith-1
n.
a.
204
204.
0 1/
2VA
0
or 1
C
OR
R
Top
of A
b ho
rizo
n n.
a.
n.a.
80
10
80
14
.93
Otto
/Sm
ith-1
U
GA
MS-
0160
2 30
8 30
8.0
1VA
0.
10
C14
C
harc
oal
−26
.24
3,11
0 n.
a.
60
3,30
9 0.
32
Riv
ersi
de-1
n.
a.
0 0.
0 2V
A
1.00
G
S Su
rfac
e 20
05
n.a.
n.
a.
−55
1
−55
n.
a.
Riv
ersi
de-1
n.
a.
40–4
5 42
.5
2VA
0.
65
Cs1
37
Floo
d se
dim
ent
n.a.
n.
a.
−13
10
−
12
9.90
R
iver
side
-1
n.a.
12
2 12
2.0
1/2V
A
0 or
1
CO
RR
To
p of
Ab
hori
zon
n.a.
n.
a.
80
10
80
8.70
Riv
ersi
de-1
U
GA
MS-
1039
3 14
2–14
4.5
143.
3 1V
A
0.82
C
14
<12
5 um
se
dim
ent
−24
.9
1,65
0 n.
a.
25
1,55
2 0.
14
Riv
ersi
de-1
U
GA
MS-
9709
14
2–14
4.5
143.
3 1V
A
0.82
C
14
Cha
rcoa
l in
silt
frac
tion
−26
.3
1,71
0 n.
a.
25
n.a.
n.
a.
Riv
ersi
de-1
U
GA
-09O
SL- 6
69
198–
202
200.
0 1V
A
0.34
O
SL
Sand
y lo
am
sedi
men
t n.
a.
n.a.
24
00
150
2,37
1 0.
70
Riv
ersi
de-1
U
GA
- 905
4 30
3–30
5 24
0.0
1LA
0.
00
C14
L
eaf
−26
.43
2,53
0 n.
a.
23
2,63
4 1.
52
Stile
s-1
n.a.
0
0.0
2VA
1.
00
CO
RR
So
il su
rfac
e in
20
09
n.a.
n.
a.
−59
1
−59
n.
a.
Stile
s-1
n.a.
15
15
.0
2VA
0.
73
Cs1
37
Floo
d se
dim
ent
n.a.
n.
a.
−13
10
−
13
3.26
(con
tinue
d)
8 Multi-millennial Record of Erosion and Fires in the Southern Blue Ridge…

182
Tabl
e 8.
3 (c
ontin
ued)
Stile
s-1
n.a.
55
55
.0
1/2V
A
0 or
1
CO
RR
To
p of
Ab
hori
zon
n.a.
n.
a.
80
10
80
4.27
Stile
s-1
UG
AM
S- 96
44
67–6
8 67
.5
1VA
0.
74
C14
<
125
um
sedi
men
t −
26.1
12
70
n.a.
20
1,
179
0.11
Stile
s-1
UG
AM
S- 96
35
99–1
01
100.
0 1V
A
0.08
C
14
Cha
rcoa
l −
26.1
2,
230
n.a.
25
2,
230
0.32
St
iles-
1 U
GA
MS-
1740
8 10
3–10
5 10
4.0
1VA
0.
00
C14
<
125
um
sedi
men
t −
26.9
2,
870
n.a.
25
2,
991
0.05
Stile
s-1
UG
AM
S- 12
165
111–
114
113.
0 1V
A
0.73
C
14
<12
5 um
se
dim
ent
−26
.69
4,42
0 n.
a.
25
5,01
1 0.
05
Stile
s-1
UG
AM
S- 17
625
129–
132
131.
0 1V
A
0.64
C
14
<12
5 um
se
dim
ent
−28
.3
5,96
0 n.
a.
25
6,79
1 0.
10
Stile
s-1
UG
AM
S- 12
164
219–
220
219.
5 1V
A
0.23
C
14
Woo
d −
29.1
4 9,
510
n.a.
30
10
,842
0.
22
Stile
s-1
UG
AM
S- 39
78
294
267.
5 1L
A
0.00
C
14
Nut
hul
l (u
ncar
b.)
−27
.4
9,85
0 n.
a.
30
11,2
44
1.20
Abb
revi
atio
ns:
1LA
pre
-set
tlem
ent
late
ral
accr
etio
n , 1
VA
pre
-set
tlem
ent
vert
ical
acc
reti
on,
1LA
pos
t-se
ttle
men
t la
tera
l ac
cret
ion,
2V
A p
ost-
sett
lem
ent
vert
ical
ac
cret
ion,
C14
rad
ioca
rbon
, C
s137
ces
ium
-137
, C
OR
R c
orre
lati
on,
GS
grou
nd s
urfa
ce,
OSL
opt
ical
ly s
tim
ulat
ed l
umin
esce
nce ,
n.a
. no
t ap
plic
able
, un
carb
. un
carb
oniz
ed
Site
Lab
#
Sam
ple
dept
h (c
m)
Plot
po
int
dept
h (c
m)
Uni
t &
faci
es
Frac
tion
of
VA
uni
t th
ickn
ess
(0 =
bot
tom
, 1
= to
p)D
atin
g m
etho
dM
ater
ial d
ated
Mat
eria
l is
otop
ic
del 13
C
14C
ye
ars
BP
Non
- 14C
ag
e es
timat
e ca
l. ye
ar
BP
±1
SD
Bes
t age
E
st. (
cal.
year
s B
P)
Inte
r-
sam
ple
rate
(m
m/
year
)
D.S. Leigh

183
col (Murray and Wintle 2000 ). The 125–250 μm quartz grains were dated following isolation by fl otation in sodium polytungstate and etching in hydrofl uoric acid. Light stimulation and emission readings were made with a RISØ® system according to the protocol specifi ed in Wang ( 2010 ).
The radioactive 137 Cs content of sediments was measured by gamma spectrome-try with an Ortec® digital spectrometer in the University of Georgia Geomorphology Laboratory, which is coupled to a 5 cm diameter high purity germanium crystal. Count times of 5,000–10,000 s were used to achieve analytical errors <10 %. The maximum content of 137 Cs in the sediment column was assumed to represent the year 1963 AD (Walling and He 1997 ). In several cases, the 1963 timeline was cor-roborated by the obvious presence of immediately overlying sandy fl ood deposits of the 1964 fl ood, which is the largest fl ood on record at the USGS gauge (#03500000) on the Upper Little Tennessee River near Prentiss, Tennessee, with records extend-ing from 1945 to present.
Additional correlation dating (age established for a particular feature or stratum in one place is equated to a similar feature or stratum in another place) was used at the State Line site to establish the age of the 1902 fl ood deposit based on knowledge from old newspaper accounts that the Tallulah Falls Railroad grade crossed the river from Georgia into North Carolina in 1906 AD. That is, the original railroad grade stands only 30–40 m from the radiocarbon dated stratigraphic section, and upon drilling through the artifi cial fi ll of the railroad grade there was only approximately 20 cm of post-settlement alluvium that was noted beneath the artifi cial fi ll dirt and atop the undisturbed buried A horizon of circa 1870 AD. In addition, a very sandy fl ood layer occurred at about 5 cm below the artifi cial fi ll, which therefore probably corresponds to the 1902 fl ood, which is the largest fl ood on record at another USGS gauge (#03507000) on the Upper Little Tennessee River at Judson that collected records from 1897 to 1944.
Charcoal was separated from the >125 μm fraction from all close-interval sam-ples at the Stiles-1 site to produce a time-series of charcoal accumulation rates (pieces per cm 2 per year) or CHAR (Higuera et al. 2009 ), incorporating the counts, bulk density, and sedimentation rates in a manner similar to that specifi ed by Higuera et al. ( 2009 ). Once the >125 μm fraction was sieved and dried, the charcoal particles were counted under a binocular microscope at 40× magnifi cation. Bulk density was measured by weighing selected oven-dried clods, sealing them with plastic spray paint, and immersing the samples in a graduated cylinder of water to determine the volume. Sedimentation rates were calculated by CLAM as described above and then incorporated into the calculation of CHAR.
8.4 Comparison of Pre- and Post-settlement Rates of Sedimentation
Results of age versus depth modeling and calculations of weighted mean values of long-term-average sedimentation rates from the 12 stratigraphic sections show that the post-settlement sedimentation rates were about an order of magnitude
8 Multi-millennial Record of Erosion and Fires in the Southern Blue Ridge…

184
faster than latest Holocene pre-settlement rates (Tables 8.3 and 8.4 ; Fig. 8.7 ). Pre- settlement rates generally are in the range from 0.1 to 1.0 mm per year, whereas post-settlement rates are in the range from 1 to 10 mm per year, and the median values of the weighted averages of each unit are 0.4 and 3.6 mm per year, respec-tively. A paired t -test indicates that the sedimentation rates at these 12 sites are sig-nifi cantly different (t-statistic of 4.29 and a one-tailed signifi cance level of 0.0006). The ratio of post-settlement to pre-settlement rates derived from individual sites ranged from 2.7 to 46.9 with a median value of 7.8 and a mean value of 12.9 (Table 8.4 ). Such disparity of pre- versus post-settlement rates is on par with areas of intensive past agriculture , such as the Upper Mississippi River valley region (Knox 2006 ) and the southern Piedmont (Happ 1945 ; Trimble 1974 , 1975 ), which is somewhat surprising given the mostly forested condition of the SBRM. However, the Blue Ridge topography is considerably more sloping than those regions, which probably facilitates comparable amounts of erosion and sedimentation.
There is a pronounced difference in both the sedimentation rates and thicknesses of post-settlement alluvium from tributary watersheds draining less than 65 km 2 versus those along the main channel of the Upper Little Tennessee River draining 146–319 km 2 . The mean of the long-term-average sedimentation rates of the seven smaller tributaries is 2.9 mm per year versus 9.4 mm per year from fi ve sites along the main channel; and the average post-settlement stratigraphic unit thickness of the tributaries is 41 cm versus 134 cm along the main channel. This disparity may be attributed to the fact that the tributaries have been exhibiting high rates of lateral migration and stream bank erosion since the early 1900s, whereas lateral migration of the main channel has been minimal (Leigh 2010 ). Such migration enhances sedi-ment concentrations downstream along the main channel because erosion of tribu-tary stream bank sediment is added to the hillslope-derived load. Also, the higher gradient of the tributary streams is more effective in transferring the sediment across the fl oodplain and further downstream than the lower-gradient main channel. Furthermore, the laterally migrating tributaries have established a new fl oodplain that inherently reduces vertical accretion rates on the historical terrace that contains much of the post-settlement alluvium. This uneven pattern of sediment erosion, transfer, and deposition adheres to the pattern that Knox ( 1987 , 2006 ) recognized in tributaries to the upper Mississippi River in southwestern Wisconsin and to Trimble’s ( 1993 ) ‘distributed sediment budget.’ Recent real-time observations of sediment concentrations in Upper Little Tennessee tributaries versus the main channel show the same sort of disparity (Rhett Jackson, pers. comm.). Although there are small, but similar, differences in tributary versus main channel sedimentation rates and thicknesses for the pre-settlement alluvium, they are nowhere near the same magni-tude of those observed in the post-settlement alluvium (Table 8.4 ).
Another important difference in pre-settlement versus post-settlement sedimen-tation rates (in cases where there are three or more age control points within each stratigraphic unit) is that the pre-settlement unit exhibits an exponential decline in sedimentation rates with time, which is the norm for most vertical accretion fl oodplain sediments (Bridge 2003 ), whereas the post-settlement unit exhibits a constant linear rate or even an exponential increase with time (Fig. 8.8 ). This is well
D.S. Leigh

185
Tabl
e 8.
4 B
asal
age
s, s
trat
igra
phic
uni
t th
ickn
ess,
wei
ghte
d av
erag
e se
dim
enta
tion
rate
s fo
r th
e en
tire
unit,
and
rat
ios
of p
ost-
settl
emen
t/pre
-set
tlem
ent
and
post
-196
3/18
70-1
963
sedi
men
tatio
n ra
tes
Site
nam
e
Bas
al a
ge o
f pr
e- se
ttlem
ent V
A
(cal
yea
rs B
P) a,
b, c
Po
st- s
ettle
men
t th
ickn
ess
(cm
) Pr
e- se
ttlem
ent
thic
knes
s (c
m)
Post
- set
tlem
ent
wei
ghte
d av
erag
e (m
m/y
ear)
Pre-
settl
emen
t w
eigh
ted
avg.
(m
m/y
ear)
Po
st-/
pre-
rat
io
of s
ed. r
ates
Po
st- 1
963/
1870
- 196
3 ra
tio o
f se
d. r
ates
Kee
ner-
1 1,
546
43
100
3.2
0.9
3.5
0.9
Kee
ner-
4 59
9 44
62
3.
2 1.
2 2.
7 n.
a.
Skee
nah-
2 1,
469
27
54
2.3
0.4
6.0
2.1
Skee
nah-
4 2,
494
40
72
1.6
0.4
4.0
n.a.
31
GH
457-
1 >
6,05
7 (a
t 14
%)
56
119
4.0
0.2
23.6
n.
a.
31G
H45
7-2
>>
3,40
1 (a
t 73
%)
37
148
2.7
0.1
22.3
n.
a.
Bra
ssto
wn-
20
1,81
1 40
59
3.
3 0.
3 9.
5 n.
a.
Stat
e L
ine-
1 1,
301
159
131
9.5
1.9
4.9
1.5
Cre
amer
y-70
SW- 1
1,
309
129
43
9.5
2.3
4.2
1.0
Otto
/Sm
ith-1
>
3,30
9 (a
t 10
%)
204
116
15.0
0.
3 46
.9
1.0
Riv
ersi
de-1
2,
634
122
118
9.1
0.9
10.4
1.
1 St
iles-
1 11
,244
55
21
3 4.
0 0.
2 16
.3
0.8
Med
ian.
=
50
108
3.6
0.4
7.8
1.0
Ave
rage
.=
80
103
5.6
0.8
12.9
1.
2 ±1
St.
Dev
. =
58
49
4.1
0.7
13.0
0.
5 T
ribu
tary
avg
. =
41
88
2.9
0.5
10.2
1.
5 M
ain
chan
nel
avg.
=
134
124
9.4
1.1
16.5
1.
1
a % r
efer
s to
the
perc
enta
ge o
f st
ratig
raph
ic th
ickn
ess
mea
sure
d up
war
d fr
om th
e ba
se o
f un
it b V
A is
the
abbr
evia
tion
for
vert
ical
acc
retio
n fa
cies
c >
indi
cate
s th
at a
bas
al a
ge w
as n
ot d
eter
min
ed
8 Multi-millennial Record of Erosion and Fires in the Southern Blue Ridge…

186
illustrated by the ratio of post-1963 to pre-1963 post-settlement sedimentation rates given that the median ratio is 1.0 and the average ratio is 1.2 (Table 8.4 ). This indicates that erosive processes of the deforested landscape have remained vigorous since the 1960s, even though much of the deforested land is covered in grasses and shrubs; this is consistent with the fi ndings of Miller et al. ( 2005 ) and suggestive that second home development and road/driveway construction is generating consider-able sediment. Lateral erosion of the tributaries also contributes to sustained sedi-ment supply to the main stem of the river. Alternatively, the sustained high rates of sedimentation post-1963 may indicate intrinsic mechanisms of the fl uvial system,
Fig. 8.7 Sedimentation rate plots for the 12 sites. Each site represents a profi le of vertical accre-tion fl oodplain sediments from stream valleys in the southern Blue Ridge Mountains (see Fig. 8.1 ) that accumulated over the past 3,500 years. Line ends and right-angle changes in line segments represent age control points
D.S. Leigh

187
namely stream bank erosion and natural levee progradation, so that when sample sites progressively become nearer to the channel due to lateral erosion, this closer proximity to the channel inherently favors faster sedimentation rates (Bridge 2003 ). However, the Keener-1, Skeenah-2, and Creamery-70mSW-1 sites are not situated on prograding levees, but they still exhibit post-1963 to pre-1963 ratios of about 0.9–2.1 (Table 8.4 ).
8.5 Natural Disturbance Expressed by Fluvial and Colluvial Sediment
Natural disturbances in the forested mountains typically are not obvious in terms of macro-stratigraphy and long-term-average sedimentation rates, unless a distinctive landslide or debris fl ow event is preserved in the stratigraphic record. Natural distur-bances in the Blue Ridge Mountains that produce recognizable sedimentary records primarily are driven by climatic variations that modulate mass wasting ; that is,
Fig. 8.8 Age-depth plots of the pre-settlement versus post-settlement units at the Riverside-1 and State Line-1 sites illustrating the progressively slower sedimentation rates (decreasing slopes of lines) with more recent age for the pre-settlement unit versus faster sedimentation with time (increasing slopes of lines) for the post-settlement unit. The square point on each plot represents the 1870 AD top of the buried A horizon
8 Multi-millennial Record of Erosion and Fires in the Southern Blue Ridge…
188
wet periods generate more mass wasting events ( landslides and debris fl ows) than dry periods (see Wooten et al. Chap. 9 ) and mass wasting releases huge volumes of sediment to the fl uvial system. In addition, wet periods may stimulate more lateral bank erosion (causing riparian forest disturbance) and thus increase sediment yield from erosion of terraced stream banks (Rogers and Leigh 2013 ).
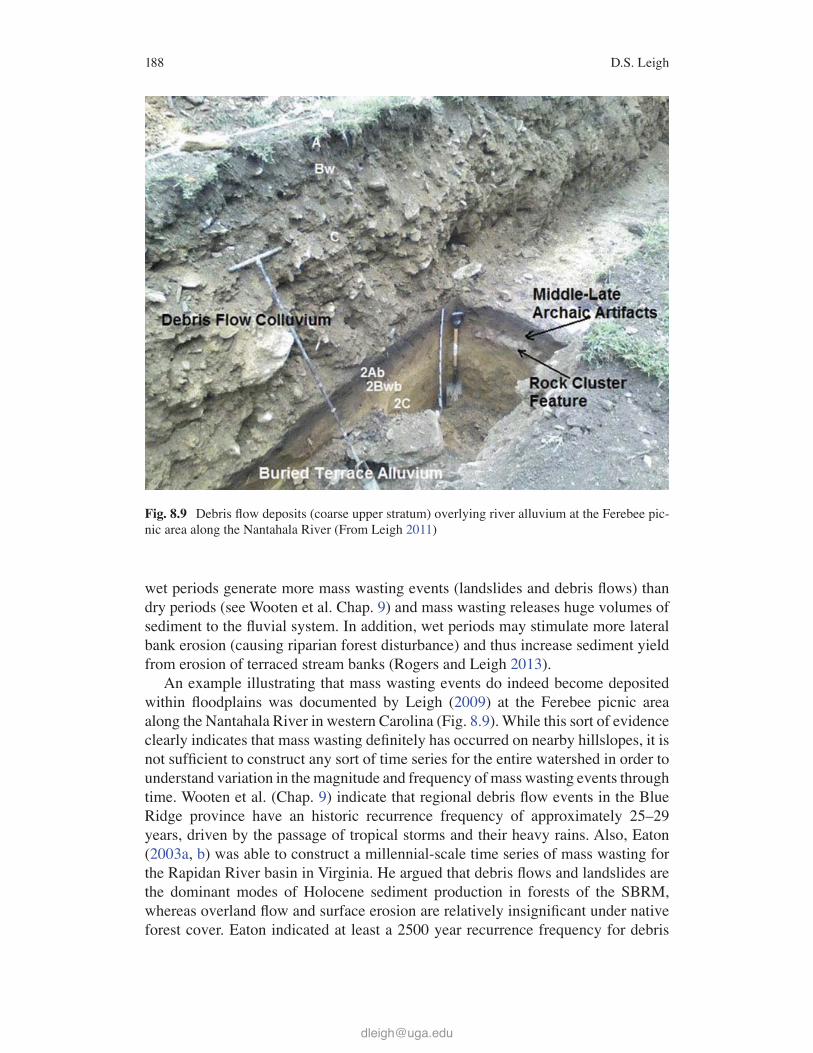
An example illustrating that mass wasting events do indeed become deposited within fl oodplains was documented by Leigh ( 2009 ) at the Ferebee picnic area along the Nantahala River in western Carolina (Fig. 8.9 ). While this sort of evidence clearly indicates that mass wasting defi nitely has occurred on nearby hillslopes, it is not suffi cient to construct any sort of time series for the entire watershed in order to understand variation in the magnitude and frequency of mass wasting events through time. Wooten et al. (Chap. 9 ) indicate that regional debris fl ow events in the Blue Ridge province have an historic recurrence frequency of approximately 25–29 years, driven by the passage of tropical storms and their heavy rains. Also, Eaton ( 2003a , b ) was able to construct a millennial-scale time series of mass wasting for the Rapidan River basin in Virginia . He argued that debris fl ows and landslides are the dominant modes of Holocene sediment production in forests of the SBRM, whereas overland fl ow and surface erosion are relatively insignifi cant under native forest cover. Eaton indicated at least a 2500 year recurrence frequency for debris
Fig. 8.9 Debris fl ow deposits (coarse upper stratum) overlying river alluvium at the Ferebee pic-nic area along the Nantahala River (From Leigh 2011 )
D.S. Leigh

189
fl ow activity within any individual tributary of the upper Rapidan catchment, although he was unable to relate debris fl ow frequency to Holocene paleoclimate drivers of variation in magnitude and frequency through time.
Broad inferences about mass wasting frequency in relation to late Pleistocene and Holocene fl uctuations in paleoclimate have been made in a few cases. Delcourt and Delcourt ( 2004 ) indicate that a marked reduction in fl uvial sediment supply to the lower Little Tennessee River valley occurred at some time between 7,800 and 4,000 years BP in response to a change in sediment fl ux from forested watersheds, largely related to mass wasting events. In support of their idea Leigh and Webb ( 2006 ) suggested that relatively fast footslope sedimentation rates during the early Holocene versus late Holocene possibly were driven by wetter paleoclimate condi-tions in the early Holocene. Such inferences are broad and somewhat speculative, but they have fi rm grounding in theory. That is, wetter climatic periods, especially those related to prolonged heavy rains associated with tropical storm events tend to trigger a higher frequency of landslides and debris fl ow s (Wooten et al. Chap. 9 ) that should be recognizable in the stratigraphic record. However, the temporal resolution needed to derive signifi cant variations in sedimentation rates through the Holocene is diffi cult and expensive to obtain because of the numerous samples required.
A modern example of sediment yield from forested watersheds in relation to climatic fl uctuations is provided by Simmons’ data set collected during the rela-tively wet 1970s (Simmons 1993 ) when compared to data collected from the same region (Fig. 8.4 ) during average or drier climatic periods (Coweeta LTER unpubl; Oblinger 2003 ). Oblinger ( 2003 ) observed that annual sediment concentrations and yields were an order of magnitude less during their relatively dry study period in 2001 compared to Simmons’ estimates from the relatively wet 1970s. In contrast, Simmons’ 1970s sediment yields are only slightly higher than those observed in water-year 2011 by researchers of the Coweeta LTER (Fig. 8.4 ), which was a slightly above average year in terms of wetness. Also, the sediment yields for the least disturbed watersheds (‘pristine’ forested watersheds of Simmons 1993 ) are very comparable to those fully forested sites observed in water year 2011 by the Coweeta LTER researchers.
A forward stepwise linear regression was applied to evaluate the combined sedi-ment yields of the three time periods mentioned above by using three independent variables or predictors: (1) percent nonforest cover values published in Simmons’ ( 1993 ) for the 1970s and tallies from the National Land Cover dataset for the 2001 and 2011 datasets for the Oblinger and Coweeta LTER data, respectively; (2) catchment drainage area; and (3) measured annual-mean runoff at the USGS Prentiss gauge (USGS #03500000) as an indicator of wetness. The wetness variable of annual-mean runoff essentially is a ‘dummy variable’ (values of 12.7 m 3 per second for the 1970s; 5.44 m 3 per second for 2001; and 8.97 m 3 per second for water year 2011). The results found all three independent variables to be highly signifi cant at probabil-ity levels less than 0.01 and the three-variable model explains 52.5 % of the variance in sediment yield values of the three combined data sets at a probability level of <0.001 and an F-statistic of 15.114 (Table 8.5 ). Drainage area explained the largest portion of variance (24 %), followed by the percent of non-forested land (15 %),
8 Multi-millennial Record of Erosion and Fires in the Southern Blue Ridge…

190
and then average runoff or wetness (13 %). The fact that drainage area was such a strong predictor is consistent with the observation above concerning the distributed sediment budget, because the dependent variable of sediment yield (tonnes per km 2 per year) is already normalized for contributing drainage area. Overall, the results indicate that the climatic ‘dummy variable’ is essentially as good a predictor as the percent of nonforest cover and reinforce the idea that subtle variations in climate can have a signifi cant infl uence on sediment yield. This is consistent with Knox’s ( 1993 ) observation that modest changes in climate can have a signifi cant infl uence on fl ood magnitude and frequency.
Little to no evidence of pre-settlement erosional forest disturbance can be dis-cerned from the 12 stratigraphic sites identifi ed in this paper. There are some minor variations in sedimentation rates at individual sites, but it is impossible to determine whether those were driven by intrinsic mechanisms of the fl uvial system or by extrinsic mechanisms, such as climate change. This result stems from the fact that it is very diffi cult to obtain the spatial and temporal resolution from long-term average sedimentation rates that allows discrimination of the ultimate drivers of natural for-est disturbance. Also, it is apparent from pollen records (Delcourt et al. 1986 ; Delcourt and Delcourt 1988 ) that forest cover has persisted throughout the Holocene (mostly deciduous with evergreens at high elevation ), so that vegetation (and prob-ably climate) did not vary enough to favor big changes in sediment yield and runoff. However, temporally continuous pollen records for the entire Holocene are lacking for the SBRM. Indeed, other places where large geomorphic variations have been noted are within ecotonal zones where pronounced shifts from grassland to forest have occurred (e.g., Knox 1983 ).
Table 8.5 Multiple linear regression model explaining 52.5 % of the variation in annual sediment yield of Blue Ridge Mountains streams
Variable Coeffi cient
t -test value of coeffi cient validity or signifi cance
Probability (ratio) that coeffi cient is invalid or not signifi cant
Proportion of variation explained (partial R 2 )
Y-intercept −77.903 −2.911 0.006 Not applicable x1: drainage basin size or area, DA (km 2 )
0.0187 2.926 0.006 0.241
x2: percent of basin that is not forested
1.891 3.6 <0.001 0.15
x3: annual average daily runoff from entire basin (m 3 /s)
8.425 3.971 <0.001 0.134
Total explained (total R 2 ) =
0.525
Model equation: Sediment yield (tonnes/km 2 /year) = −77.903 + (0.0187 * DA (km 2 )) + (1.891 * % Non-forest) + (8.425 * Runoff (m 3 /s)) Number of samples in the regression model = 43 F-statistic of overall model strength = 15.114 Standard error of estimate = 31.131 (t/km 2 /year) Shapiro-Wilk normality test score (which passed) = 0.624
D.S. Leigh

191
In summary, paleoclimatic changes in rainfall delivery that lead to increased soil wetness make hillslopes more susceptible to erosion (especially by mass wasting ) and are agents that theoretically should be refl ected in the stratigraphic record. However, in practice the scale of observation in the stratigraphic record, along with the medium to large watershed scale that derives sediment from many different tributaries, is generally too coarse to resolve climatically-driven disturbances. Only the most pronounced variations in sediment yield (driven largely by mass-wasting) are crudely discernable in the pre-settlement stratigraphic record.
8.6 Were Prehistoric Native Americans Agents of Hillslope Erosion ?
There is recent interest about the extent to which prehistoric Native Americans altered natural vegetation and environmental conditions. Abrams and Nowacki ( 2008 ) contend that indigenous land management affected vegetation ‘ubiquitously.’ In contrast it has been argued that indigenous impact varied widely with some regions exhibiting no discernable human impacts (Vale 2002 ). Most recently, Munoz et al. ( 2014 ) document the spatial pattern of the late prehistoric human impacts to be ‘localized and heterogeneous’ for eastern North America, and they challenge the idea that the prehistoric Native American’s impact on vegetation was widespread and ubiquitous. Instead, they argue that indigenous land use was patchy, including spatially varied niches of ‘undomesticated woodland management’ and agricultural land. Furthermore, they stress the idea that human impacts were tempo-rally dynamic.
Delcourt and Delcourt ( 1988 , 1997 , 1998 , 2004 ) and Delcourt et al. ( 1986 , 1998 ) advanced the idea that prehistoric Native American impacts on southern Appalachia were signifi cant, primarily in terms of managed silviculture that involved burning the understory of nut-bearing trees ( American chestnut ( Castanea dentata ), oak ( Quercus spp.), hickory ( Carya spp.)) and by cultivation of maize, squash and gourds ( Cucurbita spp.), beans ( Phaseolus spp.), and other crops. Forests are thought to have been disturbed and managed by Native Americans for edible mast as early as 4,000–5,000 years BP (Delcourt and Delcourt 2004 ). Cultivation of squash and gourds is known to have occurred as early as 5,200 years BP (Delcourt and Delcourt 2004 ), and widespread domestication and cultivation of goosefoot ( Chenopodium spp.) is known to have occurred by 3,500 years BP in eastern North America (Smith and Cowan 1987 ). Later, cultivation of maize is documented in the Little Tennessee River valley by 1,700 years BP, but it did not become a mainstay of the diet until 1,000 years BP (Delcourt and Delcourt 2004 ). Beans were introduced into the lower Little Tennessee valley at about 600 years BP (Delcourt and Delcourt 2004 ). In summary, indigenous silvicultural and agricultural activities in the Little Tennessee valley were established by at least 4,000–5,000 years BP and these activ-ities progressively increased though the late Holocene , culminating with widespread dependence on agriculture during the Mississippian cultural period circa 1,000–500 years BP.
8 Multi-millennial Record of Erosion and Fires in the Southern Blue Ridge…
192
The question is not whether indigenous people were managing and altering the ecosystem and vegetation patterns of the SBRM, but whether or not their use of the land was erosive enough to register ‘legacy sediment’ in stratigraphic sections. James ( 2011 ) provides a nice summary of indigenous land use patterns in the east-ern USA, and he concludes that indigenous practices were minimally destructive to soil and slope stability, as no mechanized methods were practiced (no plows, wheels, or metal tools) and agriculture was focused on fl at alluvial bottomlands. In stark contrast, Stinchcomb et al. ( 2011 ) promote the idea that indigenous people caused signifi cant erosion and bottomland sedimentation circa 1100–1600 AD and registered the fi rst ‘legacy sediment’ (sensu James 2013 ). They extrapolated their example of ‘pre-Colonial sediment’ from a tributary of the Delaware River valley to all of eastern North America, while acknowledging that “future research efforts should focus on mapping the chronological and geographic range.”
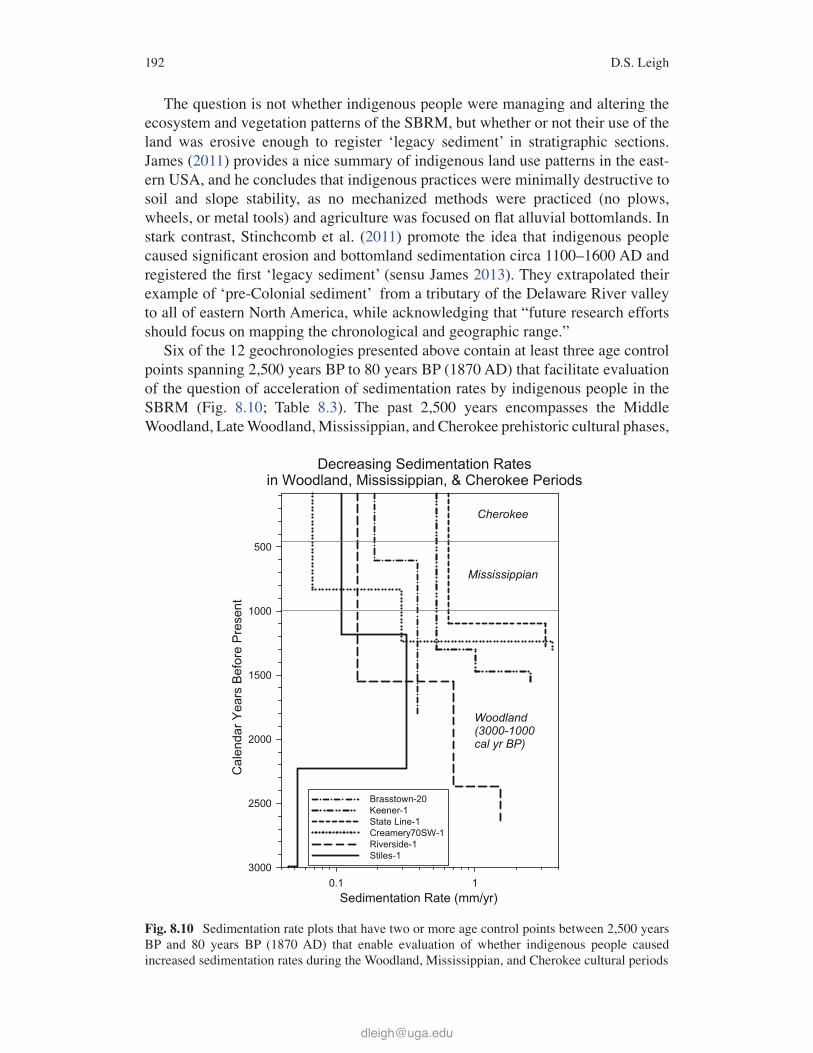
Six of the 12 geochronologies presented above contain at least three age control points spanning 2,500 years BP to 80 years BP (1870 AD) that facilitate evaluation of the question of acceleration of sedimentation rates by indigenous people in the SBRM (Fig. 8.10 ; Table 8.3 ). The past 2,500 years encompasses the Middle Woodland , Late Woodland, Mississippian, and Cherokee prehistoric cultural phases,
Fig. 8.10 Sedimentation rate plots that have two or more age control points between 2,500 years BP and 80 years BP (1870 AD) that enable evaluation of whether indigenous people caused increased sedimentation rates during the Woodland , Mississippian, and Cherokee cultural periods
D.S. Leigh

193
and during this time agricultural expansion is known to have occurred (Delcourt and Delcourt 2004 ), with maximum pre-settlement extent of cropland occurring during the Mississippian and Cherokee phases. Furthermore, the Upper Little Tennessee River valley is known to have been a hub of the prehistoric Cherokee culture (Hudson 2002 ). Results show that all six stratigraphic sections fail to indicate any increase in sedimentation rates during the Mississippian or Cherokee phases; in contrast, all six sections show a pronounced decrease in sedimentation rates from the Middle Woodland through Cherokee phases. Although the resolution of the dat-ing on these six sections is somewhat coarse, all six fail to support the idea that Mississippian or Cherokee peoples accelerated bottomland sedimentation rates. While lack of support does not mean that indigenous human-induced erosion and accelerated sedimentation did not happen anywhere, it does indicate that it was not prevalent enough to be commonly observed in the stratigraphic record like the post- settlement stratum.
The Stiles site shows an interesting increase in sedimentation rates at 2,230–1,179 years BP during the Middle Woodland period (Fig. 8.10 ; Table 8.3 ), but there-after a decrease is apparent. This Middle Woodland increase may be attributed to human agency, but on the other hand it is quite possible that it simply results from intrinsic shifting of the Upper Little Tennessee River. That is, the Stiles meander scar sedimentation site may have been far away from the active channel until 2,230 years BP when the active channel avulsed and shifted its position closer to the site (near it present position), thus automatically increasing the delivery of overbank sediments. The current position of the modern channel, and the fact that sedimenta-tion rates at the Stiles site decrease after 2,230 years BP, are consistent with this intrinsic mechanism. Also, it seems that if it were attributed to human agency, then the higher Middle Woodland sedimentation rates would have persisted into Mississippian and Cherokee periods.
The above example of intrinsic mechanisms causing change in fl uvial systems raises the point that, in addition to human agencies, there are other important drivers that can cause changes in fl uvial sedimentation rates, namely intrinsic channel shifting and climate change. Climate change is particularly germane to the discourse about indigenous land use infl uences on erosion and sedimentation. The Medieval Climate Anomaly (MCA, circa 800–1300 AD) and the Little Ice Age (LIA circa 1400–1800 AD) exhibited signifi cant shifts from relatively warm to cold climate conditions, respectively (Bradley and Jones 1995 ; Cronin et al. 2003 ; Grove and Switsur 1994 ), at exactly the time when indigenous agricultural land use was rap-idly expanding. Although such MCA temperature shifts have not been documented in the southeastern USA, Wang and Leigh ( 2012 ) noted signifi cant evidence (coarser sand sedimentology) of increased fl ood magnitudes in the Blue Ridge Mountains at the beginning and end of the MCA, but no changes in sedimentation rates were observed. They concluded that the Upper Little Tennessee valley may have been infl uenced by a relatively wet climate and large fl oods at the beginning and end of the MCA, circa 1,150–1,350 years BP and 650–900 years BP. Stinchcomb et al. ( 2011 ) acknowledged that global climate change associated with the transition from
8 Multi-millennial Record of Erosion and Fires in the Southern Blue Ridge…

194
the MCA to the LIA could have played a role in depositing their ‘pre-Colonial sediment,’ but they discounted that explanation and favored the interpretation of indigenous human-induced erosion.
In summary, no compelling evidence has been recovered in the SBRM to indi-cate that indigenous people caused accelerated erosion and increased alluvial sedi-mentation rates. Of course, there might be some localized areas of accelerated prehistoric bottomland sedimentation rates that were proximal to agricultural fi elds (which have yet to be found), but preliminary evidence suggests that relatively slow, or ‘natural,’ rates of sedimentation were normally occurring on river and stream bottomlands, despite signifi cant disturbance of the native forest in support of mast harvest, hunting, and agriculture during pre-settlement time. It is likely that most of the pre-settlement agricultural disturbance of the forest occurred in relatively low- gradient alluvial bottomlands where sediment erosion and transport was physically improbable. Furthermore, indigenous population densities probably were small enough to negate the need to expand agricultural fi elds on to steep hillslopes. Delcourt and Delcourt ( 2004 ) estimated (based on Baden’s 1987 model) that Mississippian population densities in the lower Little Tennessee River valley were 16–17 persons per km 2 for entire watersheds and 52–56 persons per km 2 if concen-trated over cultivated alluvial bottomlands. However, values of 16–17 persons per km 2 equates to the 1983 AD population density in Macon County , North Carolina , which suggests the Delcourt’s estimates for the Mississippian period may be high. Baden’s ( 1987 ) model indicated that minimum caloric needs for food required 0.1–0.6 ha per person. Using those values, even if 56 persons per km 2 of alluvial bot-tomland is assumed, then that equates to 1.8 ha of bottomland available per person (100 ha divided by 56 persons = 1.8 ha per person) or at least three times Baden’s ( 1987 ) presumed bottomland requirement for subsistence. Thus, one could contend that available bottomland was not a limiting factor for indigenous Mississippian and Cherokee agriculture, so they did not need to deforest and cultivate steep erosive hillslopes. Baden ( 1987 ) assumed that nutrient depletion was a key factor in the progressively decreasing productivity of agricultural lands, which ultimately lim-ited and depleted the soil resource. However, it is not clear whether he was considering nutrient replenishment from annual fl oods , weathering, and additions by humans. Indeed, Bartram speaks of the bottomlands in the Upper Little Tennessee River valley as appearing very fertile in 1775 AD.
8.7 Past Fires and Charcoal Records in Alluvium
Like many parts of the USA, suppression of human-ignited fi res has been the norm for the SBRM during the past century (see Grissino-Mayer Chap. 6 ). However, fi re routinely was used to clear land by early settlers during the 1700s and 1800s (Jurgelski 2008 ) and by Native Americans during pre-settlement times (Delcourt and Delcourt 2004 ) (also see Grissino-Mayer Chap. 6 ; Greenberg et al. Chap. 12 ). Bartram ’s 1775 travels (Van Doren 1928 ) through the SBRM describe many grassy
D.S. Leigh
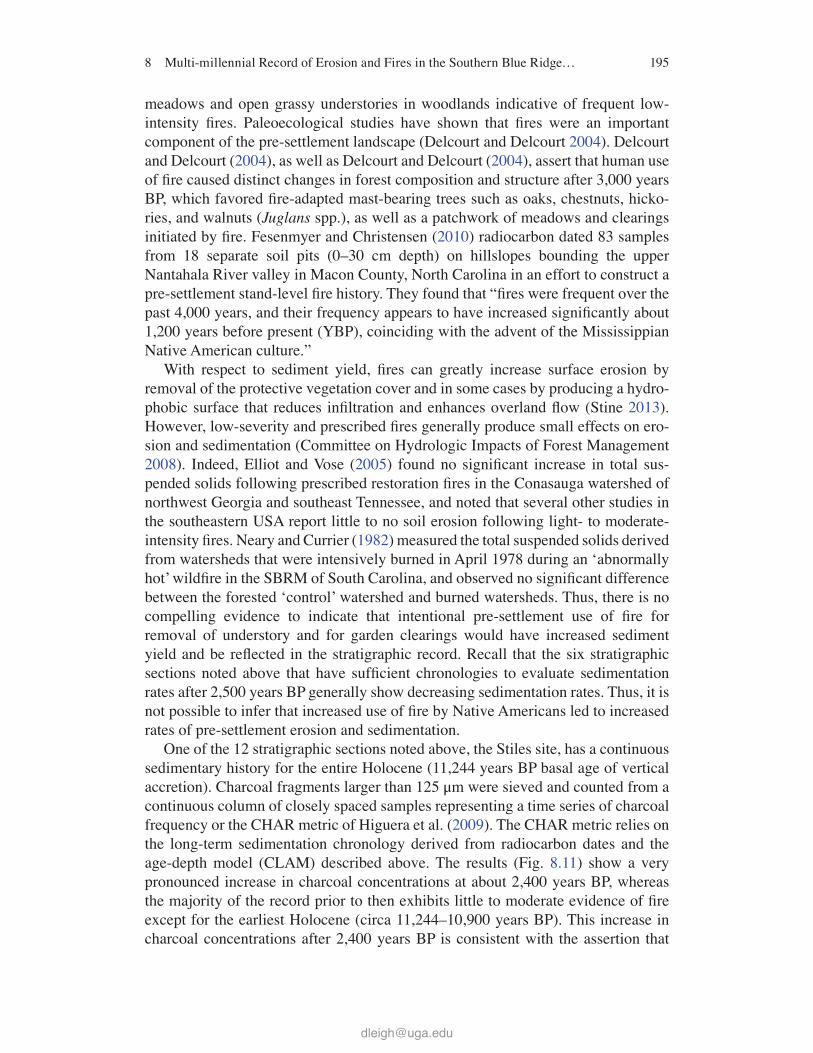
195
meadows and open grassy understories in woodlands indicative of frequent low- intensity fi res. Paleoecological studies have shown that fi res were an important component of the pre-settlement landscape (Delcourt and Delcourt 2004 ). Delcourt and Delcourt ( 2004 ), as well as Delcourt and Delcourt ( 2004 ), assert that human use of fi re caused distinct changes in forest composition and structure after 3,000 years BP, which favored fi re-adapted mast-bearing trees such as oaks, chestnuts, hicko-ries, and walnuts ( Juglans spp.), as well as a patchwork of meadows and clearings initiated by fi re. Fesenmyer and Christensen ( 2010 ) radiocarbon dated 83 samples from 18 separate soil pits (0–30 cm depth) on hillslopes bounding the upper Nantahala River valley in Macon County , North Carolina in an effort to construct a pre-settlement stand-level fi re history . They found that “fi res were frequent over the past 4,000 years, and their frequency appears to have increased signifi cantly about 1,200 years before present (YBP), coinciding with the advent of the Mississippian Native American culture.”
With respect to sediment yield, fi res can greatly increase surface erosion by removal of the protective vegetation cover and in some cases by producing a hydro-phobic surface that reduces infi ltration and enhances overland fl ow (Stine 2013 ). However, low-severity and prescribed fi res generally produce small effects on ero-sion and sedimentation (Committee on Hydrologic Impacts of Forest Management 2008 ). Indeed, Elliot and Vose ( 2005 ) found no signifi cant increase in total sus-pended solids following prescribed restoration fi res in the Conasauga watershed of northwest Georgia and southeast Tennessee , and noted that several other studies in the southeastern USA report little to no soil erosion following light- to moderate- intensity fi res. Neary and Currier ( 1982 ) measured the total suspended solids derived from watersheds that were intensively burned in April 1978 during an ‘abnormally hot’ wildfi re in the SBRM of South Carolina, and observed no signifi cant difference between the forested ‘control’ watershed and burned watersheds. Thus, there is no compelling evidence to indicate that intentional pre-settlement use of fi re for removal of understory and for garden clearings would have increased sediment yield and be refl ected in the stratigraphic record. Recall that the six stratigraphic sections noted above that have suffi cient chronologies to evaluate sedimentation rates after 2,500 years BP generally show decreasing sedimentation rates. Thus, it is not possible to infer that increased use of fi re by Native Americans led to increased rates of pre-settlement erosion and sedimentation.
One of the 12 stratigraphic sections noted above, the Stiles site, has a continuous sedimentary history for the entire Holocene (11,244 years BP basal age of vertical accretion ). Charcoal fragments larger than 125 μm were sieved and counted from a continuous column of closely spaced samples representing a time series of charcoal frequency or the CHAR metric of Higuera et al. ( 2009 ). The CHAR metric relies on the long-term sedimentation chronology derived from radiocarbon dates and the age-depth model (CLAM) described above. The results (Fig. 8.11 ) show a very pronounced increase in charcoal concentrations at about 2,400 years BP, whereas the majority of the record prior to then exhibits little to moderate evidence of fi re except for the earliest Holocene (circa 11,244–10,900 years BP). This increase in charcoal concentrations after 2,400 years BP is consistent with the assertion that
8 Multi-millennial Record of Erosion and Fires in the Southern Blue Ridge…
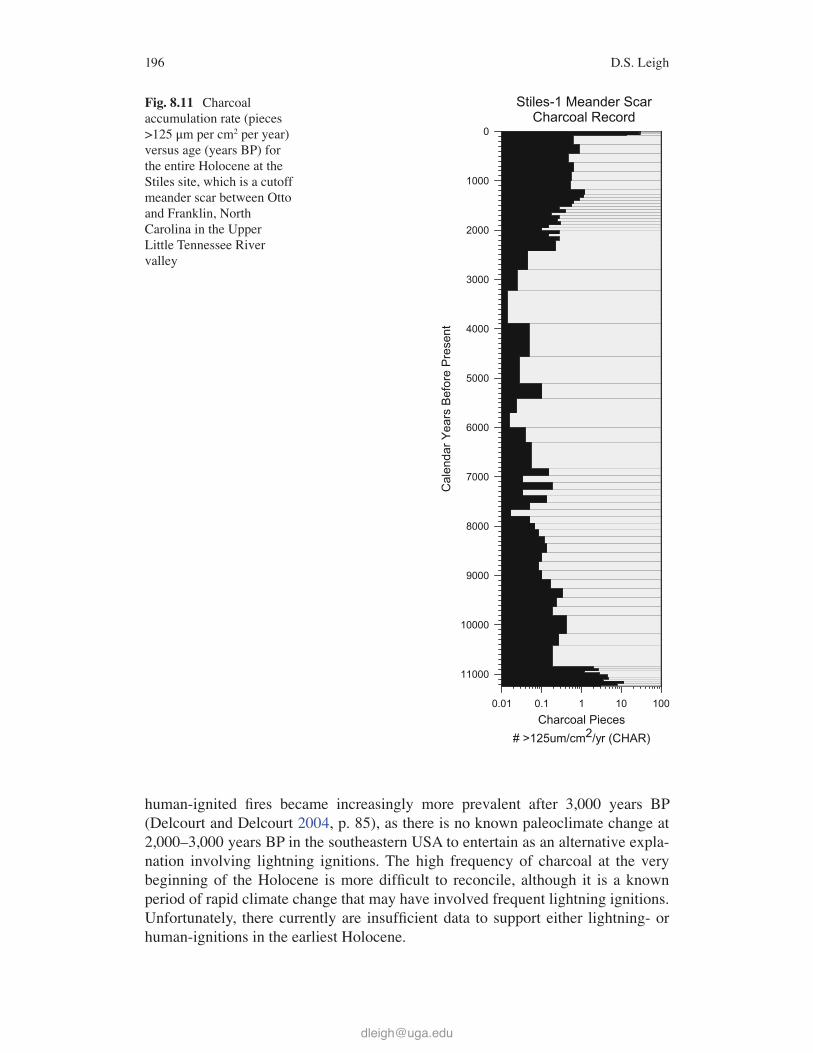
196
human-ignited fi res became increasingly more prevalent after 3,000 years BP (Delcourt and Delcourt 2004 , p. 85), as there is no known paleoclimate change at 2,000–3,000 years BP in the southeastern USA to entertain as an alternative expla-nation involving lightning ignitions. The high frequency of charcoal at the very beginning of the Holocene is more diffi cult to reconcile, although it is a known period of rapid climate change that may have involved frequent lightning ignitions. Unfortunately, there currently are insuffi cient data to support either lightning- or human-ignitions in the earliest Holocene.
Fig. 8.11 Charcoal accumulation rate (pieces >125 μm per cm 2 per year) versus age (years BP) for the entire Holocene at the Stiles site, which is a cutoff meander scar between Otto and Franklin, North Carolina in the Upper Little Tennessee River valley
D.S. Leigh

197
In summary, pre-settlement and post-settlement fi res have not been demonstrated to register distinct changes in sedimentation rates in the SBRM, and modern pre-scribed low-intensity burns do not appear to be erosive. The Stiles stratigraphic section confi rms that fi re was a defi nite component of the pre-settlement landscape , though unevenly through time, and it strongly suggests that fi res became much more frequent in association with expansion of agriculture during the Woodland and later prehistoric cultural periods as suggested by others. The charcoal record from the Stiles site reinforces the idea that stratigraphic chronologies of past fi re provide valuable insight about the importance of fi re in pre-settlement forests of the SBRM. However, when coupled with sedimentation rate analysis there is no indica-tion that forest fi res caused any signifi cant changes in hillslope erosion and bottom-land sedimentation rates.
8.8 Conclusions
In the SBRM, vertical accretion alluvium provides a coarse-resolution proxy for past erosional forest disturbance that clearly discriminates the end members of fully forested to approximately 30 % regional deforestation , as illustrated by pre-settle-ment versus post-settlement alluvial stratigraphic records. Post-settlement sedimen-tation rates are about one order of magnitude greater than pre-settlement rates (typically ranging from 1.0–10 mm per year versus 0.1–1.0 mm per year, respec-tively), and this is consistent with post- versus pre-settlement stratigraphy recog-nized nationally (Knox 2006 ) and even globally (Wilkinson and McElroy 2007 ). Clearly, the stratigraphy and sedimentation rates of the post-settlement alluvium provide a geologic and stratigraphic record in support of the newly proposed Anthropocene epoch (Crutzen 2002 ; Zalasiewicz et al. 2010 ). Under ‘natural’ conditions that are not mediated by humans, only the most pronounced variations in sediment yield (driven largely by mass-wasting) are crudely discerned in the pre-settlement stratigraphic record. Indigenous human impacts of soil erosion and changes in bottomland sedimentation rates are not recognizable in the pre- settlement stratigraphic record of the SBRM. However, the use of fi re for forest management and agricultural activities by Woodland , Mississippian, and Cherokee prehistoric cultures is apparent in the fl uvial stratigraphic record via charcoal preserved in the stratigraphic sections.
Acknowledgements Jake McDonald, Katie Price, James Rogers and Lixin Wang assisted with data collection, and Paul Webb and Bruce Idol of TRC-Environmental, Inc. facilitated data collec-tion at site 31GH457. Rhett Jackson provided water year 2011 sediment yield data from the Coweeta Long Term Ecological Research program (LTER). Much of this research was conducted in association with National Science Foundation Grants to the Coweeta LTER (awards DEB- 0823923, DEB-0218001) and grants from the University of Georgia Research Foundation, Inc. Jake McDonald and Katie Price provided useful editorial remarks on earlier drafts of this manu-script. Beverly Collins, Cathryn Greenberg and two anonymous reviewers provided useful remarks and changes that improved this manuscript. Much thanks is extended to landowners who granted permission to collect data.
8 Multi-millennial Record of Erosion and Fires in the Southern Blue Ridge…

198
References
Abrams, M. D., & Nowacki, G. J. (2008). Native Americans as active and passive promoters of mast and fruit trees in the eastern USA. The Holocene, 18 , 1123–1137.
Ambers, R. K. R., Druckenbrod, D. L., & Ambers, C. P. (2006). Geomorphic response to historical agriculture at Monument Hill in the Blue Ridge foothills of central Virginia. Catena, 65 , 49–60.
Ayers, H. B., & Ashe, W. W. (1905). The southern Appalachian forests (US Geological Survey professional paper, 37). Reston: US Geological Survey.
Baden, W. W. (1987) A dynamic model of stability and change in Mississippian agricultural systems . Dissertation, University of Tennessee.
Benedetti, M. M. (2003). Controls on overbank deposition in the upper Mississippi River. Geomorphology, 56 , 271–290.
Blaauw, M. (2010). Methods and code for ‘classical’ age-modelling of radiocarbon sequences. Quaternay Geochronology, 5 , 512.
Bradley, R. S., & Jones, P. D. (1995). Recent developments in studies of climate since AD1500. In R. S. Bradley & P. D. Jones (Eds.), Climate since AD 1500 (revised edn) . London: Routledge.
Bridge, J. S. (2003). Rivers and fl oodplains: Forms, processes, and sedimentary record . Malden: Blackwell.
Committee on Hydrologic Impacts of Forest Management. (2008). Hydrologic effects of a changing forest landscape . Washington, DC: National Academies Press.
Costa, J. E. (1975). Effects of agriculture on erosion and sedimentation in the Piedmont province, Maryland. Geological Society of America Bulletin, 86 , 1281–1286.
Cronin, T. M., Dwyer, G. S., Kamiya, T., Schwede, S., & Willard, D. A. (2003). Medieval warm period, Little Ice Age and 20th century temperature variability from Chesapeake Bay. Global and Planetary Change, 36 , 17–29.
Crutzen, P. J. (2002). The geology of mankind. Nature, 415 , 23–24. Delcourt, H. R., & Delcourt, P. A. (1988). Quaternary landscape ecology: Relevant scales in space
and time. Landscape Ecology, 2 , 23–44. Delcourt, H. R., & Delcourt, P. A. (1997). Pre-Columbian Native American use of fi re on southern
Appalachian landscapes. Conservation Biology, 11 , 1010–1014. Delcourt, P. A., & Delcourt, H. R. (1998). The infl uence of prehistoric human-set fi res on oak-
chestnut forests in the southern Appalachians. Castanea, 63 , 337–345. Delcourt, P. A., & Delcourt, H. R. (2004). Prehistoric Native Americans and ecological change:
Human ecosystems in eastern North America since the Pleistocene . Cambridge: Cambridge University Press.
Delcourt, P. A., Delcourt, H. R., Cridlebaugh, P. A., & Chapman, J. (1986). Holocene ethnobotanical and paleoecological record of human impact on vegetation in the Little Tennessee River Valley, Tennessee. Quaternary Research, 25 , 330–349.
Delcourt, P. A., Delcourt, H. R., Ison, C. R., Sharp, W. E., & Gremillion, K. J. (1998). Prehistoric human use of fi re, the Eastern Agricultural Complex and Appalachian oak-chestnut forests: Paleoecology of Cliff Palace Pond, Kentucky. American Antiquity, 63 , 263–278.
Eaton, L. S., Morgan, B. A., Kochel, C. R., & Howard, A. D. (2003a). Quaternary deposits and landscape evolution of the central Blue Ridge of Virginia. Geomorphology, 56 , 139–154.
Eaton, L. S., Morgan, B. A., Kochel, R. C., & Howard, A. D. (2003b). Role of debris fl ows in long- term landscape denudation in the Central Appalachians of Virginia. Geology, 31 , 339–342.
Elliot, K. J., & Vose, J. M. (2005). Initial effects of prescribed fi re on quality of soil solution and streamwater in the southern Appalachian Mountains. Sothern Journal Applied Forest, 29 , 5–15.
Fenneman, N. M. (1938). Physiography of eastern United States . New York: McGraw-Hill. Fesenmyer, K. A., & Christensen, N. L., Jr. (2010). Reconstructing Holocene fi re history in a
southern Appalachian forest using soil charcoal. Ecology, 91 , 662–670. Fuller, G. L. (1934). Charting the effects of erosion in the old plantation belt of the southern
Piedmont. Transactions American Geophysical Union, 15 (II), 495–500.
D.S. Leigh
199
Glenn LC (1911) Denudation and erosion in the southern Appalachian region and the Monongahela Basin. USGS Prof Pap 72, US Geol Surv, Reston
Grove, J. M., & Switsur, R. (1994). Glacial geological evidence for the Medieval Warm Period. Climate Change, 26 , 143–169.
Happ, S. C. (1945). Sedimentation in South Carolina Piedmont valleys. American Journal of Science, 243 , 113–126.
Hatcher, R. D., Jr. (1988). Bedrock geology and regional geologic setting of Coweeta Hydrologic Laboratory in the eastern Blue Ridge. In W. T. Swank & D. A. Crossley Jr. (Eds.), Forest hydrology and ecology at Coweeta (Ecological studies). New York: Springer.
Hewlett, J. D., Fortson, J. C., & Cunningham, G. B. (1977). The effect of rainfall intensity on storm fl ow and peak discharge from forest land. Water Resources Research, 13 , 259–265.
Higuera, P. E., Brubaker, L. B., Anderson, P. M., Hu, F. S., & Brown, T. A. (2009). Vegetation mediated the impacts of postglacial climate change on fi re regimes in the south central Brooks Range, Alaska. Ecological Monographs, 56 , 201–219.
Holmes, J. S. (1911). Forest conditions in western North Carolina (The North Carolina Geological and Economic Survey Bulletin, 23). Raleigh: Edwards and Broughton Printing.
Hudson, C. M. (2002). The transformation of the Southeastern Indians, 1540–1760 . Jackson: University Press of Mississippi.
Hupp, C. R., Noe, G. B., Schenk, E. R., & Benthem, A. J. (2013). Recent and historic sediment dynamics along Diffi cult Run, a suburban Virginia Piedmont stream. Geomorphology, 180 (181), 156–169.
Jackson, C. R., Martin, J. K., Leigh, D. S., & West, L. T. (2005). A southeastern Piedmont watershed sediment budget: Evidence for a multi-millennial agricultural legacy. Journal of Soil and Water Conservation, 60 , 3–3.
Jacobson, R. B., & Coleman, D. J. (1986). Stratigraphy and recent evolution of Maryland Piedmont fl ood plains. American Journal of Science, 286 , 617–637.
James, L. A. (2011). Contrasting geomorphic impacts of pre- and post-Columbian land-use changes in Anglo America. Physical Geography, 32 , 399–422.
James, L. A. (2013). Legacy sediment: Defi nitions and processes of episodically produced anthropogenic sediment. Anthropocene, 2 , 16.
Jurgelski, W. M. (2008). Burning seasons, burning bans: Fire in the southern Appalachian Mountains, 1750–2000. Appalachian Journal, 35 , 170.
Knighton, D. (1998). Fluvial forms and processes: A new perspective . New York: Arnold. Knox, J. C. (1972). Valley alluviation in southwestern Wisconsin. Annals of the Association of
American Geographers, 62 , 401–410. Knox, J. C. (1977). Human impacts on Wisconsin stream channels. Annals of the Association of
American Geographers, 67 , 323–342. Knox, J. C. (1983). Responses of river systems to Holocene climates. In H. E. Wright (Ed.), Late
quaternary environments of the United States, vol 2, the Holocene . Harlow Essex: Longman Group Ltd.
Knox, J. C. (1987). Historical valley fl oor sedimentation in the Upper Mississippi Valley. Annals of the Association of American Geographers, 77 , 224–244.
Knox, J. C. (1993). Large increases in fl ood magnitude in response to modest changes in climate. Nature, 361 , 430–432.
Knox, J. C. (2001). Agricultural infl uence on landscape sensitivity in the Upper Mississippi River Valley. Catena, 42 , 193–224.
Knox, J. C. (2006). Floodplain sedimentation in the Upper Mississippi Valley; Natural versus human accelerated. Geomorphology, 79 , 286–310.
Lecce, S. A. (1997). Spatial patterns of historical overbank sedimentation and fl oodplain evolution, Blue River, Wisconsin. Geomorphology, 18 , 265–277.
Lecce, S. A., & Pavlowsky, R. T. (2014). Floodplain storage of sediment contaminated by mercury and copper from historic gold mining at Gold Hill, North Carolina, USA. Geomorphology, 206 , 122–132.
8 Multi-millennial Record of Erosion and Fires in the Southern Blue Ridge…

200
Lecce, S., Pavlowsky, R., & Schlomer, G. (2008). Mercury contamination of active channel sediment and fl oodplain deposits from historic gold mining at Gold Hill, North Carolina, USA. Environmental Geology, 55 , 113–121.
Leigh, D. S. (1994). Mercury contamination and fl oodplain sedimentation from former gold mines in north Georgia. Journal of the American Water Resources Association, 30 , 739.
Leigh, D. S. (1996). Soil chronosequence of Brasstown Creek, Blue Ridge Mountains, USA. Catena, 26 , 99–114.
Leigh, D. S. (1997). Mercury-tainted overbank sediment from past gold mining in north Georgia, USA. Environmental Geology, 30 , 244–251.
Leigh, D. S. (2007). Human infl uence on fl oodplain sedimentation in the Upper Little Tennessee River Valley, Southern Blue Ridge Mountains, USA . Paper presented at the Annual Meeting of the Association of American Geographers, April 2007, San Francisco, CA.
Leigh, D. S. (2009). Geomorphic assessment of the Ferebee Memorial Park at “Bridge-3” along the Nantahala River, US Highway 74, Swain County, North Carolina. In T. Benyshek (Ed.), Archaeological deep testing and geomorphic study for the proposed replacement of Bridge 3 on US 19/74 across the Nantahala River . TIP B-4286 Addendum, Swain County, North Carolina. Submitted to NC Dept Transp, Offi ce of Hum Environ, 1583 Mail Service Center, Raleigh, North Carolina 27699, Submitted by: TRC Environmental Corp, Raleigh.
Leigh, D. S. (2010). Morphology and channel evolution of small streams in the southern Blue Ridge Mountains of western North Carolina. Southeastern Geographer, 50 , 397–421.
Leigh, D. S. (2011). Geomorphic assessment of Site 31GH457 near Bridge 117 along West Buffalo Creek, Graham County, North Carolina. Rep to TRC-Environmental, Raleigh, NC, In B. Idol (Ed.), Archaeological excavations at 31GH457 for the replacement of Bridge 117 on SR 1123 over West Buffalo Creek, Graham County, North Carolina . TIP B-4123, WBS Number 32572.1.1, NC Dept Transp Div 14, TRC Project 171390, TRC-Environmental Corp, Raleigh.
Leigh, D. S., & Rogers, J. C. (2007). Geomorphic analysis of stream channels in the southern Appalachian Highlands (University of Georgia Geomorphology Laboratory Technology Research Report, 3). Athens: University of Georgia.
Leigh, D. S., & Webb, P. A. (2006). Holocene erosion, sedimentation, and stratigraphy at Raven Fork, southern Blue Ridge Mountains, USA. Geomorphology, 78 , 161–177.
Lichtenstein, K. P. (2003). Historic sedimentation and allostratigraphy of the South Fork Broad River, northeast Georgia, United States . Thesis, University of Georgia.
Meade, R. H., Yuzyk, T. R., & Day, T. J. (1990). Movement and storage of sediment in rivers of the United States and Canada. In M. G. Wolman (Ed.), Surface water hydrology. The geology of North America (Vol. O-1). Boulder: Geological Society of America.
Miller, J. R., Lord, M., Yurkovich, S., Mackin, G., & Kolenbrander, L. (2005). Historical trends in sedimentation rates and sediment provenance, Fairfi eld Lake, western North Carolina. Journal of the American Water Resources Association, 41 , 1053–1075.
Munoz, S. E., Mladenoff, D. J., Schroeder, S., & Williams, J. W. (2014). Defi ning the spatial patterns of historical land use associated with the indigenous societies of eastern North America. Journal of Biogeography, 41 , 2195–2210.
Murray, A. S., & Wintle, A. G. (2000). Luminescence dating of quartz using an improved single- aliquot regenerative-dose protocol. Radiation Measurements, 32 , 57–73.
Neary, D. G., & Currier, J. B. (1982). Impact of wildfi re and watershed restoration on water quality in South Carolina’s Blue Ridge Mountains. Sothern Journal of Forestry, 6 , 81–90.
Oblinger, C. J. (2003). Suspended sediment and bed load in three tributaries to Lake Emory in the upper Little Tennessee River basin, North Carolina, 2000-02. US Geological (Water Resources Investigations Report, 03-4194). Raleigh: Survey.
Orbock, M. S., Ritter, D. F., Kochel, R. C., & Miller, J. R. (1993). Fluvial responses to land-use changes and climatic variations within the Drury Creek watershed, southern Illinois. Geomorphology, 6 , 309.
Price, K., & Leigh, D. S. (2006a). Morphological and sedimentological responses of streams to human impact in the southern Blue Ridge Mountains, USA. Geomorphology, 78 , 142–160.
D.S. Leigh
201
Price, K., & Leigh, D. S. (2006b). Comparative water quality of lightly- and moderately-impacted streams in the southern Blue Ridge Mountains, USA. Environmental Monitoring and Assessment, 120 , 269–300.
Reimer, P. J., Bard, E., Bayliss, A., Beck, J. W., Blackwell, P. G., Ramsey, C. B., Buck, C. E., Hai, C., Edwards, R. L., Friedrich, M., Grootes, P. M., Guilderson, T. P., Hafl idason, H., Hajdas, I., Hatté, C., Heaton, T. J., Hoffmann, D. L., Hogg, A. G., Hughen, K. A., & Kaiser, K. F. (2013). INTCAL13 and MARINE13 radiocarbon age calibration curves 0–50,000 years cal BP. Radiocarbon, 55 , 1869–1887.
Robinson, G. R., Jr. (1992). Bedrock geology and mineral resources of the Knoxville 1 ° × 2 ° quadrangle Tennessee, North Carolina, and South Carolina (US Geological Survey bulletin, 1979). Denver: US Geological Survey.
Rogers, J. C., & Leigh, D. S. (2013). Modeling stream-bank erosion in the southern Blue Ridge Mountains. Physical Geography, 34 , 354–372.
Ruhlman, M. B., & Nutter, W. L. (1999). Channel morphology evolution and overbank fl ow in the Georgia Piedmont. Journal of American Water Resources Association, 35 , 277–290.
Saxton, K. E., & Shiau, S. Y. (1990). Surface waters of North America; Infl uence of land and vegetation on streamfl ow. In M. G. Wolman (Ed.), The geology of North America (Vol. O-1, pp. 55–80). Boulder: Geological Society of America.
Simmons, C. E. (1993). Sediment characteristics of North Carolina streams, 1970–79 (US Geological Survey water-supply paper, 2364). Denver: US Geological Survey.
Smith, B. D., & Cowan, C. W. (1987). Domesticated Chenopodium in prehistoric eastern North America: New accelerator dates from eastern Kentucky. American Antiquity, 52 , 355–357.
Southworth, S., Schultz, A., Denenny, D., & Triplett, J. (2003). Surfi cial geologic map of the great smoky mountains National Park Region, Tennessee and North Carolina (Open fi le report, 03–081). Reston: US Geological Survey.
Stinchcomb, G. E., Messner, T. C., Driese, S. G., Nordt, L. C., & Stewart, R. M. (2011). Pre- colonial (AD 1100–1600) sedimentation related to prehistoric maize agriculture and climate change in eastern North America. Geology, 39 , 363–366.
Stine, M. B. (2013). Fire as a geomorphic agent. In J. Shroder, D. R. Butler, & C. R. Hupp (Eds.), Treatise on geomorphology, vol. 12, ecogeomorphology . San Diego: Academic.
Swift, L. W., Jr., Cunningham, G. B., & Douglass, J. E. (1988). Climatology and hydrology. In W. T. Swank & D. A. Crossley Jr. (Eds.), Forest hydrology and ecology at Coweeta (Ecological studies, Vol. 66). New York: Springer.
Thigpen, J. R., & Hatcher, R. D. (2009). Geologic map of the western Blue Ridge and portions of the eastern Blue Ridge and Valley and Ridge Provinces in southeast Tennessee, southwest North Carolina, and northern Georgia (Map and chart series (Geological Society of America) product code, MCH097F). Boulder: Geological Society of America. http://ngmdb.usgs.gov/Prodesc/proddesc_87098.htm
Thornbury, W. D. (1965). Regional geomorphology of the United States . New York: Wiley. Trimble, S. W. (1974). Man-induced soil erosion on the southern Piedmont, 1700–1970 . Ankeny:
Soil Conservation Society of America. Trimble, S. W. (1975). A volumetric estimate of man-induced erosion on the southern Piedmont.
USDA, Agricultural Research Service Publication, S40 , 142–145. Trimble, S. W. (1993). The distributed sediment budget model and watershed management in the
Paleozoic Plateau of the upper Midwestern United-States. Physical Geography, 14 , 285–303. Vale, T. R. (2002). The pre-European landscape of the United States: Pristine or humanized? In
T. R. Vale (Ed.), Fire, native peoples, and the natural landscape . Washington, DC: Island Press.
Van Doren, M. (1928). The travels of William Bartram . New York: Dover Publications. Walling, D. E. (1987). Rainfall, runoff and erosion of the land: A global view. In K. J. Gregory
(Ed.), Energetics of physical environment . New York: Wiley. Walling, D. E. (1999). Linking land use, erosion and sediment yields in river basins. Hydrobiologia,
410 , 223–240.
8 Multi-millennial Record of Erosion and Fires in the Southern Blue Ridge…

202
Walling, D. E., & He, Q. (1997). Use of fallout (super 137) Cs in investigations of overbank sediment deposition on river fl oodplains. Catena, 29 , 263–282.
Wang, L. (2010). Anthropic signatures and paleofl oods in alluvium of the upper Little Tennessee River valley, southern Blue Ridge Mountains . Thesis, University of Georgia.
Wang, L., & Leigh, D. S. (2012). Late-Holocene paleofl oods in the Upper Little Tennessee River valley, southern Blue Ridge Mountains, USA. Holocene, 22 , 1061.
Wilkinson, B. H., & McElroy, B. J. (2007). The impact of humans on continental erosion and sedimentation. Geological Society of America Bulletin, 119 , 140–156.
Zalasiewicz, J., Williams, M., Steffen, W., & Crutzen, P. (2010). The new world of the Anthropocene. Environmental Science and Technology, 44 , 2228–2231.
D.S. Leigh