Embed Size (px)
Citation preview

TCD6, 531–561, 2012
Multi-decadal marineand land-terminating
glacier recession
S. H. Mernild et al.
Title Page
Abstract Introduction
Conclusions References
Tables Figures
J I
J I
Back Close
Full Screen / Esc
Printer-friendly Version
Interactive Discussion
Discussion
Paper
|D
iscussionP
aper|
Discussion
Paper
|D
iscussionP
aper|
The Cryosphere Discuss., 6, 531–561, 2012www.the-cryosphere-discuss.net/6/531/2012/doi:10.5194/tcd-6-531-2012© Author(s) 2012. CC Attribution 3.0 License.
The CryosphereDiscussions
This discussion paper is/has been under review for the journal The Cryosphere (TC).Please refer to the corresponding final paper in TC if available.
Multi-decadal marine andland-terminating glacier recession in theAmmassalik region, Southeast Greenland
S. H. Mernild1, J. K. Malmros2, N. T. Knudsen3, and J. C. Yde4
1Climate, Ocean, and Sea Ice Modeling Group, Los Alamos National Laboratory,New Mexico, USA2Department of Geography and Geology, University of Copenhagen, Denmark3Department of Geoscience, Aarhus University, Aarhus, Denmark4Sogn og Fjordane University College, Sogndal, Norway
Received: 26 January 2012 – Accepted: 28 January 2012 – Published: 7 February 2012
Correspondence to: S. H. Mernild ([email protected])
Published by Copernicus Publications on behalf of the European Geosciences Union.
531

TCD6, 531–561, 2012
Multi-decadal marineand land-terminating
glacier recession
S. H. Mernild et al.
Title Page
Abstract Introduction
Conclusions References
Tables Figures
J I
J I
Back Close
Full Screen / Esc
Printer-friendly Version
Interactive Discussion
Discussion
Paper
|D
iscussionP
aper|
Discussion
Paper
|D
iscussionP
aper|
Abstract
Landsat imagery was applied to elucidate glacier fluctuations of land and marine ter-minating outlet glaciers from the Greenland Ice Sheet (GrIS) and local land terminatingglaciers and ice caps (GIC) peripheral to the GrIS in the Ammassalik region, SoutheastGreenland, during the period 1972–2011. Data from 21 marine-terminating glaciers5
– including the glaciers Helheim, Midgaard, and Fenris –, the GrIS land-terminatingmargin, and 35 GIC were examined, and compared to observed atmospheric air tem-peratures, precipitation, and reconstructed ocean water temperatures. Here, we doc-ument that net glacier recession has occurred since 1972 in the Ammassalik regionfor all glacier types and sizes, except for three GIC; however, the land-terminating;10
however, the land-terminating GrIS and GIC reflect lower marginal and areal changesthan the marine-terminating outlet glaciers. The mean annual land-terminating GrISand GIC margin recessions were about 3 to 5 times lower than the GrIS marine-terminating values. The marine-terminating outlet glaciers had an average net frontalretreat for 1999–2011 of 0.098 km yr−1, which was significantly higher than in previ-15
ous sub-periods 1972–1986 and 1986–1999. For the marine-terminating GrIS theannual areal recession rate was decreasing since 1972, while increasing for the land-terminating GrIS since 1986. On average for the GIC a net frontal retreat for 1986–2011of 0.010±0.006 km yr−1 and a mean areal recession of around 1 % per year occurred(overall 27±24 %). Since 1986, five GIC melted away in the Ammassalik area, and one20
would therefore expect that GIC might melt substantially within the 21st century underongoing climate warming.
1 Introduction
The Greenland Ice Sheet (GrIS) – land- and marine-terminating outlet glaciers onthe periphery of the GrIS – and local land-terminating glaciers and ice caps (GIC)25
532

TCD6, 531–561, 2012
Multi-decadal marineand land-terminating
glacier recession
S. H. Mernild et al.
Title Page
Abstract Introduction
Conclusions References
Tables Figures
J I
J I
Back Close
Full Screen / Esc
Printer-friendly Version
Interactive Discussion
Discussion
Paper
|D
iscussionP
aper|
Discussion
Paper
|D
iscussionP
aper|
peripheral to the GrIS have undergone rapid changes over the last decades. Most no-table changes are thinning, leading to destabilization and accelerated retreat of GrISmarine-terminating glaciers (Joughin et al., 2004, 2010; Howat et al., 2005, 2008;Rignot and Kanagaratnam, 2006; Moon and Joughin, 2008; Nick et al., 2009), andincreasing mass loss, thinning, and retreat of land-terminating GIC (Yde and Knudsen,5
2007; Mernild et al., 2011a; Radic and Hock 2011).The underlying mechanisms of GrIS marine-terminating glacier dynamics remain un-
clear (Straneo et al., 2010; Johannessen et al., 2011). The thinning and frontal reces-sion are likely due to changes in oceanic warm subsurface waters and atmosphericwarming, where warm subsurface waters are suggested by Luthcke et al. (2006),10
Velicogna and Wahr (2006), Holland et al. (2008), van den Broeke et al. (2009),Velicogna (2009), Murray et al. (2010), Rignot et al. (2010), Straneo et al. (2010),Andresen et al. (2011) to play a significant role, as well as to penetration of snow andice melt water to the glacier bed influencing the GrIS sliding and dynamic processes(Johannessen et al., 2011). The mechanisms suggested for land-terminating GIC re-15
cession are less complex. In the Ammassalik region, Southeast Greenland, studiesof GIC have shown that mass loss and margin retreat have been driven mainly byhigher surface temperatures (increasing surface ablation) and decreasing precipitation(decreasing snow accumulation) since the mid-1900s (Mernild et al., 2011a).
Despite the importance of glacier contribution to sea-level rise, Greenland marine-20
terminating glaciers have been sparsely analyzed by satellite and direct glaciologi-cal observations. Howat and Eddy (2011) have identified changes in ice-frontal po-sitions from 210 GrIS marine-terminating glaciers with fronts wider than 1 km (span-ning nearly four decades, 1972–2010). These results show a trend of acceler-ated recession, where 90 % of the observed glaciers receded between 2000 and25
2010. Box and Decker (2011) identified areal changes at 39 of the widest Green-land marine-terminating glacier (2000–2010). Collectively, the 39 glaciers lost a cu-mulative area of 1368 km2. For the Ammassalik region, including the Sermilik Fjord(the largest fjord system in Southeast Greenland), only frontal changes of major GrIS
533

TCD6, 531–561, 2012
Multi-decadal marineand land-terminating
glacier recession
S. H. Mernild et al.
Title Page
Abstract Introduction
Conclusions References
Tables Figures
J I
J I
Back Close
Full Screen / Esc
Printer-friendly Version
Interactive Discussion
Discussion
Paper
|D
iscussionP
aper|
Discussion
Paper
|D
iscussionP
aper|
marine-terminating glaciers, such as Helheim, Fenris, and Midgaard glaciers, havebeen observed; however at least 21 marine-terminating glaciers have been identified(Fig. 1).
For the land-terminating GIC in Greenland, margin retreat has been sparsely ob-served, and the only currently published time series of whole-glacier in-situ mass bal-5
ance observations (since 1995/1996) is from the Mittivakkat Gletscher, located in theAmmassalik region (WGMS, 2009; Mernild et al., 2011a), even though thousands of in-dividual GIC are located in the land-strip between the GrIS and ocean, of which severalof hundreds are situated in the Ammassalik region (Mernild et al., 2012b). Thus, thereis a need for more information about contemporary glacier fluctuations of Greenlandic10
GIC and their coupling to climate change.The ability to assess GrIS and GIC margin changes in e.g., the Ammassalik region
has been improved through the use of Landsat imagery going back to 1972. Theimagery gives us the possibility to illustrate “snapshots” and the averaged behavior ofglacier changes for the past four decades for the identified marine-terminating glaciers,15
the GrIS land-terminating margin, and the GIC during a period of climate warming. Theaverage multi-decadal glacier resession in the Ammassalik region (65◦ N, 37◦ W), wasexamined, rather than the annual range of variability, even though recent observationssuggest that major changes in the dynamics of Greenland marine-terminating glacierstake place over timescales of 3–10 yr (Howat et al., 2007; Nick et al., 2009; Andresen20
et al., 2011; Johannessen et al., 2011), rather than over several decades or centuriesas previously believed (Truffer and Fahnestock, 2007).
Here, we examine net frontal position and area fluctuations of 21 marine-terminatingglaciers, land-terminating glacier frontal positions for parts of the GrIS, and of 35 GICon approximately decadal scale for the Ammassalik region (a region including the ther-25
modynamic transition zone from the North Atlantic Ocean into the Arctic Ocean throughthe Denmark Strait), during the last four decades (1972–2011) using multi spectralLandsat satellite imagery data. Changes were considered in the context of meteoro-logical observations and reconstructed ocean water temperatures time series. As part
534
TCD6, 531–561, 2012
Multi-decadal marineand land-terminating
glacier recession
S. H. Mernild et al.
Title Page
Abstract Introduction
Conclusions References
Tables Figures
J I
J I
Back Close
Full Screen / Esc
Printer-friendly Version
Interactive Discussion
Discussion
Paper
|D
iscussionP
aper|
Discussion
Paper
|D
iscussionP
aper|
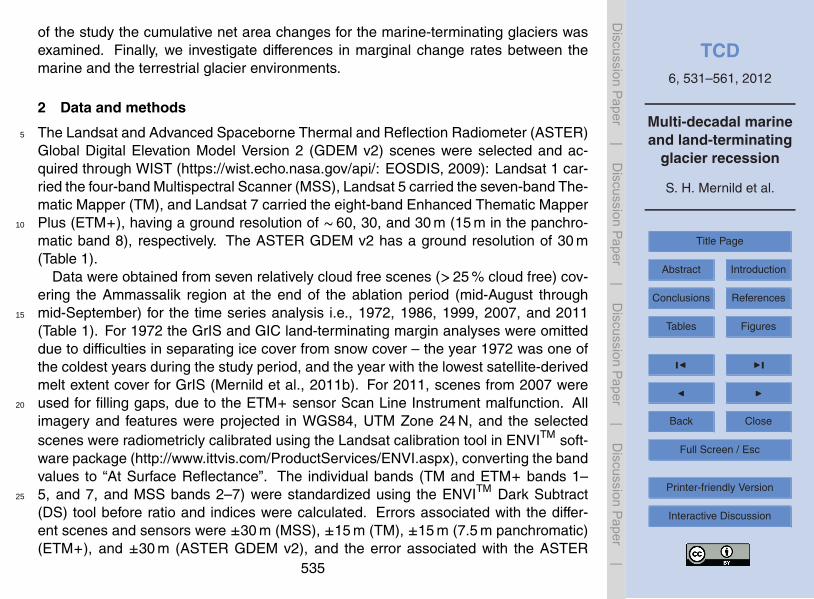
of the study the cumulative net area changes for the marine-terminating glaciers wasexamined. Finally, we investigate differences in marginal change rates between themarine and the terrestrial glacier environments.
2 Data and methods
The Landsat and Advanced Spaceborne Thermal and Reflection Radiometer (ASTER)5
Global Digital Elevation Model Version 2 (GDEM v2) scenes were selected and ac-quired through WIST (https://wist.echo.nasa.gov/api/: EOSDIS, 2009): Landsat 1 car-ried the four-band Multispectral Scanner (MSS), Landsat 5 carried the seven-band The-matic Mapper (TM), and Landsat 7 carried the eight-band Enhanced Thematic MapperPlus (ETM+), having a ground resolution of ∼ 60, 30, and 30 m (15 m in the panchro-10
matic band 8), respectively. The ASTER GDEM v2 has a ground resolution of 30 m(Table 1).
Data were obtained from seven relatively cloud free scenes (>25 % cloud free) cov-ering the Ammassalik region at the end of the ablation period (mid-August throughmid-September) for the time series analysis i.e., 1972, 1986, 1999, 2007, and 201115
(Table 1). For 1972 the GrIS and GIC land-terminating margin analyses were omitteddue to difficulties in separating ice cover from snow cover – the year 1972 was one ofthe coldest years during the study period, and the year with the lowest satellite-derivedmelt extent cover for GrIS (Mernild et al., 2011b). For 2011, scenes from 2007 wereused for filling gaps, due to the ETM+ sensor Scan Line Instrument malfunction. All20
imagery and features were projected in WGS84, UTM Zone 24 N, and the selectedscenes were radiometricly calibrated using the Landsat calibration tool in ENVITM soft-ware package (http://www.ittvis.com/ProductServices/ENVI.aspx), converting the bandvalues to “At Surface Reflectance”. The individual bands (TM and ETM+ bands 1–5, and 7, and MSS bands 2–7) were standardized using the ENVITM Dark Subtract25
(DS) tool before ratio and indices were calculated. Errors associated with the differ-ent scenes and sensors were ±30 m (MSS), ±15 m (TM), ±15 m (7.5 m panchromatic)(ETM+), and ±30 m (ASTER GDEM v2), and the error associated with the ASTER
535

TCD6, 531–561, 2012
Multi-decadal marineand land-terminating
glacier recession
S. H. Mernild et al.
Title Page
Abstract Introduction
Conclusions References
Tables Figures
J I
J I
Back Close
Full Screen / Esc
Printer-friendly Version
Interactive Discussion
Discussion
Paper
|D
iscussionP
aper|
Discussion
Paper
|D
iscussionP
aper|
GDEM v2 is expected to be ∼±12.5 m vertically (Table 1) (Tachikawa et al., 2011).The classification process used for the 1986, 1999, and 2011 scenes was based
on a multi-criteria analysis involving the calculation of a set of indices: normalizeddifference snow index (NDSI; Dozier and Warren, 1982), normalized difference waterindex (NDWI; Gao, 1996), NDVI (normalized difference vegetation index; Rouse, 1973),5
and RATIO bands 3/5 TM/ETM+. The RATIO was added due to better performancethan the NDSI index in mountainous areas (like the Ammassalik region) capturing iceand snow covered areas influenced by shadows (Paul, 2004). The NDVI was usedto filter out vegetation and the NDWI to identify and filter out lakes in the margin areaof the GrIS and GIC. The resulting classifications were converted to: (1) polygon files10
and cleaned up manually in ESRITM ArcMap by visual inspection; (2) poly-line files forvisual presentation; and (3) to point shapes with a 30-m distribution along the linesand used to examine the mean and median center of the margin distribution for eachyear. The 1972-scene was not included in the classification process since the spectralbands of the Landsat 1 MSS sensor used different wavelengths and band distribution15
than both the TM and ETM+ sensors.The GrIS and GIC margin positions were digitized for each of the years and the
distance between the margins were calculated at the dominant glacier’s flow directionusing the centerline method (Howat and Eddy, 2011). The expected error related toboth the classification and determination of the glacier margin positions closely follows20
the precision error mentioned in Table 1.The observed meteorological data, air temperature and precipitation, were obtained
from the Danish Meteorological Institute (DMI) station in Tasiilaq for 1972–2011, lo-cated less than 10 km from the Sermilik Fjord outlet.
536

TCD6, 531–561, 2012
Multi-decadal marineand land-terminating
glacier recession
S. H. Mernild et al.
Title Page
Abstract Introduction
Conclusions References
Tables Figures
J I
J I
Back Close
Full Screen / Esc
Printer-friendly Version
Interactive Discussion
Discussion
Paper
|D
iscussionP
aper|
Discussion
Paper
|D
iscussionP
aper|
3 Results and discussion
3.1 Marine-terminating glaciers
For the Ammassalik region, the 21 observed marine-terminating glaciers on averagefor the survey period 1972–2011 receded at a net rate of 0.053±0.113 km yr−1(hereand below, the ± standard deviation are included) with a median of 0.025 km yr−1 (Ta-5
ble 2). For 1999–2011, the mean net recession rate was 0.098±0.171 km yr−1, whichis in accordance with the mean net recession rate of 0.11 km yr−1 for 210 GrIS marine-terminating outlet glaciers (2000–2010) determined by Howat and Eddy (2011). Forthe sub-periods the fraction of marine-terminating glaciers in net recession increasedfrom 57 % (1972–1986), 86 % (1986–1999), to 100 % (1999–2011), indicating com-10
plete marine-terminating glacier retreat for the Ammassalik region since 1999. ForSoutheast Greenland, Howat and Eddy (2011) estimated an increasing fraction of netretreat from 55 % (1972–1985), 73 % (1985–2000), to 89 % (2000–2010) (n= 38). Forthe last period, this was almost in the same order of magnitude as the fraction of glacierrecession determined for the Ammassalik region.15
On individual glacier scale, the glaciers Midgaard, Helheim, Tasis Sassik Fjord,Heims, and Fenris had the first-, second-, third-, fourth-, and fifth-highest net recessionrates of 0.365 km yr−1 (this equals a net frontal recession of 14.3 km), 0.155 km yr−1
(6.0 km), 0.130 km yr−1 (5.1 km), 0.075 km yr−1 (2.8 km), and 0.065 km yr−1 (2.6 km),respectively (Fig. 2) for 1972–2011. All five glaciers are outlets from the GrIS receiving20
ice from the interior of the ice sheet, having the largest GrIS catchment areas within theAmmassalik region. Overall for the Ammassalik region, 80 % of the marine-terminatingglaciers receded at rates less than 0.050 km yr−1(Fig. 2). The mean net recession ratesduring the period 1972–2011 for the glaciers Midgaard, Helheim, and Fenris comparedwell with the recession rates determined by Howat and Eddy (2011) for 1972–2010.25
For the sub-periods, the 21 observed marine-terminating glaciers had mean frontalrecession rates of 0.031±0.056 and 0.029±0.060 km yr−1 for 1972–1986 and 1986–1999, respectively (significant similar, 97.5 % quartile). For 1999–2011, the mean
537

TCD6, 531–561, 2012
Multi-decadal marineand land-terminating
glacier recession
S. H. Mernild et al.
Title Page
Abstract Introduction
Conclusions References
Tables Figures
J I
J I
Back Close
Full Screen / Esc
Printer-friendly Version
Interactive Discussion
Discussion
Paper
|D
iscussionP
aper|
Discussion
Paper
|D
iscussionP
aper|
recession rate increased to 0.098±0.171 km yr−1, which was significantly higher (95 %quartile) than the two previous sub-periods, and about 3.2 times higher than the 1972–1986 rate. The same trend occurred for the median recession rates, where the 1999–2011 rate was 5.4 times higher than for 1972–1986 (Table 2). The high mean ratesfor 1999–2011 were mainly due to the recession at the glaciers Midgaard, Helheim,5
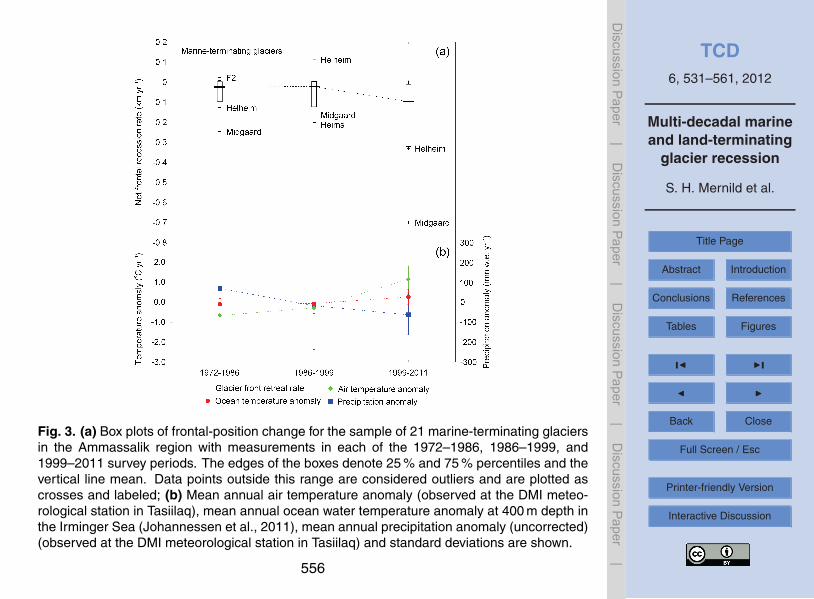
F5, and Fenris, whereas both Midgaard Gletscher and Helheim Gletscher were out-side the 75 % percentiles (Figs. 2 and 3a). Also, for 1972–1986 and 1986–1999Midgaard Gletscher and Helheim Gletscher were considered as outliers. The maximumnet advance rate in the dataset was observed for Helheim Gletscher of 0.100 km yr−1
(1986–1999). A maximum net recession rate was observed for Midgaard Gletscher10
of 0.700 km yr−1 (1999–2011) (Figs. 1 and 3a). For the Ammassalik region in gen-eral, the mean recession rate increased since 1972 (Fig. 3a), as was also reported byHowat and Eddy (2011) for the GrIS outlet glaciers, where a transition was describedfrom stability and small fluctuations in glacier frontal positions (1972–1985) to mod-erate widespread recession in the southeast and western parts of GrIS (1985–2000),15
followed by an accelerated net recession in all regions of the ice sheet (2000–2010).Since 1972, the 21 marine-terminating glaciers showed a cumulative net area loss
of 281 km2, with mean annual area loss rates of 7.2 km2 yr−1 (Fig. 4). The largestindividual marine-terminating area loss occurred at Midgaard Gletscher of 130 km2
(equal to 46 % of the cumulative net area exposure in the Ammassalik region), fol-20
lowed by Helheim Gletscher of 67 km2(equal to 24 %). About 70 % of the glaciershad an area loss less than 4 km2 during the period 1972–2011. Also, the 21 ob-served marine-terminating glaciers had a trend towards lower annual area loss rates(Fig. 4): for the sub-periods 1972–1986, 1986–1999, and 1999–2011 the mean arealoss rates were 8.5 km2 yr−1 (equal to 118 km2), 6.8 km2 yr−1 (88 km2), and 6.3 km2 yr−1
25
(75 km2), respectively (Fig. 4), indicating decreasing area loss rates since 1972. Boxand Decker (2011) measured area change at 39 of the widest GrIS marine-terminatingglaciers based on Moderate Resolution Imaging Spectroradiometer (MODIS) between2000 and 2010, including the glaciers Midgaard, Helheim, and Fenris. Overall for the
538

TCD6, 531–561, 2012
Multi-decadal marineand land-terminating
glacier recession
S. H. Mernild et al.
Title Page
Abstract Introduction
Conclusions References
Tables Figures
J I
J I
Back Close
Full Screen / Esc
Printer-friendly Version
Interactive Discussion
Discussion
Paper
|D
iscussionP
aper|
Discussion
Paper
|D
iscussionP
aper|
39 glaciers, they exposed a cumulated net area of 1368 km2. On individual glacierscale the observed area loss rates for the glaciers Midgaard, Helheim, and Fenriswere −2.9, −2.0, and −0.4 km2 yr−1 for 1999–2011, respectively, compared to −3.6,−2.5, and −0.3 km2 yr−1 for 2000–2010 determined by Box and Decker (2011). TheLandsat derived area loss rates were in the same range as Box and Decker (2011)5
(97.5 % quartile), and both studies indicated that the clearest pattern of area exposurehappened at the Midgaard Gletscher in the Sermilik Fjord, even compared with theentire Southeast Greenland according to Box and Decker (2011).
Several authors (e.g., Holland et al., 2008; Murray et al., 2010; Straneo et al.,2010; Andresen et al., 2011) suggest that ocean warming and warm subsurface waters10
caused large changes to marine-terminating glacier frontal positions and ice dischargeactivity. In recent decades the 21 marine-terminating glaciers in the Ammassalik regionhave experienced increasing frontal recession rates and decreasing area exposurerates that are synchronous with both increasing mean annual air temperature (MAAT)(∼ 0.06 ◦C yr−1, significant at p< 0.01, where p is level of significance; from the DMI15
meteorological station in Tasiilaq) and reconstructed annual ocean water temperature(∼ 0.12 ◦C yr−1, significant p < 0.025; at 400 m depth in the Irminger Sea penetrat-ing into the Sermilik Fjord and exposing the lower part of glaciers such as Helheimand Fenris to warm waters with temperatures up to 4 ◦C (Johannessen et al., 2011))(Figs. 3b and 4). The mean glacier retreat was more widespread for 1999–2011 (ap-20
proximately the first decade of the 21st century), than for the earlier sub-periods (1972–1986 and 1986–1999). The observed accelerated recession of the marine-terminatingglaciers in the Ammassalik region coincided with the onset of a warming trend in thesub-polar North Atlantic Ocean (Myers et al., 2007; Straneo et al., 2010), likely initiatedby the influx of warmer deep water originating in the Irminger Sea (Holland et al., 2008;25
Hanna et al., 2009). This supports the hypothesis that ocean warming associated withshifts in the Irminger and East Greenland currents caused increasing submarine meltat the ice-ocean interface. However, oceanographic studies have demonstrated thatalthough subtropical ocean waters reach glacial fjords in Southeast Greenland, there
539

TCD6, 531–561, 2012
Multi-decadal marineand land-terminating
glacier recession
S. H. Mernild et al.
Title Page
Abstract Introduction
Conclusions References
Tables Figures
J I
J I
Back Close
Full Screen / Esc
Printer-friendly Version
Interactive Discussion
Discussion
Paper
|D
iscussionP
aper|
Discussion
Paper
|D
iscussionP
aper|
is no proof that it comes into direct contact with glaciers (Walsh et al., 2011). Mecha-nisms driving the circulation of warmer North Atlantic waters are, however, still not wellunderstood (e.g., Straneo et al., 2010). On the other hand, Johannessen et al. (2011)have argued that based on annual frontal positions of Helheim Gletscher 24 % of theice-front fluctuations could be accounted for by ocean temperatures and 56 % by air5
temperatures causing surface melting and subsequent percolation of meltwater lead-ing to basal lubrication. Mernild et al. (2012a) suggested that 53–74 % of the ice dis-charge variations for the glaciers Helheim, Fenris, and Midgaard could be accountedfor by variations in surface-generated runoff, even though changes in frontal positionswere influenced by a number of local factors such as e.g., up-glacier ice dynamics and10
bed geometry. Overall, several studies using a range of different methods show thatGrIS marine-terminating glaciers recede and mass loss might be influenced by both at-mospheric and oceanographic impacts, especially in the southeastern part of the GrIS(Luthcke et al., 2006; Velicogna and Wahr, 2006; Velicogna, 2009; van den Broeke,2009).15
3.2 The land-terminating ice sheet
In Fig. 5 the GrIS land-terminating margin and changes within the Ammassalik re-gion are illustrated for 1986, 1999, and 2011. Since 1986 the GrIS area has de-creased in size within the Ammassalik region from 1166 km2 (1986), 1153 km2 (1999),to 1124 km2 (2011), indicating a net area loss of 4 % (equal to an area exposure20
rate of 0.15 % yr−1) (Table 3). As such for the land-terminating GrIS the area expo-sure rates were 1.0 km2 yr−1 (13 km2) and 2.4 km2 yr−1 (29 km2) for the sub-periods1986–1999 and 1999–2011, respectively, indicating an increasing trend in area expo-sure since 1986. The land-terminating area exposure was unevenly distributed for theGrIS (Fig. 5). A division of the ice sheet into 100-m elevation bands indicated that25
the largest GrIS area recession occurred at the elevation between 701–800 m a.s.l. forboth survey-periods, with rates of 0.22 km2 yr−1 (1986–1999) and 0.50 km2 yr−1 (1999–2011) (Figs. 5 and 6). Along with this area reduction, the GrIS land-terminating margin
540

TCD6, 531–561, 2012
Multi-decadal marineand land-terminating
glacier recession
S. H. Mernild et al.
Title Page
Abstract Introduction
Conclusions References
Tables Figures
J I
J I
Back Close
Full Screen / Esc
Printer-friendly Version
Interactive Discussion
Discussion
Paper
|D
iscussionP
aper|
Discussion
Paper
|D
iscussionP
aper|
decreased ∼ 20 % in total length from 686 km (1986) to 544 km (2011), because the2011-margin was less curved – had fewer land-terminating outlets – than in 1986 and1999. When the area recession is compared to changes in margin length, the largestGrIS area length recession ratio occurred at the elevation > 800 m a.s.l., most pro-nounced for the period 1999–2011 (Fig. 6). The spatial area recession seems to be5
highly influenced by local topography, hypsometry, and its shadow effects, climate vari-ability, glacier dynamic processes within the GrIS, increasing ELA elevation (the ELAis the spatially averaged elevation of the equilibrium line, defined as the set of pointson the glacier surface where the net mass balance is zero), and the margin elevationdistribution, where approximately 20 % of the margin was located between 701–800 m10
a.s.l. (1986–2011) (Fig. 6).The mean net recession rate of the GrIS land-terminating margin was 0.018±
0.009 km yr−1 (equal to a net recession of 0.443 km) for 1986–2011, comprised ofa mean recession rate of 0.010 km yr−1 (0.127 km) for 1986–1999, and 0.026 km yr−1
(0.316 km) for 1999–2011 (Table 3). This land-terminating recession rate for the GrIS15
over this period of 1986–2011 is about three times lower the mean rate of reces-sion of the marine-terminating GrIS. Sohn et al. (1998) measured recession rates ofthe GrIS land-terminating margin near Jakobshavn Isbræ, West Greenland, of 0.016–0.040 km yr−1, averaging 0.026 km yr−1 1962–1992. This shows the recession rate canbe expected to be within this order of magnitude along many parts of the GrIS land-20
terminating margin.Net GrIS land-terminating marginal recession for the Ammassalik region, including
increasing area exposure, occurred for the period 1972–2011, during a period of in-creasing MAAT (∼ 0.06 ◦C yr−1) and decreasing annual precipitation (−7.0 mm waterequivalent (w.e.) yr−1, significant at p < 0.025; Fig. 3b) – probably heading towards25
future warmer and dryer conditions in the region (Mernild et al., 2011a). The aver-age increase in MAAT generally favors surface ablation (evaporation, sublimation, andmelt), and an earlier start of the ablation season by decreasing the “cold content” of thesnowpack (Bøggild et al., 2005; Mernild et al., 2011), whereas a decrease in annual
541
TCD6, 531–561, 2012
Multi-decadal marineand land-terminating
glacier recession
S. H. Mernild et al.
Title Page
Abstract Introduction
Conclusions References
Tables Figures
J I
J I
Back Close
Full Screen / Esc
Printer-friendly Version
Interactive Discussion
Discussion
Paper
|D
iscussionP
aper|
Discussion
Paper
|D
iscussionP
aper|
precipitation may lead to earlier exposure of glacier ice melt and summer firn surfaceof previous years (having a lower albedo than fresh snow promoting increased solarabsorption). Therefore, the combination of increasing air temperature and decreasingprecipitation is likely to increase ablation and GrIS margin thinning and recession, andif MAAT and precipitation continue to follow these trends, then it is expected that the5
GrIS land-terminating margin will continue its recession, leading to increased area ex-posure. However, changes in the hypsometric distribution along the GrIS margin mayinfluence recession rates on a decadal scale.
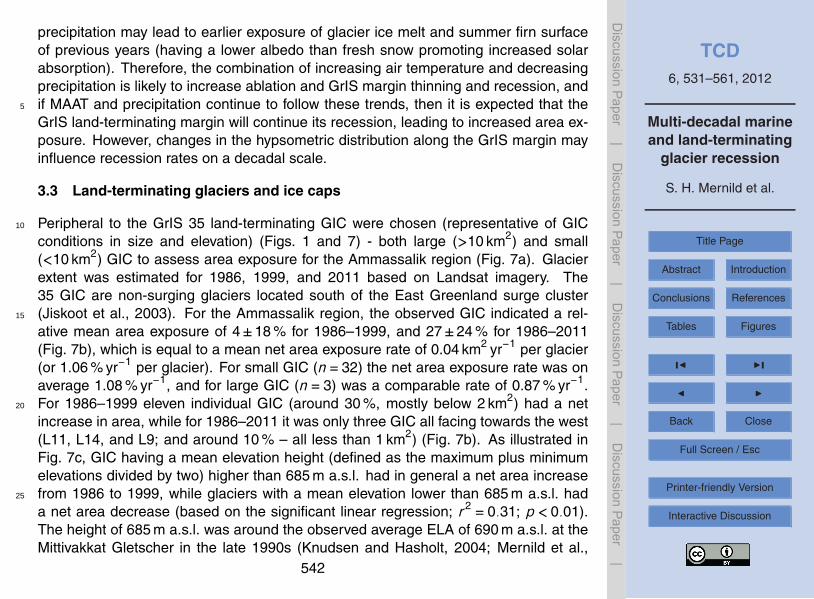
3.3 Land-terminating glaciers and ice caps
Peripheral to the GrIS 35 land-terminating GIC were chosen (representative of GIC10
conditions in size and elevation) (Figs. 1 and 7) - both large (>10 km2) and small(<10 km2) GIC to assess area exposure for the Ammassalik region (Fig. 7a). Glacierextent was estimated for 1986, 1999, and 2011 based on Landsat imagery. The35 GIC are non-surging glaciers located south of the East Greenland surge cluster(Jiskoot et al., 2003). For the Ammassalik region, the observed GIC indicated a rel-15
ative mean area exposure of 4±18 % for 1986–1999, and 27±24 % for 1986–2011(Fig. 7b), which is equal to a mean net area exposure rate of 0.04 km2 yr−1 per glacier(or 1.06 % yr−1 per glacier). For small GIC (n= 32) the net area exposure rate was onaverage 1.08 % yr−1, and for large GIC (n= 3) was a comparable rate of 0.87 % yr−1.For 1986–1999 eleven individual GIC (around 30 %, mostly below 2 km2) had a net20
increase in area, while for 1986–2011 it was only three GIC all facing towards the west(L11, L14, and L9; and around 10 % – all less than 1 km2) (Fig. 7b). As illustrated inFig. 7c, GIC having a mean elevation height (defined as the maximum plus minimumelevations divided by two) higher than 685 m a.s.l. had in general a net area increasefrom 1986 to 1999, while glaciers with a mean elevation lower than 685 m a.s.l. had25
a net area decrease (based on the significant linear regression; r2 = 0.31; p< 0.01).The height of 685 m a.s.l. was around the observed average ELA of 690 m a.s.l. at theMittivakkat Gletscher in the late 1990s (Knudsen and Hasholt, 2004; Mernild et al.,
542

TCD6, 531–561, 2012
Multi-decadal marineand land-terminating
glacier recession
S. H. Mernild et al.
Title Page
Abstract Introduction
Conclusions References
Tables Figures
J I
J I
Back Close
Full Screen / Esc
Printer-friendly Version
Interactive Discussion
Discussion
Paper
|D
iscussionP
aper|
Discussion
Paper
|D
iscussionP
aper|
2011a; Table 2). For 1999–2011 the linear regression shown in Fig. 7c indicates theopposite trend for GIC in the Ammassalik region: an increase in area recession for GICat high elevation ranges, and vice versa. This shift in trend occurred simultaneouslywith an increase in the average observed ELA for the Mittivakkat Gletscher to 750 ma.s.l. Overall for 1986–2011, the observed GIC faced a general net area loss that was5
highest at low elevations, and vice versa (based on the linear regression; Fig. 7c).However, as previous mentioned three minor GIC (<1 km2) had a net area gain duringthis 25-yr period, indicating that glacier fluctuations may vary on local scales.
Since the GIC on average had a mean net area exposure rate of about 1 % yr−1, itmay be expected that GIC in the Ammassalik region could melt substantially in the 21st10
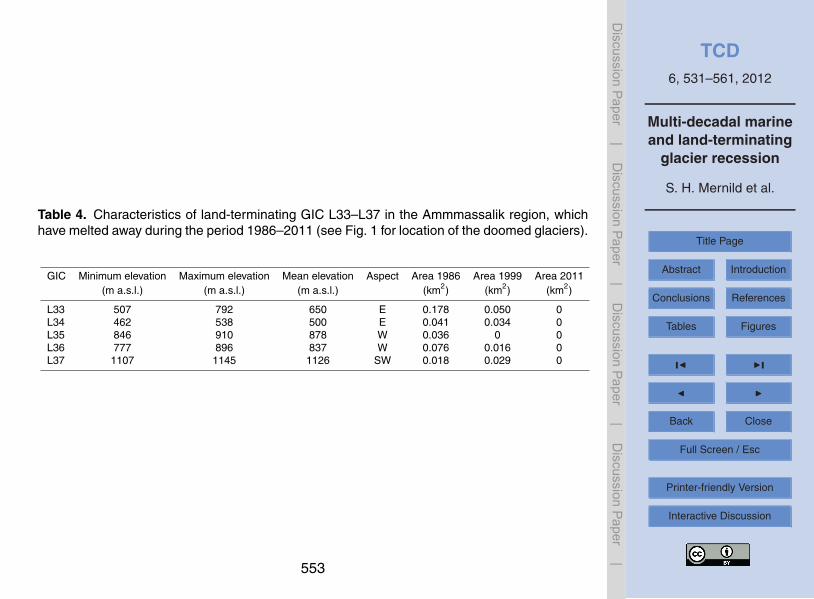
century under ongoing climate change. For the period 1986–2011 there are examplesof five glaciers which completely melted away: all located at different mean elevationswithin the region from 500 to 1130 m a.s.l., and with different aspects facing from eastto west (Table 4). The recession seems therefore not to be limited to low elevated areasonly, but more likely to occur for north facing GIC. Also, in Fig. 8, examples of eight GIC15
are shown to illustrate the spatial changes in margin location from 1986 to 2011.For the largest GIC – the Mittivakkat Gletscher (26.3 km2 in 2011) the area extent had
diminished about 18 % since 1986 (lower than the mean GIC area exposure for the Am-massalik region of 27±24 %). The terminus has retreated by 1.6 km (0.015 km yr−1)since the maximum extent of the Little Ice Age around 1900, by 1.3 km (0.017 km yr−1)20
since 1931 (Humlum and Christiansen, 2008; Mernild et al., 2011a), and by 0.3 km(0.013 km yr−1) since 1986, which is almost of the same magnitude as the GIC ofthe Ammassalik region’s mean net recession rate of 0.010± 0.006 km yr−1 (1986–2011), and of the regional GrIS land-terminating margin of 0.018±0.009 km yr−1 (seeSect. 3.2): the mean Ammassalik GIC land-terminating recession rate (1986–2011) is25
about five times lower than the mean GrIS marine-terminating recession rate. Also, forMittivakkat Gletscher the annual mass balance measured continuously since 1995/96illustrates a 16-yr average mass loss of 0.970±0.190 m w.e. yr−1, indicating that theglacier is significantly out of balance with the current climate. The glacier will likely lose
543
TCD6, 531–561, 2012
Multi-decadal marineand land-terminating
glacier recession
S. H. Mernild et al.
Title Page
Abstract Introduction
Conclusions References
Tables Figures
J I
J I
Back Close
Full Screen / Esc
Printer-friendly Version
Interactive Discussion
Discussion
Paper
|D
iscussionP
aper|
Discussion
Paper
|D
iscussionP
aper|
at least 70 % of its current area extent and 80 % of its volume even in the absence offurther climate changes (Mernild et al., 2011a). Since the initiation of the mass balanceobservation program in 1995/1996, Mittivakkat Gletscher had in 14 out of 16 yr a neg-ative surface mass balance, while the general climatic trend in the region has beentowards higher temperatures, less winter precipitation, and more negative glacier mass5
balances and continuous marginal recession (Fig. 8). Consecutive record glacier massloss occurred for the years 2009/2010 and 2010/2011 of −2.16 and −2.45 m w.e. yr−1,respectively. The 2011 mass loss was not only the largest annual loss of volume in thehistory of the mass balance observational program, but also the largest annual loss insimulations of glacier mass balance changes back to 1898 (Mernild et al., 2008). The10
marginal recession and mass balance observations suggest that recent Mittivakkatmass losses, which have been driven largely by higher surface temperatures and lesssolid precipitation, are representative of the broader region, which includes the 35 ob-served GIC in Figs. 7 and 8 – glaciers of different sizes and elevation ranges. Thisis confirmed since the Mittivakkat Gletscher net area exposure rate closely follows the15
average rates for the Ammassalik region.Glacier fluctuations and area exposure have been studied in other parts of Green-
land. North of the Ammassalik region, in Central East Greenland (68◦ N–72◦ N) land-terminating GIC peripheral to the GrIS have receded at a mean rate of 0.010 km yr−1 fora wide range of glacier sizes (2002–2009) (Kargel et al., 2011). Also, on Disko Island in20
West Greenland, Yde and Knudsen (2007) estimated mean GIC terminus retreat ratesof 0.008 km yr−1 for non-surging GIC, and 0.020 km yr−1 for quiescent phase surge-type GIC, reflecting a higher non-climatic-driven recession rate after glacier surges.These studies are in accordance with the findings for the Ammassalik region and in-dicate that the current mean recession rate for GIC in Greenland (probably excluding25
North Greenland where no data is currently available) is likely to be on the order of0.008–0.010 km yr−1.
544
TCD6, 531–561, 2012
Multi-decadal marineand land-terminating
glacier recession
S. H. Mernild et al.
Title Page
Abstract Introduction
Conclusions References
Tables Figures
J I
J I
Back Close
Full Screen / Esc
Printer-friendly Version
Interactive Discussion
Discussion
Paper
|D
iscussionP
aper|
Discussion
Paper
|D
iscussionP
aper|
4 Summary and conclusion
The satellite observations show net glacier recession since 1972 for the Ammassa-lik region for all glacier types and sizes, both at the marine-terminating and land-terminating GrIS, and land-terminating GIC. However, the land-terminating GrIS andGIC reflect slower area exposure rates than the faster marine-terminating outlet5
glaciers. This could likely be due to a combination of effects, as the marine-terminatingGrIS was influenced by the onset of a sea-water warming trend in the North AtlanticOcean (Myers et al., 2007; Straneo et al., 2010), and by atmospheric impacts fromregional trends in MAAT and precipitation, while GIC were only influenced by the lat-ter. For the marine-terminating GrIS outlet glaciers the mean annual area exposure10
rate has decreased since 1972, whereas it has increased for the land-terminating GrISmargin since 1986, even though both parts of the GrIS have undergone substantialarea changes in the past decades. The observed land-terminating GrIS and GIC indi-cate a net area recession of 4 % (equal to an area exposure rate of 0.15 % yr−1) and27±24 % (around 1 % yr−1), respectively, and margin recession rates of 0.018±0.00915
and 0.010±0.006 km yr−1. These mean net margin recession rates are about 3 to5 timer lower than the GrIS marine-terminating margin rates. If these GIC recessiontrends are extrapolated it would indicate that a substantial amount of the GIC in theAmmassalik region might melt away within the 21st century under ongoing climatewarming. So far, five GIC in the Ammassalik region have melted away since 1986.20
Acknowledgements. The authors thank Matthew Hecht and Mauri Pelto for their insightful re-view of an early version of this paper. We also thank Ola M. Johannessen for providing thereconstructed ocean water data. This work was partly supported by the Climate ChangePrediction Program and by the Scientific Discovery for Advanced Computing (SciDAC) pro-gram within the US Department of Energy’s Office of Science, Los Alamos National Laboratory25
(LANL) Director’s Fellowship, and LANL Institute for Geophysics and Planetary Physics (LANLis operated under the auspices of the National Nuclear Security Administration of the US De-partment of Energy under Contract No. DE-AC52-06NA25396), and partly from the EuropeanCommunity’s Seventh Framework Programme under grant agreement No. 262693. SHM and
545

TCD6, 531–561, 2012
Multi-decadal marineand land-terminating
glacier recession
S. H. Mernild et al.
Title Page
Abstract Introduction
Conclusions References
Tables Figures
J I
J I
Back Close
Full Screen / Esc
Printer-friendly Version
Interactive Discussion
Discussion
Paper
|D
iscussionP
aper|
Discussion
Paper
|D
iscussionP
aper|
JKM compiled the satellite images, analyzed the data, and wrote the manuscript. NTK and JCYcontributed to the discussion of results and writing of the text.
References
Andresen, C. S., Straneo, F., Riebergaard, M. H., Bjørk, A. A., Andersen, T. J., Kuijpers, A.,Nørgaard-Pedersen, N., Kjær, K. H., Schjøth, F., Weckstrom, K., and Ahlstrøm A. P.: Rapid5
response of Helheim Glacier in Greenland to climate variability over the past century, Nat.Geosci., 5, 37-41, doi:10.1038/NGEO1349, 2011.
Bøggild, C. E., Forsberg, R., and Reeh, N.: Melt: water in a transect across the Greenland icesheet, Ann. Glaciol., 40, 169–173, 2005.
Box, J. E. and Decker D. T.: Greenland marine-terminating glacier area changes: 2000–2010,10
Ann. Glaciol., 52, 91–98, 2011.Dozier, J. and Warren, S. G.: Effect of viewing angle on the infrared brightness temperature of
snow, Water Resour. Res., 18, 1424–1434, 1982.EOSDIS: Earth Observing System Data and Information System (EOSDIS). 2009. Earth Ob-
serving System ClearingHOuse (ECHO)/Warehouse Inventory Search Tool (WIST) Version15
10.X. Greenbelt, MD: EOSDIS, Goddard Space Flight Center (GSFC) NASA, 2009.Gao, B.-C: NDWI – a normalized difference water index for remote sensing of vegetation liquid
water from space, Remote Sens. Environ., 58, 257–266, 1996.Haeberli, W., Gartner-Roer, I., Hoelzle, M., Paul, F., and Zemp, M. (Eds.):
WGMS: Glacier Mass Balance Bulletin. Bulletin No. 10 (2006–2007),20
ICSU(WDS)/IUGG(IACS)/UNEP/UNESCO/WMO, World Glacier Monitoring Service,Zurich, 96 pp., 2009.
Hanna, E., Cappelen, J., Fettweis, X., Huybrechts, P., Luckman, A., and Ribergaard, M. H.:Hydrologic response of the Greenland ice sheet: the role of oceanographic warming, Hydrol.Process., 23, 7–30, 2009.25
Hansen, J., Ruedy, R., Sato, M., and Lo, K.: Global surface temperature change, Rev. Geo-phys., 48, RG4004, doi:10.1029/2010RG00345, 2010.
Holland, D. M., Thomas, R. H., de Young, B., Ribergaard, M. H., and Lyberth, B.: Accelerationof Jakobshavn Isbrae triggered by warm subsurface ocean waters. Nat. Geosci., 1, 659–662,2008.30
546
TCD6, 531–561, 2012
Multi-decadal marineand land-terminating
glacier recession
S. H. Mernild et al.
Title Page
Abstract Introduction
Conclusions References
Tables Figures
J I
J I
Back Close
Full Screen / Esc
Printer-friendly Version
Interactive Discussion
Discussion
Paper
|D
iscussionP
aper|
Discussion
Paper
|D
iscussionP
aper|
Howat, I. M. and Eddy, A.: Multi-decadal retreat of Greenland’s marine-terminating glaciers, J.Glaciol., 57, 389–396, 2011.
Howat, I. M., Joughin, I., Tulaczyk, S., and Gogineni, S.: Rapid retreat and ac-celeration of Helheim Glacier, East Greenland, Geophys. Res. Lett., 32, L22502,doi:10.1029/2005GL024737, 2005.5
Howat, I. M., Joughin, I., and Scambos, T. A.: Rapid changes in ice discharge from Greenlandoutlet glaciers, Science, 315, 1559–1561, 2007.
Howat, I. M., Joughin, I., Fahnestock, M., Smith, B. E., and Scambos, T.: Synchronous re-treatand acceleration of southeast Greenland outlet glaciers 2000–2006: ice dynamic andcoupling to climate, J. Glaciol., 54, 646–660, 2008.10
Humlum, O. and Christiansen, H. H.: Geomorphology of the Ammassalik Island, SE Greenland,Geogr. Tidsskr., 108, 5–20, 2008.
Jiskoot, H., Murray, T., and Luckman, A.: Surge potential and drainage-basin characteristics inEast Greenland, Ann. Glaciol., 36, 142–148, 2003.
Johannessen, O. M., Korablev, A., Miles, V., Miles, M. W., and Solberg, K. E.: Interaction15
between the warm subsurface Atlantic water in the Sermilik Fjord and Helheim Glacier inSoutheast Greenland, Surv. Geophys, 32, 387–396, doi:10.1007/s10712-011-9130-6, 2011.
Joughin, I., Abdalati, W., and Fahnestock, M. A.: Large fluctuations in speed on Greenland’sJakobshavn Isbrae glacier, Nature, 432, 608–610, 2004.
Joughin, I., Smith, B. E., Howat, I. M., Scambos, T., and Moon, T.: Greenland flow variability20
from ice-sheet-wide velocity mapping, J. Glaciol., 56, 415–430, 2010.Kargel, J. S., Ahlstrøm, A. P., Alley, R. B., Bamber, J. L., Benham, T. J., Box, J. E., Chen, C.,
Christoffersen, P., Citterio, M., Cogley, J. G., Jiskoot, H., Leonard, G. J., Morin, P., Scambos,T., Sheldon, T., and Willis, I.: Brief Communication: Greenland’s shrinking ice cover: “fasttimes” but not that fast, The Cryosphere Discuss., 5, 3207–3219, doi:10.5194/tcd-5-3207-25
2011, 2011.Knudsen, N. T. and Hasholt, B.: Mass balance observations at Mittivakkat Glacier, Southeast
Greenland 1995–2002, Nord. Hydrol., 35, 381–390, 2004.Luthcke, S., Zwally, H. J., Abdalati, W., Rowlands, D. D., Ray, R. D., Nerem, R. S.,
Lemoine, F. G., McCarthy, J. J., and Chinn, D. S.: Recent Greenland mass loss by drainage30
system from satellite gravity observations, Science, 314, 1286–1289, 2006.Mernild, S. H., Kane, D. L., Hansen, B. U., Jakobsen, B. H., Hasholt, B., and Knudsen, N. T.:
Climate, glacier mass balance, and runoff (1993–2005) for the Mittivakkat Glacier catchment,
547
TCD6, 531–561, 2012
Multi-decadal marineand land-terminating
glacier recession
S. H. Mernild et al.
Title Page
Abstract Introduction
Conclusions References
Tables Figures
J I
J I
Back Close
Full Screen / Esc
Printer-friendly Version
Interactive Discussion
Discussion
Paper
|D
iscussionP
aper|
Discussion
Paper
|D
iscussionP
aper|
Ammassalik Island, SE Greenland, and in a long term perspective (1898–1993), Hydrol.Res., 39, 239–256, 2008.
Mernild, S. H., Knudsen, N. T., Lipscomb, W. H., Yde, J. C., Malmros, J. K., Hasholt, B.,and Jakobsen, B. H.: Increasing mass loss from Greenland’s Mittivakkat Gletscher, TheCryosphere, 5, 341–348, doi:10.5194/tc-5-341-2011, 2011a.5
Mernild, S. H., Mote, T., and Liston, G. E.: Greenland Ice Sheet surface melt extent and trends,1960–2010, J. Glaciol., 57, 621–628, 2011b.
Mernild, S. H., Seidenkrantz, M.-S., Chylek, P., Liston, G. E., and Hasholt, B.: Climate-drivenfluctuations in freshwater to Sermilik Fjord, East Greenland, during the last 4000 years,Holocene, 22(2), 155-164, doi:10.1177/0959683611431215, 2012a.10
Mernild, S. H., Hanna, E., Knudsen, N. T., Yde, J. C., and Seidenkrantz, M.-S.: The climateimpact on observed land terminating glaciers and ice caps in Northern North Atlantic, J.Climate, in review, 2012b.
Moon, T. K. and Joughin, I.: Retreat and advance of Greenland tidewater glaciers from 1992 to2007, J. Geophys. Res., 113, F02022, doi:10.1029/2007JF000927, 2008.15
Murry T., Scharrer, K., James, T. D., Dye, S. R., Hanna, E., Booth, A. D., Selmes, N., Luck-man, A., Hughes, A. L. C., Cook, S., and Huybrechts, P.: Ocean regulation hypothesis forglacier dynamics in southeast Greenland and implications for ice sheet mass changes, J.Geophys. Res., 115, F03026. doi:10.1029/2009JF001522, 2010.
Myers, P., Kulan, N., and Ribergaard, M. H.: Irminger water variability in the West Greenland20
current, Geophys. Res. Lett., 34, L17601, doi:10.1029/2007GL030419, 2007.Nick, F., Vieli, M. A., Howat, I. M., and Joughin, I.: Large-scale changes in Greenland outlet
glacier dynamics trigged at the terminus, Nat. Geosci., 2, 110-114, doi:10.1038/NGEO394,2009.
Paul, F.: The New Swiss Glacier Inventory 2000 – Application of remote sensing and GIS, PhD25
Thesis, Department of Geography, University of Zurich, 198 pp., 2004.Radic, V. and Hock, R.: Regionally differentiated contribution of mountain glaciers and ice caps
to future sea-level rise, Nat. Geosci., 4, 91–94, 2011.Rignot, E. and Kanagaratnam, P.: Changes in the velocity structure of the Greenland Ice Sheet,
Science, 311, 986–990, 2006.30
Rignot, E., Knoppes, M., and Velicogna, I.: Rapid submarine melting of the calving faces ofWest Greenland glaciers. Nat. Geosci., 3, 187–191, 2010.
Rouse, J. W., Haas, R. H., Schell, J. A., and Deering, D. W.: Monitoring vegetation systems in
548
TCD6, 531–561, 2012
Multi-decadal marineand land-terminating
glacier recession
S. H. Mernild et al.
Title Page
Abstract Introduction
Conclusions References
Tables Figures
J I
J I
Back Close
Full Screen / Esc
Printer-friendly Version
Interactive Discussion
Discussion
Paper
|D
iscussionP
aper|
Discussion
Paper
|D
iscussionP
aper|
the Great Plains with ERTS, Third ERTS Symposium, NASA SP-351 I, 309–317, 1973.Sohn, H.-G., Jezek, K. C., van der Veen, C. J.: Jakobshavn Glacier, West Greenland: 30 years
of spaceborne observations, Geophys. Res. Lett., 25, 2699–2702, 1998.Straneo, F., Hamilton, G. S., Sutherland, D. A., Sterns, L. A., Davidson, F., Hammill, M. O.,
Stenson, G. B., and Rosing-Asvid, A.: Rapid circulation of warm subtropical waters in a major5
glacial fjord in East Greenland, Nat. Geosci., 3, 182–222, 2010.Tachikawa, T., Kaku, M., Iwasaki, A., Gesch, D., Oimoen, M., Zhang, Z., Danielson, J.,
Krieger, T., Curtis, B., Haase, J., Abrams, M., Crippen, R., and Carabajal, C.: ASTERGlobal Digital Elevation Model Version 2 – Summary of Validation Results. NASA Land Pro-cesses Distributed Active Archive Center and the Joint Japan-US ASTER Science Team,10
available at: https://igskmncnwb001.cr.usgs.gov/aster/GDEM/Summary GDEM2 validationreport final.pdf, 2011.
Truffer, M. and Fahnestock, M.: Rethinking ice sheet time scales, Science, 315, 1508–1510,2007.
van den Broeke, M., Bamber, J., Ettema, J., Rignot, E., Schrama, E., van de Berg, W., van Meij-15
gaard, E., Velicogna, I., and Wouters, B.: Partitioning recent Greenland mass loss, Science,326, 984–986, 2009.
Velicogna, I.: Increasing rates of ice mass loss from the Greenland and Antarctic ice sheetsrevealed by GRACE, Geophys. Res. Lett., 36, L19503, doi:10.1029/2009GL040222, 2009
Velicogna, I. and Wahr, J.: Acceleration of Greenland ice mass loss in spring 2004, Nature,20
443, 329–331, 2006.Walsh, K. M., Howat, I. M., Ahn, Y., and Enderlin, E. M.: Changes in the marine-terminating
glaciers of central east Greenland and potential connections to ocean circulation, 2000–2010, The Cryosphere Discuss., 5, 2865–2894, doi:10.5194/tcd-5-2865-2011, 2011.
Yde, J. C. and Knudsen, N. T.: 20th-century glacier fluctuation on Disko Island (Qeqertarsuaq),25
Greenland, Ann. Glaciol., 46, 209–214, 2007.
549
TCD6, 531–561, 2012
Multi-decadal marineand land-terminating
glacier recession
S. H. Mernild et al.
Title Page
Abstract Introduction
Conclusions References
Tables Figures
J I
J I
Back Close
Full Screen / Esc
Printer-friendly Version
Interactive Discussion
Discussion
Paper
|D
iscussionP
aper|
Discussion
Paper
|D
iscussionP
aper|
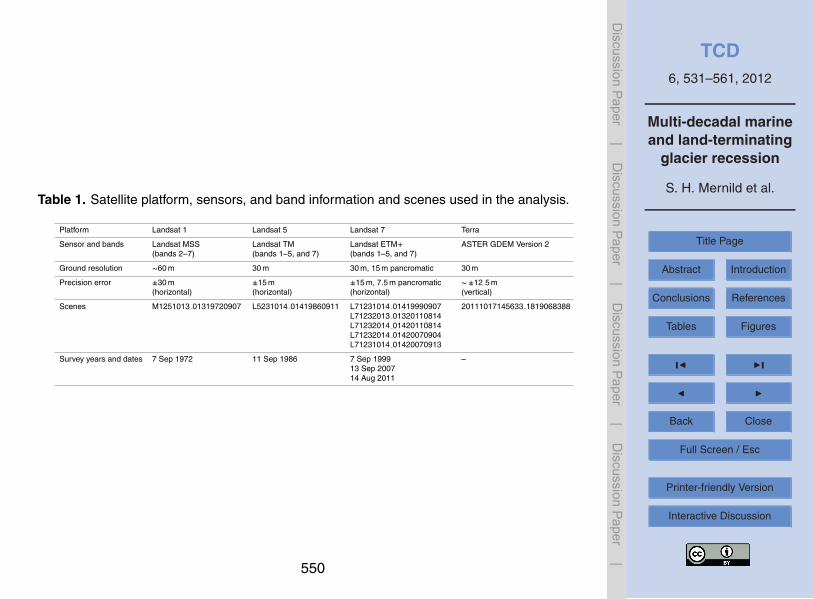
Table 1. Satellite platform, sensors, and band information and scenes used in the analysis.
Platform Landsat 1 Landsat 5 Landsat 7 Terra
Sensor and bands Landsat MSS(bands 2–7)
Landsat TM(bands 1–5, and 7)
Landsat ETM+(bands 1–5, and 7)
ASTER GDEM Version 2
Ground resolution ∼60 m 30 m 30 m, 15 m pancromatic 30 m
Precision error ±30 m(horizontal)
±15 m(horizontal)
±15 m, 7.5 m pancromatic(horizontal)
∼±12.5 m(vertical)
Scenes M1251013 01319720907 L5231014 01419860911 L71231014 01419990907L71232013 01320110814L71232014 01420110814L71232014 01420070904L71231014 01420070913
20111017145633 1819068388
Survey years and dates 7 Sep 1972 11 Sep 1986 7 Sep 199913 Sep 200714 Aug 2011
–
550

TCD6, 531–561, 2012
Multi-decadal marineand land-terminating
glacier recession
S. H. Mernild et al.
Title Page
Abstract Introduction
Conclusions References
Tables Figures
J I
J I
Back Close
Full Screen / Esc
Printer-friendly Version
Interactive Discussion
Discussion
Paper
|D
iscussionP
aper|
Discussion
Paper
|D
iscussionP
aper|
Table 2. Frontal position change rate statistics for the period 1972–2011 for the GrIS marine-terminating glaciers in the Ammassalik region, mean annual air temperature and precipitationanomaly from the DMI meteorological station in Tasiilaq, and mean annual reconstructed oceanwater temperature anomaly at 400 m depth in the Irminger Sea (Johannessen et al., 2011).
Range Number ofGrIS marine-terminatingglaciers
Mean annualair tempera-ture anomalyand standarddeviation(◦C yr−1)
Mean annualprecipitationanomaly andstandarddeviation(mm w.e. yr−1)
Mean annualreconstructedocean watertemperatureanomaly andstandarddeviation(◦C yr−1)
Glacierfraction innet retreat(%)
Mean changerate andstandarddeviation(km yr−1)
Medianchange rate(km yr−1)
Maximumadvance rate(km yr−1)
Maximumrecessionrate(km yr−1)
1972–1986 21 −0.63±0.78 69±212 −0.12±0.30 57 −0.031±0.056 −0.007 0.005 −0.2231986–1999 21 −0.33±0.63 −17±238 −0.06±0.49 86 −0.029±0.060 −0.009 0.100 −0.1871999–2011 21 1.08±0.59 −62±163 0.23±0.43∗ 100 −0.098±0.171 −0.038 −0.003 −0.7581972–2011 21 – – – 100 −0.053±0.113 −0.025 0.100 −0.758
∗ Data are missing from 1995 and 1996, and only present to 2009.
551

TCD6, 531–561, 2012
Multi-decadal marineand land-terminating
glacier recession
S. H. Mernild et al.
Title Page
Abstract Introduction
Conclusions References
Tables Figures
J I
J I
Back Close
Full Screen / Esc
Printer-friendly Version
Interactive Discussion
Discussion
Paper
|D
iscussionP
aper|
Discussion
Paper
|D
iscussionP
aper|
Table 3. GrIS land-terminating margin-position change rate statistics for each survey year andperiod for the Ammassalik region.
Years GrIS margin length for the high-lighted section in Ammassalikregion (km)
GrIS area for the section for thehighlighted section in Ammas-salik region (km2)
Area in percentage re-lated to the 1986 area(%)
1986 686 1166 1001999 589 1153 992011 544 1124 96
GrIS mean margin change rate(km yr−1)
GrIS mean margin change (km)
1986–1999 −0.010 −0.1271999–2011 −0.026 −0.3161986–2011 −0.018 −0.443
552
TCD6, 531–561, 2012
Multi-decadal marineand land-terminating
glacier recession
S. H. Mernild et al.
Title Page
Abstract Introduction
Conclusions References
Tables Figures
J I
J I
Back Close
Full Screen / Esc
Printer-friendly Version
Interactive Discussion
Discussion
Paper
|D
iscussionP
aper|
Discussion
Paper
|D
iscussionP
aper|
Table 4. Characteristics of land-terminating GIC L33–L37 in the Ammmassalik region, whichhave melted away during the period 1986–2011 (see Fig. 1 for location of the doomed glaciers).
GIC Minimum elevation Maximum elevation Mean elevation Aspect Area 1986 Area 1999 Area 2011(m a.s.l.) (m a.s.l.) (m a.s.l.) (km2) (km2) (km2)
L33 507 792 650 E 0.178 0.050 0L34 462 538 500 E 0.041 0.034 0L35 846 910 878 W 0.036 0 0L36 777 896 837 W 0.076 0.016 0L37 1107 1145 1126 SW 0.018 0.029 0
553

TCD6, 531–561, 2012
Multi-decadal marineand land-terminating
glacier recession
S. H. Mernild et al.
Title Page
Abstract Introduction
Conclusions References
Tables Figures
J I
J I
Back Close
Full Screen / Esc
Printer-friendly Version
Interactive Discussion
Discussion
Paper
|D
iscussionP
aper|
Discussion
Paper
|D
iscussionP
aper|
Fig. 1. The Ammassalik region, including the Sermilik Fjord and parts of the southeasternsector of the GrIS. The marine-terminating glaciers margins are marked with positions (lines)for each of the survey years 1972 (red color), 1986 (green), 1999 (blue), and 2011 (yellow) (thelocation names are written in turquoise). The 35 local land-terminating glaciers and ice caps(GIC) peripheral to the GrIS are written in yellow, where eight are marked with shaded areas– marginal changes for those eight GIC and the GrIS are detailed illustrated. The GIC markedwith L33–L37 are examples of GIC melted away during 1986–2011. The inset figure indicatesthe general location of the Ammassalik region in Southeast Greenland (source: Landsat 7ETM+ Mosaik, 7 September 1999/9 September 2000).
554

TCD6, 531–561, 2012
Multi-decadal marineand land-terminating
glacier recession
S. H. Mernild et al.
Title Page
Abstract Introduction
Conclusions References
Tables Figures
J I
J I
Back Close
Full Screen / Esc
Printer-friendly Version
Interactive Discussion
Discussion
Paper
|D
iscussionP
aper|
Discussion
Paper
|D
iscussionP
aper|
Fig. 2. Satellite-derived net frontal recession for the 21 marine-terminating glaciers in theAmmassalik region for the sub-periods 1972–1986 (green), 1986–1999 (blue), and 1999–2011(yellow). For glacier locations, see Fig. 1.
555
TCD6, 531–561, 2012
Multi-decadal marineand land-terminating
glacier recession
S. H. Mernild et al.
Title Page
Abstract Introduction
Conclusions References
Tables Figures
J I
J I
Back Close
Full Screen / Esc
Printer-friendly Version
Interactive Discussion
Discussion
Paper
|D
iscussionP
aper|
Discussion
Paper
|D
iscussionP
aper|
Fig. 3. (a) Box plots of frontal-position change for the sample of 21 marine-terminating glaciersin the Ammassalik region with measurements in each of the 1972–1986, 1986–1999, and1999–2011 survey periods. The edges of the boxes denote 25 % and 75 % percentiles and thevertical line mean. Data points outside this range are considered outliers and are plotted ascrosses and labeled; (b) Mean annual air temperature anomaly (observed at the DMI meteo-rological station in Tasiilaq), mean annual ocean water temperature anomaly at 400 m depth inthe Irminger Sea (Johannessen et al., 2011), mean annual precipitation anomaly (uncorrected)(observed at the DMI meteorological station in Tasiilaq) and standard deviations are shown.
556

TCD6, 531–561, 2012
Multi-decadal marineand land-terminating
glacier recession
S. H. Mernild et al.
Title Page
Abstract Introduction
Conclusions References
Tables Figures
J I
J I
Back Close
Full Screen / Esc
Printer-friendly Version
Interactive Discussion
Discussion
Paper
|D
iscussionP
aper|
Discussion
Paper
|D
iscussionP
aper|
Fig. 4. Mean annual area change rates and cumulative net area change for the 21 marine-terminating glaciers for the Ammassalik region 1972–2011.
557

TCD6, 531–561, 2012
Multi-decadal marineand land-terminating
glacier recession
S. H. Mernild et al.
Title Page
Abstract Introduction
Conclusions References
Tables Figures
J I
J I
Back Close
Full Screen / Esc
Printer-friendly Version
Interactive Discussion
Discussion
Paper
|D
iscussionP
aper|
Discussion
Paper
|D
iscussionP
aper|
Fig. 5. The location of the GrIS land-terminating margin for the survey years 1986 (green),1999 (blue), and 2011 (yellow) in the Ammassalik region, and the marginal changes betweenthe survey years. The topography has black and gray shaded colors (source: ASTER GDEMv2 and Landsat 7).
558

TCD6, 531–561, 2012
Multi-decadal marineand land-terminating
glacier recession
S. H. Mernild et al.
Title Page
Abstract Introduction
Conclusions References
Tables Figures
J I
J I
Back Close
Full Screen / Esc
Printer-friendly Version
Interactive Discussion
Discussion
Paper
|D
iscussionP
aper|
Discussion
Paper
|D
iscussionP
aper|
Fig. 6. GrIS land-terminating area recession rates for different elevation intervals, Ammassalikregion, for the sub-periods 1986–1999 (light gray) and 1999–2011 (dark gray), area recessionrate related to changes in margin length for 1986–1999 (black dashed line, long dashed) and1999–2011 (black dashed line, short dashed), and the percentage of margin elevation for thedifferent elevation intervals for the years 1986 (green), 1999 (blue), and 2011 (yellow) (seeFig. 5 for location of the margin).
559

TCD6, 531–561, 2012
Multi-decadal marineand land-terminating
glacier recession
S. H. Mernild et al.
Title Page
Abstract Introduction
Conclusions References
Tables Figures
J I
J I
Back Close
Full Screen / Esc
Printer-friendly Version
Interactive Discussion
Discussion
Paper
|D
iscussionP
aper|
Discussion
Paper
|D
iscussionP
aper|
Fig. 7. (a) Land-terminating GIC area for the 35 observed GIC (Mittivakkat, Hobbs, Tinit, andL1–L32 glaciers) for 1986, 1999, and 2011 (the listed glaciers are illustrated as an example inFig. 8); (b) relative GIC area change since 1986 (the named glaciers are the ones with areaincrease); and (c) relative GIC area change in relation to variations in mean elevation GICheight for 1986–1999, 1999–2011, and overall for 1986–2011.
560

TCD6, 531–561, 2012
Multi-decadal marineand land-terminating
glacier recession
S. H. Mernild et al.
Title Page
Abstract Introduction
Conclusions References
Tables Figures
J I
J I
Back Close
Full Screen / Esc
Printer-friendly Version
Interactive Discussion
Discussion
Paper
|D
iscussionP
aper|
Discussion
Paper
|D
iscussionP
aper|
Fig. 8. The margin location of eight land-terminating GIC (peripheral to the GrIS) in the Ammas-salik region: Hobbs, Mittivakkat, Tinit, and L1–L5 glaciers for the survey years 1986 (green),1999 (blue), and 2011 (yellow) estimated from Landsat images. The location of the individualglaciers is shown in Fig. 1 (source: Landsat 7 ETM+ Mosaik, 7 September 1999/9 September2000).
561