Embed Size (px)
Citation preview
MULTI - CHANNEL RETAILING SHOPPER PREFERENCES, WHEN,
WHERE AND WHY ?
BY DR DIRK A PRINSLOO
URBAN STUDIES
18 SEPTEMBER 2013
INTRODUCTION
• South Africa is seven years behind the UK, USA, and Australia with online shopping
• This will force retailers to catch up fast
• to develop the right products and infrastructure
• will lead to shopper education, new marketing concepts, to built trust, and streamline delivery.
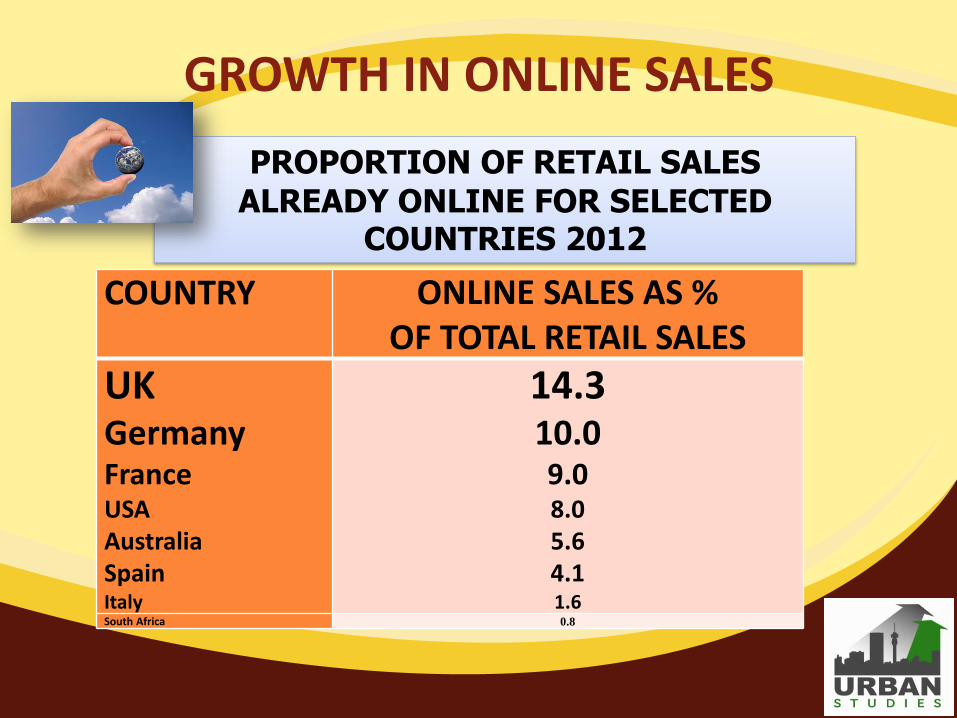
GROWTH IN ONLINE SALES
COUNTRY ONLINE SALES AS % OF TOTAL RETAIL SALES
UK Germany France USA Australia Spain Italy
14.3 10.0 9.0 8.0 5.6 4.1 1.6
South Africa 0.8
PROPORTION OF RETAIL SALES
ALREADY ONLINE FOR SELECTED COUNTRIES 2012

THREE BROAD CATEGORIES OF ONLINE SHOPPING
Well established
South African
SA Retailers
LATEST- RSG MY WêRELD…..


SURVEY AMONGST 600 SHOPPERS TO DISTINGUISH BETWEEN ONLINE AND
NON ONLINE SHOPPERS
METROPOLITAN AREAS NUMBER OF INTERVIEWS
Sandton Johannesburg Cape Town Durban Pretoria
200 100 100 100 100
TOTAL 600
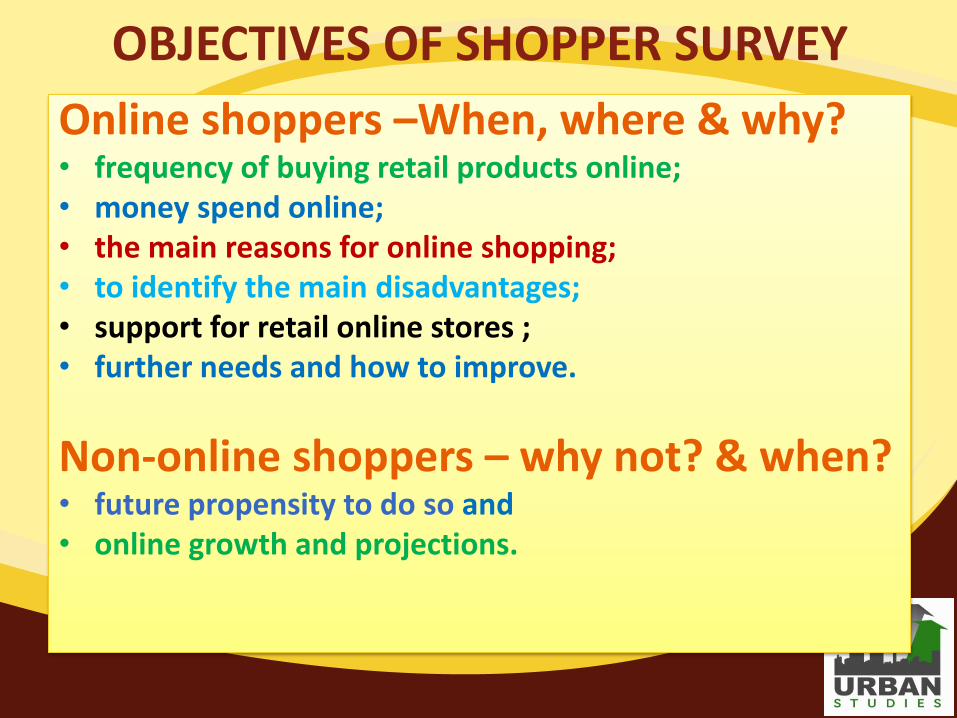
OBJECTIVES OF SHOPPER SURVEY
Online shoppers –When, where & why? • frequency of buying retail products online; • money spend online; • the main reasons for online shopping; • to identify the main disadvantages; • support for retail online stores ; • further needs and how to improve.
Non-online shoppers – why not? & when? • future propensity to do so and • online growth and projections.

HOW ONLINE AND NON-ONLINE SHOPPERS DIFFER
0
20
40
60
80Male
Female
Age 18-24
Age 25-34
Age 35-49
Age 50-65
White
Black
Asian
Coloured
Income <20
Income 20-50
Income 50+
LSM 1-6
LSM 7-9
LSM 10 -10+
DEMOGRAPHIC PROFILE: USERS (42%) VS NON-USERS (58%) OF ONLINE SHOPPING
Users Non Users

FREQUENCY OF BUYING ONLINE
11
31
27
19
12
0
5
10
15
20
25
30
35
Weekly/Fortnightly Monthly 3 Monthly 6 Monthly Once a year
%
FREQUENCY OF BUYING ONLINE
LOW WEEKLY USE
Heavy Users
Light users

ONLINE TRANSACTIONS
ROOM FOR VERY HIGH VOLUME GROWTH
Heavy Users (48 transactions
per annum) Light Users (10 transactions
per annum)
AVERAGE NUMBER OF ONLINE TRANSACTIONS

SPENDING PER TRANSACTION
VERY HIGH POTENTIAL FOR SPENDING GROWTH - LIGHT USERS ARE SPENDING 5 TIMES LESS
Spending per month, R1882
Spending per month, R363
AVERAGE SPENDING PER MONTH ON ONLINE TRANSACTIONS
Heavy Users Light Users
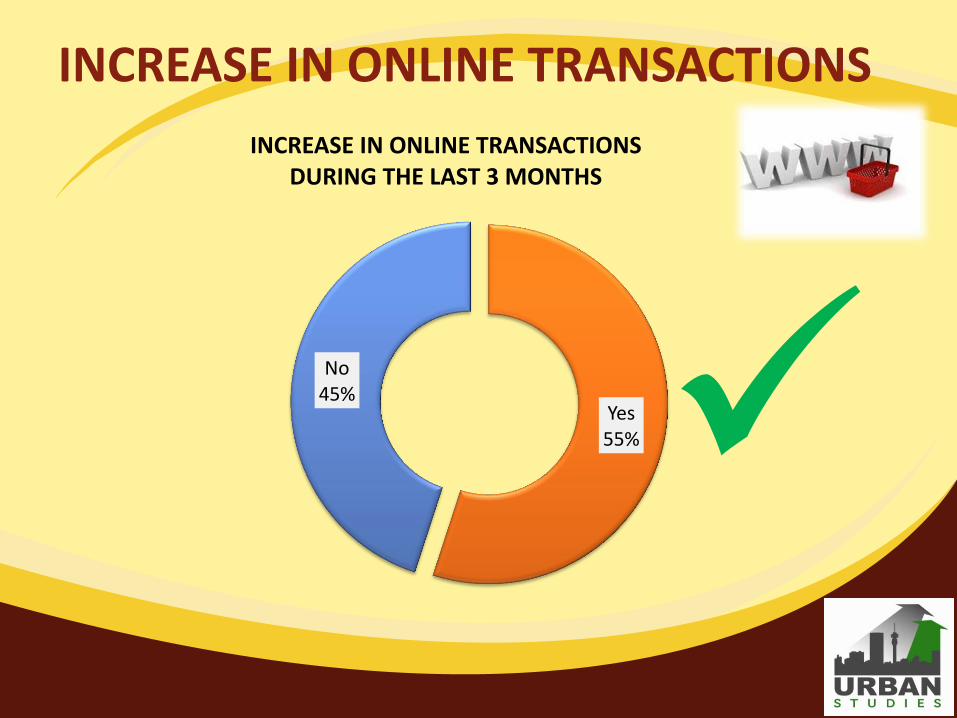
INCREASE IN ONLINE TRANSACTIONS
Yes 55%
No 45%
INCREASE IN ONLINE TRANSACTIONS DURING THE LAST 3 MONTHS

WHAT SHOPPERS LIKE ABOUT ONLINE SHOPPING!
Convenience of home 49 Cheaper 11
Faster 8
Can shop worldwide 7
Wide variety of choices 7
Not restricted to business hours 5
Can compare products 4
Avoid shopping centres 3
Free delivery 2
Price comparisons 1
CONVENIENCE WILL BECOME THE MAIN DRIVER OF FURTHER ONLINE STORE DEVELOPMENT

DISADVANTAGES OF ONLINE SHOPPING %
The same four disadvantages were mentioned in the UK Study
Cannot touch or see product 25
Security of credit card 22
Slow delivery and non-delivery 13
Not certain about the quality 13 Products cannot be changed 10
Cost of delivery 5
Lack of human interaction 5
Right size not delivered 3
Other reasons 3
Prices not necessarily cheaper 1

RETAIL PRODUCTS BOUGHT ONLINE
0% 20% 40% 60% 80% 100%
Shoes
Groceries
Homeware
Clothing
Toys
Electrical appliances
DVD
Games
Computer related
Music
Books
Online In store Both
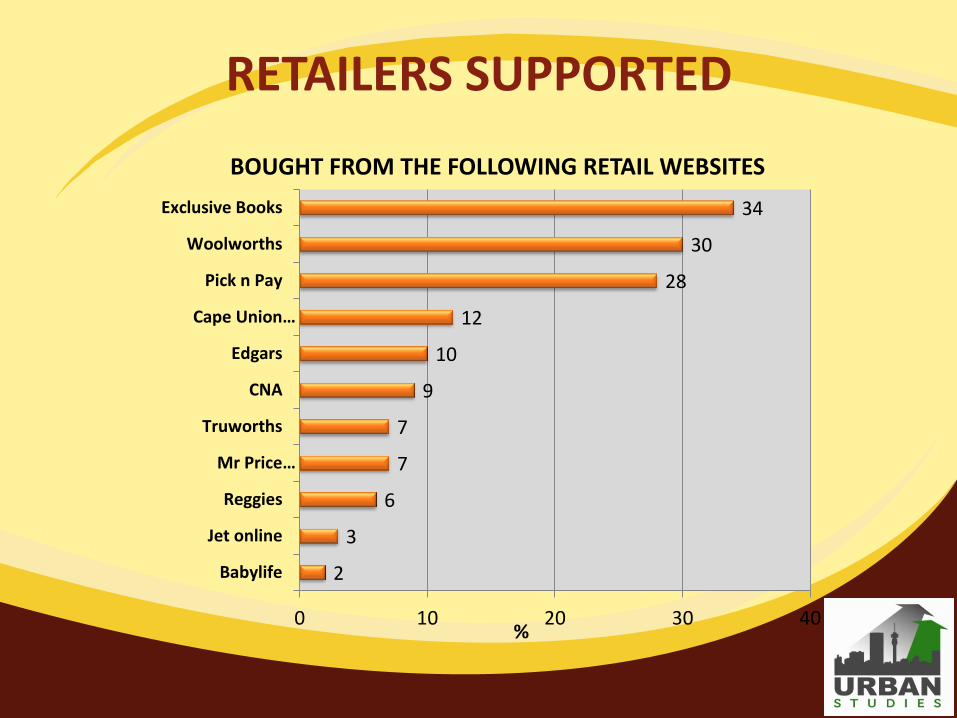
RETAILERS SUPPORTED
2
3
6
7
7
9
10
12
28
30
34
0 10 20 30 40
Babylife
Jet online
Reggies
Mr Price…
Truworths
CNA
Edgars
Cape Union…
Pick n Pay
Woolworths
Exclusive Books
%
BOUGHT FROM THE FOLLOWING RETAIL WEBSITES

TYPE OF SHOPPING MOST PREFERRED IN FUTURE
40
27 27
4 2
0
5
10
15
20
25
30
35
40
45
In-store in ashopping
centre
Online Browseonline and
shop in store
Buy onlineand collectfrom store
Other
%

RECOMMENDATIONS
8
14
19
21
25
0 10 20 30
More reviews by otherbuyers of products
Better description ofproducts
Strict security with creditcard purchases
More retail stores online
More variety of onlinestores
%
RECOMMENDATIONS TO INCREASE FUTURE ONLINE SHOPPING
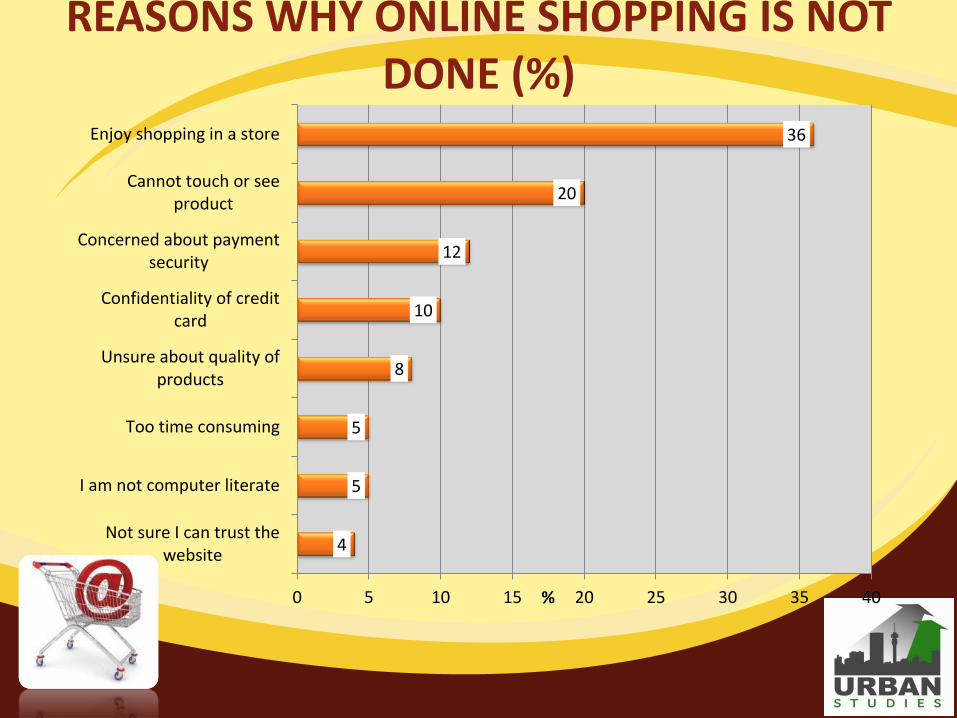
REASONS WHY ONLINE SHOPPING IS NOT DONE (%)
4
5
5
8
10
12
20
36
0 5 10 15 20 25 30 35 40
Not sure I can trust thewebsite
I am not computer literate
Too time consuming
Unsure about quality ofproducts
Confidentiality of creditcard
Concerned about paymentsecurity
Cannot touch or seeproduct
Enjoy shopping in a store
%

NON ONLINE SHOPPERS (58%): FUTURE USE
49
28 23
0
10
20
30
40
50
60
Yes No Unsure
%
An additional 40% of total market will eventually do online shopping

SPENDING ON ONLINE RETAIL
5.7
7.4
9.6
12.1
15.1
18.1
0.0
2.0
4.0
6.0
8.0
10.0
12.0
14.0
16.0
18.0
20.0
2013 2014 2015 2016 2017 2018
Online Retail Spend Rand (billion)
ALL ABOVE INDICATED ACCELERATED GROWTH

FUTURE TRENDS The survey indicated the following future trends:
• Same day delivery by some malls in USA
Click and collect
New Store Designs/Will need a reason to go
Experiential shopping - Experiential marketing
Window shopping replaced by screen shopping We want an online experience, the store experience, the
book experience - all to be synergistic
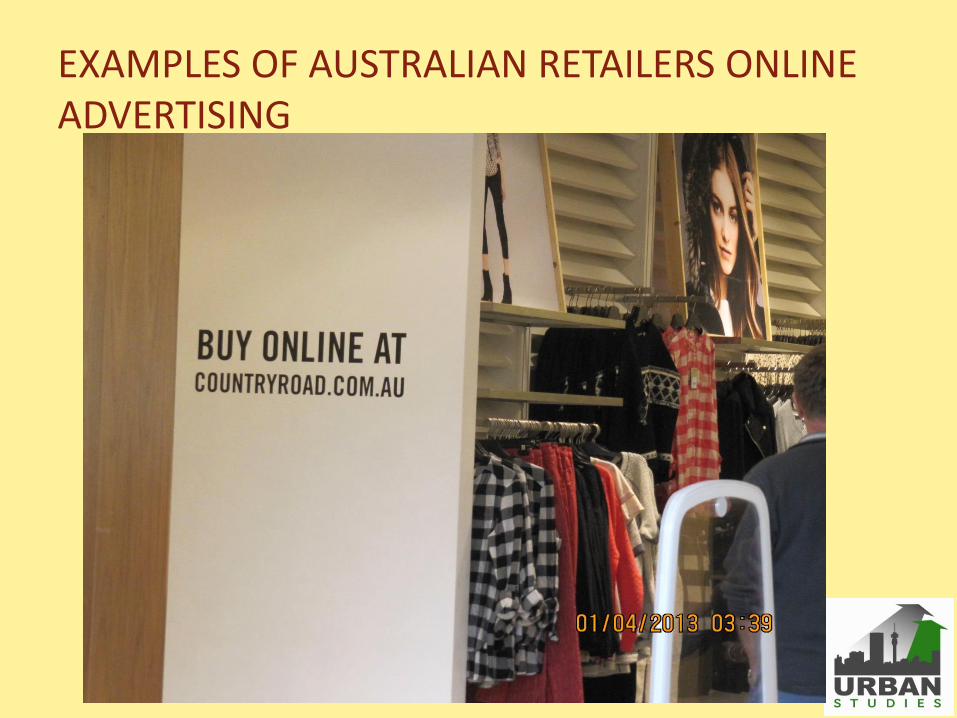
RETAILERS NOT OFFERING ONLINE SHOPPING YET – BETTER WAKE UP SOON!

EXAMPLES OF AUSTRALIAN RETAILERS ONLINE ADVERTISING
EXAMPLES OF AUSTRALIAN RETAILERS ONLINE ADVERTISING
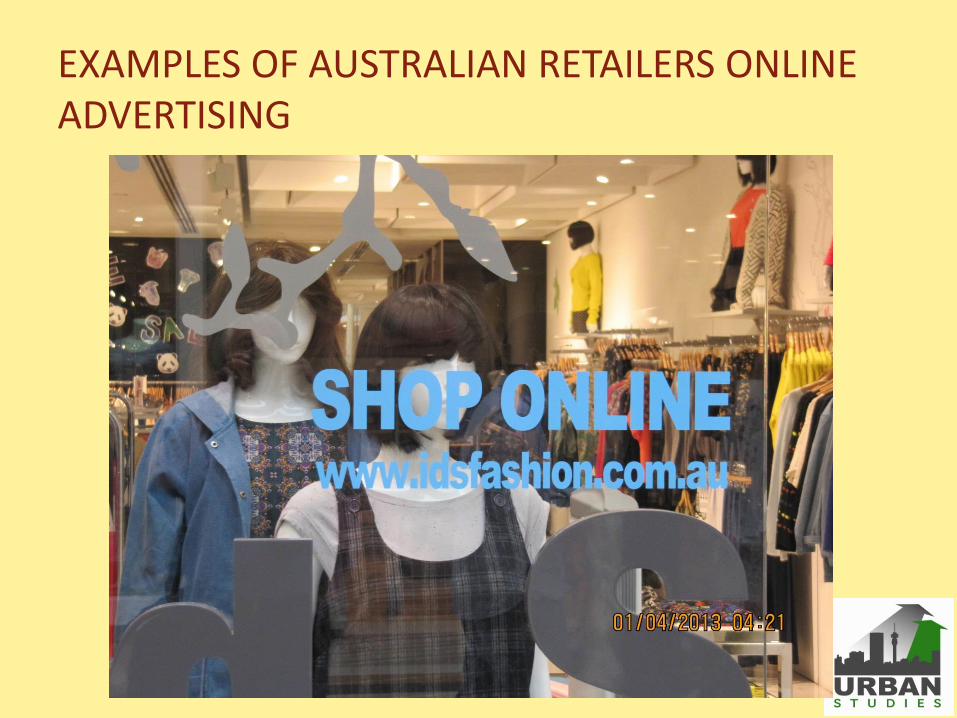
EXAMPLES OF AUSTRALIAN RETAILERS ONLINE ADVERTISING

EXAMPLES OF AUSTRALIAN RETAILERS ONLINE ADVERTISING
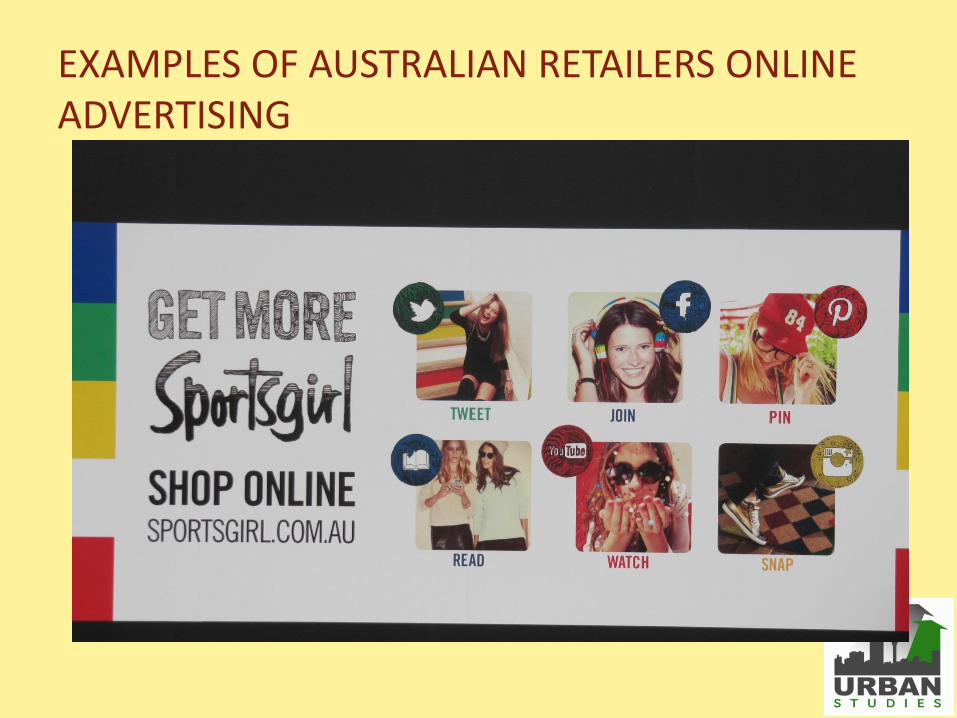
EXAMPLES OF AUSTRALIAN RETAILERS ONLINE ADVERTISING

Adidas NEO Window Shopping - QR Code window

MULTI - CHANNEL RETAILING SOUTH AFRICA IS FAR BEHIND AND
WILL HAVE TO CATCH UP
www.urbanstudies.co.za
(011) 888 2169
082 450 8819