Embed Size (px)
Citation preview

i
“DETERMINANTS OF CATTLE SUPPLY AND THE ROLE OF ETHIO-SUDAN CROSS-BORDER TRADE: THE CASE OF
NORTH GONDAR ZONE AMHARA NATIONAL REGIONAL STATE’’
M.Sc. Thesis
By MENGIST ALEMAYEHU
Submitted to
Indira Gandhi National Open University
In Partial Fulfilment of the Requirements For
THE DEGREE OF MASTER OF ARTS (ECONOMICS)
MAY 2012

i
PROJECT WORK
Programme Code: MEC
Course Code: MECP – 001
Enrolment No.
Study Centre Code
Regional Centre: Ethiopia
Study Centre Name: St. Mary’s University College
TOPIC OF THE PROJECT WORK “DETERMINANTS OF CATTLE SUPPLY AND THE ROLE OF ETHIO-SUDAN CROSS-BORDER TRADE: THE CASE OF NORTH GONDAR ZONE AMHARA NATIONAL REGIONAL STATE’’.
Project work submitted to the Indira Gandhi National Open University in partial
fulfilment of the requirements for the award of the Degree – Master of Arts
(Economics).I hereby declare that this work has been done by me and has not
been submitted elsewhere.
Signature of the candidate
Name of the candidate MENGIST ALEMAYEHU
Address:
E-mail: [email protected] Gondar, Ethiopia
Year 2012
0 7 9 1 2 5 0 5 2
8 1 0 5

ii
CERTIFICATE
I hereby certify that the Project work entitled “DETERMINANTS OF CATTLE SUPPLY
AND THE ROLE OF ETHIO-SUDAN CROSS-BORDER TRADE: THE CASE OF NORTH
GONDAR ZONE AMHARA NATIONAL REGIONAL STATE’’ submitted by Mengist
Alemayehu is his own work and has been done/redone in the light of evaluator’s comments
under my supervision.
It is recommended that this project be placed before the examiner for evaluation.
Signature of the Supervisor:
Name: Dawit Alemu (Ph.D)
Designation: Coordinator, Agricultural economics, Research Extension and farmers'
Linkage research program, Ethiopian Institute of Agricultural Research
(EIAR)
Address: Addis Ababa, Ethiopia
E-mail: [email protected]
Study Centre Name: St. Mary’s University College
Regional cener: Ethiopia
Date18/05/2012

i
Tables of contents
1 ACKNOLODGEMENT ..................................................................................................... v
2 LIST OF ABBREVIATIONS ........................................................................................... vi
ABSTRACT ............................................................................................................................. vii
CHAPTER I ............................................................................................................................... 1
3 INTRODUCTION .............................................................................................................. 1
3.1 Background of the study ............................................................................................. 1
3.2 Statement of the Problem/s ......................................................................................... 1
3.3 Objectives of the study ................................................................................................ 3
3.4 The research questions and hypothesis ....................................................................... 3
3.5 Significance of the study ............................................................................................. 4
3.6 Scope and limitation of the study ................................................................................ 4
CHAPTER II .............................................................................................................................. 5
4 LITERATURE REVIEW ................................................................................................... 5
4.1 Definition and Concepts .............................................................................................. 5
2.1.1 Market and Marketing concepts ................................................................................ 5
4.2 Framework for Evaluation of Marketing System ........................................................ 6
4.2.1 Market structure ................................................................................................... 6
4.2.2 Market conduct .................................................................................................... 7
4.2.3 Market Performance............................................................................................. 8
4.3 Factors Affecting Market Supply ................................................................................ 9
4.4 Importance of cattle external trade ............................................................................ 10
Chapter III ................................................................................................................................ 11
5 METHODOLOGY ........................................................................................................... 11
5.1 Description of the research site ................................................................................. 11
5.2 Sampling techniques and sample size ....................................................................... 13

ii
3.3 Type, Methods of data collection and Source of Data ....................................................... 13
3.3.1. Primary Data Collection ......................................................................................... 13
3.3.2. Secondary Data .................................................................................................. 14
3.4. Method of data analysis............................................................................................. 14
3.4.1. Descriptive analysis ................................................................................................ 14
3.4.2. Econometrics analysis ............................................................................................ 15
4. RESULTS AND DISCUSSIONS .................................................................................... 19
4.1. Descriptive analysis................................................................................................... 19
4.1.1. Socio-Demographic Characteristics of Sample Farmers ........................................ 19
4.2. Determinants of cattle marketed supply of household (Econometrics analysis) ...... 25
4.2.1 Determinants of cattle market participation: 1st stage heckman estimates ............. 26
4.2.2 Determinants of number of cattle sold: 2nd stage heckman OLS estimates ........... 28
4.3. Markets, market actors and marketing channels ....................................................... 29
4.3.1. Types and roles of market participants .............................................................. 29
4.3.2. Market types and marketing channels................................................................ 34
4.4. Cattle trade marketing system and illegal trade ........................................................ 37
4.4.1. Supply/Market routes ......................................................................................... 37
4.4.2. Mode of Transportation ..................................................................................... 39
4.4.3. Legal versus illegal cattle trade in Ethio-Sudan CBT ........................................ 41
4.4.4. Methods of illegal acts and Major causes for development of illegal cattle trade
45
4.5. Cattle marketing performance ................................................................................... 48
4.5.1. Types and Number of Animals Exported .......................................................... 48
4.5.2. Conduct of cattle market......................................................................................... 53
4.6 Marketing Costs and Profit Margins .................................................................................. 54
4.6.1. Estimates of marketing cost by actor ...................................................................... 54
4.6.2 Marketing margins ................................................................................................... 55

iii
Chapter V ................................................................................................................................. 56
5. Conclusion and recommendations .................................................................................... 56
5.1. Conclusion ................................................................................................................. 56
5.2. Recommendations ............................................................................................................. 60
5. LIST OF REFERENCES.................................................................................................. 63
6 Appendix .......................................................................................................................... 65
Part 1: Socio-economic Situations ........................................................................................... 65
Part 3: Resource ownership and tenure ................................................................................... 66
4.2. What was your input for animal rearing & their sources in 2011? ................................... 68
iv
LIST OF TABLES PAGE
Table 1. Demographic characteristic of sample farmers (Participation) ............................... 20
Table 2: Resource Ownership of the respondents .................................................................... 21
Table 3: Experience and income correlation of the house hold ............................................... 22
Table 4 credit support in the year 2011 ................................................................................... 23
Table 5. Farmers’ access to price information (percentage of farmers) .................................. 24
Table 6 : Description of hypothesized determinants of marketed cattle supply ...................... 26
Table 7 : Determinants of cattle market participation: 1st stage heckman estimates ........... 27
Table 8: Determinants of number of cattle sold: 2nd stage heckman OLS estimates ............. 29
Table 9: Number of Beef cattle exported legally. .................................................................... 49
Table 10: The number of animals exported illegally to Sudan has also been recorded by
custom office. ........................................................................................................................... 50
Table 11 Legal and illegal export cattle in the year 2011 ........................................................ 51
Table 12: Market cost for different Market agents (Birr) ........................................................ 55
Table 13: Average market cost, average. Purchase price, average selling price and profit
margins ..................................................................................................................................... 55
List of Figures Page
Figure 2 Map of the Study Area .............................................................................................. 12
Figure 3: The above figure indicates the existing market channel operating in the study area
.................................................................................................................................................. 35
Figure 4: Map of N/G Zone and source: N/G Zone plan and Finance department, 2012 ....... 39
Figure 5: North Gondar Illegal and Legal Livestock Trader Mobility Map ............................ 44
Figure 6: Number live animal exported with the respected year. ............................................ 50
Figure 7: Illegally exported live animal with the respected year. ............................................ 50
Figure 8 Legal and illegal export cattle in the year 2011 ........................................................ 52
List of Annex
Annex 1 .................................................................................................................................... 65

v
1 ACKNOLODGEMENT
My special and sincere gratitude goes to my Advisor Dr.Dawit Alemu , for his earnest and
constructive comments throughout the analysis and preparation of the manuscript as well as
his motive to share knowledge by providing me those interesting books and other materials.
I would like to thank Austria funded SRMP-NG, for sponsoring or supporting fund to finalise
my M.Sc. study courses.
Other friends like Amsalu Bilew were also with me. Hence, I would like to convey my
heartfelt thanks to everybody who has a hand on my achievements.
Finally, more than everybody, equally to my advisors, I am obliged to extend my gratitude to
my family /my wife Zerfie Birhan, sons Abel and Amanuel and daughter Yididya/ for their
invaluable sacrifice in every perspective until I finalized the study. Without their support,
completion would have not been real. All honours associated with this degree (if appear)
belong to them, more than me.

vi
2 LIST OF ABBREVIATIONS
ANRS Amhara National Regional States
ACSI Amhara Credit and Saving Institution
ARDO Agricultural and Rural Development Office
BOARD Bureau of Agriculture and Rural development Office
CBT Cross-border Trade
COMESA Common Market for Eastern and Southern Africa
CSA Central Statistics Authority
FAO Food and Agriculture organization
GDP Gross Domestic Product
HHs House hold heads
Ha Hectare
IDP Integrated Development Project
ILDP Integrated Livestock Development Project
ILRI International Livestock Research Institute
KMS Killo-meters
MEDaC Ministry of Economic Development
NGZ North Gondar Zone
NGO Non-Governmental Organization
N Number of respondents
OLS Ordinary Least of Squares
SCP Structure –Conduct-Performance
USA united States of America
USID United States International Development
FGDS Farmers Group discussion
KII Key informant interviw
vii
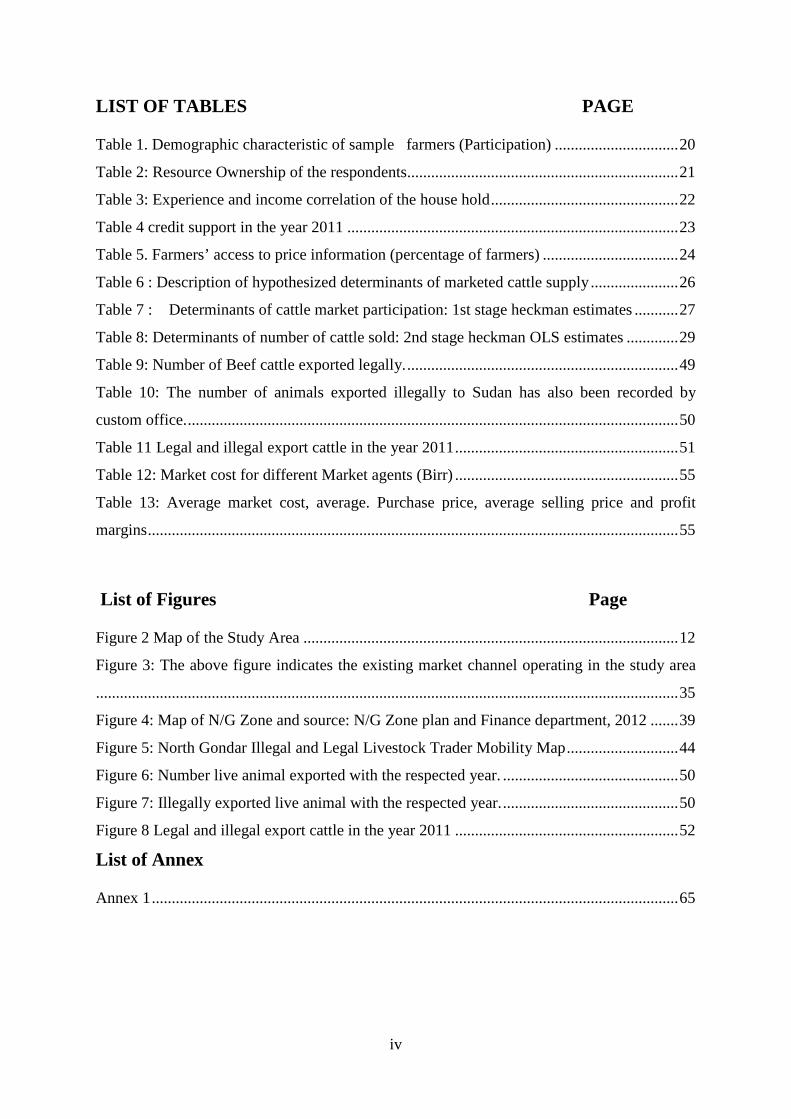
ABSTRACT The study conducted in Metema woreda results reflected that several factors were responsible for supplying cattle to the market. Cash need for different purposes especially weed and restocking cattle has been underlined the basic deriving force for cattle supply. Engagement of off-farm, non-farm and fattening activities to diversify farmers’ sources of income initiates them to transfer from cattle (in kind) to cash through cattle supply to the market.Metema woreda is one of the low land woredas in the Zone, which have high cattle potential resources. Having ample cattle resources per household according to the respondents leads them to supply more cattle to the market. Both legal and illegal cattle marketing systems are operating at different magnitudes in the Amhara Region’s Ethio-Sudan cross-border cattle trade. Small farmer exporters and traders are the major actors in the illegal cattle marketing system while medium- to large scale licensed exporters and cooperatives are dominantly operating in the legal system. In the view of the respondents, be it legal or illegal system oxen and bulls were highly demand for export than other cattle types. The data obtained from Metem yohannes world food program data collection centre different sector offices, household interview and group discussions, prevailed that the market share of the illegal cattle export was reduced from 60% to 31% in the year 2011.In the study area, different actors participated in cattle supply market includes producers, local assemblers, wholesalers(collectors), cooperatives, Brokers, Butchers, consumers and large scale exporters and all have played independent role in the market. There are three types of exporters who sell cattle in the Ethio-Sudan cross-border export legal and illegal terminal points: Cooperatives, large-scale exporters and small scale illegal exporters. Supply of cattle to the primary, secondary and also the terminal markets is mostly done through trekking and trucking routes. The majority of cattle are trekked through villages and small towns. Mostly smallholder farmer exporters use the traditional trekking routes to reach the illegal terminal markets. Several factors that contribute to the development of the illegal marketing system have been identifiedThe presence of tariff rate charged by Sudan authorities for cattle that go through legal route and no tariff imposed on importers for cattle that go through the illegal route as they are sold inside Sudan. This practice may be encouraging importers to buy cattle from small farmer exporters operating in the illegal system. Lack of adequate modern market centres which consists of different components such as feed, water, shade, etc has positively contributed to the existence of illegal cattle trade. Recently one modern livestock market centre was constructed and functional as terminal market for the whole cattle go through Metema to Sudan. This situation enforces the cattle producers living within 40 kms radius between Gendewuha to Metema yohannes(the border) to take their cattle and sell Gendewuha market. According to sample respondents selling their cattle at this market lead them to waste time and incurs cost as well as unfortunately if the cattle cannot sold on time they obliged to bring back home. .
1
CHAPTER I
3 INTRODUCTION
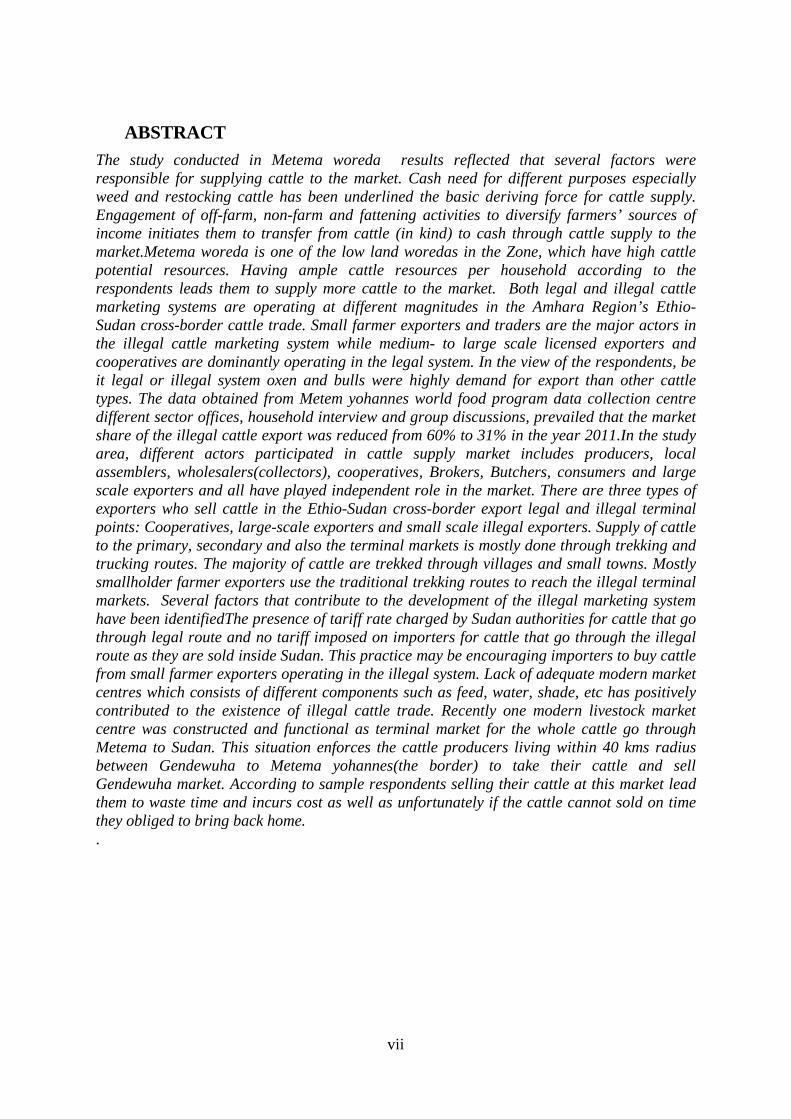
3.1 Background of the study
Ethiopia’s economy is predominantly agricultural. Agriculture is the mainstay of the country's
economy employing 85% of the labour force and accounting for nearly 50% of the gross domestic
product (GDP) and about 90 percent of the export earnings are derived from this sector( MEDaC
(1999).
Ethiopia’s share in agricultural exports of the world in value terms was about 0.23 percent per year in
1960’s. This share fell to 0.20 percent in the 1970’s and 0.15 percent in the 1980’s (Teressa, 2000).
Following the economic reform in the early1990s, Ethiopia’s development strategies visualize export-
lead growth (MEDaC, 1999); and hence the government took initiatives and made continued effort to
improve the performance of the external sector by adopting various measures.
The country’s performance of export earning has been rising between 1991/92 and 1997/98; the
exports of the country registered an average growth rate of 23.30 percent per year. However, be it
cattle or other live animals/ commodities, the export performance of the country remains very weak.
The weak export performance of the sector is mainly associated with the limited market orientation
and commercialization of farmers in the production process. This research focuses on identification of
important factors affecting the market orientation in cattle production along with the assessment of
how the market works.
3.2 Statement of the Problem/s
Ethiopia has the largest livestock population and the highest draft animal population in Africa. There
are approximately 35 million cattle, 39 million shouts, 8.6 million equine, 1 million camels and 55.4
million chickens in the country (FAO 1999). The Amahara region accounts for 25% of cattle, 36% of
2
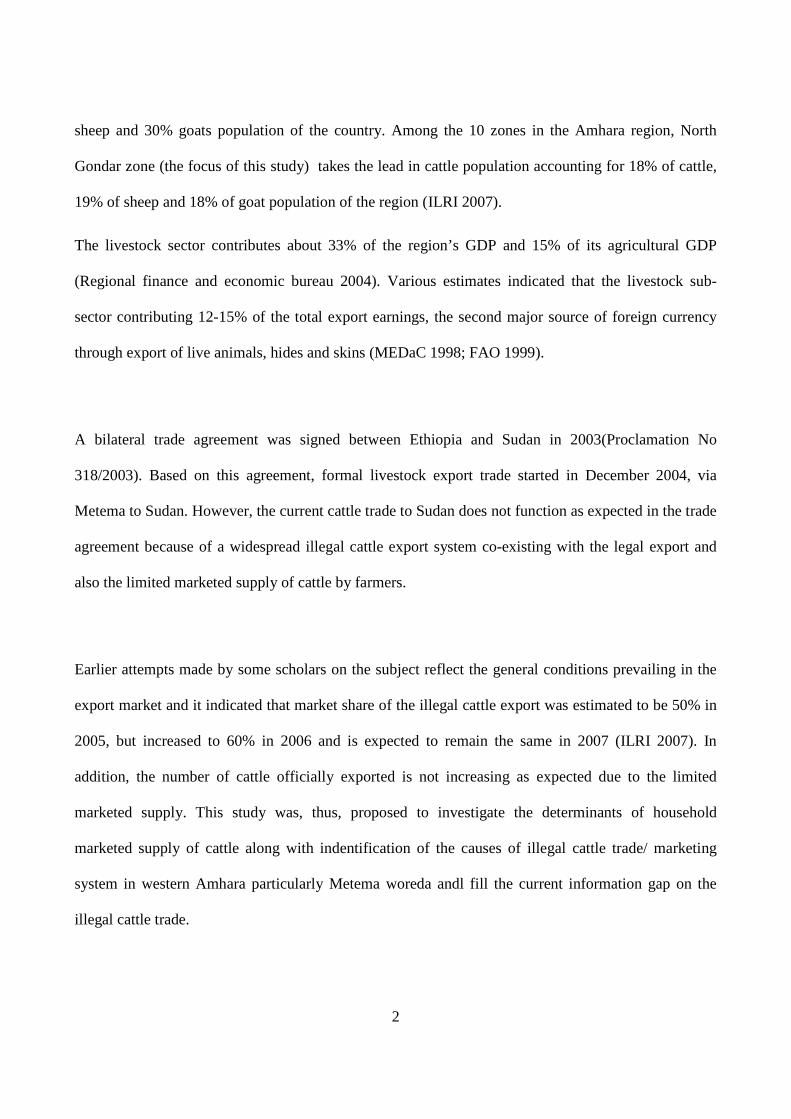
sheep and 30% goats population of the country. Among the 10 zones in the Amhara region, North
Gondar zone (the focus of this study) takes the lead in cattle population accounting for 18% of cattle,
19% of sheep and 18% of goat population of the region (ILRI 2007).
The livestock sector contributes about 33% of the region’s GDP and 15% of its agricultural GDP
(Regional finance and economic bureau 2004). Various estimates indicated that the livestock sub-
sector contributing 12-15% of the total export earnings, the second major source of foreign currency
through export of live animals, hides and skins (MEDaC 1998; FAO 1999).
A bilateral trade agreement was signed between Ethiopia and Sudan in 2003(Proclamation No
318/2003). Based on this agreement, formal livestock export trade started in December 2004, via
Metema to Sudan. However, the current cattle trade to Sudan does not function as expected in the trade
agreement because of a widespread illegal cattle export system co-existing with the legal export and
also the limited marketed supply of cattle by farmers.
Earlier attempts made by some scholars on the subject reflect the general conditions prevailing in the
export market and it indicated that market share of the illegal cattle export was estimated to be 50% in
2005, but increased to 60% in 2006 and is expected to remain the same in 2007 (ILRI 2007). In
addition, the number of cattle officially exported is not increasing as expected due to the limited
marketed supply. This study was, thus, proposed to investigate the determinants of household
marketed supply of cattle along with indentification of the causes of illegal cattle trade/ marketing
system in western Amhara particularly Metema woreda andl fill the current information gap on the
illegal cattle trade.

3
3.3 Objectives of the study
The study has both general and specific objectives. The general objective of the study is to analyze
cattle trade with due emphasis illegal cross-border trade in North Gonder with the following specific
objectives:
1. To identify factors affecting household level marketed supply of cattle;
2. To assess the marketing channels and the role and linkage of the different marketing agents; and
3. To identify factors contributing to the development of illegal cattle trade
3.4 The research questions and hypothesis
The following are the major questions that study will answer:
1. What are the factors determine the level of farm households’ cattle market supply?
2. What are the factors that contributing to the illegal cattle trade?
3. Do age, sex and educational level of the households determine the size of cattle supply to the
market?
4. How the number of cattle owned and access to input credit of the household contributed to
cattle supply to the market?
5. Does the existence of fattening/cattle cooperatives increase the supply?
6. Which marketing channel is most important?
The study will test the following hypotheses:
H1: There are a number of factors (socio-demographic, resource related, access to services and
market, and also policy related that are important in determining household level market
supply of cattle
H2: Among the existing market channels, some are important, which need due consideration.

4
H3: The less flexible in licensing, quarantine certification, currency procedure and the
length of border distance and closeness of the settlement pattern the two countries more
will be the illegal cattle trade.
3.5 Significance of the study
External trade is an engine of the economic development. The exports of least development country
like Ethiopia is depend up on primary products and live animals in general and cattle in particular. The
country in general and the Amhara region in particular have ample resources of cattle.
Though there is co-existence of the illegal trade, the export of cattle to Sudan from the Amhara region
has shown significant growth in recent years both in number and value earned after the trade
agreement signed in 2003 between Ethiopia and Sudan. Hence, information gathering and analysing on
factors determine household level cattle supply, factors contributing for the development of illegal
cattle trade and point out marketing channels and the role and linkage of marketing agents cattle trade
could be a critical input in designing appropriate policy to reduce illegal cattle trade and increased
value earned from it.
3.6 Scope and limitation of the study
The study was limited to only cattle marketing trade in terms of coverage. Besides, it covered a single
woreda, Metema as supply source with due emphasis to illegal cattle trade though weredes like Quara,
Tachi-Armachiho, and Eastern Armachiho are also important source of cattle in the zone. The
coverage was limited to Metema woreda mainly due to lack of budgetary and time limitations.
However, the similarity of the production and marketing systems in these woredas with the selected
woreda Metema, the results of the study are expected to apply for these woredas in the zone.

5
CHAPTER II
4 LITERATURE REVIEW
4.1 Definition and Concepts
2.1.1 Market and Marketing concepts A market is traditionally defined as a specific geographical area where buyers and sellers meet for
exchange of goods and services. The most common way we obtain goods and services we do not
produce ourselves is to buy them from others who specialize in producing them. To make such
purchases, buyers seek out sellers in markets. Markets are ways in which buyers and sellers can
conduct transactions resulting in mutual net gains that otherwise would not be possible (Hyman, 1989).
Modern definition considers market as an arena for organizing and facilitating business activities and
for answering the basic economic questions (Kohls and Uhl, 1985) described market as how much to
produce? What to produce? How to distribute production? A location, a product, a time, a group of
consumers, or a level of the marketing system may define it. The most observable features of a market
are its pricing and exchange processes. This investigation adopts the product definition of market. A
market is also defined to include people, money and willingness to buy (Stanton and Futrell, l987) and
( Getachew Bashargo, 2002).
Marketed supply: this term indicates the number of cattle a household supplied to the market over a stated
period of time, usually over a year taking into consideration production seasons.
Illegal cattle trade is unofficial live animal trade that are under taking by individual farmers and
animal traders. Small farmer exporters and traders are the major actors in the illegal cattle marketing

6
system. In this system, the pricing mechanism is ‘Silent Auction System’ which is operating in a
manner that defies transparency.
The existence of the illegal marketing system is highly associated with the behaviour of key actors and
characteristics of the cross-border livestock trade. It is often characterized by financial constraint and
operates under informal credit market based on friendship and relationship between farmers, and the
small farmer exporters and traders (ILRI, 2007)
4.2 Framework for Evaluation of Marketing System
The development of reliable and stable market system has been an important element in
commercialization and specialization in the agricultural sector. In order to study the Functioning of
markets many researchers have applied the Structure-Conduct-Performance SCP) paradigm. The SCP
approach was developed in the United States as a tool to analyze the market organization of the
industrial sector and it was later applied to assess the agricultural system and this framework was to
evaluate the performance of industries in the USA (Wolday, 1994 and citing Meijer, 1994).
Subsequently, it was applied in the functioning markets in agricultural sector, and served as a tool to
evaluate the performance of the commercial system. The framework distinguishes between three
related levels; the structure of the market, the conduct of the market, and the performance of the
market.
4.2.1 Market structure
Market structure includes the characteristics of the organization of a market that appear to exercise a
strategic influence on the nature of competition and pricing within the market (Bain, 1968 as cited in
Wolday, 1994). The most salient features of market structure are: the degree of sellers and buyers’
concentration, the degree of product differentiation among the outputs of the various sellers in the
market, the degree of market transparency which refers to the availability of relevant market

7
information, its distribution among buyers and sellers, and its adequacy in terms of price sharpening,
quality comparisons and risk reduction or uncertainty about the future and barriers to entry or freedom
to entry and exit to the market. If structure is to be conducive to high levels of economic efficiency,
there should be a sufficient number of firms in an industry given the size of the overall market and
firms of an appropriate size needed to fully capture the economies of scale; there should not be barriers
to entry or exit from the market; and firms are able to differentiate and improve products over time as
they compete against one another (Solomon Tilahun, 2004).
Scarborough and Kydd (1992) and Magrath (1992) evaluated this market or industry structure by
examining trends in the number and sizes of firms relative to each other, and to number of customers and
producers in particular time and place; the presence, absence, levels and nature of entry barriers; and the
distribution of market information and its adequacy in sharpening price and quality comparisons and in
reducing risk. The number of firms operating in a particular market or related markets can be indicative of
the extent to which buying and selling power is concentrated amongst them. A few large firms can
dominate a market and control prices. The concentration ratio, which measures the proportion of total sales
in a market by a given firm, can be used to indicate the level of concentration of market share,
(Gizachew,2002)
4.2.2 Market conduct
Market conduct refers to the patterns of behaviour that enterprises follow in adopting to the markets in
which they sell or buy. The principal dimensions of market conduct according to Raid (1987) include
price setting, the manner in which the value and quality ranges of products are determined, advertising
and marketing strategy, research, development planning, implementation, and legal tactics.
“Acceptable conduct” includes the aspects that there are enough firms in the market to create some
uncertainty in the minds of firms’ managers regarding whether price changes 31 both up and down will

8
be followed by competitors; there is no unjustified price discrimination; there is no collusion among
different firms on pricing or other matters.
4.2.3 Market Performance
market performance according to Bain (1968) refers to the composite of end results which firms in the
market arrive at by pursuing whatever lines of conduct they espouse-end results in the dimensions of
price, output, production and selling cost, product design, and so forth (Wolday, 1994). For firms
acting as sellers, these results measure the character of firms’ adjustments to the effective demand for
their outputs; for firms buying goods, they measure the quantity of adjustments made by firms to the
supply conditions of the goods they purchase (Gizachew Getaneh, 2005).
Market performance can be evaluated by analysis of costs and margins of marketing agents in different
channels, and market integration. A commonly used measure of system performance is the marketing
margin or price spread. Margin or spreads can be useful descriptive statistics if used to show how the
consumer’s food price is divided among participants at different levels of the marketing system
(Getachew, 2002).
Functional Approach: In this approach, each function is analyzed in relation to the importance of its
performance in marketing different products and according to the nature of its performance by
investigating each of the functions performed in marketing and by examining the problems met in the
performing function; it is possible to gain an understanding of marketing problems.
Institutional Approach : This approach concentrates on the description and analysis of the different
organizations engaged in marketing (producers, wholesalers, agents, retailers, etc) and pays special
attention to the operations and problems of each type of marketing institution (Cundiff and Still, 1964;
Kohl and Uhl, 1985). The institutional analysis is based on the recognition of the foremost marketing
channels and it considers the analysis of marketing costs and margins (Mendoza, 1991).

9
Commodity Approach: The marketing situation of each product chosen for study is examined from such
standpoints as sources and conditions of supply, producers’ organizations and policies, the different
middlemen who take part in the distribution of the product, and the characteristics and extent of the market
for the product is analyzed (Cundiff and Still, 1964). The combination of functional and institutional
approaches is applied to a selected product or commodity. This study adopts this approach and attempts to
give detailed analysis of the specific problems encountered in marketing a particular product.(Solomon
Tilahun)
4.3 Factors Affecting Market Supply
The market supply refers to the amount actually taken to the markets irrespective of the needs for
home consumption and other requirements by farmer (Wolday, 1994). Bellemare and Barrett (2006)
estimated factors affecting sell of animals in Kenya and Ethiopia. They observed that the net purchase
and net sales volume choices depend on expected market participation. The household head sex
(female headed), age, family size, herd size, female TLUs, encumbered males, and small stock (sheep
and goat) had significant and negative influence on number of animals sold. Unlikely, assets, land
holding, other income, encumbered females, and average price of larger stock (camels and cattle) had
correlated positively with number of animals sold. Also a study in Alaba Siraro district by Wolday
(1994), identified factors that affected market supply of food grain (teff, maize and wheat) by using
variables such as the size of output, market access, family size, and income from pepper. He identified
that size of output (teff, maize and wheat) significantly and positively affected teff, maize and wheat
supplied. On the other hand, access to market significantly and negatively affected volume of sale of
teff and maize. Poor accesses to the market negatively affected maize sold while positively affected
teff and wheat sold. Family size also significantly and positively affected quantity supplied of teff and
wheat while it negatively affected quantity supplied of maize.

10
A similar study was conducted by Holloway et al (1999). Their study sought to identify alternative
techniques for affecting participation among peri-urban milk producers in the Ethiopian highlands.
They found that cross breed cow type, local breed cows, education level of household head, extension
contact, and farming experience of household head positively affected quantity of milk sold while
distance to the market affected the volume of sale negatively(Rehima, 2006)
4.4 Importance of cattle external trade
Cross-border cattle trade represents one of the most significant growth areas of the regional trade in
Africa. Since 1990 it has grown from a relative minor informal activity to a dynamic enterprise that
contributes to the local and regional food security, meat consumption in large urban centres, contribute
to government revenue and poverty alleviation among the vulnerable populations, such as pastoralists
(COMESA, 2009).Moreover, cattle exports have played a major role in the economy as a source of
employment, income, foreign exchange, and food imports (USID, 2002). Export trade has different
importance of Division of labour and specialisation, Availability of multiple choices, Raises standard
of living of the people, Facilitate economic development, etc.

11
Chapter III
5 METHODOLOGY
5.1 Description of the research site
The Amhara National Regional State (ANRS) is one of the states of the Federal Democratic Republic
of Ethiopia among nine regional states and two city administrations. The ANRS is located in the North
western part of the country between 8045' and 13045' North latitude and 35045'and 400 25' East
longitudes. The total area of the region is 170, 752 km2. The population of the region was estimated to
be 17.7 million in 2003.
North Gondar Administrative Zone is one of the Zone’s of the Region and located in the north –
western part of the country between 11056' and 13045' North latitude and 35011'and 350 50' East
longitudes, 738 km. from Addis Ababa.
The total area of the Administrative Zone is 50,970 square kms. Its total population of the North
Gondar Zone 2,606,963 of which 1,319,662 are males and the rest 1,287,301 are females.
Metema woreda in which the study will be focused on located about 900 km North West of Addis-
Ababa and 188km West of Gondar town and have an estimated area of 440 square km; bordering with
Sudan, Tigray region, and the Woredas of Quara, Chilga, Alefa, and Tach Armachiho in the Amhara
Region. The Woreda has a total of 20 Peasant Kebele administrations, of which 18 are rural based
peasant administration areas (ILRI, 2005; ARDO, 2005).
The woreda`s total population and households are estimated to be 91,216 and 20,666 respectively. The
woreda altitude is estimated to range from 500 to 1,608 meter above sea level, the minimum annual

12
temperature ranges from 22 – 28 degree centigrade, and the maximum temperature reached as high as
43 degree centigrade and the mean annual rain fall ranges from 850 to 1110 mm characters.
Source: North Gondar Zone Finance and economic development, 2012
Figure 1 Map of the Study Area

13
5.2 Sampling techniques and sample size
A three-stage sampling technique in combination of both purposive and random sampling was
employed to draw sample of household heads. In the first stage, out of the total five border woredas of
North Gonder zone, Metema Woreda had been selected purposively because of its importance in cattle
supply and also illegal trade. In the second stage, two Rural Administration Kebeles out of the total of
20 kebeles of Metema woredas was also selected taking into consideration access to markets and
importance in cattle production and supply. At third stage, respondent households were selected
randomly from the cattle rearing households in the two kebeles using proportion to population size to
have a total of 120 samples size. The samples size was determined considering the budget and time
available along with the need to ensure representativeness.
3.3 Type, Methods of data collection and Source of Data
Both Quantitative and qualitative data using both formal and informal surveys were collected from
primary and secondary sources.
3.3.1. Primary Data Collection
The required data generated through a formal survey using pre-tested semi-structure questionnaire
from randomly selected cattle owners in the target area. The questionnaire had information about
socio-demographics, resource ownership, access to services, marketing practices, perception and
participation in illegal trade etc. The Heckman two stage models were proposed applied for empirical
analysis provided that sufficient respondents do not participate in the market. If all the respondents
participate in the cattle market then OLS regression model will be employed. However, the result
indicated that out of 120 sample households only 10% of the respondents did not participate in cattle
selling process and hence, it was mandatory to use OLS regression model especially Dummy variable

14
Regression Model and applied his for empirical analysis. Additional required data was also generated
using informal survey (key informants, focus group discussions, etc) especially for the market channel
analysis, marketing margin analysis, and documentation of the extent and factors contributing illegal
trade.
3.3.2. Secondary Data
Secondary data collected for the purpose of this study. First an attempt had made map out the market
chain of livestock export as well as identification of the cattle trade routes and the key actors along
with their linkages (for both legal and illegal trade). On top of this, estimation of the number of
animals handled annually by each identified channel and identification of the major constraints and
opportunities in the identified channels. The secondary data office of agriculture, Custom Authority,
Trade and industry department, Quarantine service station, Ethiopia Federal police stationed at the
border area of between Ethiopia and Sudan. Third, in addition to the above mentioned stakeholders,
producers, small exporter farmers, large scale exporters, fatting cooperatives members, exporter’s
association members, and brokers, as against non-participant Households of the surrounding
communities and leaders were interviewed.
3.4. Method of data analysis
3.4.1. Descriptive analysis
To explain the situation of cattle market channel and export trade, (objective 2 and 3), descriptive
analysis and inferential statistics have been used to analyse the data generated from the informal
survey. Time series like monthly and yearly legal and illegal export volume between 2011, and
cross-sectional like frequency distribution such as income, mean, standard deviation and percentiles,
etc have been extensively used to explain basic characteristics of export trade. To support the analysis

15
different tables, graphs, maps, figures and photos will also be used. SPSS and STATA software were
used for analysis purpose.
3.4.2. Econometrics analysis
This part of the analysis dealt with the analysis of understanding determining variables to for
participation of the cattle supplied to market. For managing this, proposed methodology was probit
estimation for participation probability and Heckman two-stages.
5.2.1.1 3.4.2.1 Factors affecting cattle supply participation
The possible econometric models that can be applied for identification of the determinants of marketed
supply taking into consideration both market participation (zero/one) and level of market participation
(intensity of participation) are (1) tobit, (2) Heckman two-stage (heckit model), or (3) double hurdle
models. The tobit model as opposed to the other two models assumes that the same factors affects both
participation and intensity of participation. In the other hand both heckit and Double hurdle are similar
in identifying the rules governing the discrete outcomes (zero or positive), in recognizing that
outcomes are determined by the selection and level of use decision, and in permitting the possibility of
estimating the first- and second-stage equations using different sets of explanatory variables. The
difference between the two is the fact that Heckit, as opposed to double-hurdle, assumes that there will
be no zero observations in the second stage once the first-stage selection is passed, and the double-
hurdle considers the possibility of zero realizations (outcomes) in the second-hurdle arising from the
individuals’ deliberate choices.
Taking into consideration that there will not be zero realization of the outcome in the second stage of
the issue addressed, the present study will use Heckman (1979) two – step estimation method in order

16
to indentify the determinants of household marketed supply of cattle. The first step refers to the
participation households in cattle supply to the market and second step to the level of participation:
First, the probability of participation will be modelled by Maximum Likelihood Probit model. From
the Probit model the inverse Mill’s ratios will be estimated to be used as explanatory variable in the
second stage address the issue of selection bias. The Probit model is specified as:
Yi = xi’βi+ εi, i = 1, . . . , n (1)
Where: Yi is a dummy variable indicating the market participation that is related to it as Yi = 1 if Yi >
0, otherwise Yi = 0
βi are the variables determining participation in the Probit model,
xi’ is unknown parameter to be estimated in the Probit regression model,
εi is random error term
Then the parameters can consistently be estimated by OLS over n observations reporting values for Yi
by including an estimate of the inverse Mill’s Ratio, denoting λi, as an additional regressor in (2).
More precisely selection model is specified:
Yi = xi’β i + µλi + ηi (2)
Where Yi is the volume of supply in the second-step,
βi is unknown parameter to be estimated in the quantity supply,
xi’ are the explanatory variables determining the quantity supply,
µ is a parameter that shows the impact of participation on the quantity supply,
ηi is the error term

17
In both (1) and (2) marginal effects will be estimated and will be used in the interpretation. The
Heckman two-stage model will be employed provided that there will be sufficient zero responses for
the probit model dependent variable (i.e. cattle owners who did not participate in the market). If not
then, an OLS.
Xi is explanatory variables listed under:
Age (AGE) -Age of the household, a continuous variable, was taken as one of the explanatory
variables to influence participation to production. The expected sign was positive as age one of the
parameters of human capital. As an individual stays long, he will have better knowledge and will
decide to participate.
Sex of the respondent (SEX_RES) - a dummy or categorical variable taking zero if female and 1 if
male was one variable to be considered. No sign could not be attached with the variable.
Educational level (EDEL) – Educational level was one of dummy variable proposed to influence
participation decision positively. As the educational level of the farmers increases participation in
cattle supply to the market increases.
Family size (FAM_SIZ) - Family size of a respondent was one variable (continuous variable)
proposed to influence participation decision. The more number of family members an individual had
the more probable to participate consumption participation.
Number of cattle owned (NCTTOWN) – for more need cash or minimized risk as theft and
insecurity, participation probability would increase as farmers increased their number of cattle
ownership. The expected influence is positive. It was discrete continuous variable.
Extension service (EXT_SER) - this was a dummy or categorical variable indicating extension
service farmers were getting. This variable was expected to influence participation positively.
Obviously, as farmers learned more and knew much it would be direct obvious to participate in supply.

18
Experience (EXP) – This continuous variable measured by number of years was expected to influence
production participation positively. As farmers got more experience in production and marketing, the
probability of to participate would be higher.
Access to credit (ACRED ) – this was a dummy or categorical variable indicating credit service
farmers were getting. This variable was expected to influence participation positively. Obviously, as
farmers get credit for fattening it would be direct obvious to participate in supply.
Fear of theft (FTF) – was a dummy variable reflecting fear and insecurity on their cattle. It had
positive influence to supply cattle in the market.
Training participation (TRPRP ) - this was a dummy or categorical variable indicating extension
service farmers were getting. This variable was expected to influence participation positively.
Obviously, as farmers learned more and knew much it would be direct obvious to participate in supply.
Market price information (MTS) – This was a variable proposed to influence decision to
participation positively. If a farmer could get historical data, he would be able to participate. The
variable was considered dummy. Assigning zero if a farmer got information and zero if not.
19
Chapter IV
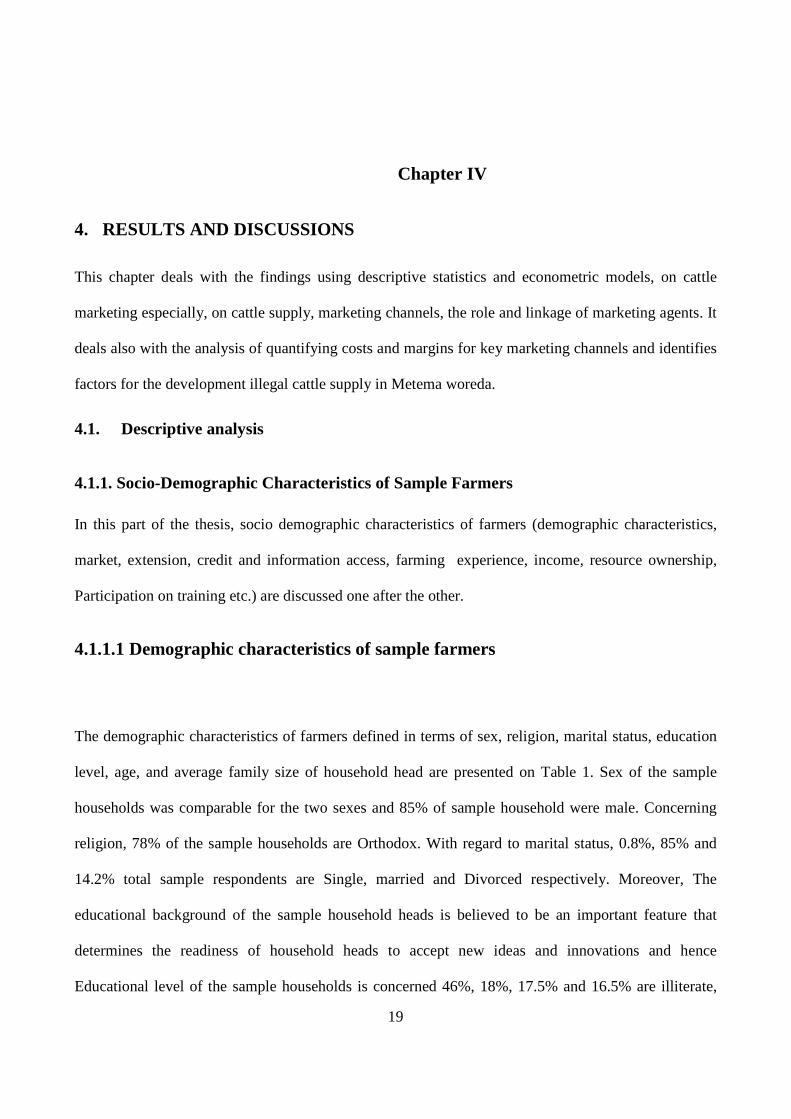
4. RESULTS AND DISCUSSIONS
This chapter deals with the findings using descriptive statistics and econometric models, on cattle
marketing especially, on cattle supply, marketing channels, the role and linkage of marketing agents. It
deals also with the analysis of quantifying costs and margins for key marketing channels and identifies
factors for the development illegal cattle supply in Metema woreda.
4.1. Descriptive analysis
4.1.1. Socio-Demographic Characteristics of Sample Farmers
In this part of the thesis, socio demographic characteristics of farmers (demographic characteristics,
market, extension, credit and information access, farming experience, income, resource ownership,
Participation on training etc.) are discussed one after the other.
4.1.1.1 Demographic characteristics of sample farmers
The demographic characteristics of farmers defined in terms of sex, religion, marital status, education
level, age, and average family size of household head are presented on Table 1. Sex of the sample
households was comparable for the two sexes and 85% of sample household were male. Concerning
religion, 78% of the sample households are Orthodox. With regard to marital status, 0.8%, 85% and
14.2% total sample respondents are Single, married and Divorced respectively. Moreover, The
educational background of the sample household heads is believed to be an important feature that
determines the readiness of household heads to accept new ideas and innovations and hence
Educational level of the sample households is concerned 46%, 18%, 17.5% and 16.5% are illiterate,

20
Read and write, Primary and secondary correspondingly. The chi-square test indicates that there is a
significant contribution to supply cattle to the market as the participant educational level increases at
1% significance level in their education. Moreover, in the same table the respondents’ household heads
age prevails that at the age between 41-51 years the farmers were participated more actively than the
rest. The average family size of the farmers is 5.55. This result indicates that almost all the household
heads are under the category of economically active age population and the average family size is also
closer to the regional and national average family size (CSA, 2010)
Table 1. Demographic characteristic of sample farmers (Participation)
N= 94 N= 26 N= 120 χ2/t- value
Variables Participant Non participant Total participant
Sex Male 84 18 102(85%) .155
Female 10 6 16
Religion Orthodox 77 17 94 (78%) .372
Muslim 17 7 24
Marital Status single 1 0 1
Married 81 21 102(85%) .966
Divorced 12 3 15
Education Illiterate 34 21 55 (46%) .001
Read & write 20 2 22(18%)
Primary 20 1 21(17.5%)
Secondary from 20 0 20 (16.5%)
Age of household head 47.6 44.23 46.875 0.1337
(10.435) (8.668) (10.1414)
Average Family size 5.776 4.730 5.55 0.0286
(2.166) (1.991) (2.165)
NB: N=sample size, significantly at less than 5% significance level and, Figures in Parenthesis
indicate standard deviation
Source: Survey result, 2012

21
4.1.1.2 Resource ownership
Resource ownership is characterized in terms of cattle, oxen and land owned by sample households.
Livestock is kept for generating income, traction power and status reflection. Owner ship size of the
respondents had determined whether to supply more or less in the market. The sample survey result
indicated that on an average those who were participated in cattle supply to market were owned 5.3,
31.6 and 1.95 oxen, land(ha) and cattle respectively that is double in comparison with those who did
not participated. This ensures that the respondents who have more cattle could supply more to the
market. Moreover, this result also supported by group discussion participants and according to them
need more cash, restocking and fear of theft and insecurity forces the farmer to sell their cattle to the
market.
Moreover, the next table conveys that oxen provide draft power and are the major inputs in crop
production process and are also the most demanded export item including bulls. Land is not an issue of
the households in the study area. Since the study area is low land area the newly formed households
have option to get their own farmlands elsewhere.
Table 2: Resource Ownership of the respondents
N Mean Std. Deviation
t/χ2- value
Numbers of oxen owned Participant 94 5.3 5.1 0.0024
Non-Participant 26 2.2 1.7
Total 120 4.6 4.7
Total land holding in ha Participant 31.6 42.6 0.0689
Non-Participant 26 16.1 10.2
Total 120 28.3 38.5
CATTLE OWNED Participant 93 1.95 0.77 0.0003
Non-Participant 26 1.4 0.56
Total 119 1.8 0.77
Source: Sample survey result, 2012

22
4.1.1.3 Experience and income correlation
From Table 3 one can also see that the engagement of off-farm, non-farm and fattening activities by
itself requires more cash by the farmers and this needs derives them to supply cattle to the market. As
the result indicated in the table, on an average the sample households’ annual incomes from off-
farming, non-farming and fattening have been reached Birr 1280, 3781 and 13023 per household
respectively. The chi-square test indicates that there is a significant contribution to supply cattle to the
market as the participants have more experience in cattle production, non-farm, off-farm and involve
in fattening cooperative activities.
Table 3: Experience and income correlation of the house hold
N Mean Std. Deviation
t/χ2- value
Year of experience in dairy production Participant 94 16.6 11.2 0.393
Non-Participant 25 18.7 10.3
Total 119 17 11
Year of experience in off-farm Participant 94 0 0 0.052a
Non-Participant 25 0.08 0.4
Total 119 0.016 0.18
year of experience in non-farming Participant 94 0.596 1.96 0.374
Non-Participant 25 0.24 0.59
Total 119 0.52 1.77
Annual income in dairy production Participant 94 12985.7 7857.6 0.803
Non-Participant 25 12573.6 4841.6
Total 119 12899 7311.5
Annual income in fattening Participant 94 13023.7 18414.9 0.015b
Non-Participant 25 3566.9 9860.97
Total 119 11036.9 17378.4
Annual income in off-farm Participant 94 1280 6104.64 0.298
Non-Participant 25 0 0
Total 119 1011.2 5444.76
Annual income in non-farm Participant 94 3781.6 9772.09 0.119c
Non-Participant 25 680 2212 Total
119 3129.98 8824
N= Sample size and a b c significantly at less than 5% significant level.
Sources: Sample survey Result, 2012

23
4.1.1.4 Access to services
Table 4 below indicated that access to service like credit, agricultural extension and training, which
are the most important factors to promote cattle production and productivity thereby increasing
marketable supply, profit and ultimately farm income of the Farmers.
Table 4 credit support in the year 2011
N=94 N=26 N=120
Variable Participant Nonparticipant Total χ2/t- value Credit Need (Yes, %) 66(70%) 14(56%) 80 .469a Credit taken as requested (yes, %) 34(36%) 1(4%) 35 .006b
Amounts of credit (Birr)
Purpose of credit
Not define (yes,%) 26 10 36 .508c
Purchase cattle (yes,%) 17 9 26
Cattle fattening(yes,%) 40 4 44
Pay tax (yes,%) 1 0 1
Forage purchase(yes,%) 6 1 7
Others 10 10 10
Sources of credit
ACSI (yes,%) 45 13 58
Traders (yes,%) 13 1 14
Others 12 7 19
Extension contact (yes, %) 51(54%) 5(20%) 56 .005d
Training participation on cattle 35(37%) 1 (4%) 36 .004e N= Sample size and b and d e significant at less than 1% and 5% sifinicance level.
Source: sample survey result, 2012
The data indicated above, from the total of 120 sampled respondents who were asked whether they
need credit or not, about 70% from the participates and 56% from the non-participants pointed out
that they were showed their interest to take credit but only 36% and 4% of them had received credit as
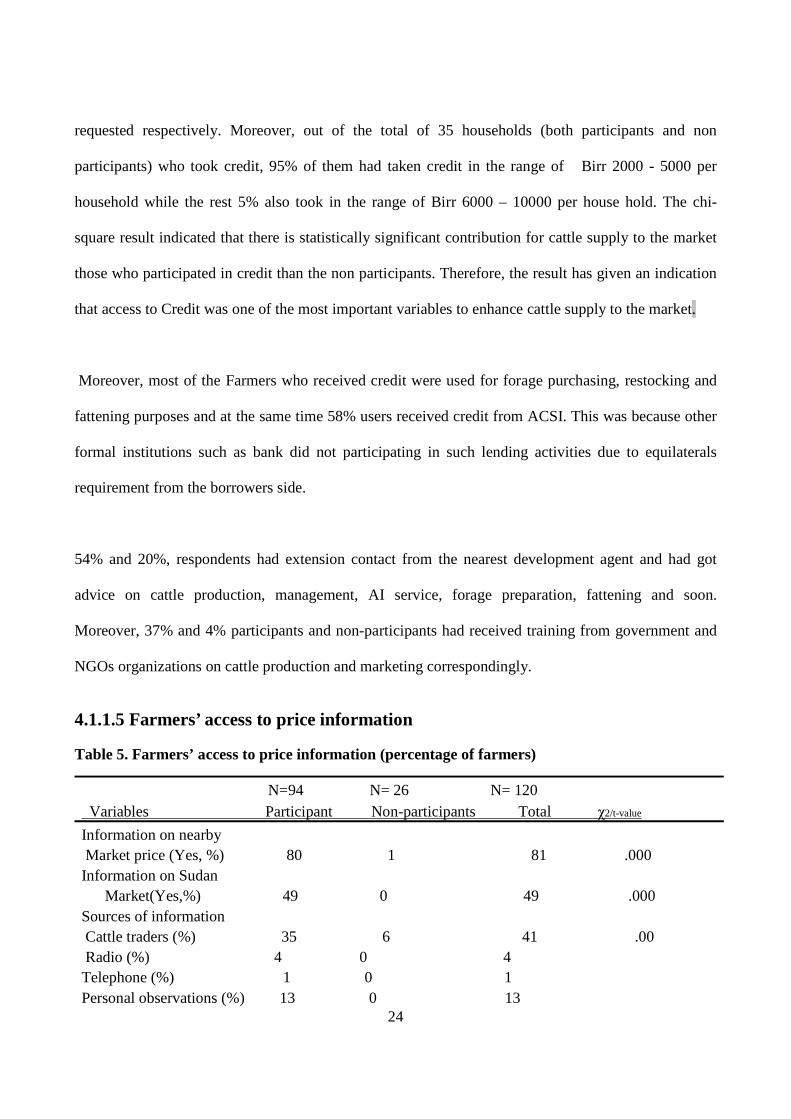
24
requested respectively. Moreover, out of the total of 35 households (both participants and non
participants) who took credit, 95% of them had taken credit in the range of Birr 2000 - 5000 per
household while the rest 5% also took in the range of Birr 6000 – 10000 per house hold. The chi-
square result indicated that there is statistically significant contribution for cattle supply to the market
those who participated in credit than the non participants. Therefore, the result has given an indication
that access to Credit was one of the most important variables to enhance cattle supply to the market.
Moreover, most of the Farmers who received credit were used for forage purchasing, restocking and
fattening purposes and at the same time 58% users received credit from ACSI. This was because other
formal institutions such as bank did not participating in such lending activities due to equilaterals
requirement from the borrowers side.
54% and 20%, respondents had extension contact from the nearest development agent and had got
advice on cattle production, management, AI service, forage preparation, fattening and soon.
Moreover, 37% and 4% participants and non-participants had received training from government and
NGOs organizations on cattle production and marketing correspondingly.
4.1.1.5 Farmers’ access to price information
Table 5. Farmers’ access to price information (percentage of farmers)
N=94 N= 26 N= 120 Variables Participant Non-participants Total χ2/t-value
Information on nearby Market price (Yes, %) 80 1 81 .000 Information on Sudan Market(Yes,%) 49 0 49 .000 Sources of information Cattle traders (%) 35 6 41 .00 Radio (%) 4 0 4 Telephone (%) 1 0 1 Personal observations (%) 13 0 13

25
N=94 N= 26 N= 120 Variables Participant Non-participants Total χ2/t-value
Brokers (%) 3 0 3 TV(%) 1 0 1 Traders, brokers & personal Observations 15 2 17 Other difference sources (%) 20 2 22
Information qualification
Reliable 10 1 11 .00 Timely 42 7 49
Adequately 41 3 44
N= Sample size and Source: sample result, 2012
Access to market information is extremely important for timely selling as well as to maximise good
returns from marketable products. The above table result reflected that the participants’ access to
market price information out strips than non-participants on cattle supply market. 84% and 4%
participants and non-participants respectively had confirmed that they had access to information from
the nearby markets (both kebele and woreda). However, only 52% the participant side had access
about Sudan cattle market price information. Cattle traders, personal observations, Telephone and
brokers were the main sources of information for farmers with respect to cattle market.
4.2. Determinants of cattle marketed supply of household (Econometrics analysis)
Table 6 presents the list of hypothesized variables expected to influence marketed supply of cattle at
household level. The expected directions of influence along with the rationale behind are also
presented.
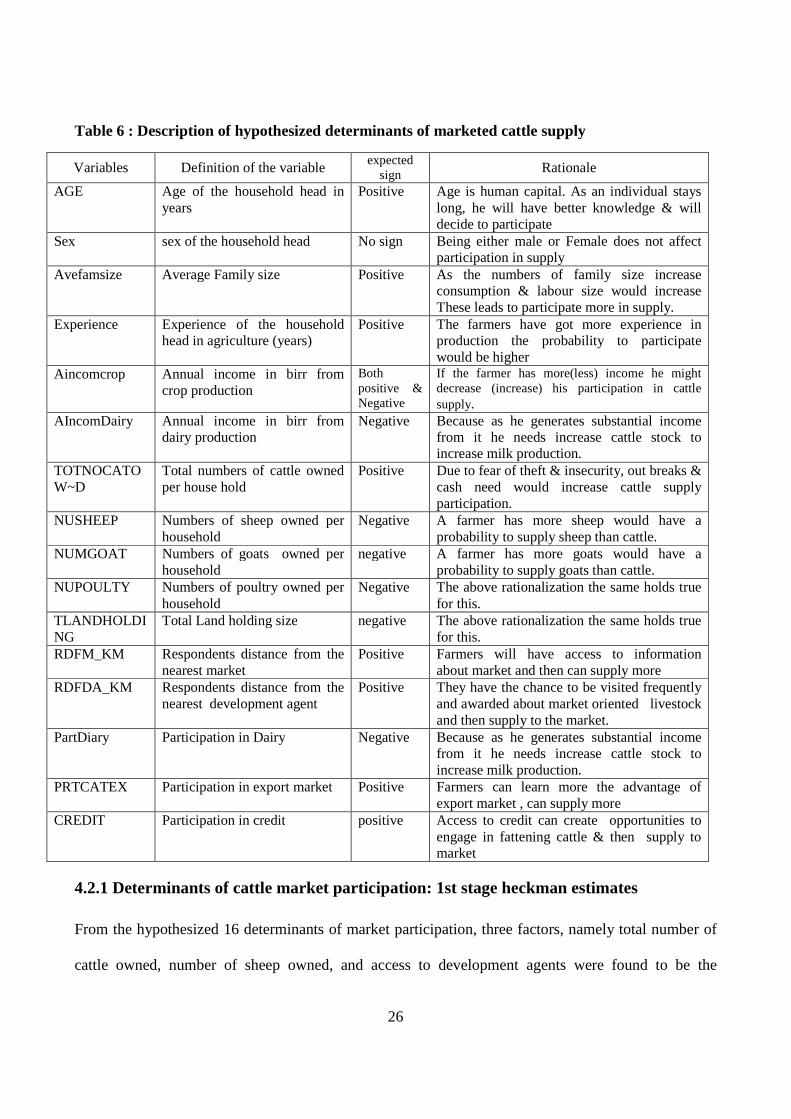
26
Table 6 : Description of hypothesized determinants of marketed cattle supply
Variables Definition of the variable expected
sign Rationale
AGE Age of the household head in years
Positive Age is human capital. As an individual stays long, he will have better knowledge & will decide to participate
Sex sex of the household head No sign Being either male or Female does not affect participation in supply
Avefamsize Average Family size Positive As the numbers of family size increase consumption & labour size would increase These leads to participate more in supply.
Experience Experience of the household head in agriculture (years)
Positive The farmers have got more experience in production the probability to participate would be higher
Aincomcrop Annual income in birr from crop production
Both positive & Negative
If the farmer has more(less) income he might decrease (increase) his participation in cattle supply.
AIncomDairy Annual income in birr from dairy production
Negative Because as he generates substantial income from it he needs increase cattle stock to increase milk production.
TOTNOCATOW~D
Total numbers of cattle owned per house hold
Positive Due to fear of theft & insecurity, out breaks & cash need would increase cattle supply participation.
NUSHEEP Numbers of sheep owned per household
Negative A farmer has more sheep would have a probability to supply sheep than cattle.
NUMGOAT Numbers of goats owned per household
negative A farmer has more goats would have a probability to supply goats than cattle.
NUPOULTY Numbers of poultry owned per household
Negative The above rationalization the same holds true for this.
TLANDHOLDING
Total Land holding size negative The above rationalization the same holds true for this.
RDFM_KM Respondents distance from the nearest market
Positive Farmers will have access to information about market and then can supply more
RDFDA_KM Respondents distance from the nearest development agent
Positive They have the chance to be visited frequently and awarded about market oriented livestock and then supply to the market.
PartDiary Participation in Dairy Negative Because as he generates substantial income from it he needs increase cattle stock to increase milk production.
PRTCATEX Participation in export market Positive Farmers can learn more the advantage of export market , can supply more
CREDIT Participation in credit positive Access to credit can create opportunities to engage in fattening cattle & then supply to market
4.2.1 Determinants of cattle market participation: 1st stage heckman estimates
From the hypothesized 16 determinants of market participation, three factors, namely total number of
cattle owned, number of sheep owned, and access to development agents were found to be the

27
determinants of participation (Table 7). As the result in following table indicated that as the numbers
of cattle owned and numbers of sheep owned increases by one percent the probability of participation
of the household in livestock supply increases by 0.3% and 0.4, respectively. Moreover, frequent
extension service provision to the farmers increases by default farmers’ awareness on market oriented
cattle production, accesses to market information, cattle supply to the market, etc, will also increases.
Hence, as the extension service provided to the farmers increases per month, the probability of cattle
market participation increases by 0.1% (Table 7).
Table 7 : Determinants of cattle market participation: 1st stage heckman estimates
Explanatory variables Coeficints Std. Err. Marginal effect
AGE 0.0266 0.0281 0.004
Sex -0.4643 0.4804 0.078
Avefamsize -0.0715 0.1296 0.020
Experience -0.0334 0.0254 0.004
AIncomcrop 0.0000 0.0000 0.000
AIncomDairy 0.0000 0.0000 0.000
TOTNOCATOW~D 0.0680 0.0198*** 0.003
NUSHEEP -0.0692 0.0243*** 0.004
NUMGOAT -0.0302 0.0446 0.007
NUPOULTY 0.0283 0.0355 0.006
TLANDHOLDING 0.0073 0.0096 0.002
RDFM_KM -0.0997 0.0708 0.011
RDFDA_KM -0.0082 0.0044** 0.001
PartDiary -1.6494 1.6232 0.247
PRTCATEX 0.5875 0.6048 0.095
CREDIT 0.2015 0.4011 0.070
Cons 1.8541 2.0070
Number of observation 118
LR chi2(16) 38.91
Prob > chi2 0.0011
Log likelihood -41.483362
Pseudo R2 0.3192
Note: *** indicates significance at 1% probability level, ** at 5% probability level

28
4.2.2 Determinants of number of cattle sold: 2nd stage heckman OLS estimates
Table 8 presents the 2nd stage heckman OLS estimates of the determinants of the number of cattle
marketed. Three factors were indentified to determine the number of cattle marketed by a household,
which are total number of cattle owned, number of poultry owned, total land holding of the household.
The first variable test result indicates that there is a significant positive contribution to supply cattle
to the market as more cattle owned per household level increases at 1% probability level or
significance level in their ownership. In other words, as the number of cattle owned per household
increases by one the amount of cattle supplied to the market will increase by 21%. This indicates that
there is high correlation between cattle ownership and cattle supply to the market.
The others two variables such as number of poultry owned and total land holding of the household test
results indicate that there is a negative contribution to supply cattle to the market as more poultry and
land owned per household level increases at 5% and 10% probability level or significance level in
their ownership respectively. In other words, as the number of poultry and land holding owned per
household increases by one the amount of cattle supplied to the market will decrease by 23% and
around 3% respectively. To rationalise this, farmers who have more land would have a probability to
have more annual income from crop production either directly involved in production or in the form of
rent. This helps him to offset other necessary expenses by selling crop for instance, sesame to the
market than to supply cattle and the same holds true with Poultry.

29
Table 8: Determinants of number of cattle sold: 2nd stage heckman OLS estimates
Explanatory variables Coef. Std. Err. Marginal effect
AGE -0.1384 0.0779 -0.1384
Sex 1.4346 1.7701 1.4346
Avefamsize 0.3777 0.3529 0.3777
Experience -0.0781 0.0788 -0.0781
AIncomcrop 0.0000 0.0000 0.0000
AIncomDairy -0.0001 0.0001 -0.0001
TOTNOCATOW~D 0.2128 0.0554*** 0.2128
NUSHEEP 0.0312 0.0616 0.0312
NUMGOAT -0.1331 0.1294 -0.1331
NUPOULTY -0.2266 0.1195** -0.2266
TLANDHOLDING -0.0256 0.0142* -0.0256
RDFM_KM 0.1222 0.3063 0.1222
RDFDA_KM 0.0172 0.0142 0.0172
PartDiary 3.7853 2.7176 3.7853
PRTCATEX 0.6016 1.1049 0.6016
CREDIT -0.0407 1.2111 -0.0407
sigma 11.2383 5.7064** 11.2383
Constant -6.0644 6.3731
Number of obs 92
F( 17, 74) 9.86
Prob > F 0.00
R-squared 0.69
Adj R-squared 0.62
Note: *** indicates significance at 1% probability level, ** at 5% probability level, and * at 10% probability
level
4.3. Markets, market actors and marketing channels
4.3.1. Types and roles of market participants
According to Aklilu, 2004, the movement of cattle in the woreda was found to have spatial variations
depending predominately on proximity to urban consumption centres. Trade in cattle in the woreda
generally starts with the collection of cattle from farm gates and village markets (i.e. primary or
30
collection markets), then trekked to secondary larger markets and then driven to the terminal outlet
market of Metema (Gendewuha) located at the border. However, Producers are much involved beyond
production and sale of cattle to small traders in local markets and sometimes to the exporters.
The traders participating in cattle markets also range from small farmers (producers) and local
collectors, to cooperatives, consumers, agents (brokers), big wholesale traders, exporters, and
importers. Some of these markets operate daily, while others function only in selected days.
Cattle bought in a certain market may change hands several times before they reach their final
destination. Upon being bought by the Sudanese, a lot of the animals are said to reach not only
Khartoum, but also far beyond markets in Egypt, and other Middle East countries.
The main participants of the CBT are thus described as follows:
A) Producers
Farmers produce as pointed by Ayele, et al. (2003) and others, there is little evidence of strategic
production of cattle for markets, with the slight exception of those who undertake fattening activities
before selling their cattle. Hence, the primary reason for sale of cattle varies between producers and
depends among others on factors such as area, season of year, and species. The primary reason of sale
seems to generate liquid money needed to pay for various expenses. Overall, tax payments, and the
need to acquire money to purchase industrial goods, to purchase food grain, restocking, fear of theft
and insecurity etc., seem to be the most common reasons for farmers selling their animals. Moreover, it
is well known, rural farmers in the woreda seldom kill their cattle to consume meat; they prefer to sell
cattle so as to cater for most of their needs.
B) Assemblers
Not only the participants of the CBT, but also the type of markets in which they operate, vary
depending on function and size of trade. For instance, the primary markets which serve as the initial
collection points are dominated by producers and small scale assemblers (who are themselves mostly

31
farmer traders). Such primary markets are mainly found in the rural areas and make up the majority of
markets serving the CBT. Such markets are not fenced, have no scales and no feeds and watering
facilities. Purchasing is done through “eye ball” negotiations and agreements. Most producers thus sell
small number of cattle to small assembler traders in the nearby primary markets.
The number of animals collected by small scale assemblers and the radius they cover however is
limited due to the absence of enough space and corrals/barns for collecting and the huge feed cost
necessary to maintain fattened animals for an extended period. Small-scale assemblers nevertheless are
important players in the trade chain since they bridge and solve the daunting problems in collecting
fattened and in some cases semi-fattened animals from remote rural areas and dispersed producers.
Small-scale assemblers prefer to collect limited number of cattle due to financial and technical
difficulties, transportation problems and fear of risk (and/or thefts). Some of these assemblers have
their own production yard (fence) to finish the practice for semi fattened cattle before supplying to the
larger assemblers or until getting reasonable price from the marketers in the channel. Small scale
assemblers are located mainly in Woreda towns.
C) Wholesale Traders
The small assembler traders in turn sell their cattle to big wholesale traders and/or exporters found in
secondary larger markets. Such big wholesale traders and exporters are also reported to have better
experience and financial performance in cattle trade and better access to relevant market information
sources. Urban and peri-urban fatteners and cattle producers also serve as suppliers to such big
wholesale traders and exporters. These large assemblers in almost all cases own the necessary export
licenses and permits, which they may either use it to export cattle themselves, or rent it to other traders
who lack the license so they can participate in the CBT. Certain predisposing factors such as their
larger capital sources, their access to marketing information, and the weak bargaining power of
producers allow these wholesale traders not only to set the prices but also to garner bigger margins
when they sale.

32
D) Cattle Fattening Cooperatives
In addition to the above traders, cattle fattening cooperatives/association organized by group of
farmers based in the woredas have also started participating in the CBT. There are different fattening
cooperatives in the woreda. The establishment of cooperatives and the provision of the necessary
technical support had been given by the integrated livestock development project for North Gondar
zone (ILDP).In addition to the previous cooperative, Sustainable resource management program which
is the continuation of integrated livestock development project and integrated development
project(IDP), has currently been providing financial support for cooperatives. Such cooperatives are
set up with the central objectives of improving access to group credit, enhancing input delivery
(especially of industrial bi-products, and medicines) and improving market access.
The bigger problem for most members of these cooperatives concerns the issue of easily accessing the
lucrative CBT to Sudan. Before 2007, all cooperatives were unable to directly export their fattened
cattle as they lacked the necessary export. They were thus forced to sell either to exporters or other
participants of domestic markets for a fraction of the real worth of their animals. The problem has been
recently solved by allowing some of the cooperatives to obtain their export licenses and thus
participate legally in the CBT. It is believed that such an arrangement makes it possible to assemble
better fed cattle with lower costs and supply potential markets in an efficient manner.
E) Brokers
Commission Agents (brokers) and money dealers are also actors in the markets. The Ethiopian small
and large scale exporters have a little or no direct contact with Sudanese importers due to lack of
common language between them. There are commission agents and brokers in the market that play a
vital role in the negotiation between the Ethiopian exporters and Sudanese importers.
Most of the brokers can communicate with Ethiopians with Amharic and Sudanese with Arabic in the
market and negotiate them. If and when brokers participate in making a deal, they collect a 15 birr fee
per head of cattle from both sides for their services. They usually make use of the premises of larger
33
exporters for accommodation and other services. The brokers have been paying the mediation role at
all levels starting the primary market to the terminal.
F) Butchers
Slaughter and meat handling and distribution facilities are a critical link between the cattle trader and
the final consumer. Orderly markets depend on these facilities to efficiently move products through the
final stages of the marketing channel (Yakob, 2002). A Few butcheries operate in the woreda, of
which most are licensed. All butcheries serve traditional cuts to customers. Some of these butcheries
also double as ‘beef restaurants’ serving raw and fried meat to customers. Generally, butcheries in the
bigger towns of Amhara including Metema woreda can be categorized, into three major classes based
on the income class of the clientele. These are high, middle, and low classes. The low class butcheries
which exists in the woreda and serve the lower income and hence, they mainly buy low grade cattle.
Most of these butcheries are not licensed. Irrespective of cattle prices, which fluctuate between seasons
and years, the price of beef has steadily increased over the last few years. Yet the prices paid by
customers for each kg of meat may vary within a given town. Variations in meat prices in such towns
mainly reflect the location of the butchery, the quality of meat on offer and also the reputation of the
particular butchery through word of mouth. Butcheries that double as ‘beef restaurants’ selling both
raw and fried meat charge higher for both the take away and meat consumed on the premises. Such
butcheries operate on large capital base with a high turnover rate and source their animals directly
from secondary markets and feedlots. Similarly, there are also restaurants that are licensed to run ‘meat
kiosks’ on the side serving both take away and dining customers.
G) Consumers
Both people who live in small towns as well as the farmers themselves are other participants in this
market chain. Especially producers (farmers) have sold to another farmer for the purpose of breeding,

34
ploughing and killing cattle. However, small town dwellers mostly buy cattle from farmers either
primary or secondary market for killing purpose during holidays.
H) Exporters
Big wholesale traders, fattening cooperatives, assemblers and even producers are suppliers to
exporters found in terminal larger markets. Such big exporters are also reported to have better
experience and financial performance in cattle trade and better access to relevant market information
sources. These large exporters in all cases own the necessary export licenses and permits, which they
use it to export cattle themselves in the CBT. They have larger capital sources, their access to
marketing information, and the strong bargaining power than others in the Ethiopian marketing. These
exporters have a direct contact with Sudanese importers.
4.3.2. Market types and marketing channels
Cattle markets in Metema woreda can be categorized as primary, secondary and terminal market
(Figure 4). Primary markets are markets where producers strongly dominate to sell cattle primarily to
small-scale farmer traders (assemblers), cooperatives and even to exporters at market centres located in
rural areas and woreda capitals. The main actors of these markets are producers and small scale farmer
traders (assemblers), cooperatives and in some cases consumers and local butchers. Primary markets
have been identified as village level markets with a supply of less than 500 head of cattle/week
(Solomon et al. 2003). The majority of cattle markets in Metema cross-border trade belong to this
group.
Secondary markets operate with an average volume of 500–1000 head per week consisting of finished
export cattle, breeding heifers and old animals, and located mainly in Metema woreda capital
(Gendewuha). Wholesale traders, exporters, export agents and, to some extent, butchers dominate
secondary markets serving the local consumers but mainly supplying the terminal markets. This cattle
markets supply to export terminals Metema( Gendawuha) market.

35
Both the terminal markets for legal and illegal are located in the Ethiopian border towns of Metema
Gendawuha, Metema Yohannes,Tumet,Nefisgebeya, Abrehajira and Abdurafi (Delello) and the
Sudanese border towns of Galabat,Tiha, Fazira and Kerim, Enedibilo, Berekete Nur(Bahirefirundus)
(source: Group discussions, 2012). In the terminal markets, exporters and importers handle mainly
export type animals in the study area. Medium- to large-scale exporters and importers dominate the
only legal export terminal market of Metema Yohannes and now it is being operating at Gendewuha(
Metema woreda capital). Supply of cattle to the primary, secondary and also the terminal markets is
mostly done through trekking and trucking routes. The majority of cattle are trekked through villages
and small towns. Mostly smallholder farmer exporters use the traditional trekking routes to reach the
illegal terminal markets. Except Gendewuha terminal modern livestock market, other primary,
secondary and terminal markets are not fenced, no feeds and watering facilities throughout the study
area.
Figure 2: The above figure indicates the existing market channel operating in the study area
Producers
Fattening
cooperatives Small
assemble
Small scale
illegal exporters
Whole
sales
Legal Exporters
Brokers
Importers (legal& illegal)
Primary
market
Secondary
market
Terminal
market

36
There are three types of exporters who sell cattle in the Ethio-Sudan cross-border export points:
Cooperatives, large-scale exporters and small scale illegal exporters. Small farmer illegal exporters are
farmers whose trading activity is temporary, who usually trade in small quantity, not exceeding 10
cattle at a time. These exporters usually prefer the illegal export routes. Licensed cooperatives and
large-scale exporters trade in large quantity and frequently operate in legal export route, even though a
few of them may at times use the illegal route, as well. Many large-scale exporters have their own
export agents who collect cattle from primary and secondary livestock markets and supply for export
in the terminal markets. There are also cattle traders who are involved in both export and domestic
cattle trade. These traders do not usually have export license but sell cattle to importers in the illegal
export route.
According to Mendoza (1995), marketing channel is the sequence of intermediaries through which
whole cattle passes from farmers to consumers. The analysis of marketing channels is intended to
provide a systematic knowledge of the flow of the goods and services from their origin (producer) to
the final destination (consumer).
The cattle market channels, depicted in figure 4, were constructed based on the data collected in
respondents interview, group discussions and local traders. The result revealed that there are 8 major
marketing channels obtained from survey result. Informal survey suggested that there are also
possibilities that farmers sell their products directly to consumers and Butchers. The actual marketing
channel is more complicated, but the main marketing channels of the 8 cattle markets in terms of
quantity flow of cattle in 2011 is from producer to consumer through different intermediaries are:
Channel 1 Producers –Local assemblers –Collectors/Wholesaler-Exporters-- Importers
Channel 2 Producers –Cooperatives –Exporters -- Importers
Channel 3 Producers –cooperatives -- Importers
Channel 4 Producers –small scale illegal exporters-- Importers

37
Channel 5 Producers –butchers –consumers
Channel 6 producers – Exporters – Importers
Channel 7 Producers- local assemblers –wholesalers – Exporters- Brokers – Importers
Channel 8 Producers – cooperatives – brokers – Importers.
4.4. Cattle trade marketing system and illegal trade
4.4.1. Supply/Market routes
The Ethio-Sudan cross-border covers a long distance, as Sudan shares boundary with the five
Ethiopian regional states of Southern Nations, Nationalities and Peoples (SNNP) in the south and
around Omo River, Gambella and Benishangul Gumuz in the west, Amhara in the northwest and
Tigray in the north. This study covers only the cross-border trade along the Amhara Region’s Ethio-
Sudan border especially in relation to Metema woreda.
The Cross Border Trade to Sudan is mainly supplied from almost all woredas within the North
Gondar zone. These areas however are not the sole supply sources for the CBT. Additional areas both
within the Amhara region and outside of it have been reported to serve as the starting points for
animals ending in Metema and through it to Sudan.
With regard to supply areas within the region, there are four major supply routes:
1 .The North Gondar zone catchment area, which in turn is composed of the following four sub-routes:
1.1 Debark → Dabat → Gondar → Metema
1.2 (Dembia, Chilga, Alefa, Gondar zuria woredas) → Chilga → Metema
1.3 (Tsegede, Metema, Tach and Western Armachiho woredas) → Metema
1.4 (Alefa, and Quara, woredas) → Shinfa →Sudan
2. The West Gojjam zone catchment area, with two sub-routes:
2.1 (Awi, Achefer, and Mecha woredas) → Delgi → Metema
2.2 (Yilmana Densa, and B/Dar zuria woredas) → Gondar → Metema

38
3. The South Gondar zone catchment area, which starts from Nefas Mewcha, passes through both
D/Tabor and Woretta towns, and then through Gondar finally to Metema.
4. South wollo and North Wollo catchment areas which starts from the two Zones passes Nefas
Mewcha through both D/Tabor and Woretta towns, and then through Gondar finally to Metema.
In addition to the above, there are two directions from which cattle are supplied to Metema from areas
outside the region. These are:
a) The Nekemt (Wollega) → Bure → Gondar → Metema; and
b) The Gohatsion → Bahir Dar → Gondar → Metema routes.( SPS-LMM, October, 2009).
Both the terminal markets for legal and illegal are located in the Ethiopian border towns of Metema
Gendawuha, Metema Yohannes,Tumet,Nefisgebeya, Abrehajira and Abdurafi (Delello) and the
Sudanese border towns of Galabat,Tiha, Fazira and Kerim, Enedibilo, Berekete
Nur(Bahirefirundus)(source: Group discussions, 2012).These export points/ cattle export outlets are
important outlets find in Ethio-Sudan both legal and illegal CBT.
The major livestock types in these marketing systems are dominated by Oxen, bulls and steers, mostly
supplied from the lowlands of North Gondar Zone which, according to exporters, eventually end up in
large urban markets in Sudan including the Khartoum market. Importers buy cattle in bulk and take
them for slaughter either to slaughterhouses, processing plants in Khartoum or re-export them through
Port of Sudan. The following Map indicates Ethio-Sudan Export out lets.
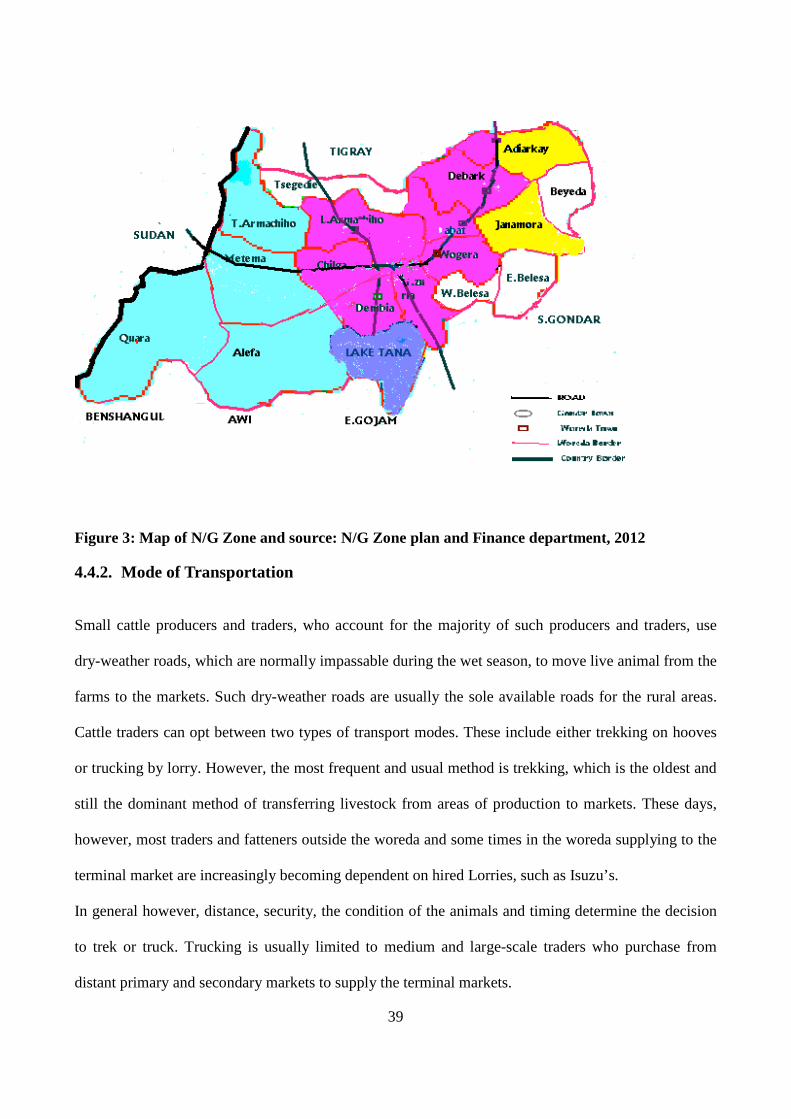
39
Figure 3: Map of N/G Zone and source: N/G Zone plan and Finance department, 2012
4.4.2. Mode of Transportation
Small cattle producers and traders, who account for the majority of such producers and traders, use
dry-weather roads, which are normally impassable during the wet season, to move live animal from the
farms to the markets. Such dry-weather roads are usually the sole available roads for the rural areas.
Cattle traders can opt between two types of transport modes. These include either trekking on hooves
or trucking by lorry. However, the most frequent and usual method is trekking, which is the oldest and
still the dominant method of transferring livestock from areas of production to markets. These days,
however, most traders and fatteners outside the woreda and some times in the woreda supplying to the
terminal market are increasingly becoming dependent on hired Lorries, such as Isuzu’s.
In general however, distance, security, the condition of the animals and timing determine the decision
to trek or truck. Trucking is usually limited to medium and large-scale traders who purchase from
distant primary and secondary markets to supply the terminal markets.

40
Trekking
As described earlier, all trek routes are traditionally defined and some of them appear to be long and
risky journeys. For instance according to traders respondents contacted in Gondar town, in times of
good cross-border trade with Sudan, cattle have been observed to be trekked from areas in South
Gondar to North Gondar and finally to Metema. In other words, these animals are trekked close to 394
kms in a journey lasting around 2 weeks.
This particular means of animal transport, however, is inundated by various problems. The draconian
overland droving results in frequent thefts, accidents, wildlife snatches, and transit mortalities.
Trucking
Generally, road transport of live animals by trucks in the Amhara region is usually employed by bigger
traders with higher volume of transaction or animal fatteners whose target lies in larger centres. The
other groups that hire trucks for livestock transport include those traders with easy access to tarmac
roads convenient for this type of haulage. Trucking is also increasing as the economic incentive of
reaching lucrative markets in time is becoming more financially rewarding.
The poor state of existing road network in the region and the country, however, makes trucking
feasible only in areas near to relatively better tarmac roads. Most rural roads are seasonal and not
viable during the greater parts of the wet season. Thus in the absence of all-weather tarmac or gravel
roads, vehicles move more slowly and incur substantially expensive maintenance costs.
Trekking or Trucking
Road transport for cattle is not only unreliable but sometimes also expensive. The high cost of
transportation is thus passed on to the consumer. Moreover, traders were asked as to the comparative
advantage of both types of transport. Most of them replied that, apart from financial savings due to
trucking, other benefits to be derived from vehicle transport include:

41
• Prevention of loss of weight and condition from long distance trekking;
• Prevention of contact with ticks and risk of disease outbreak; and
• More groups of cattle able to be marketed within a given span of time.
4.4.3. Legal versus illegal cattle trade in Ethio-Sudan CBT
Currently, there are two different kinds of cattle marketing systems operating in Amhara Region’s
Ethio-Sudanese border: the legal and illegal systems. The legal system has started operation on
December 2004 upon the signing of the bilateral trade agreement between Ethiopia and Sudan in 2003.
Parallel to the legal system, there exists an active illegal cattle marketing system, which operates
independent of the legal system. It is not clear how long the illegal trading system has been
operational. The two systems operate at different magnitudes.Dominanely small traders and producers
have been participating in the illegal system. Some exporters also use both the legal and the illegal
systems at the same time or at different times.
4.4.3.1. Legal export route
Legal CBT, which started operation only since December 2004, is undertaken based on the bilateral
agreement signed by the two countries. The agreement specifies that the COMESA trade agreement is
applicable as binding rule. The bilateral border trade agreement further states that, the sole exit point
for every marketing chain within the legal trading system to be Metema Yohannes port. Moreover, a
recently promulgated directive issued by the Amhara National Regional State Council, states that
anyone participating in cross-border cattle trade on 66 the Ethiopian side needs to be licensed, have
quarantine certificate for his animals, and pay the necessary customs tax before passing the Metema
exit point. Exporters with the necessary license and other required documentation thus start the whole
process by collecting prospective animals from producers, assemblers, or cooperatives located in the
potential supply areas. After collecting them in suitable sites they then proceed to their nearest BoARD

42
Offices to apply for and receive the required vaccination, ear tags identifying each animal and
vaccination certificates. Finally such certified animals are trucked from respective collection points to
the Metema market.
Animals destined for the legal CBT first land at Gende Wuha town (160 kms from Gondar city) upon
which the exporters proceed to the Bank and Customs Authority to apply for and receive the required
export services. Export cattle are then transferred to Metema Yohannes (40 Kms from Gende Wuha)
where the quarantine service station is located. This market which was an open air market with no
appropriate facilities is not only the sole outlet for legal exports but also is one of the largest cattle
exchange centres in the region. However, due to the construction of Modern livestock market Centre
which accommodates every facilities at Genedewuha Town administration by Sustainable Resource
Management program in North Gondar, the terminal export market services which was provided at
Metema yohannes has replaced by Genedewuha market centre starting at the end of 2010.
4.4.3.2. Illegal export route
In the illegal trade routes, on the other hand, cattle were sold and moved “unofficially” across the
border to various Sudanese markets. This illegal CBT is further reported to be highly seasonal: with
higher volumes being moved during the rainy season (June to August). The reason behind such
seasonality is that contraband traders take advantage of the better forest cover during these months,
which makes it harder for border patrols to effectively hunt such movements. In addition to the above
mentioned ideas, during these seasons investors needs take more ploughing oxen by the name of
ploughing purpose from the centre to near the border area. Then after completed their ploughing
activities, the oxen transferred from Ethiopia land to Sudan and this also increases the illegal cattle
export to Sudan.
43
Moreover, cattle moved through such illegal CBT are mainly composed of medium-to-high quality
males, which are used for slaughter in Sudan’s major urban centres, but our informal discussions also
revealed that sometimes female and immature animals are involved as well, probably for restocking
and breeding purposes. In addition to our discussions with officials in Metema, various studies (e.g.,
ILLR 2007; ILDP 2006) also indicate that the illegal CBT captures the bulk of cattle exports in the
area. This route starts from primary markets like Shinfa and Kokit in Metema Woreda,Dubaba and
selfredi in Quara woreda, Merawi in West Gojjam through Delgi to Metema and Tach Armachiho. In
this system, the cattle exported are mainly from low land areas of the region where there is low
population pressure and cattle production is through grazing. In this system, fertile cow and exotic
breeds are also exported.
Accordingly, the main outlets from the Ethiopian side are Metema Yohannes, Abdurafi(Delello),
Nefsgebeya and Shinfa(Tumet) and Abrehajira, while Galabat, Tiha, Fazira, Endibilo and Berekete
Nur are the most important entry points on the Sudanese side.
There are also some unique differences between the two systems of export although the illegal CBT is
reported to more or less follow the same supply routes used by the legal export system; there is distinct
difference between the two:
• In the mode of transport employed. The majority of animals moved through the illegal CBT are
never transported on trucks; rather they are trekked on hooves through difficult terrains and
bush and forest areas.
• Variation between types of animals moved through the two systems as well.
• Illegal exporters purchase good looking and naturally fattened cattle from the grazing system.
Cattle moved via the legal system on the other hand were mostly fattened on rations largely
composed of various by-products.

44
As a commodity, livestock has features that make it amenable to cross-border trade even in situations
of widespread insecurity (Little, 2002). It is a mobile, high-value commodity that can be transported
overland rather than on roads, and can easily be moved across borders, a practice that local pastoralists
and farmers in the border areas of Ethiopia have engaged in for long years. Such cross border
movement however is not easy for other commodities moved from the Amhara region to Sudan (for
example pulses and fish), which usually require road transport to be commercially viable. Quara,
Metema and Armachiho are border woredas of the country with Sudan. In each woreda there are
different illegal markets out lets. The following are the major illegal livestock routes that indicated on
the following map.
Figure 4: North Gondar Illegal and Legal Livestock Trader Mobility Map
Source: from Personal interview and group discussion, 2012
Sudan Boarder Town
Legal Livestock
Market Centre in
North Gondar Sudan
Boarder Woreda
SUDAN
Abirehajira
&Abderafi(Delello)
Metema
yohannes
GENDAWUHA
Tumet &
Nefisgebey
a GELEGU
Fazir
a
Tiha
Gelabat
Berekete Nur
Ethiopia illegal cattle terminal Market
points
Kokit Illegal market
centre in Sudan

45
4.4.4. Methods of illegal acts and Major causes for development of illegal cattle trade
4.4.4.1. Methods of acts illegal trade
According to Meema yohannes custom office and Federal police as well as the participants of the
group discussion under lined that illegal cattle traders are working in organized and systematic manner
to apply illegal activities while they export to Sudan.
The first system: In the first place action is carrying out by 4 people and assigned to play the role this
illegal act as mediator, Exporter, Claimer and Bidder.
The 1st individual act as mediator or broker between the exporter and the importer that help the two
parties to reach the agreement on price cattle. The 2nd one is also act as exporter and export cattle to
Sudan, the 3rd is the one assigned as claimer who side by side he has gone to the Federal police office
situated at the border and reported to the police as if he has lost cattle, then after he has tried to assure
that whether his cattle has passed to the border or not. If the cattle passed the border without any
problem he disappear from the area but if the live animals caught by the police or other forces he has
immediately reported to the police that the cattle are his own because he has reported earlier. The 4th
one if the cattle caught suddenly by the police or custom offices or other legal parties he will never
claim that to any legal body but what he did was that he watched until the cattle come to bid. Once the
cattle have ready to sale through bidding process after court decision he will appear to be as bidder in
the bidding processes. Unforgettable thing here is that the surrounding community knows the owner of
the cattle and they do not show their willingness to participate in the bidding process and buy. The
only buyer will be the delegator and he will supply the list price to buy the properties. Then he will be
the winner and will take all the cattle with list prices and return to the first owner.

46
The second system: there are occasions when the licensed merchant appears to be both legal and
illegal exporter. They have tried to fulfil export requirements such as health certificate, tax payment,
and others for some numbers of exported live animals legally and side by side they have sent some
animals in another direction illegally after some point they will collect all live animals together and
export to Sudan. This act helps them to escape from different expenses levied by the government.
The third system: There are also illegal people acting like bandits or locally called ‘Salug’ moving
around and between the two borders and at the same time Ethiopians live in the vicinity of the border
by rearing live animals. The Salugs theft the cattle either by fasten the wards with wood or killed the
shepherd to Sudan.
The fourth system: the last one is the investor has taken a number of Oxen by the name of plaguing
their farm around the border such as Delello starting by the first weeks of June. When they pass the
custom office they showed their investment license and after taking the oxen in the first round they
have exported one-third of the oxen to Sudan, secondly, after completed their farm the second round
one –third are also exported and finally the last round week of august and the first weeks of September
the remaining oxen have exported totally and the investor will come with empty hands.
4.4.4.2. Major causes for development of illegal cattle trade
The result obtained both from individual households sample survey and in Group discussions as well
as different stakeholders there are ample causes for the development of illegal cattle trade in the study
area. Some of the noticeable causes are:
1) Lack of adequate modern market centres which consists of different components such as feed,
water, shade, etc leads to illegal cattle trade. Recently one modern livestock market centre was
constructed and functional as terminal market for the whole cattle go through Metema to

47
Sudan. This situation enforces the cattle producers living within 40 kms radius between
Gendewuha to Metema yohannes to take their cattle and sell Gendewuha market. According to
sample respondents selling their cattle at this market lead them to waste time and incurs cost as
well as unfortunately if the cattle cannot sold on time they obliged to bring back home. When
they are on journey most of the time the cattle caught by the police considering that they are
illegal. All these conditions push them to sell their cattle in illegal way.
2) The lengthy of the natural boundary as well as absence of checking points across the entire
boundary except few points between Ethiopia and Sudan (For instance from Humera to
Gambella Region estimated to be >1000 kms) encourages to increase the illegal cattle trade at
the border area between the two countries.
3) The existence of the illegal marketing system is highly associated with the behaviour of key
actors’ temporary nature of export activity and lack of awareness of the importance of
international trade.
4) The illegal cattle marketing system is often characterized by financial constraint and Leads
operate under informal market system. Hence financial problems to fulfil export license
requirements (from Birr 700000 to 800000) in one hand and to fatten animals in the form of
association or cooperative on the other hand have been pushing factor to involve illegal trade
activities.
5) The bureaucratic and extended nature of legal export procedure, inappropriate foreign currency
regulation, and the presence (for instance tariff, health certification requirement, etc) for cattle
that go through legal route on the contrary, the absence of tariff, health certification
requirement, etc, imposed on exports for cattle that go through the illegal route has positive
impact for the development of illegal trade.
6) Another cause for development illegal cattle trade has associated with investment activities
under taking around the border areas. From the months of June to July investors (especially

48
sesame) has taken more oxen for the purpose of ploughing passing through customs office
checking point. After finalizing their ploughing activities the oxen have exported to Sudan
illegally.
7) Theft as the causes of illegal cattle trade has mentioned by respondents group discussions into
two ways: in the first place farmers in the study area have similar nomadic life style and their
cattle waiting near to the border areas in search of grass and water. The cattle have been theft
by the so called Bandits and Salug and sold in the Sudan market and secondly, due to the fear
of theft the owners themselves motivated to sell illegally.
8) During the respondents group discussion the participants had mentioned that any commodity
including cattle found within 15 km radius from Ethiopia to the border has been taken as illegal
commodity. On the contrary, farmers are living up to final border area and this makes difficult
to differentiate the legal live animals with the illegal one.
4.5. Cattle marketing performance
4.5.1. Types and Number of Animals Exported
Type of animals sold: The cross-border trade with Sudan involves pre-dominantly male cattle. Few
medium to high quality female animals are also exported, which are used for slaughtering in Sudan or
for live animals export to Egypt, Libya and Yemen. The Ethiopian cattle breed, locally known as
Ruthan, are exported as heifers to Sudan for breeding purposes. Uncast rated and fattened oxen are
also exported legally.
Reasons/Motive for sell: There are several reasons why producers in the zone sell their animals.
These include market orientation, grain food purchase, cash needs, restocking, feed and water scarcity,
and fear of theft and insecurity. Although the livestock producers in the lowlands exhibit significant

49
market orientation, fear of theft contributes to the off take rate significantly. In the highlands, periodic
cash needs remain the most important reason for sale.
Cattle sourced both from the highland and low land areas. The types of animals are exporting to
Sudan includes Cattle (Oxen, cows and bulls). However, oxen export has taken the lion share among
other being exporting live animals. According to the data obtained from the household sample survey,
75% of the respondents reveals that both Oxen and bulls are equally demanded by Sudan buyers where
as 25% of the also indicates that Oxen especially well fattened oxen are highly demanded than bulls.
According to the data obtained from Metema woreda custom office, a number of animals have been
exported to Sudan to date from the year 2006 to 2010 can listed as follows:
Table 9: Number of Beef cattle exported legally.
Years Number of live animal Hard currency gained in dollar
2006 12665 2,533,000.00 2007 33105 5,958,900.00 2008 10145 2,399,154.00 2009 4382 1,036,320.00 2010 17579 8,110,012.00
Source: From Metema woreda custom office, 2012.
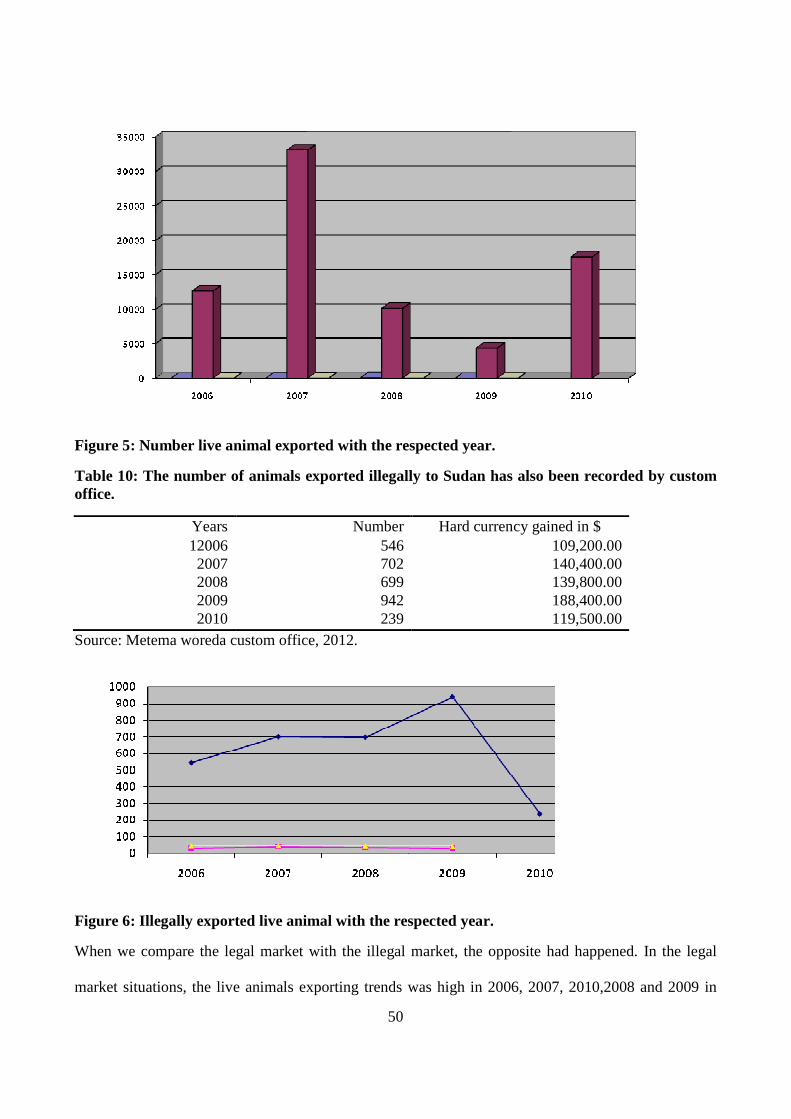
50
Figure 5: Number live animal exported with the respected year.
Table 10: The number of animals exported illegally to Sudan has also been recorded by custom office.
Years Number Hard currency gained in $ 12006 546 109,200.00 2007 702 140,400.00 2008 699 139,800.00 2009 942 188,400.00 2010 239 119,500.00
Source: Metema woreda custom office, 2012.
Figure 6: Illegally exported live animal with the respected year.
When we compare the legal market with the illegal market, the opposite had happened. In the legal
market situations, the live animals exporting trends was high in 2006, 2007, 2010,2008 and 2009 in

51
descending order and the same with true the income gain from exporting items, Where as in the illegal
market situations, in the year 2008 and 2009 were high with lower income gain from exported items
especially live animals export.
Illegal market did not taken place in same pattern within the above reported years as it is mentioned by
respondents. According to them the market situations depends up on seasons, for instance, during
drought time and dry seasons of the year its number has dramatically decreases. However, from the
months of June to December the illegal market conditions have also been increased due to fodder
availability and investors farming activities.
This study focuses on the year 2011 data to carry out the analysis of this study. The legal and the
illegal trade under took, their market share (%) and the types of commodities exported both in the legal
and illegal routes can be explained thoroughly on the following table (ie table 11).
Table 11 Legal and illegal export cattle in the year 2011
Months/ year
Commodities Illegal exports Legal exports
Total Exports
Market shares of Illegal exports (%
Market shares of Legal exports (%)
Jan-11 Live Oxen 3532 6858 10390 34 66
Feb-11 Live Oxen 4442 3488 7930 56 44
Mar-11 Live Oxen 3522 5807 9329 38 62
Apr-11 Live Oxen 3619 9211 12830 28 72
May-11 Live Oxen 2456 11017 13473 18 82
Jun-11 Live Oxen 1196 11217 12413 11 89
Jul-11 Live Oxen 8179 11380 19559 42 58
Aug-11 Live Oxen 5891 11232 17123 34 66
Sep-11 Live Oxen 6794 13568 20362 33 67
Oct-11 Live Oxen 3021 2488 5509 55 45
Nov-11 Live Oxen 2872 6730 9602 30 70
Dec-11 Live Oxen 1909 12693 14602 13 87
Total 47433 105689 153122 31 69
Sources: World Food Program Metema Yohannes Data Record Centre, 2011.

52
Figure 7 Legal and illegal export cattle in the year 2011
Sources: World Food Program Metema Yohannes Data Record Centre, 2011.
The study conducted by International Livestock Research Institute (ILRI) on the analysis of the Ethio-
Sudan Cross-border cattle trade in the case of Amhara regional stated that the volume of legal cattle
export is estimated to reach close to 40 thousand cattle in 2007. The legal export operates only through
the border town of Metema Yohannes. The market share of the illegal cattle export was estimated to be
50% in 2005, but increased to 60% in 2006 and is expected to remain the same in 2007. Hence, by the
year 2007 the percentage of legal and illegal trade Ethio-Sudan border via Meema was reached 40%
and 60% respectively. This study confirmed that on table 9 about the legal trade and table 10 about
illegal trade. There was low volume of trade in the year 2009 which was exported in the legal route
where as on the contrary on the same year figure 4 also indicated that there was high live animal
export in a illegal way. However, as the above table (ie table 11) indicated that in the year 2011 alone
47433 and 105689 illegal and legal with the total sum of 153122 oxen were correspondingly exported
to Sudan via Metema. Now, the above figure reflects also that the illegal share of cattle export reduced
from 60% to 31% .It may give some kind of clue that the illegal cattle export become decreases from

53
time to time in comparison with the result obtained from ILRI in the year 2007. The result obtained
from the group discussion and the individual interview had reinforced that as if illegal export cattle
trade becomes decreases from time to time. According to them, the reasons for this might be due to the
reduction of cattle stock in the supply areas as well as due to tight control of the illegal sides of cattle
export by the government and awareness rising in the side the community participates in the illegal ca
Legal and illegal export cattle in the year 2011ttle export trade.
4.5.2. Conduct of cattle market
Market conduct refers to the patterns of behaviour that firms follow in adopting or adjusting to the
markets in which they sell or buy (Bain, 1968). In this report conduct of the cattle market is analyzed
in terms of the traders’ price setting, purchasing and selling strategies
4.5.2.1 Traders price setting strategy
The method of price formation is critical importance. About 15% of the sampled traders set purchase
price themselves, 10% of them reported that their price is set by market, 75% of the traders set price by
negotiation. This indicates that the cattle traders and sellers had significant role in price setting.
On the market day, in the daytime, farmer traders and assemblers collect cattle from farmers directly
or through their broker and put their collecting areas after paying the payment. The assemblers also
collect cattle from farmer traders once the price set by the market. According to the sample
respondents, the price of the cattle differs according to the cattle type and their performance. Hence,
Oxen and bulls are more expensive than cows and heifers and at the same time well fatten ox sold with
the higher price than the medium. There are no informal rules set by the traders and the producers not
to sell the cattle above and below the set price.
4.5.2.2 Traders purchasing strategy
The exporters are very active and about 75%, 15% and 10% of their supply is from collectors, farmer
traders and from the producers respectively. Farmer Traders and collectors are highly mobile and they

54
purchase from different markets in a week. On average one trader in 2011 visited more than one
market per week in local and woreda markets. The exporters visited the primary and secondary
markets when the export trade become conducive.
During this time, about 50% of the exporters purchase directly without median brokers, 25% of them
purchased through brokers, and the rest of traders bought by combination of direct purchase, through
commission agents and brokers. Brokers were very important exporters at the time of purchase.
4.5.2.3. Traders selling strategy
Brokers are not equally important to all farmer traders, collectors and exporters at the time of sell.
About 50% of the exporters use the service of brokers at the time of sale especially in terminal market.
About 40% of them reported are personally in charge of sale and the rest 10% of them sell through the
combination of the two methods.
4.6 Marketing Costs and Profit Margins
4.6.1. Estimates of marketing cost by actor
Table 12 indicates different types of marketing cost related to the transaction of cattle by Farmers
traders, Collector (assemblers), and Exporters. The structure of marketing cost revealed that cost
increases from farmer traders to Exporters in ascending order. This is due to more time need to wait to
sale at the terminal market as well as need to take the cattle by transport and loading and unloading
costs. Thus, Exporters relatively incur highest cost of all other traders.
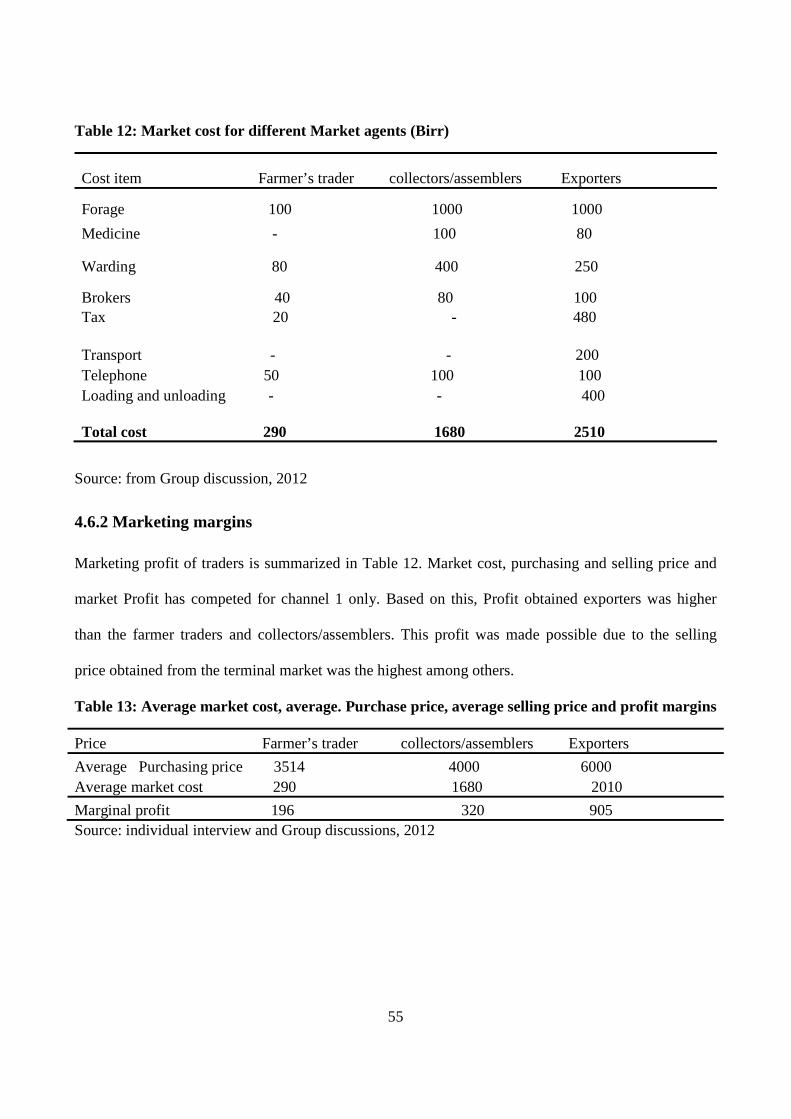
55
Table 12: Market cost for different Market agents (Birr)
Cost item Farmer’s trader collectors/assemblers Exporters
Forage 100 1000 1000
Medicine - 100 80
Warding 80 400 250
Brokers 40 80 100 Tax 20 - 480
Transport - - 200 Telephone 50 100 100 Loading and unloading - - 400
Total cost 290 1680 2510
Source: from Group discussion, 2012
4.6.2 Marketing margins
Marketing profit of traders is summarized in Table 12. Market cost, purchasing and selling price and
market Profit has competed for channel 1 only. Based on this, Profit obtained exporters was higher
than the farmer traders and collectors/assemblers. This profit was made possible due to the selling
price obtained from the terminal market was the highest among others.
Table 13: Average market cost, average. Purchase price, average selling price and profit margins
Price Farmer’s trader collectors/assemblers Exporters
Average Purchasing price 3514 4000 6000 Average market cost 290 1680 2010
Marginal profit 196 320 905 Source: individual interview and Group discussions, 2012

56
Chapter V
5. Conclusion and recommendations
5.1. Conclusion
This study presents the determinants of cattle supply and the role of Ethio-Sudan cross-border trade
based in the case of north Gondar zone of Amhara national regional state. The study employed both
descriptive and econometric approaches used data generated from both primary sources (using a pre-
tested questionnaire, FGDs and KIIs) and secondary sources.
The major social, economic and demographic characteristics analysed using χ2 /t-tests. The result
obtained from descriptive analysis, educational background of the sample household heads is believed
to be an important feature that determines the readiness of household heads to accept new ideas and
innovations. So, Educational level of the sample households is concerned 46%, 18%, 17.5% and
16.5% are illiterate, Read and write, Primary and secondary correspondingly. The chi-square test
indicates that there is a significant contribution to supply cattle to the market as the participant
educational level increases at 1% significance level in their education
Resource ownership is characterized in terms of cattle, oxen and land owned by sample households.
The sample survey result indicated that on an average those who were participated in cattle supply to
market were owned 5.3, 31.6 and 1.95 oxen, land(ha) and cattle respectively. This result indicates that
participants in cattle supply more holding than other non-participants. On top of this, the chi-square
result indicated that there is statistically significant contribution for cattle supply to the market those
who participated in credit than the non participants. Moreover, result reflected that the participants
‘who have extension contact, large family size, access to market price information out strips than non-
participants on cattle supply market. Therefore, the results indicates that social, economic and

57
demographic characteristics are determinant factors or variables to enhance cattle supply to the
market
The main determinants participations on cattle supply market were an analyzed using heckman two
stage procedure, which allows to independently determining the factors affecting market participation
and level of participation. From the hypothesized 16 determinants of market participation, three
factors, namely total number of cattle owned, number of sheep owned, and access to development
agents were found to be the determinants of participation. Whereas, the level of market participation
(number of cattle sold over a year) was significantly determined by the total number of cattle owned
per household (positively), and total numbers of poultry owned and size of land holding (negatively)
Three different markets types namely primary, Secondary and terminal are exists in the study area.
Eight market channels ranges from producers to importers are also subsumed under these markets.
Quantity of cattle passed through different marketing agents from farmers to consumers/ importers.
Actors participating in cattle markets also range from small farmers (producers) and local assemblers,
to cooperatives, consumers, butchers, agents (brokers), big wholesale traders, exporters, and importers.
Both legal and illegal cross-border cattle trade systems operate along Ethio-Sudan border via Metem
Wo reda. The legal cattle cross-border trade started in December 2004, after the cross-border trade
agreement between Ethiopia and Sudan was signed. Previous different studies on the market share of
legal and illegal along Ethio- Sudan borer via metema were accounts about 40% and 60%
respectively. However, this study result indicated that the legal and illegal market shares were reached
about 69% and 31%. This result also supported by focus group discussions and different sector offices
working in the study area. SO, we dare to say that illegal cattle market system become decreases from
time to time due to the construction of the terminal market in the side of Ethiopia as well as integrated
stakeholders control on the illegal market.

58
During this study illegal cattle market routes were also identified. Accordingly, the main outlets from
the Ethiopian side are Metema Yohannes, Abdurafi(Delello), Nefsgebeya and Shinfa(Tumet) and
Abrehajira, while Galabat, Tiha, Fazira, Endibilo and Berekete Nur are the most important entry points
on the Sudanese side. These routes must give attention by the government in terms of policy
intervention and control.
According to the result of the study, the main causes for the development of illegal cattle trade in the
study area are:
1) Lack of adequate modern market centres which consists of different components such as feed,
water, shade, etc leads to illegal cattle trade. Though there is one modern market centre that
serving both as secondary and terminal for the area still it does not satisfy the needs of the
community.
2) The lengthy of the natural boundary as well as absence of checking points across the entire
boundary except few points between Ethiopia and Sudan encourages increasing the illegal cattle
trade at the border area between the two countries.
3) The existence of the illegal marketing system is highly associated with the behaviour of key actors
(temporary nature of export activity and lack of awareness of the importance of international trade)
4) The illegal cattle marketing system is often characterized by financial constraint and this faces the
small holders in two ways.1st to inter into the legal export system they have financial problems to
fulfil export license requirements and 2nd to join fattening businesses in the form of association or
cooperative still money become essential.
5) The bureaucratic and extended nature of legal export procedure, inappropriate foreign currency
regulation, and the presence (for instance tariff, health certification requirement, etc) for cattle that
go through legal route on the contrary, the absence of tariff, health certification requirement, etc,
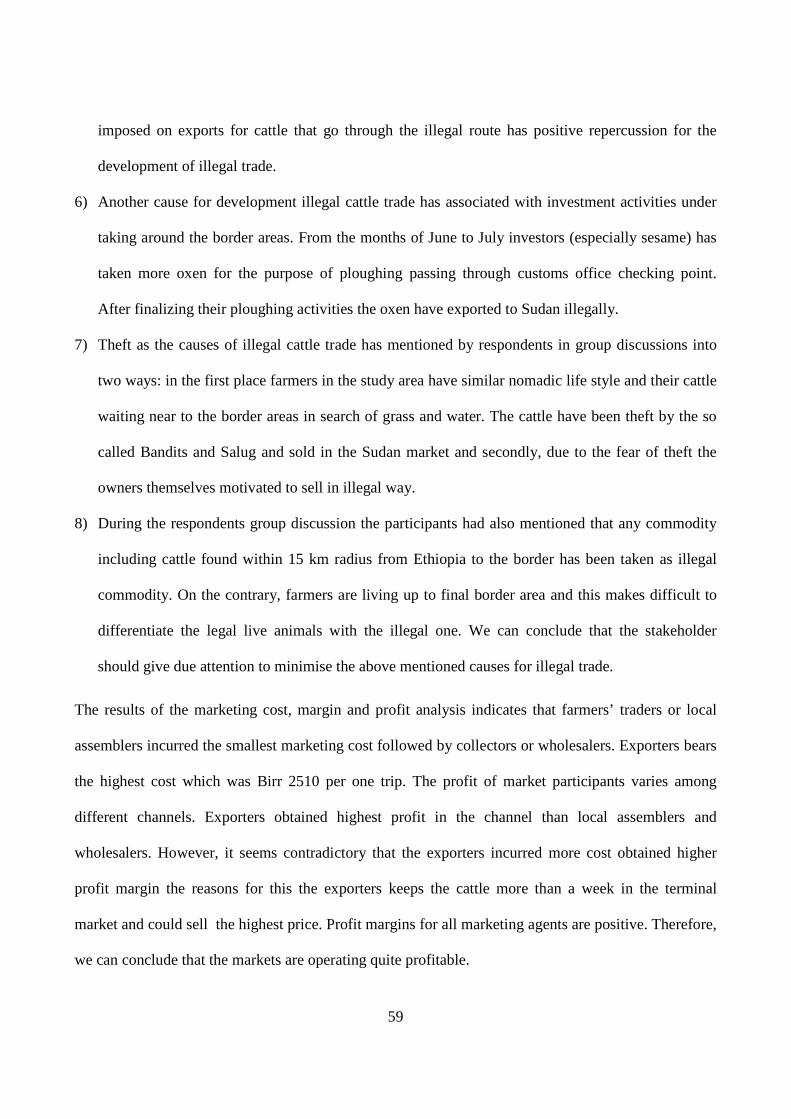
59
imposed on exports for cattle that go through the illegal route has positive repercussion for the
development of illegal trade.
6) Another cause for development illegal cattle trade has associated with investment activities under
taking around the border areas. From the months of June to July investors (especially sesame) has
taken more oxen for the purpose of ploughing passing through customs office checking point.
After finalizing their ploughing activities the oxen have exported to Sudan illegally.
7) Theft as the causes of illegal cattle trade has mentioned by respondents in group discussions into
two ways: in the first place farmers in the study area have similar nomadic life style and their cattle
waiting near to the border areas in search of grass and water. The cattle have been theft by the so
called Bandits and Salug and sold in the Sudan market and secondly, due to the fear of theft the
owners themselves motivated to sell in illegal way.
8) During the respondents group discussion the participants had also mentioned that any commodity
including cattle found within 15 km radius from Ethiopia to the border has been taken as illegal
commodity. On the contrary, farmers are living up to final border area and this makes difficult to
differentiate the legal live animals with the illegal one. We can conclude that the stakeholder
should give due attention to minimise the above mentioned causes for illegal trade.
The results of the marketing cost, margin and profit analysis indicates that farmers’ traders or local
assemblers incurred the smallest marketing cost followed by collectors or wholesalers. Exporters bears
the highest cost which was Birr 2510 per one trip. The profit of market participants varies among
different channels. Exporters obtained highest profit in the channel than local assemblers and
wholesalers. However, it seems contradictory that the exporters incurred more cost obtained higher
profit margin the reasons for this the exporters keeps the cattle more than a week in the terminal
market and could sell the highest price. Profit margins for all marketing agents are positive. Therefore,
we can conclude that the markets are operating quite profitable.

60
5.2. Recommendations
Based on the findings of this study, the following measures have been recommended. Findings based
on descriptive and econometric analysis indicates that some variables such as educational level,
resources ownership especially, cattle, credit and extension services, etc found to have positive
contribution for cattle supply to the market and in turn increase income both at the households level
and the country. So, institutional facilities such as educational, extension and credit services provided
by the government in a sustainable manner in the area.
As this study result also indicated that the legal and illegal market shares were reached about 69% and
31%. This result also supported by focus group discussions and different sector offices working in the
study area. This implies that still considerable share of illegal cattle trade reduced from time to time. I
recommended that the stakeholders should work on it by providing awareness creation and workshop
for the concerned bodies as well as by designing some policy measures such as implementation of
cross –border policies.
In addition to the above recommendations:
• There should be tighter control on the illegal side and supply levels to domestic consumption
and industries are to be satisfactorily maintained.
• the creation of policies and regulations enabling the legal export sector to be attractive and
economically rewarding
• The review of existing applicable policies and regulations and clearing any legal ambiguities
need to be the first action. Encouraging export meat abattoirs is also advisable.
• I recommend also to development and implementation of appropriate market information
supply system.
61
Another cause for development illegal cattle trade has associated with investment activities under
taking around the border areas. To minimize this risk the investors should sign agreement with
Customs office when the time he took to bring back to the original place.
Establishing exporters associations and cooperatives: The livestock traders and exporters along the
Ethio-Sudan border are not organized in associations. Traders and exporters associations could
facilitate communication with government authorities regarding the difficulties being encountered by
the exporters. Associations could also help in building capacity and synergy of traders and exporters,
thereby increasing their bargaining power in the trade.The marketing and transaction cost of cattle
trade could be reduced significantly if small farmer exporters could organize themselves and
collectively market their animals. Economies of scale as well as improved bargaining power could
result in higher benefits to exporters, in addition to contributing to reduce illegal trade.
Streamlining the lengthy and bureaucratic export process and custom clearance system. According to
the legal exporters, the livestock export process is too lengthy and the custom clearance system is
bureaucratic. It is recommended that these issues received due attention by concerned bodies and
streamline the process to shorten export time to the extent possible.
Developing alternative markets and infrastructure: One of the major reasons why the lowlanders use
the illegal marketing route is the lack of alternative market outlets. In the high livestock potential
lowland areas, supply is usually higher than local demand. Developing market centres appropriately
chosen to cater for the high potential livestock producing areas could reduce the use of illegal trade
routes. Additional modern cattle market centre construction at Kokit Kebele is advisable.
The development of market centres should, however, be accompanied with developing infrastructure,
especially road networks. Establishing abattoirs and slaughter houses can also contribute to the
development of alternative local markets, if found to be feasible and profitable.

62
Improving law enforcement and security: Risk due to theft and insecurity remains to be an important
reason for forced livestock sales. Farmers are usually forced to sell cattle at low prices when
confronted with the risk of losing their animals due to theft. Improving law enforcement and the
security situation could contribute to the reduction of the illegal trade routes.
Currency regulation: The current currency regulation system is advance payment system, which
requires exporters to deposit foreign currency before they sell the animals. This system appears to
encourage the development of local black market for foreign currencies. It also makes exporters pay
higher prices for the foreign currencies than the official exchange rate. As such, it also contributes to
the development of the illegal trade routes. I recommend that a study be made by appropriate
professionals to evaluate the system and develop appropriate currency regulation system that best fits
the export market situation.
63
5. LIST OF REFERENCES
Aklilu Woldu and DR. Eshete Dejen, Ethiopia Sanitary & Phytosanitary Standards and Livestock
Meat Marketing Program(SPS-LMM) Texas Agricultural Experiment Station A & M
University System, The Supply, Marketing and Trade of live animals in the Amhara Region,
October 2009, Addis Ababa.
Ayele Solomon, Assegid Workalemahu, Jabbar M.A. Ahmed.M.M and Belachew Hrissa, 2003.
Livestock marketing in Ethiopia: A review of structure, performance and development
initiatives.
Belachew, H. and J. Eshetu, 2003. Challenges and Opportunities of Livestock Marketing in Ethiopia.
Proceedings of the 10th annual conference of the Ethiopian society of Animal production
(ESAP), Addis Ababa, Ethiopia, pp. 34-36.
CSA, 2003. Ethiopian Sample survey Enumeration. Addis Ababa. 2(341). pp. 382-385.
CSA, 2004. Retail Price Indices, Addis Ababa. 3(243). 341p.
Demelash Seifu, 2003. Haricot bean exports, pattern, market share, constraints and prospects: A study
in Ethiopia. M.Sc. Thesis Presented to the School of Graduates Studies of Alemaya
University.
End market analysis of Ethiopian livestock and meat, USAID, published by ACDI/VOCA consultant
funded by USAID, may, 2010.
FAO StatDatabase. Elias Mulugeta, Berhanu Gebremedhin, Hockstra D and Jabba M, 2007 Analysis
of the Ethio-Sudan cross-border Cattle Trade: The case of Amhara
FAO (Food and Agricultural Organization of the United Nations), 1999-2005.
FAO (Food and Agriculture Organization), 1997. Agriculture and food marketing management. Rome,
Italy.
FAO (Food and Agriculture Organization), 1999. Law and Markets: Improving the legal environment
for agricultural marketing. Agricultural Services Bulletin 000. Rome Italy.87p
FAO (Food and Agriculture Organization), 2003. Analysis of the food consumption of

64
Getachew, B. 2002. Cattle marketing in West Showa. M.Sc. thesis presented to School of Graduate
Studies of Alemaya University, Alemaya.
Granger, C.W.J., 1981. Some properties of time series data and their use in econometric
Gujarat, Domodar, 2004. Basic of Econometrics, Fourth-ed. McGraw hill Company, In. United States
Military Academy, West Point
IGNOU, (2009), Economics of social sector and Environment (MEC 008); Block 1, IGNOU, New
Delhi
ILRI (International Livestock Research Institute), 2005. Initial draft report, Metema pilot learning site
diagnosis and program design.
Israel, Glenn D. ( 19992), Determining sample size, Program Evaluation and Organizational
Development, IFAS, University of Florida, PEOD-6, Revised April 2009.
Johnston, J. and Dinardo, J., 1997. Econometrics Methods. 4th Edition, The McGraw-HillCompanies,
Inc., New York. 250p.
MEDaC (Ministry of Economic Development and Cooperation). 1999. Survey of Ethiopian Economy:
Review of Post Reform Development (1992/93-1997/98). Addis Ababa, Ethiopia.
Mendoza G., 1995, A Primer on marketing channels and margins. Lyme Rimer Publishers Inc., USA.
425p.
Model specification. J. of Econometrics. 16:121-130.
Negaret Gazetta. 2003. Proclamation No. 318/2003.
North Gondar Finance and plan Department, 2004, Rural households socio-economic Baseline Survey
of 15 Woredas in Amhara Region, Reports of Regional Finance and Economic Bureau, Bahir
Dar, Ethiuopia.
Regional State.
Tadese Biru Wodajo. 2010. A Double-Hurdle Model of computer and Internet use in America
households, Department of Economics Western Michigan University,
Timmer, C. P., 1974. A Modal of price marketing margin in Indonesia. Food Resenen Institute studies.
13(2): 145-167.
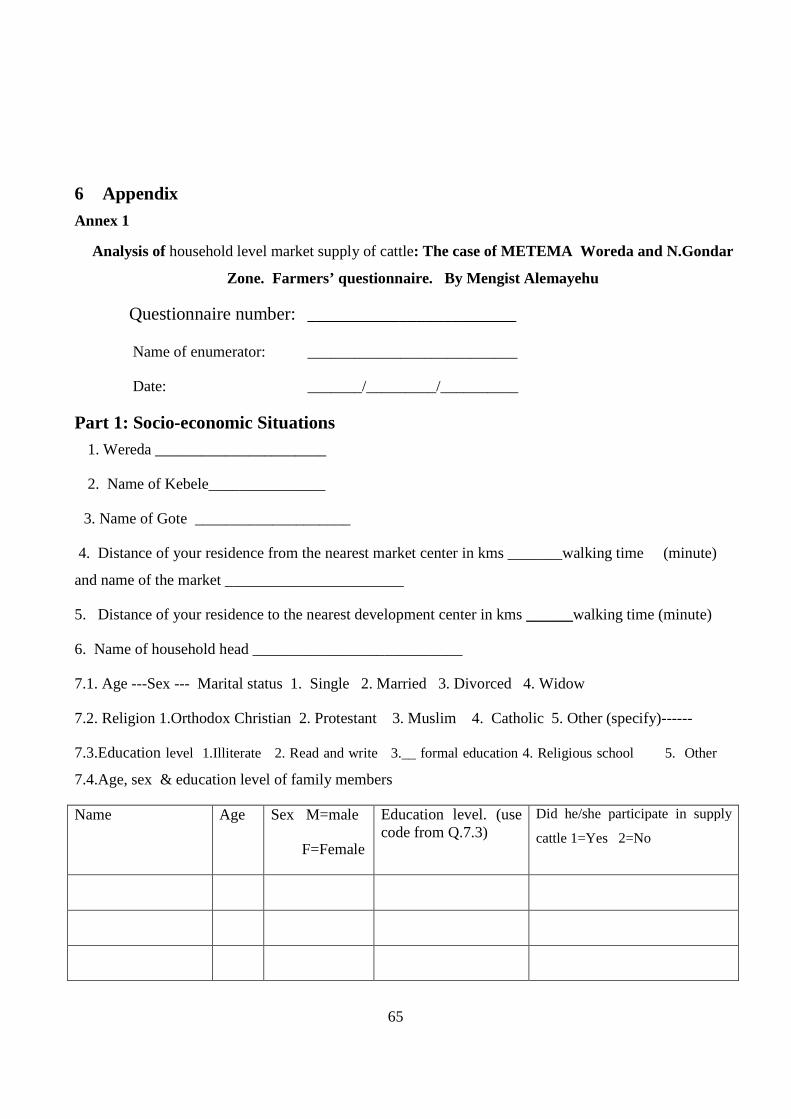
65
6 Appendix Annex 1
Analysis of household level market supply of cattle: The case of METEMA Woreda and N.Gondar
Zone. Farmers’ questionnaire. By Mengist Alemayehu
Questionnaire number: _______________________
Name of enumerator: ___________________________
Date: _______/_________/__________
Part 1: Socio-economic Situations 1. Wereda ______________________
2. Name of Kebele_______________
3. Name of Gote ____________________
4. Distance of your residence from the nearest market center in kms _______walking time (minute)
and name of the market _______________________
5. Distance of your residence to the nearest development center in kms ______walking time (minute)
6. Name of household head ___________________________
7.1. Age ---Sex --- Marital status 1. Single 2. Married 3. Divorced 4. Widow
7.2. Religion 1.Orthodox Christian 2. Protestant 3. Muslim 4. Catholic 5. Other (specify)------
7.3.Education level 1.Illiterate 2. Read and write 3.__ formal education 4. Religious school 5. Other
7.4.Age, sex & education level of family members
Name Age Sex M=male
F=Female
Education level. (use code from Q.7.3)
Did he/she participate in supply
cattle 1=Yes 2=No

66
Part 2: Farming Experience,
2.1. Number of years since---------started farming ________ years
2.2. Types of activities and Experience
Activity Did you participate in
activities 1=yes 2=No
Years of experience Annual income (Birr)
Crop production
Dairy production
fattening
Cattle export
Off farming
Non-farming
Part 3: Resource ownership and tenure 3.1. Current resources Ownership
3.1.1 Livestock ownership
Type of livestock No owned in
Jan.2011-Dec.2011
No. of
sold
Cash income from
sold (Birr)
Estimated price
of the unsold
Total value
Cows
Oxen
Heifers
Calves
Bulls
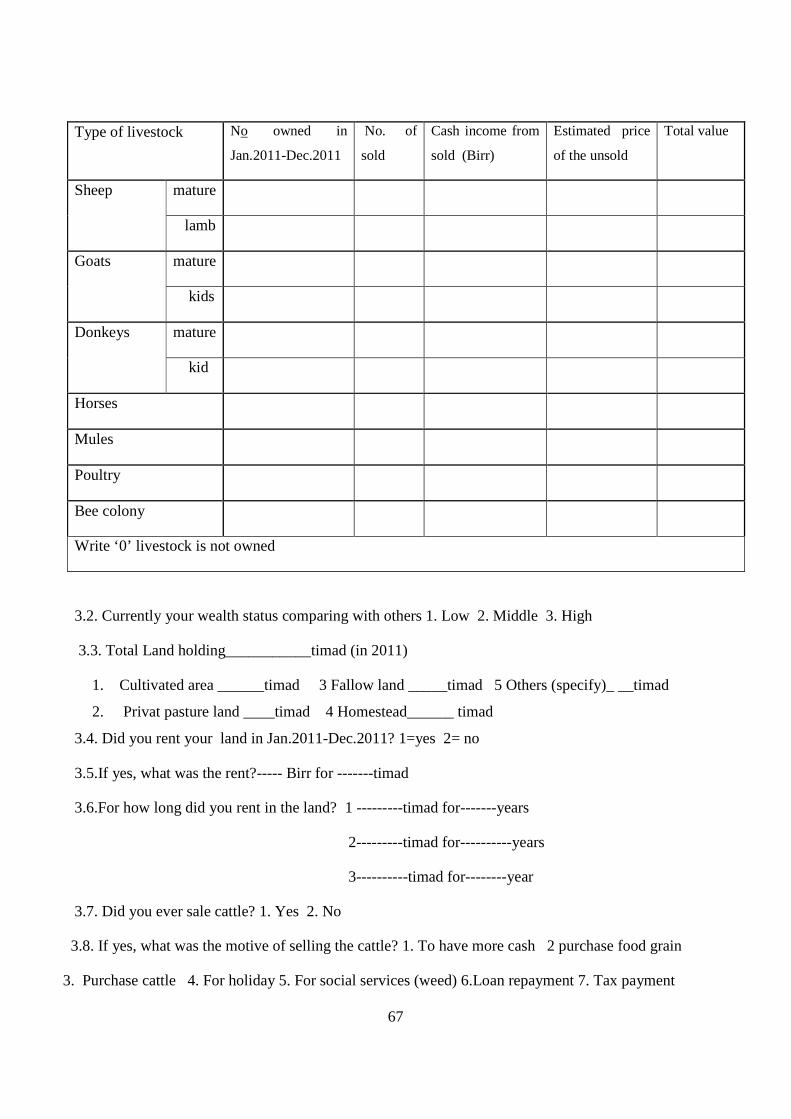
67
Type of livestock No owned in
Jan.2011-Dec.2011
No. of
sold
Cash income from
sold (Birr)
Estimated price
of the unsold
Total value
Sheep
mature
lamb
Goats mature
kids
Donkeys
mature
kid
Horses
Mules
Poultry
Bee colony
Write ‘0’ livestock is not owned
3.2. Currently your wealth status comparing with others 1. Low 2. Middle 3. High
3.3. Total Land holding___________timad (in 2011)
1. Cultivated area ______timad 3 Fallow land _____timad 5 Others (specify)_ __timad
2. Privat pasture land ____timad 4 Homestead______ timad
3.4. Did you rent your land in Jan.2011-Dec.2011? 1=yes 2= no
3.5.If yes, what was the rent?----- Birr for -------timad
3.6.For how long did you rent in the land? 1 ---------timad for-------years
2---------timad for----------years
3----------timad for--------year
3.7. Did you ever sale cattle? 1. Yes 2. No
3.8. If yes, what was the motive of selling the cattle? 1. To have more cash 2 purchase food grain
3. Purchase cattle 4. For holiday 5. For social services (weed) 6.Loan repayment 7. Tax payment
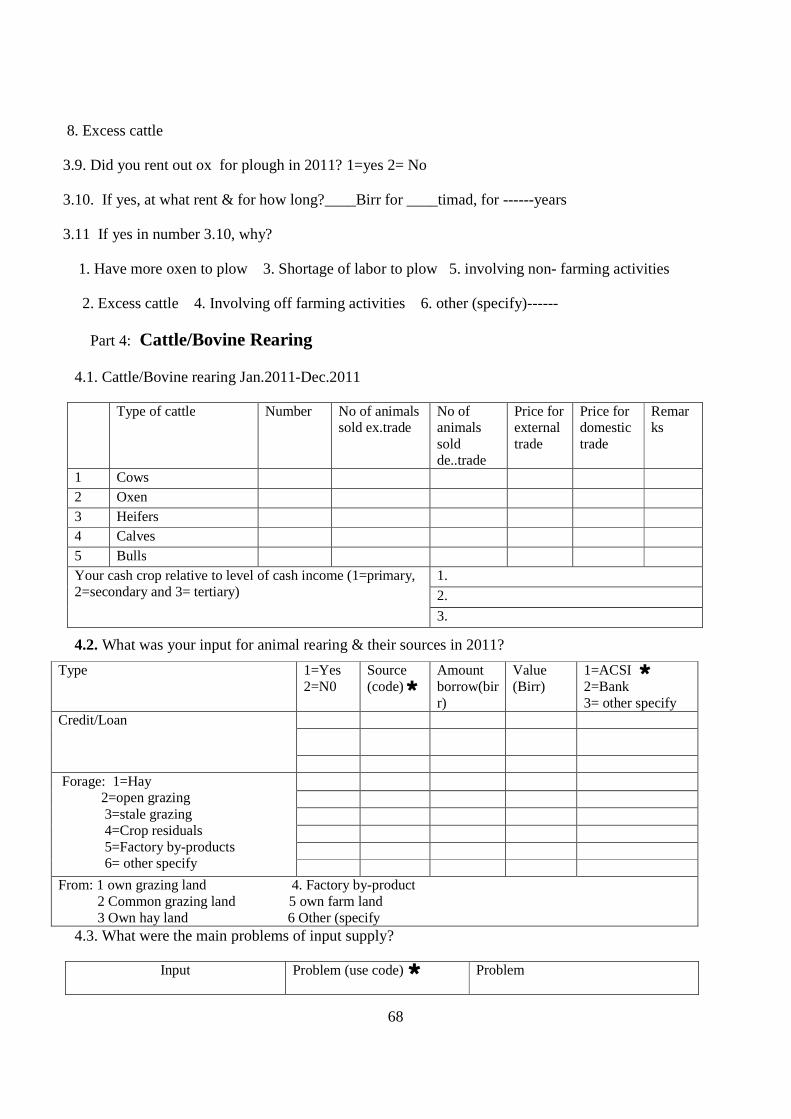
68
8. Excess cattle
3.9. Did you rent out ox for plough in 2011? 1=yes 2= No
3.10. If yes, at what rent & for how long?____Birr for ____timad, for ------years
3.11 If yes in number 3.10, why?
1. Have more oxen to plow 3. Shortage of labor to plow 5. involving non- farming activities
2. Excess cattle 4. Involving off farming activities 6. other (specify)------
Part 4: Cattle/Bovine Rearing
4.1. Cattle/Bovine rearing Jan.2011-Dec.2011
Type of cattle Number No of animals sold ex.trade
No of animals sold de..trade
Price for external trade
Price for domestic trade
Remarks
1 Cows 2 Oxen 3 Heifers 4 Calves 5 Bulls Your cash crop relative to level of cash income (1=primary, 2=secondary and 3= tertiary)
1.
2.
3.
4.2. What was your input for animal rearing & their sources in 2011?
Type 1=Yes 2=N0
Source (code) �
Amount borrow(birr)
Value (Birr)
1=ACSI � 2=Bank 3= other specify
Credit/Loan
Forage: 1=Hay 2=open grazing 3=stale grazing 4=Crop residuals 5=Factory by-products 6= other specify
From: 1 own grazing land 4. Factory by-product 2 Common grazing land 5 own farm land 3 Own hay land 6 Other (specify
4.3. What were the main problems of input supply?
Input Problem (use code) � Problem
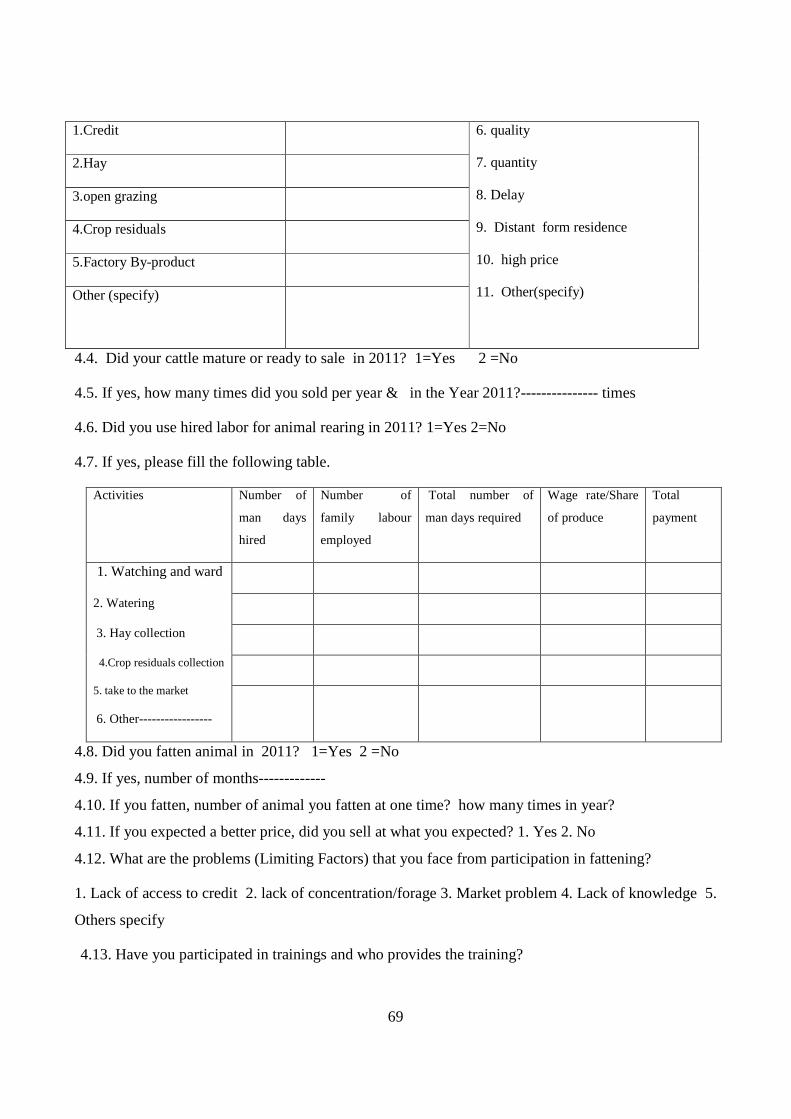
69
1.Credit 6. quality
7. quantity
8. Delay
9. Distant form residence
10. high price
11. Other(specify)
2.Hay
3.open grazing
4.Crop residuals
5.Factory By-product
Other (specify)
4.4. Did your cattle mature or ready to sale in 2011? 1=Yes 2 =No
4.5. If yes, how many times did you sold per year & in the Year 2011?--------------- times
4.6. Did you use hired labor for animal rearing in 2011? 1=Yes 2=No
4.7. If yes, please fill the following table.
Activities Number of
man days
hired
Number of
family labour
employed
Total number of
man days required
Wage rate/Share
of produce
Total
payment
1. Watching and ward
2. Watering
3. Hay collection
4.Crop residuals collection
5. take to the market
6. Other-----------------
4.8. Did you fatten animal in 2011? 1=Yes 2 =No
4.9. If yes, number of months-------------
4.10. If you fatten, number of animal you fatten at one time? how many times in year?
4.11. If you expected a better price, did you sell at what you expected? 1. Yes 2. No
4.12. What are the problems (Limiting Factors) that you face from participation in fattening?
1. Lack of access to credit 2. lack of concentration/forage 3. Market problem 4. Lack of knowledge 5.
Others specify
4.13. Have you participated in trainings and who provides the training?
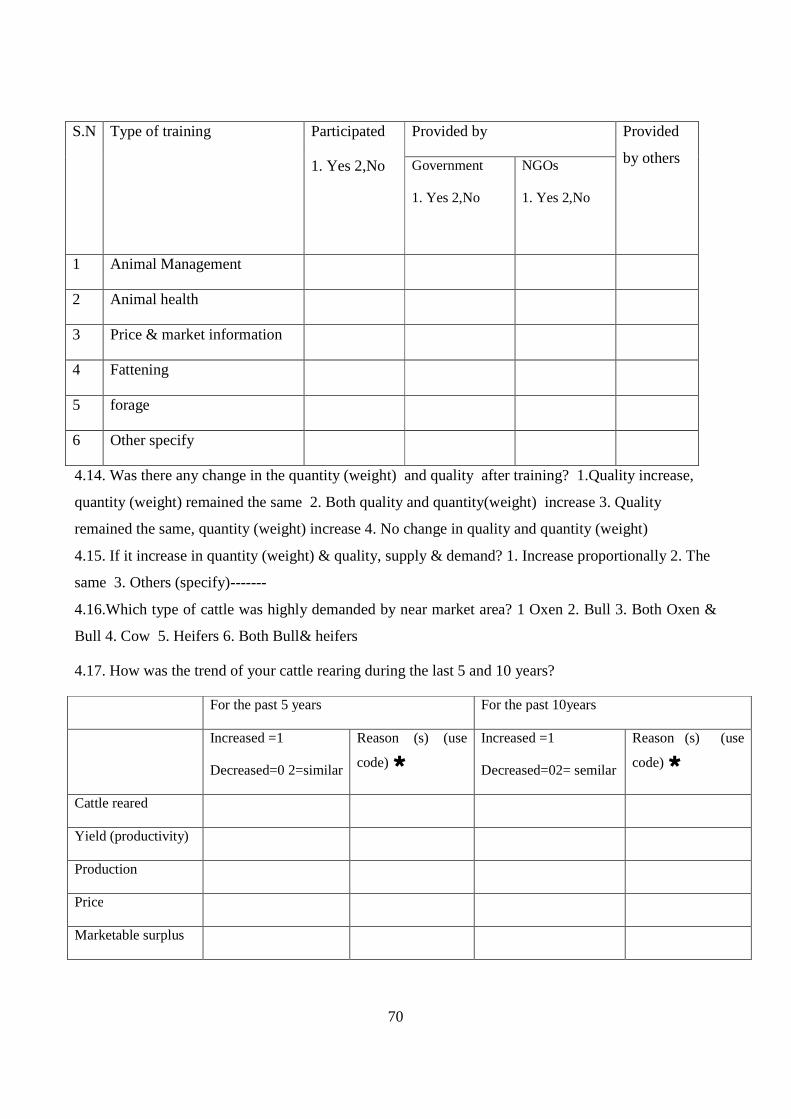
70
S.N Type of training Participated
1. Yes 2,No
Provided by Provided
by others Government
1. Yes 2,No
NGOs
1. Yes 2,No
1 Animal Management
2 Animal health
3 Price & market information
4 Fattening
5 forage
6 Other specify
4.14. Was there any change in the quantity (weight) and quality after training? 1.Quality increase,
quantity (weight) remained the same 2. Both quality and quantity(weight) increase 3. Quality
remained the same, quantity (weight) increase 4. No change in quality and quantity (weight)
4.15. If it increase in quantity (weight) & quality, supply & demand? 1. Increase proportionally 2. The
same 3. Others (specify)-------
4.16.Which type of cattle was highly demanded by near market area? 1 Oxen 2. Bull 3. Both Oxen &
Bull 4. Cow 5. Heifers 6. Both Bull& heifers
4.17. How was the trend of your cattle rearing during the last 5 and 10 years?
For the past 5 years For the past 10years
Increased =1
Decreased=0 2=similar
Reason (s) (use
code) �
Increased =1
Decreased=02= semilar
Reason (s) (use
code) �
Cattle reared
Yield (productivity)
Production
Price
Marketable surplus

71
Reason:
1 increase/ decrease of extension service 9 Lack of hay 17 Drought
2 lack of grazing land 10 Decrease in supply 18 Access to credit
3Lack of labor availability 11Decrease in demand 19 decrease in price (in crease in supply)
4 Lack of forage 12 Lack of water 20 increase in production
5 Increase in family size 13 increase in tax 21 decrease in production
6 increase in price (increase in demand) 14 favorable weather condition 22 other (specify)--------------
7 Disease 15 Availability of labour
Part 5: Access to extension Services
5.1. Did you have extension contact in relation to cattle rearing in 2011 annual year?
1= Yes 2=No
5.2. If yes, how often the extension agent contacted you? 1.Weekly 2.Once in two week 3. Monthly
4. Bi-annually 5. Once in a year 6. Twice in the year 7. Any time when I ask them
5.3. What was the extension advice on? 1.AI service/breeding service 2. Cattle management 3.stale
grazing 4.Animal health 5. Forage preparation 6.fattening 7 other (specify)---------
5.4.Did you need credit in 2011? 1= Yes 2 =No
5.5. If yes, Did you take credit as you requested in 2011? 1.=Yes 2.=No
5.6. How much did you take?----------Birr
5.7. For what purpose did you take the credit 1. To purchase cattle (Oxen) 2. To fatten cattle 3. Health
4. Forage Purchase 5. To pay tax 6. To purchase food grain forage7. Animal production 8.for daily
laborer 9. Other (specify)-
5.8.If yes, From whom did you get credit? 1 Relative 2. Bank 3.ACSI 4. Friend 5. Traders 6. NGO
7. Kebele 8. Other (specify)---------
5.9. Cattle trade channel: 1. producers→ farmers’ trader → Exporter 2. Producers→ farmers traders→
fattener→ Exporter
5.10. Did you know both legal and illegal trade procedures? If yes, what are the causes and solutions
of illegal trade?----------------------------------------------------------------------------------------------
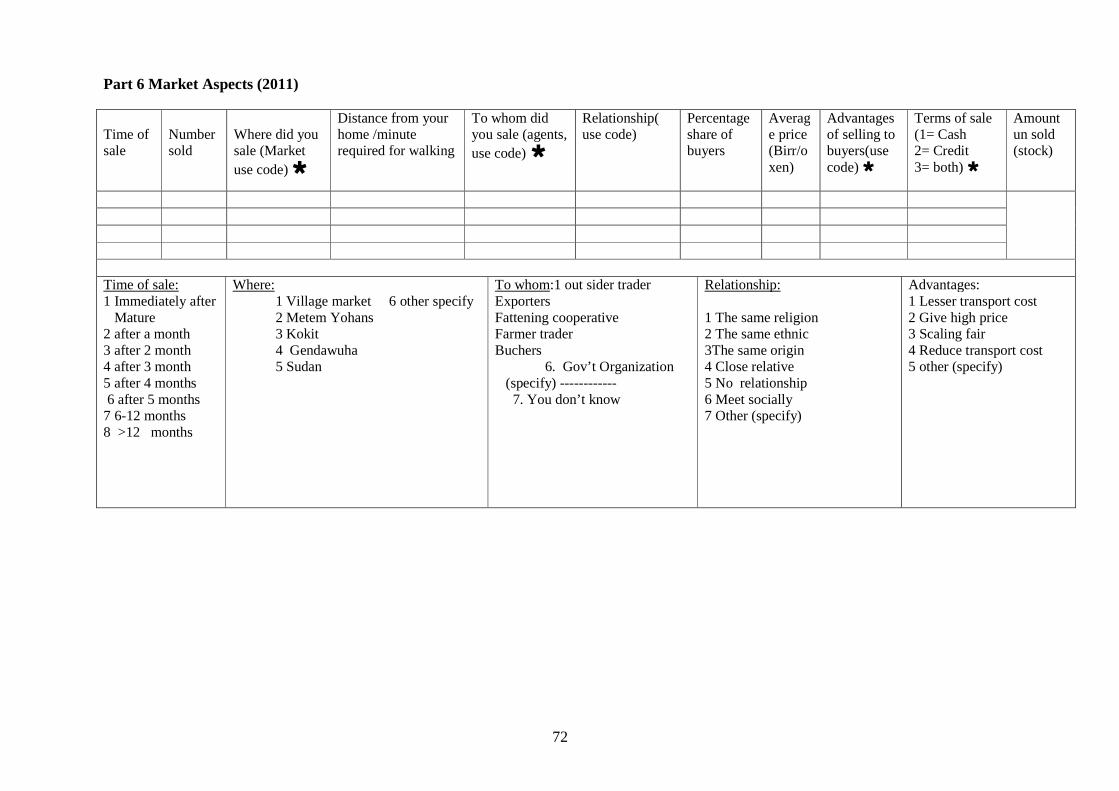
72
Part 6 Market Aspects (2011)
Time of sale
Number sold
Where did you sale (Market use code) �
Distance from your home /minute required for walking
To whom did you sale (agents, use code) �
Relationship( use code)
Percentage share of buyers
Average price (Birr/oxen)
Advantages of selling to buyers(use code) �
Terms of sale (1= Cash 2= Credit 3= both) �
Amount un sold (stock)
Time of sale: 1 Immediately after Mature 2 after a month 3 after 2 month 4 after 3 month 5 after 4 months 6 after 5 months 7 6-12 months 8 >12 months
Where: 1 Village market 6 other specify 2 Metem Yohans 3 Kokit 4 Gendawuha 5 Sudan
To whom:1 out sider trader Exporters Fattening cooperative Farmer trader Buchers 6. Gov’t Organization (specify) ------------ 7. You don’t know
Relationship: 1 The same religion 2 The same ethnic 3The same origin 4 Close relative 5 No relationship 6 Meet socially 7 Other (specify)
Advantages: 1 Lesser transport cost 2 Give high price 3 Scaling fair 4 Reduce transport cost 5 other (specify)
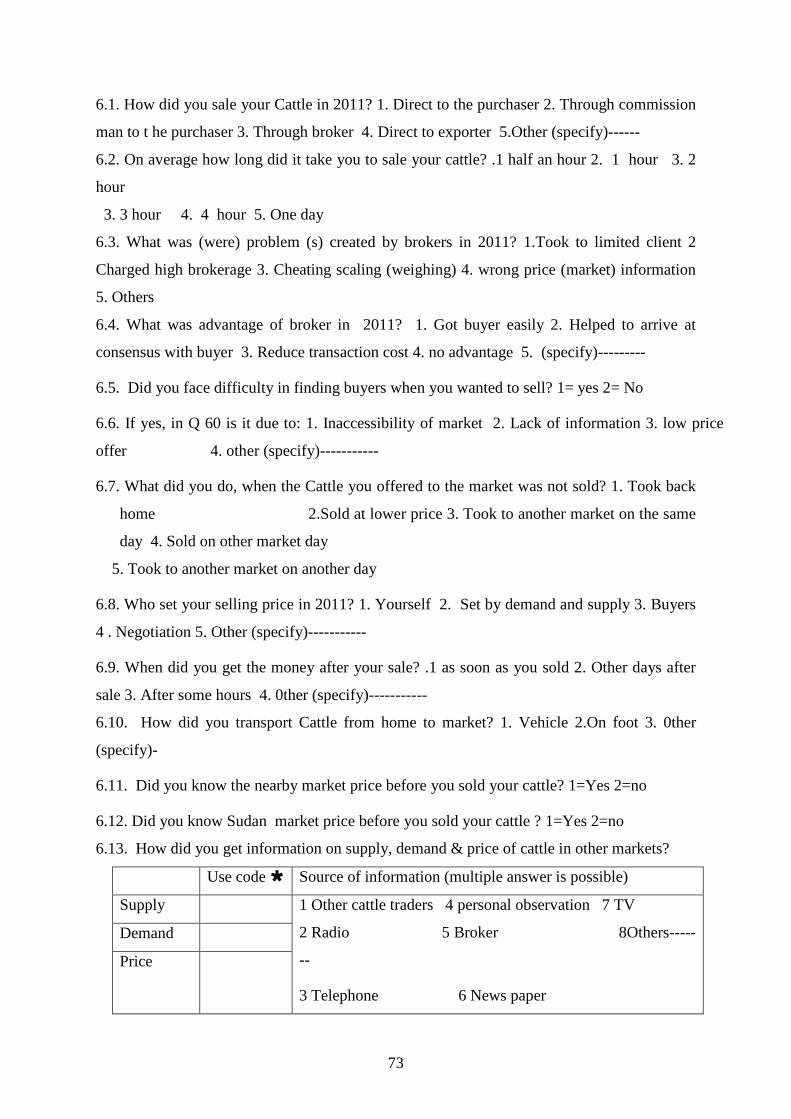
73
6.1. How did you sale your Cattle in 2011? 1. Direct to the purchaser 2. Through commission
man to t he purchaser 3. Through broker 4. Direct to exporter 5.Other (specify)------
6.2. On average how long did it take you to sale your cattle? .1 half an hour 2. 1 hour 3. 2
hour
3. 3 hour 4. 4 hour 5. One day
6.3. What was (were) problem (s) created by brokers in 2011? 1.Took to limited client 2
Charged high brokerage 3. Cheating scaling (weighing) 4. wrong price (market) information
5. Others
6.4. What was advantage of broker in 2011? 1. Got buyer easily 2. Helped to arrive at
consensus with buyer 3. Reduce transaction cost 4. no advantage 5. (specify)---------
6.5. Did you face difficulty in finding buyers when you wanted to sell? 1= yes 2= No
6.6. If yes, in Q 60 is it due to: 1. Inaccessibility of market 2. Lack of information 3. low price
offer 4. other (specify)-----------
6.7. What did you do, when the Cattle you offered to the market was not sold? 1. Took back
home 2.Sold at lower price 3. Took to another market on the same
day 4. Sold on other market day
5. Took to another market on another day
6.8. Who set your selling price in 2011? 1. Yourself 2. Set by demand and supply 3. Buyers
4 . Negotiation 5. Other (specify)-----------
6.9. When did you get the money after your sale? .1 as soon as you sold 2. Other days after
sale 3. After some hours 4. 0ther (specify)-----------
6.10. How did you transport Cattle from home to market? 1. Vehicle 2.On foot 3. 0ther
(specify)-
6.11. Did you know the nearby market price before you sold your cattle? 1=Yes 2=no
6.12. Did you know Sudan market price before you sold your cattle ? 1=Yes 2=no
6.13. How did you get information on supply, demand & price of cattle in other markets?
Use code � Source of information (multiple answer is possible)
Supply 1 Other cattle traders 4 personal observation 7 TV
2 Radio 5 Broker 8Others-----
--
3 Telephone 6 News paper
Demand
Price

74
6.14. How did you qualify your source of information? 1. it was reliable 2. it was timely
3. it was adequate 4. Other (specify)------------------
6.15. What were your cost of cattle production 2011?
Cattle rearing Fattening
Birr Birr
Price of forage
Cost of medicine
Cost of labour
Cost of oxen transportation
Interest rate on loan ( if you took credit)
Hired labour cost
Family labour cost
Other (specify)
Total cost
6.16 Did you face problem cattle in production and marketing? If yes what was the cause & your suggestions to solve each problem?
No. Problem
faced
1= Yes
2= No
If yes what do you think was (were) the cause (s) of this problem?
What is your suggestion to solve each problem?
1 Forage supply
2 Medicine supply
3 Water supply
4 Shortage of hay
5 Disease (type of
disease)

75
6 Loan repayment
7 Credit
8 Theft
9 Tax (double
taxing)
10 Price setting
11 Lack of demand
(market)
12
Scaling
(Weighing
Thank you!!!!