Embed Size (px)
Citation preview

MRI Imaging
By: Scott Hayes

MRI measures the movement of hydrogen atoms: Why hydrogen atoms?
Hydrogen is abundant in the water molecules in human tissue. The nuclei of Hydrogen can act like a “compass needle” in a magnetic
field. Some types of tissues prevent hydrogen from spinning as freely. For
example, bone is more restrictive to movement than fat. These differences can be detected to distinguish tissue type.
http://www.cs.sfu.ca/~stella/papers/blairthesis/main/_4056_figure87.gif

RF Pulse knocks H out of alignment
Hydrogen are knocked out of alignment with a radio frequency (RF) pulse and relax back into alignment with magnetic field.
HBo
90o RF Pulse
Applied
Hydrogen Relaxes and Realigns in
Magnetic field
However, hydrogen does not simply pivot back
into alignment. It precesses!

Physics ReviewPrecession – Gyroscope Example
Animation by Dr. Michael R. GallisPenn State Schuylkill
Creative Commons Lisence

Precession of Hydrogen Atoms
Larmor frequency (ω) is proportional to magnetic field strength:
ω = γ B
Animation from http://www.e-mri.org
Hydrogen are knocked out of alignment with a radio frequency pulse and process until they are again aligned with the magnetic field.
Movement is analogous to gyroscope movement.

Physics ReviewLenz’s Law
NS
Increasing B through coil = CW Current
“Right Hand Rule”
Decreasing B through coil = CCW Current
If no change in B
NO CURRENT

Why is Lenz’s Law important to MRI?
Each Hydrogen acts like a mini-magnet. Procession of Hydrogen can produce a measurable electric
current along a pickup coil. As hydrogen precesses, current oscillates until hydrogen aligns
with magnetic field.
Cur
rent
Time
Pickup Coil
Hydrogen is relaxing back into alignment of
magnetic field.

MRI Basic Layout
The magnetic field of an MRI machine is typically 3 Tesla!
The Earth’s magnetic field is less that 30 microtesla (0.00003 Ts).
http://www.magnet.fsu.edu/education/tutorials/magnetacademy/mri/index.html
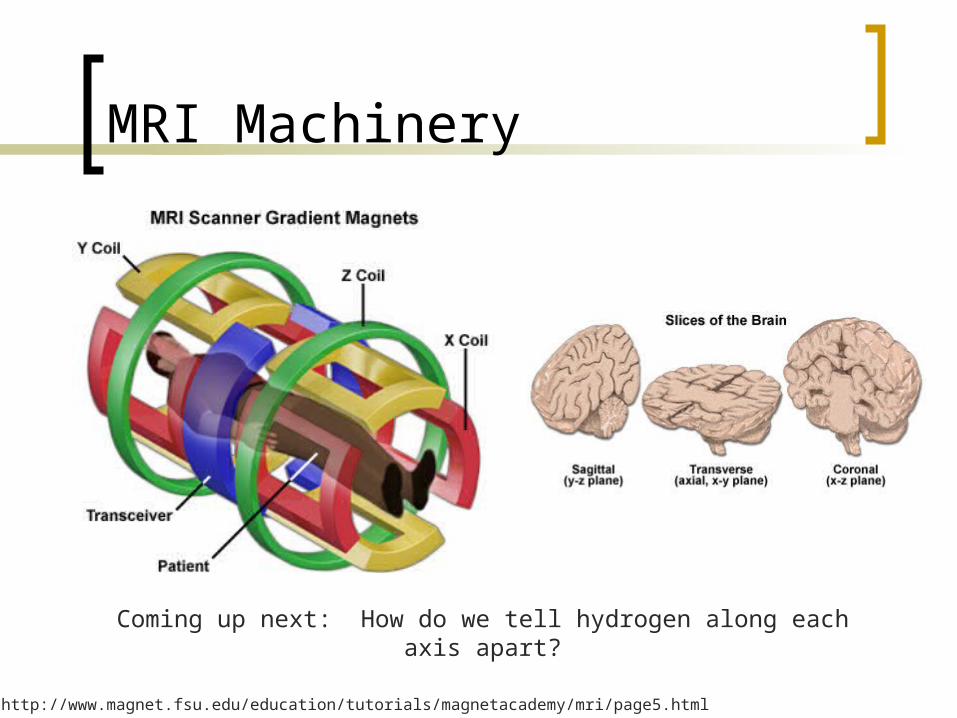
MRI Machinery
Images: http://www.magnet.fsu.edu/education/tutorials/magnetacademy/mri/page5.html
Coming up next: How do we tell hydrogen along each axis apart?

Gradient Slice Selection
H H H H
H H H H
H H H H
H H H H
BappliedwL= γBo
wL : Lamor Freq.
γ : Gyration Const.
Bo : Mag. Field
Applied Perpendicular to desired plane.
Spin speed represents processional frequency.
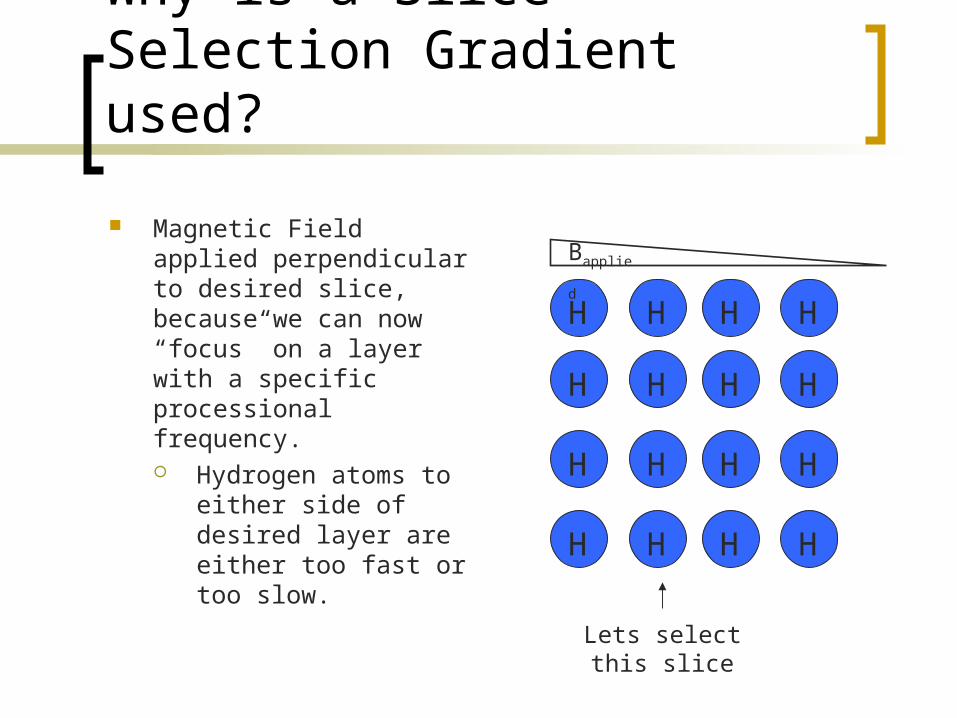
Why is a Slice Selection Gradient used?
Magnetic Field applied perpendicular to desired slice, because we can now “focus” on a layer with a specific processional frequency. Hydrogen atoms to
either side of desired layer are either too fast or too slow.
H
H
H
H
Bapplied
H
H
H
H
H
H
H
H
H
H
H
H
Lets select this slice
H
H
H
H
H
H
H
H
H
H
H
H
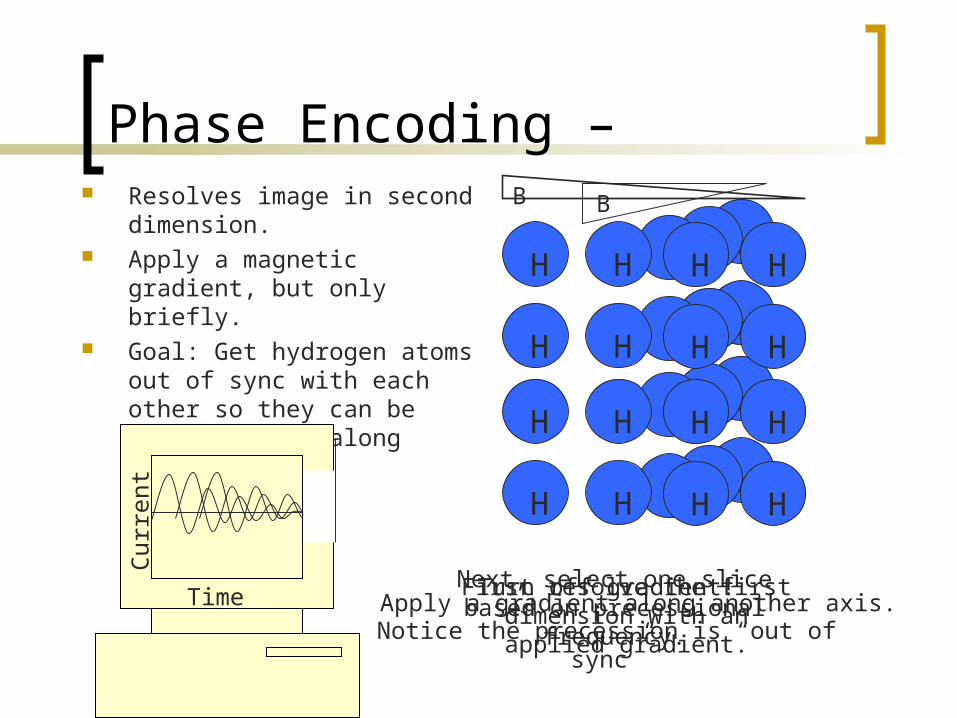
Phase Encoding – Resolves image in second
dimension. Apply a magnetic gradient, but
only briefly. Goal: Get hydrogen atoms out of
sync with each other so they can be distinguished along another axis.
H
H
H
H
H
H
H
H
H H
H H
H H
H H
B
First resolve the first dimension with an applied gradient.
Next, select one slice based on precessional frequency.Apply a gradient along another axis.
Turn off gradient!
Notice the precession is “out of sync”
B
Cur
rent
Time

Phase Encoding
Animation from http://www.e-mri.org

Resolving the Third DimensionFrequency Encoding
H
H
H
H
H
H
H
H
H
H
H
H
H
H
H
H
x
y
z
Slice plane
Review of Spatial Resolution:
1. Apply slice selection gradient and choose a slice based on precession frequency.
Consider plane your image!
2. Apply and turn off phase encoding gradient. This gets hydrogen in the x-axis out of sync.
3. Apply a third gradient, now we can distinguish hydrogen in the y-axis based on the precessional speeds.
We have now resolved all three dimensions!
But now what do we do with all this info….
B

Fourier’s Transform The pick up coil receives many different frequency oscillations. Use Fourier’s Transform to process the data.
Time [s]Sig
nal S
tren
gth 1
4
Freqency [Hz]
Sig
nal S
tren
gth
1
0.25
f = 1/T = ¼ = .25
1.5
0.5
1.5
-1
-1.5f = 1/T = ½ = .5
f = 1/T = 1/1 = 1
1.0
Transform

Fourier Transform (cont.)The pickup coil does not distinguish between the input of each hydrogen.
They are all read together, and constructively and destructively interfere.
Fourier’s allows us to determine which frequencies are along the axis.
For instance, if there are two hydrogen at different frequencies along an axis:
Sig
nal
Str
engt
h
Time [s]
1
-14
Time [s]
1
-14
Time [s]
1
-1
4+ =Current
Fourier
Frequency [Hz]
1
0.25Sig
nal
Str
engt
h
0.25
Frequency [Hz]
1
0.25 1
0.25
Frequency [Hz]
1
0.25
1

Image formation
Animation from http://e-mri.org

2D Fourier Transform
Recall that the second axis is resolved with a phase encoding gradient.
These hydrogen have the same frequency, but interfere with each other due to phase shift.
Sig
nal
Str
engt
h 1
-1
4Time [s]
1
-1
4
1
-1
4+ =
A 1D Fourier Transform cannot distinguish between shifted phases.
But if we take the Fourier Transform again, orthogonal to the first access the phase encoding gradient can be distinguished!
The resulting data is known as a K-Space.
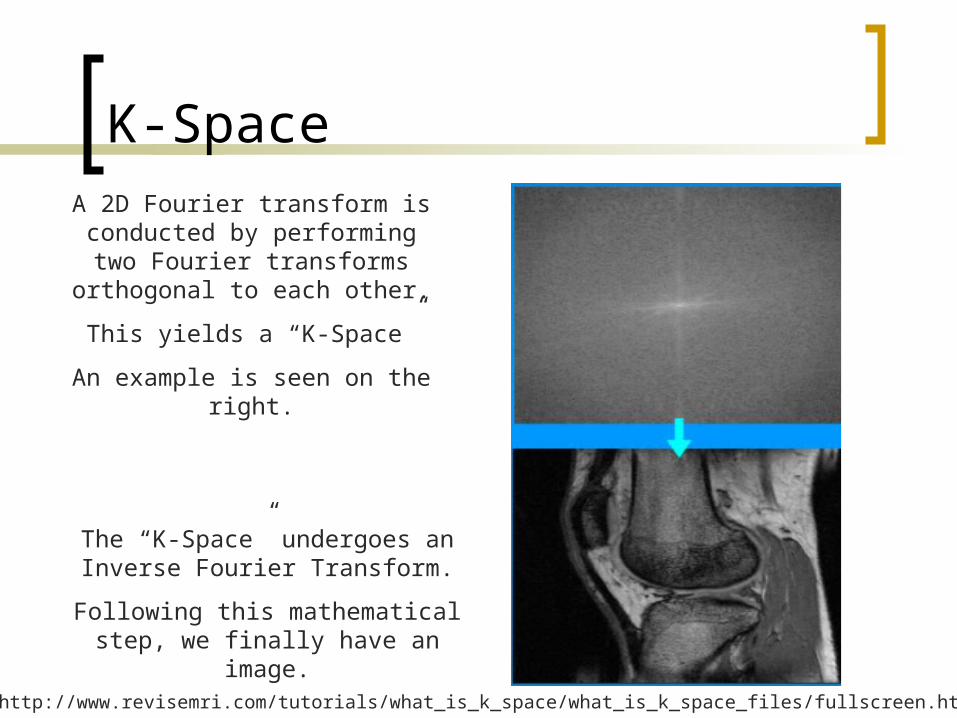
K-SpaceA 2D Fourier transform is
conducted by performing two Fourier transforms orthogonal to
each other.
This yields a “K-Space”
An example is seen on the right.
The “K-Space” undergoes an Inverse Fourier Transform.
Following this mathematical step, we finally have an image.
http://www.revisemri.com/tutorials/what_is_k_space/what_is_k_space_files/fullscreen.htm

K-SpaceGeneral spatial information is
concentrated towards the center of “K-Space”
In the figure to the right we see an image formed taking only the
Inverse Fourier Transform of the center of the K-Space.
As seen on the right, the peripheral regions of the K-Space encode for
the edges of the image.
http://www.revisemri.com/tutorials/what_is_k_space/what_is_k_space_files/fullscreen.htm

Why does an MRI machine make so much noise?
When gradients are applied, the strong magnetic field causes the coils to stretch.
Examples of sounds resulting from standard pulse sequence – Link
Pulses can be “tuned” (Wilson 2001)
Just for fun…some MRI music.
http://www.adarngooddog.com/Man_Covering_His_Ears%20cartoon.gif

MRI Modifications-Open MRI
Claustrophobic patients can’t tolerate the confined enclosure of an MRI machine.
Even mildly claustrophobic patients have trouble due to the very loud noise produced by the machine.
Open MRI machine works the same way, but with a weaker magnetic field and less resolution.
New 1 Tesla open MRI machines offer adequate resolution A standard MRI machine has a 3
Ts magnetic field.
A 1 Tesla open MRI machine manufactured by Phillips.

MRI Modifications-Functional MRI (fMRI)
Hemoglobin has different magnetic properties when bound to oxygen, that can be distinguished by fMRI.
Areas of brain activity have a surge of oxygenated blood.
fMRI can identify areas of the brain with high oxyhemoglobin content, which correlates to areas of heightened brain activity.
http://www.unmc.edu/dept/alliedhealth/rste/ctmri/

Thank you for viewing the presentation
Please post comments or suggestions on the “feedback” section of the project website.
http://www.simpsonstrivia.com.ar/simpsons-photos/wallpapers/homer-simpson-wallpaper-brain-1024.jpg