Embed Size (px)
Citation preview

John R. Hesselink1 Christopher F. Dowd1.2
Mark E. Healy1.2 Paul Hajek 1.3
Lori L. Baker1, 4
Thomas G, Luerssen5
This article appears in the March/April 1988 issue of AJNR and the May 1988 issue of AJR.
Received July 29, 1986; accepted after revision September 1, 1987.
1 Department of Radiology, University of California School of Medicine, and Magnetic Resonance Institute, San Diego, CA 92103. Address reprint requests to J. R. Hesselink, UCSD Medical Center, 225 Dickinson St. , San Diego, CA 92103.
2 Present address: Department of Radiology, University of California School of Medicine, San Francisco, CA 94143.
3 Present address: I. Med. Klinik/Rontgenstation, Lazarettgasse 14, A-1090 Wein, Austria.
4 Present address: Department of Diagnostic Radiology, Stanford University School of Medicine, Stanford, CA 94305.
5 Department of Neurosurgery, University of California School of Medicine, and MagnetiC Resonance Institute , San Diego, CA 92103 .
AJNR 9:269-278, March/April 1988 0195-6108/88/0902-0269 © American Society of Neuroradiology
269
MR Imaging of Brain Contusions: A Comparative Study with CT
Ninety-eight brain contusions in 17 patients served as a data base for a comparative study of MR and CT for defining brain contusions. MR was the more sensitive technique, detecting 98% of the brain contusions compared with only 56% by CT. CT was slightly better for showing hemorrhagic components, documenting 77% of hemorrhages compared with 71% for MR. The appearance of the contusions on MR was variable, depending on the T1- and T2-weighting of the images and the constituents of the contusions, such as edema, hemorrhage, and encephalomalacia. On MR, hemorrhagic components appeared as high signal on T1-weighted images and as either low or high signal on T2-weighted images, depending on the age of the hemorrhage. The approximate ages of hemorrhagiC contusions were often suggested by their appearance on T1 -and T2-weighted images.
CT is very effective for evaluating acute head trauma, but MR is recommended for documenting brain contusions during the subacute and chronic stages of head injuries.
In the few years since its introduction, MR has assumed a major role in imaging the CNS. The superior sensitivity of MR for early detection of demyelinating disease, cerebral neoplasia, infarction, and inflammation is generally accepted . Moreover, its multi planar imaging capability affords better delineation of intracranial mass lesions and improves characterization of congenital malformations. MR is also very effective for evaluating chronic subdural hematomas [1-4] . Despite the successes of MR, CT has remained the primary imaging method in acute head trauma because of its sensitivity in detecting acute intracranial hemorrhage and its rapid scanning capability [5-8]. MR has not made much impact in this area primarily for three reasons: first , acute hemorrhage may be isointense and difficult to see on the MR images; second, these patients require various support equipment, much of which cannot be taken into the magnet room; and third , MR imaging requires more time, and time is a critical factor in patients with intracranial hemorrhage.
Nevertheless, head-injury studies at the University of California, San Diego, Medical Center and at other institutions have documented significant neurologic and behavioral residuals in head-injury patients who had entirely normal CT scans [9-11]. Obviously, more sophisticated imaging of the brain is required to study the neuroanatomic correlates of brain abnormalities in these patients. We conducted a comparative study to determine the sensitivity and accuracy of CT and MR for defining brain contusions in the subacute and chronic stages after injury.
Subjects and Methods
Study subjects came from an unselected group of head-injured patients who were being followed by one of us because of residual neurologic or behavioral problems. Only patients who were clinically stable and who also had had CT scans were included in the study . Clinical material included 17 patients , nine males and eight females, 2-51 years old. Many of the subjects were pediatric patients because our referral source is a pediatric neurosurgeon. High-resolution CT scans were obtained by using a 10-mm slice thickness and contiguous

270 HESSELINK ET AL. AJNR:9 , March/April 1988
TABLE 1: Summary of 17 Patients with Brain Contusions Studied with MR Imaging and CT
Case Age Gender Location No. of Size MR Scan CT Scan No. Contusions (cm2).
Time After Signal Intensity Time After Density Injury
T2 T1 Injury
14 M Temporal 5 8 days j ! 1 day ! Thalamus 0.3 j ! NS Corpus callosum 2 j ! NS
Follow-up: Follow-up: 13 days j ! 2 days 1! 31 days NC NC
2 2 F Temporal 4 2-5 66 days j il 1 & 4 days ! Frontal 2 7, 10 j il ! b Parietal 3 3, 3,6 j il ! (1") Occipital 2 3, 4 j it ! (1 b) Basal ganglia 4 0.2-1 .5 j 1j, 3! ! (2b) Thalamus 2 1.5,2.5 j ! ! (1 b) Midbrain 2 0.6,1 j ! !
Follow-up: 13 daysc 15il ,4! 18 days NC 25 days 12it,7! 32 days 8il,11! 39 days ! 77 days NC
3 25 M Temporal 1 4 6 months j ! 1 day il Frontal 2 7, 10 j ! it Hypothalamus 1 0.5 j ! NS
Follow-up: 5 days 3it
25 days 3! 45 days NC
4 14 M Frontal 0.7 2 years il ! 1 day it Thalamus 0.2 ! Iso il Cerebellum 0.5 j Iso NS
Follow-up: 7 days 2! 6 months !
5 19 M Temporal 2 4, 1 7 months j !. iso 1 & 3 days Ns, jb Frontal 1 0.5 ! Iso il
b
Parietal 2 0.3, 0.7 NS, j NS, iso j (1 b) Occipital 1 0.5 ! Iso jb
Follow-up: 8 days 1 il, 2!, 2 iso
10 days 2!,3isO 6 26 M Temporal 3 0.5 , 2.5 , 3 6 days j j! 1 day NS
Frontal 1 1.5 j i! il Parietal 1 4 j il it Putamen 1 0.4 NS NS j
7 51 F Temporal 1 1 21 days j j 12 days NS 8 12 M Temporal 1 0.6 10 days j i! 1 day NS
Frontal 2 1.5, 3.5 j j! i! Corpus callosum 1 2 j ! NS
Follow-up: 2 days NC
9 26 M Temporal 3 0.7, 1, 2 6 months 1j , 2! ! 1 & 2 2 NS, 1 it b days
Follow-up: 4 days NC 5 days NC
10 15 F Temporal 0.7 6 days j ! 2 days NS Corpus callosum 2.5 j ! NS
Follow-up: 23 days 3j 3!

AJNR :9, March/April 1988 MR OF BRAIN CONTUSIONS 271
TABLE 1: (Continued)
MR Scan CT Scan Case Age Gender Location No. of Size
Signal Intensity No. Contusions (cm2)a Time After Time After Injury T2 T1 Injury Density
11 18 F Temporal 2 0.2,0.4 7 months j 1, iso 1 day NS Frontal 1 1.5 j 1 it Occipital 1 3 j 1 it Putamen 1 0.2 j 1 NS
Follow-up: 3 days 11, 1 it 8 days 21
16 days NC 30 days NC
12 13 F Temporal 2 0.2 , 0.7 15 days j j 1 day NS Frontal 1 0.7 j j NS Parietal 1 1 j j j
Follow-up: 80 days 1 21. 2
iso 13 12 M Temporal 4 7 months j 1 1 day it
Frontal 1 j 1 j Follow-up:
2 days NC 3 days it
10 days 1 17 days NC
14 14 F Temporal 0.3-2 2 NS, 1j, 11,
5 51 days 4j , 11 1 1 & 2 1 it (2b) Frontal 2 0.3, 1 j , U Iso, 1 days NS Occipital 2 0.3 , 0.4 j Iso NS Basal ganglia 2 0.4-3 j, it 1, iso NS Thalamus 2 0.2, 0.2 j , it Iso, 1 U (1 b) Corpus callosum 3 1.7,2,3 2j , 1 U 1 11, 2U Internal capsule 4 0.5-3 j 21 , 2 2 NS, 21 (1 b)
iso Brainstem 3 1, 1.5,2 j 1 2 NS, 11b Cerebellum 2 0.8, 1.5 j t NS
Follow-up: 2 days 1j, 3U, 71 3 days 1j, 1U, 9t 8 days 1 U , 10t
11 days 11 1 45 days NC
15 21 F Parietal 3 10 days j t 1 day NS Occipital 4 j Iso NS Midbrain 0.2 j j j Cerebellum 1.5 j j NS
Follow-up: 4 days 1j 9 days NC
16 6 F Frontal 0.2 2 years j 1 1 & 6 NS Midbrain 1 j 1 days i1 b
Follow-up: 26 days 11 33 days NC
2.5 years NC 17 22 M Frontal 1 1 13 days U Iso 2 days NS
Thalamus 2 0.2,2 j, U j, iso NS, j Pons 1 0.5 j Iso NS Corpus callosum 1 0.5 j Iso NS
Follow-up: 5 days 1 i1 9 days 11
27 days NC
Note.-T1 = T1-weighted images; T2 = T2-weighted images; NS = contusion not seen; NC = no change; iso = isointense (MR) or isodense (CT); 1 = increased , ! = decreased, and iL = mixed signal intensity (MR) or density (CT). Under follow-up, contusions from all locations are combined for each patient
• For three or fewer contusions, the size of each contusion is given; for more than three the range is given. b The contusion was first seen on the second CT study. , Coagulopathy.

272 HESSELINK ET AL. AJNR:9, March/April 1988
Fig. 1.-Case 8: temporal and inferior frontal contusions. A, CT scan 2 days after injury shows no parenchymal abnormality. High-density streak artifacts partially obscure frontal and temporal lobes. B, Proton-density-weighted MR scan (SE 20/3000) at 10 days reveals high-signal abnormalities in right temporal and inferior frontal lobes (arrows). C, T1-weighted image (SE 20/600) shows high-signal areas within contusions, indicating hemorrhagic components (arrows) .
A B
Fig. 2.-Case 8: shear injury of corpus callosum. A, CT scan shows some blood along posterior falx. Asymmetry of lateral ventricles is from slight head tilt. Band C, Proton-density-weighted (B, SE 20/3000) and T2-weighted (C, SE 70/3000) images reveal large contusion in splenium of corpus callosum
(arrows) . Thin subdural hematoma is present in right occipital region, and subdural effusions are noted over both frontal lobes.
sectioning. In many cases, serial scans within the first 3 weeks of injury were available for review. MR scans were obtained 6 days to 2 years after initial injury.
The technical parameters for MR included a field strength of 1.5 T, slice thickness of 5 mm with a 2.5-mm interslice gap, 256 x 256 matrix, 20-cm field of view, and two excitations. Axial scans were obtained in all patients , supplemented with sagittal or coronal views
in selected cases. Pulse sequences included a T2-weighted spinecho sequence with a repetition time (TR) of 2000-3000 msec and asymmetric echoes (TEs) of 20-25 and 70 msec, and a T1-weighted spin-echo sequence with TR = 600 msec and n ' = 20-25 msec.
The CT and MR scans were evaluated for thl number, location, and size of brain contusions. Also noted were the ,ignal and density characteristics on MR and CT, respectively. Finally, the MR data
AJNR:9, March/April 1988 MR OF BRAIN CONTUSIONS 273
were studied further to determine the spectrum of findings in cerebral contusions during the various stages of evolution . Other intracranial abnormalities, such as epidural and subdural hematomas, were not included because the study was designed specifically for contusions and because many of the extracerebral hematomas were observed by CT during the acute phase of head injury and were surgically drained before MR was performed.
Results
The imaging studies revealed 98 brain contusions in 17 patients (Table 1). The number of contusions ranged from as many as 25 in one patient (case 14) to as few as one temporal lobe contusion in case 7. The size of the contusions ranged from 0.2 to 10 cm2
.
The contusions had variable appearances on MR and CT scans. On T2-weighted images, 83 contusions were of increased signal intensity, 6 were of low, and seven were of mixed signal intensity. On T1-weighted images, 50 were low signal , nine increased signal , 19 mixed signal intensity, and 18 isointense. On CT, 25 of the contusions were low density, 10 high density, and 20 mixed density. As indicated in Table
TABLE 2: Locations of Contusions in Patients Studied by MR Imaging and CT
Location
Temporal lobe Frontal lobe Parietal lobe Occipital lobe Basal ganglia Thalamus/hypothalamus Corpus callosum Internal capsule Brainstem Cerebellum
Total
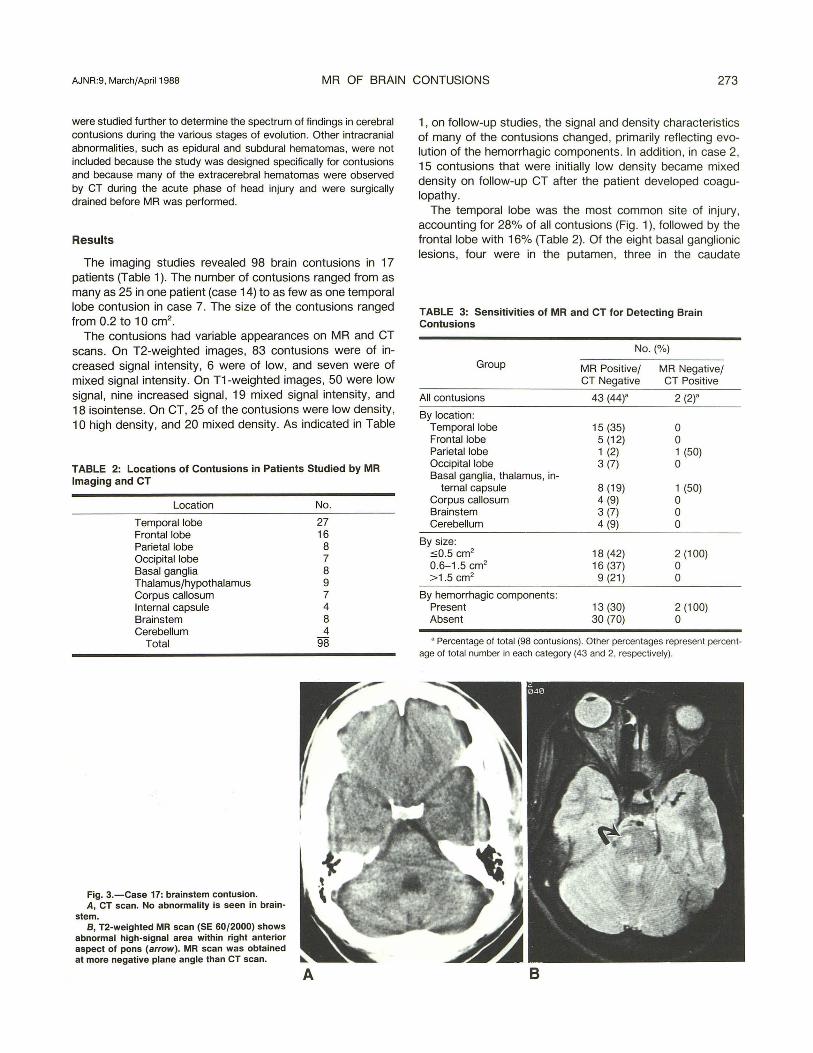
Fig. 3.-Case 17: brainstem contusion. A, CT scan. No abnormality is seen in brain
stem. B, T2-weighted MR scan (SE 60/2000) shows
abnormal high-signal area within right anterior aspect of pons (arrow) . MR scan was obtained at more negat ive plane angle than CT scan.
No.
27 16
8 7 8 9 7 4 8 4
98
1, on follow-up studies, the signal and density characteristics of many of the contusions changed , primarily reflecting evolution of the hemorrhagic components. In addition, in case 2, 15 contusions that were initially low density became mixed density on follow-up CT after the patient developed coagulopathy.
The temporal lobe was the most common site of injury , accounting for 28% of all contusions (Fig. 1), followed by the frontal lobe with 16% (Table 2). Of the eight basal ganglionic lesions, four were in the putamen, three in the caudate
TABLE 3: Sensitivit ies of MR and CT for Detecting Brain Contusions
No. (%)
Group MR Positive/ MR Negative/ CT Negative CT Positive
All contusions 43 (44)' 2 (2)'
By location: Temporal lobe 15 (35) 0 Frontal lobe 5 (1 2) 0 Parietal lobe 1 (2) 1 (50) OCCipital lobe 3 (7) 0 Basal ganglia, thalamus, in-
ternal capsule 8 (19) 1 (50) Corpus callosum 4 (9) 0 Brainstem 3 (7) 0 Cerebellum 4 (9) 0
By size: ::::0.5 cm2 18 (42) 2 (100) 0.6-1 .5 cm2 16 (37) 0 > 1.5 cm2 9 (21) 0
By hemorrhagic components: Present 13 (30) 2 (100) Absent 30 (70) 0
• Percentage of total (98 contusions). Other percentages represent percentage of total number in each category (43 and 2, respectively).

274 HESSELINK ET AL. AJNR:9, March/April 1988
A B Fig. 4.-Case 17: hemorrhagic thalamic contusion. A, CT scan 2 days after injury reveals focus of hemorrhage in left thalamus with some surrounding low density. 8, T1-weighted image (SE 25/600) 13 days after injury. Central area is of high signal because of T1 shortening from paramagnetic effect of
methemoglobin. C, T2-weighted image (SE 60/2000) reveals three components to lesion: (1) high-signal center represents hematoma cavity similar to that in 8 , (2)
ringlike area of low signal likely is from early deposition of hemosiderin about perimeter of hematoma, and (3) higher signal outside ring has poorly defined margins and represents some associated brain edema. Also noted is small contusion in splenium of corpus callosum (arrow) not seen in A or 8.
A B c Fig. 5.-Case 12: hemorrhagic contusion. A, T2-weighted image (SE 70/2000) 15 days after head injury shows small cortical contusion (arrow) . 8, Corresponding T1-weighted image (SE 25/600) reveals components with short T1 (arrow), indicating methemoglobin within hemorrhagic contusions. C, Follow-up T2-weighted scan (SE 70/2000) 80 days after injury. Contusion is predominantly of low signal intensity (arrow) , consistent with hemosiderin.
nucleus, and one in the globus pallidus. The one patient with a hypothalamic lesion developed diabetes insipidus. Seven contusions were found in the corpus callosum, including four in the splenium, two in the posterior body, and one in the
anterior body (Fig . 2). The midbrain was the most common site in the brainstem, accounting for six of eight contusions. Only two were located in the pons (Fig . 3) and none in the medulla.

AJNR:9. March/April 1988 MR OF BRAIN CONTUSIONS 275
Fig. 6.-Case 4: hemorrhagic contusion of thalamus.
A, CT scan 1 day after head injury shows hemorrhagic contusion in left thalamus (arrow).
B, Scan 6 months later is normal with no evidence of calcification or hemorrhage.
C, T2-weighted MR scan (SE 60/1500) 2 years after injury reveals low signal intensity (arrow) at site of previous hemorrhage, reflecting T2 shortening, presumably secondary to deposition of hemosiderin.
D, Same area is isointense on T1-weighted image (SE 25/600).
A
Forty-three contusions (44%) were missed by CT compared with only two (2%) by MR (Table 3). The temporal lobe was the most common site of CT misses (Fig. 1). Correlation of these data with Table 2 also reveals that all four cerebellar contusions were missed by CT. It is not surprising that more false negatives occurred with smaller contusions, where partial-volume effects might be a factor. CT was more likely to miss bland contusions (70%) than hemorrhagic ones (30%). The contusions missed by MR were 0.3 and 0.4 cm 2 in size and contained hemorrhagic components that were detected by CT on the first day after trauma.
Hemorrhagic components were noted by imaging studies in 56 (57%) of the contusions (Table 1). Twenty-seven (48%) of the hemorrhagic components were seen by both MR and
B
CT, 13 (23%) by MR only, and 16 (29%) by CT only. In the patients who had follow-up CT scans, the contusions were noted to become isodense between 3 and 8 days, excluding case 2 with complicating coagulopathy. Methemoglobin. detected as increased signal on T1 -weighted images, as present in 28 contusions scanned between 6 da and 2 months after injury (Figs. 1, 4, and 5). Hemosiderin was observed as low signal intensity on T2- eigh ed ima es in 15 contusions (Figs. 4-6). Hemosiderin as een a earl a 13 days and as late as 2 years after e In inj _ 0 e esian scanned at 13 days was captured in a e with the central methemoglo in urrou (Fig. 4). In case 12 four hRfJlnrrlul,n~ signal on both T2- an T1-

276 HESSELINK ET AL. AJNR:9, March/April 1988
follow-up MR scan at 80 days, all four contusions became low signal on T2-weighted images, indicating conversion of the methemoglobin to hemosiderin (Fig . 5).
Discussion
Traumatic injury to the brain is determined to a great extent by the physical properties of the brain and skull. The brain is extremely incompressible and has very little rigidity . Its volume can be decreased only by exerting great pressure. On the other hand, relatively little effort is required to distort the shape of the brain. The brain substance is of relatively uniform density. Slight differences exist between gray and white matter and between the CSF of the ventricles and brain parenchyma. The skull , on the other hand, has great rigidity [12].
The shape of the skull and brain are important in determining the location of brain contusions. Cortical injury is more likely adjacent to roughened edges of the inner table of the skull along the floor of the anterior cranial fossa, sphenoid wings, and petrous ridges. Tissue disruption and cell injury are associated with release of vasoactive substances and other byproducts. Subsequent increase in vascular permeability to serum proteins results in a progressive increase in tissue water content. Over several days, edema fluid spreads within the white matter. More serious injuries may be associated with vascular disruption and hemorrhage into contusions [12-14].
Rotational forces associated with severe head injuries produce shear stresses on the brain parenchyma. Since the brain lacks structural rigidity, when the skull is rapidly rotated, the brain lags behind, causing axial stretching, separation, and disruption of nerve fiber tracts [12, 15]. Shear injuries commonly occur at junctions between gray and white matter but are also found in the deeper white matter of the centrum semiovale, corpus callosum, internal capsule, basal ganglia, brainstem, and cerebellum [16] .
The superior sensitivity of MR in detecting subacute and chronic brain contusions in our series is not surprising (Table 3). Increased water in the form of edema fluid and associated hemorrhagic components makes contusions readily visible on T2-weighted images. T2-weighted images were more sensitive than T1-weighted images, whether or not hemorrhage was present. Eighteen contusions were isotense on T1-weighted images. MR was particularly helpful in identifying contusions in the inferior frontal and temporal regions (Fig. 1). These areas are difficult to evaluate on CT because of streaking artifacts from bone at the base of the skull. Similar results were reported by Zimmerman et al. [17] in a comparative study of MR and CT for evaluating head injury. Although both MR and CT showed acute hemorrhagic contusions, they found MR to be far superior to CT in the detection and characterization of shear injuries and hemorrhagic and nonhemorrhagic contusions during the subacute and chronic stages .
Imaging brainstem contusions is also a problem for CT because interpetrous artifacts often obscure the anatomy in
the posterior fossa (Fig. 3). Deceleration forces associated with impact to the head can result in momentary displacement of the brainstem away from its normal anatomic position. This distortion of anatomy may produce shear injury, tearing of penetrating arteries or veins, and compression of the brainstem against the sharp edges of the tentorium or surfaces of the clivus and petrous bones [12, 15]. Since the brainstem has a rather dense population of cranial nerve nuclei and important fiber tracts, a small lesion can result in profound neurologic deficits. Obviously, an accurate assessment of injuries to the brainstem is critical for an accurate prediction of the patient's recovery or morbidity. Our data confirm that MR is clearly the imaging procedure to use for assessing brainstem injury.
At least 21 of the brain contusions seen in our series can be accurately classified as white-matter shear injuries, including those in the corpus callosum (Figs. 2 and 4), internal capsule, and hemispheric white matter. In addition, most of the contusions of the brainstem, basal ganglia, and thalamus fit into this category. The brainstem contains many major fiber tracts, such as the cerebellar peduncles and the corticospinal tracts. Multiple fiber tracts also connect the basal ganglia and thalamus with each other, with various brainstem nuclei, and with the cerebral cortex. In a pathologic study, Adams et al. [15] noted that many midbrain contusions were located in the region of the superior cerebellar peduncle.
In a clinicopathologic study of white-matter shear injuries, Zimmerman et al. [8] found that CT scans often showed generalized cerebral swelling, subarachnoid hemorrhage, eccentric hemorrhage in the corpus callosum, and occasionally focal blood adjacent to the third ventricle and in the hemispheric white matter. Identification of focal lesions on CT was difficult on the basis of low density alone and was primarily dependent on detecting focal hemorrhage. Zimmerman et al. also noted that CT failed to demonstrate more rostral shear injuries in the internal capsule and brainstem that were later found at autopsy. In a later comparative study of MR and CT of head injury by the same group [17], seven of seven shear injuries were seen by MR; all were missed by CT.
Contrast-enhanced CT has not proved to be very useful for assessing head injuries. In a study of 70 patients with acute head injury, Mauser et al. [18] found that contrast-enhanced scans provided no information not provided by plain CT in 94% of cases, and they concluded that IV contrast material is not needed.
In our series, hemorrhagic components were documented by CT or MR in over one-half of the brain contusions. Although CT was slightly more sensitive than MR for detecting hemorrhage, 13 hemorrhagic contusions were missed by CT, compared with only two misses by MR (Table 3). Even though MR missed 16 hemorrhagic components, 14 of these contusions were still detected as high-signal foci on T2-weighted images.
CT is considered to be very sensitive for the detection of brain hemorrhage. Nevertheless, the sensitivity will depend on the temporal relationship between the scan and the onset of hemorrhage. The increased density of hemorrhage on CT is transient and will persist for only a few days or weeks, the

AJNR :9 , March/April 1988 MR OF 8RAIN CONTUSIONS 277
Fig. 7.-Posttraumatic encephalomalacia in young girl who had moderately severe head trauma 2 years previously. Axial proton-densityweighted (A, SE 30/2000) and sagittal T1-weighted (B, SE 25/600) MR scans show cystic degeneration of right anterior temporal lobe in area of temporal lobe contusion. The patient also had an orbital implant and prosthesis.
Fig. B.-Iatrogenic brain injury. A, T2-weighted axial MR image (SE 60/1500)
shows small adjacent areas of low and high signal within thalamus (long arrow). Another lowsignal area is noted in left globus pallidus (short arrow). Areas of low intensity probably reflect focal deposition of hemosiderin; area of high intensity is probably an area of gliosis.
B, Sagittal section (SE 25/600) reveals linear character of these abnormalities (arrows), which resulted from multiple passes for insertion of ventriculostomy catheter.
A
length of time depending on the size of the hematoma (Fig. 6) . Initially, hemorrhagic contusions will be high density, but, with time, they progress through an isodense stage and eventually become low density and indistinguishable from non hemorrhagic contusions [19]. It follows that CT is very sensitive for detecting acute hemorrhage into contusions, but relatively insensitive in the subacute and chronic stages. Also, in the acute stage, a small amount of hemorrhage into a contusion could possibly make it appear isointense on CT, thereby masking the underlying contusion.
The MR appearance of hemorrhagic contusions is very dynamic, changing over time as the internal chemistry of the
8
hematoma changes. In acute hematomas, deoxyhemoglobin results in shortening of T2 and low signal on T2-weighted images [20]. After 3-4 days, the deoxyhemoglobin is converted to methemoglobin by an oxidative reaction , which results primarily in T1 shortening and high signal on T1-weighted images [21 , 22] (Figs. 1 C, 48 , and 58). With further degradation of the methemoglobin, hemosiderin is formed and taken up by macrophages around the perimeter of the hematoma. The primary effect of hemosiderin is shorten ing of T2 and low signal on T2-weighted images [20] . We have observed this phenomenon as early as 13 days after injury and as late as 2 years after the initial hemorrhage (Figs. 4C,

278 HESSELINK ET AL. AJNR:9, March/April 1988
5C, and 6C). Hemorrhages at this chronic stage may appear isointense on T1-weighted images. Since the evolution of magnetic properties within a hematoma is so dynamic, the signal intensities on T1- and T2-weighted images provide clues about the approximate age of hemorrhagic contusions. A hemorrhagic contusion imaged during anyone of the transition periods may have a target appearance with multiple layers of different signal intensities (Fig. 4C).
On the other hand, the changes of a nonhemorrhagic contusion are less dramatic. During the initial phases, one first observes focal areas of T1 and T2 prolongation from brain edema and increased water content in the lesion. In larger contusions, mass effect on adjacent brain structures is often associated with these changes. The brain edema increases over the first few days and then slowly decreases over time. The end result of non hemorrhagic contusions is areas of encephalomalacia with varying degrees of sulcal prominence and focal ventricular dilatation (Fig . 7).
Another factor to remember in the interpretation of MR images of cerebral contusions is that many acutely headinjured patients require neurosurgical intervention in the form of a temporary ventriculostomy catheter or some type of ventricular shunt for more long-term decompression of the ventricles. These interventional procedures injure the brain and may also have hemorrhagic components (Fig. 8). Multiplanar imaging with MR often helps define the linear character of these abnormalities to help distinguish them from contusions related to the initial head injury.
In conclusion, in subacute and chronic stages of head injuries, MR is more sensitive than CT for detecting brain contusions. T2-weighted spin-echo images are best for demonstrating the abnormalities. CT is better than MR for showing hemorrhagic components during the acute phase of trauma. Hemorrhages are displayed on MR as high signal intensity on T1 -weighted images and as either low or high signal on T2-weighted images, depending on the age of the hemorrhage. The approximate age of hemorrhagic contusions is often suggested by the signal characteristics and appearance on T1 - and T2-weighted images. The improved detection and anatomic localization of brain contusions by MR provides new opportunities to correlate brain structure with function , and should also allow more accurate assessment of brain injuries and prediction of outcome. CT will likely retain an important role in evaluating acute head injuries to exclude life-threatening intracranial hemorrhage or cerebral swelling. Definition of the role of MR in evaluating acute head trauma requires further investigation.
REFERENCES 1. Young IR , Bydder GM, Hall AS, et al. Extracerebral collections by NMR
imaging. AJNR 1983;4:833-834 2. Sipponen JT, Sipponen RE, Sivula AS. Chronic subdural hematoma dem
onstration by magnetic resonance. Radiology 1984;150 :79-85 3. Moon KL Jr, Brant-Zawadzki M, Pitts LH , et al. Nuclear magnetic reso
nance imaging of CT-isodense subdural hematomas. AJNR 1984;5 :319-322
4. Han JS, Kaufman B, Alfidi RJ. Head trauma evaluation by magnetic resonance and computed tomography: a comparison. Radiology 1984;150:71-77
5. Dublin AB, French BN, Rennick JM. Computed tomography in head trauma. Radiology 1977;122: 365-369
6. Forbes GS, Sheedy PF II , Piepgras DG, Houser OW. Computed tomography in the evaluation of subdurdal hematomas. Radiology 1978;126 : 143-148
7. Zimmerman RA, Bilaniuk LT, Gennarelli T, Bruce 0 , Dolinskas C, Uzzell B. Cranial computed tomography in diagnosis and management of acute head trauma. AJR 1978;131 :27-34
8. Zimmerman RA, Bilaniuk L T, Gennarelli T . Computed tomography of shearing injuries of cerebral white matter. Radiology 1978;127:393-396
9. Kalsbeek WD, McLaurin RL, Harris BSH, Miller JD. The national head and spinal cord injury survey: major findings. J Neurosurg 1980;53 :S19-S31.
10. Young B, Rapp RP, Norton JA, Haack 0, Tibbs PA, Bean JR. Early prediction of outcome in head-injured patients. J Neurosurg 1981;54:300-303
11. Clifton GL, Gross RG, Makela ME, Miner ME, Handel S, Sadhu V. Neurological course and correlated computerized tomography findings after severe closed head injury. J Neurosurg 1980;52 :611-624
12. Holbourn AHS. Mechanisms of head injuries. Lancet 1943;2 :438-441 13. Tornheim RA. Traumatic edema in head injury. In: Becker DP, Povlishock
JT, eds. Central nervous system trauma: status report . Bethesda, MD: NINCDS, 1985 :431-442
14. Jennett B, Teasdale G. Dynamic pathology in management of head injuries . Philadelphia: Davis, 1981 :45-75
15. Adams JH, Mitchell DE, Graham 01, Doyle D. Diffuse brain damage of immediate impact type: its relationship to primary brainstem damage in head injury. Brain 1977;100:489-502
16. Peerless SJ , Rewcastle NB. Shear injuries of the brain. Can Med Assoc J 1966;96 : 577-582
17. Zimmerman RA, Bilaniuk L T, Hackney DB, Goldberg HI , Grossman RI. Head injury: early results of comparing CT and high-field MR. AJNR 1986;7 :757-764
18. Mauser HW, vanNieuwenhuizen 0 , Veiga-Pires JA. Is contrast-enhanced CT indicated in acute head injury? Neuroradiology 1984;26:31-32
19. Zimmerman RA, Bilaniuk L T, Dolinskas C, Gennarelli T , Bruce 0 , Uzzell B. Computed tomography of acute intracerebral hemorrhagic contusion. Comput Tomogr 1977;1 :271-288
20. Gomori JM, Grossman RI , Goldberg HI , Zimmerman RA, Bilaniuk LT. Intracranial hematomas: imaging by high-field MR. Radiology 1985; 157 :87-93
21 . Bradley WG Jr, Schmidt PG . Effect of methemoglobin formation on the MR appearance of subarachnoid hemorrhage. Radiology 1985;156 :99-103
22. Sipponen JT, Sipponen RE , Tanttu JI , et al. Intracranial hematomas studied by MR imaging at 0.17 and 0.02 T. J Comput Assist Tomogr 1985;9 :698-704