Embed Size (px)
Citation preview

"Megacity on a Human Scale“, Moscow Urban Forum,December 4–5 2012
Moscow: Lookingto the Future - Mobilityto the Future - Mobility
Pierre LACONTEPresident, Foundation for the Urban Environment,
Past-president, International Society of City and Regional Planners.

Competitive distance of the highspeed train: 900 km
High speed rail as planned today. Parallel HSR track is under construction.

high speed railtoday station
SHEREMETYEVO
Leningradsky
Kursky
high speed line (speed up to 300km/h)
airport express
Leningradsky and Kursky station
airport express station linked to M5
metro 5 ring
today stationconnections
DOMODODEVO
VNUKOVO

Competitive distance of the highspeed train: 900 km
High speed railtomorrow.
Moscow will be thenstrategically connectedwith Europe (Helsinkiin the north, Berlin inthe west). It also willserve the mainregional capitals closeregional capitals closeto Moscow (Proposalby Secchi-Vigano).

Komsomol’skaya
SHEREMETYEVO
Studencheskaya
high speed railtomorrow – links withurban rail.The line from Berlin merges withthe one from Kiev before enteringthe city, then using the southrailway ring to reach the north-south bypass that crosses the city.Two new passing stations couldimprove the north south/east-west passage : one station in thesouth-west (Studencheskaya close
high speed line (speed up to 300km/h)
airport express
New High speed station
airport express station linked to M5
metro 5 ringDOMODODEVO
VNUKOVO
Studencheskaya
south-west (Studencheskaya closeto the CBD Moskva City), thesecond in the center of the city atKomsomolskaya.
(proposal by Secchi- Vigano)

Sergiev PosadDmitrov
Klin
Voskhod
Kubinka
Orekhovo-Zuevo
Kurovskoe
Dedovsk
Kryukovo
Aprelevka
GolitsynoOdintsovo
Ramensko
Korenevo
Kupavna
Pushkino
Lobnja
Velikije Luki
Tver
Vladimir
Jaroslavl
Dubna
Regional railexists but isunderused.
Improvement ofexisting rails forregional
Intercity line
Intercity station (one stop every 30 Km)
Naro-Fominsk
Kubinka
CheckhovZhilevo
Voskresensk
AprelevkaPodolsk Domodode
vo
Ramenskoye
Brjansk
Smolensk
Tambov
RjazanTula
Murom
regionalpassengerintegrationrequires anadaptivereuse ofindustrial rail andrailway ring, andgood frequencies
(proposal Secchi-
Vigano)Mosow mkad

Moscow stations should notbe end-stations. Trains couldconnect different urbanareas without transfersthrough the city center.New interchange stationscould connect the ringstations with the radialmetro going out of Moscow.(see hereafter Moscow
SHEREMETYEVO
Regional rail in connection
with Metro, one of the best
in the world.
(see hereafter Moscowmaster plan page 9)
regional railway system(one stop every 3 km)
new transit station alongthe new passenger railway ring
old industrial railway ringReused for passengers
metro 5 ring

M8
A new highway ring into the city is plannedbut only 10 out of 70 km have been built (ata cost of 2bn US $ and doubts are voicedabout its necessity .
Existing road system with MKAD ring road.
Highways (planned)
M1
M9 M7
M5
M2
Existing situation Moscow city masterplan

How to choose transport investments?What criteria?
• 1 Space savings
• 2 Health savings
• 3 Saving the liveable city

Space savingsIf one takes the spaceconsumption by apedestrian as thebenchmark, the car takesup about 18 times morespace than a pedestrian, asit moves, but it requiresparking for the time it doesnot move, i.e. for some 90% of its life cycle. Spaceconsumption therefore hasan area x time dimension.an area x time dimension.The space consumptiongenerated by traffic on newhighways is nearly 100xhigher than by railtransport. The UK SACTRAReport (1995) has shownthat additional roadsgenerate more additionaltraffic than their additionalcapacity.

Health savings
The cost of additional healthcare costs entailed by physical inactivity(less than 30’ walking/day) has been estimated by the UK NationalCentre for Chronic Disease Prevention.

Saving the liveable city
Mobility at human scalemakes Cities more liveableand enjoyable – poster bymakes Cities more liveableand enjoyable – poster byFriedensreichHundertwasser for UITP(1995).

Moscow Transport Hub Strategy
September 2012
Moscow City Government

1
SOURCE: Rosstat, investment programs of the Moscow region "Development of the Transport and Logistics System in the Moscow Region for 2011-2015",
"The Roads in the Moscow Region for 2012-2015"; Budget of the Moscow region for 2012; State program of the City of Moscow "Development of
the Transport System for 2012-2016"
Population
People, mn
Area
Sq. km.
Road length
Km
Railroad length
Km
Registered cars per 1,000 people Units, 2010
Number of long-distance transport stations (railroad and subway) Stations
7.2 11.6
46,000
1,900 (~2,600
with annexed areas)
31,000
3,7001
3952,700
279 293
506279
Moscow Moscow region
Moscow and Moscow region are a single integrated
entity in terms of employment, transport
infrastructure, and passenger traffic
1 Without annexed areas
Moscow
region
Moscow
Moscow Transport Hub (MTH) is the largest transport hub
in Russia

More than 14 million trips by public transport
are made within MTH every day
2
Surface transit1
Subway
Passenger railroad
SOURCE: Department of Transport and Road Infrastructure Development
Number of passengers carried in the MTH
People, mn, 2011
1 Buses, trolley-buses and tramways. Volumes of carriage by SUE "Mosgortrans" and commercial carriers in the City of Moscow (estimated)
6,5
6,0
14.0
1.5
Total 5.1
2.2
0.5
2.4
Daily average, mn In 2011, bn
6.5
6.0

3
Actual traffic People, thsd.
Exceeding the traffic carrying capacity Percent
Traffic carrying capacity2 People, thsd.
Actual traffic and traffic carrying capacity by type of transport in 2011 (when moving towards the city center, weekdays, 8-9 am1)
Subway average load factor People/m2 during rush hour on most critical segments
24
42
22
20
32
22
Almost all types of Moscow transport are heavily
overloaded during morning rush hour
1 With entering the Third Transport Ring; 2 With current route network and time schedule; 3 On the basis of the standard: 4.5 passengers per 1 sq.m of carriage floor area; 4 On the basis of
the standard passenger capacity of the relevant transport vehicles; 5 On the basis of the standard : ~1,200 passengers in the suburban electrical train; within current scheduling of the
suburban trains
SOURCE: Yandex; Mosgortrans; Moscow subway; State Road Traffic Safety Inspection; Center of Traffic Management; field observations;
transport strategies of cities; Department of Transport and Road Infrastructure Development
4.0
4.2
5.0
5.6
7.0
29%
Paris
New York
London
Moscow, 2011
Tokyo
1,195
165
55
840
1,060
135 95
Surface transit 454
Subway 7003
Public transport, total 870
Cars
Cars and public transport,
total 965
Suburban railroad 1255
ESTIMATE

Moscow has set ambitious goals to improve the transport
situation and reduce the average trip time during rush hour
to 50 minutes by 2025
Decrease car usage
Thsd. cars,
% of all trips made during morning rush hour
Increase capacity
of public transport
Thsd. passengers during rush hour
Reduce travel time by public transport
during rush hour
Min.
8%
-30-35 thsd.
12%
+360
870 1,230
5067
-25%
2025 2011
SOURCE: Department of Transport and Road Infrastructure Development
Sub-targets for all modes of transport
18%
-20-25 thsd.
26%
325 +90 235
7080
-13%
2025 2011
Moscow region1 Moscow
4
1 Calculated by the Department of Transport and Road Infrastructure Development of Moscow
2 By all types of transport, including personal automotive transport

5
125
167
202
213
204
122
119
76
102
West
South-West
94
108
145
155
South 132
183
South-East 130
195
East 163
184
74
96
North-East 86
110
North 77
107
North-West
(Leningr. hwy.) 68
69
North-West
(Volokol. hwy.)
Traffic carrying capacity
into the city center from 8:00
to 9:00, 2011
People, thsd
Passenger traffic
into the city center from 8:00
to 9:00, 2011
People, thsd
Passenger traffic
into the city center from 8:00
to 9:00, 2025
People, thsd
2
3
4
5
6
7
8
9
2
3 4
5
6
7
8
9
1
10
For detailed analysis, Moscow was divided
into 10 geographic segments
Expected passenger traffic during rush hour in 2025 was compared
with current traffic capacity (by geographic segment)
Overload level of the
transport system is
extremely high and
uneven by
geographic
segments
1
SOURCE: Moscow subway; Mosgortrans; the sensors of the Center of Traffic Management; Yandex; team analysis
The transport strategy was developed considering the
situation in different geographic segments of the city

The strategy comprises initiatives encouraging the use of
public transport
SOURCE: Department of Transport and Road Infrastructure Development 6
Surface transit
Focus areas
Subway
Tariffs and tickets
Development of transport infrastructure
Parking
Suburban rail
Taxi
Freight logistics
Cycling, pedestrians, air and water transport
Intelligent transportation system (ITS)
and traffic flow model
Major initiatives
▪ 145 km of new lines, 67 new stations
▪ Lines of the Light Rail Transport (LRT) and the Bus Rapid Transit (BRT)
▪ Transport interchange hubs and “park and ride” facilities
▪ Combination tickets for all modes of transport
▪ Expansion of the ticket sales network
▪ Paid parking in the city center (with special conditions for handicapped
people, local residents, and property owners)
▪ 226 km of additional main lines
▪ Special lanes for buses and other public transport vehicles
▪ Optimization of the route network and management system
▪ Legalization of taxi market and clear rules for how it works ▪ Short-distance traffic
▪ Limitations on freight transport traffic
▪ Optimization of logistics-hubs arrangements
▪ Development of the cycling and pedestrian areas, as well as water and
air transport
▪ Intelligent transportation system
▪ Traffic-flow model

Construction of additional subway lines will reduce the
level of overload by 2020
Subway in 2020
by 2020
252 stations
(+36%)
450 km of lines
(+47%)
2012
306 km of lines
185 stations
New stations
88% of all trips during
rush hour
7
92% of all trips during
rush hour
SOURCE: Department of Transport and Road Infrastructure Development
6.5 mln passengers
daily

Development of suburban rail will lead to increased
capacity, frequency and passenger flow
8
by 2020
Existing lines of suburban railroad
Suburban railroad lines planned for
commissioning in 2013-2020
according to the Plan by 2020
Number of existing railroad lines
Number of additional lines according to
stage 1 of the Suburban Railroads
Development Program by 2020
2012 г.
Plan by 2018 X
X
Belorussian
direction
Paveletsk
direction
Kursk
direction
Yaroslavl direction
Leningrad
direction
Kiyev
direction
Mytishchi
Zheleznodorozhnaya
Domodedovo Podolsk
Sheremetyevskaya
Solnechnaya
Odintsovo
Kazan
direction
Savyolovo
direction
Gorky
direction
Аэропорт
Airport
Povarovo
Kryukovo
Riga
direction
Nakhabino
2012
Plan by 2016 4
3
2012
Plan by 2016 5
4
2012
Plan by 2016 6
4
2012
Plan by 2016 4
3 2012
Plan by 2018 4
2
2012
Plan by 2020+ 4
2
2012
Plan by 2014 4
2
2012
After 2020 4
2
2012
Plan by 2015 4
3
2012
Plan by 2020+ 4
2
2012
532 million passengers
per year (plan)
Average interval:
8 minutes
+226 km of additional main
lines
846 million passengers per
year (+59%)
Average interval:
3 minutes (-62.5%)
Moscow
Railway
Smaller
Ring
SOURCE: Department of Transport and Road Infrastructure Development

9
Passenger traffic on the Moscow Ring Railway will
total 285 million passengers per year
285 million passengers
per year
by 2020
Possibility to establish
transportation between
airports
2012
No passenger traffic
54 km of lines are not
electrified
Industrial area that is not
developed
Full integration with
subway and suburban
railroad infrastructure
SOURCE: Research and Design Institute of the General Plan of Moscow; feasibility study of the Moscow Ring Railway; Moscow subway
Connections with suburban rail Connections with subway

10
Reserving additional lanes for public transport along
major routes will increase the average speed of surface
transit
Volokolamskoye h.
Leningradskoye h.
Dmitrovskoye h.
Altufyevskoye h.
Mira Avenue Shcholkovskoye h.
Yaroslavskoye h.
Entuziastov h.
Ryazanskiy Avenue
Volgogradskiy Avenue
Lublinskaya str.
Kashirskoye h.
Andropova Avenue
Lipetskaya str.
Kiyevskoye h.
Kutuzovskiy Avenue
Zvenigorodskoye h.
Aminyevskoye h.
Balaklavskiy Avenue
+ 20% in speed
Impact
+ 15% in passengers
Schedule based on
even cycles (interval
during rush hour
40 sec. to 3 min.)
Increased safety and
availability
Existing lanes
Planned lanes
SOURCE: Department of Transport and Road Infrastructure Development

11
New public transport operator contracting model is
focused on improving service quality and reducing
travel time
▪ The city pays operators for their fixed
transportation service per route
▪ Unified standards
– Service quality
– Bus fleet
– Tickets and tariff plans for the entire surface
public transport system
▪ Regulation of tariffs for all operators
▪ Responsibility for carriage of reduced-fare
passengers on all routes
▪ Agreement with an operator is made for 5 to 7
years
▪ Increased traffic frequency of surface
transit up to
~3 minutes during rush hour
▪ Improved usability:
– Unification of service standards
– Unification of ticket and tariff systems
▪ Reduced load on street-road network
via standardized large-capacity bus fleet
▪ Private operators share of the route
network: 40%
Approved management principles Expected impact
SOURCE: Department of Transport and Road Infrastructure Development

Implementation of intermodal tickets will
improve convenience and reduce lost time for
passengers
Universal ticket
▪ 1 validation = 1 trip on 1 mode of transport
▪ Valid for all modes of transport
▪ Equal price on all modes of transport
1 trip –
90 min.
=
Combined ticket
▪ 1 validation = entire route with transfers
▪ Unlimited number of transfers between all
modes of transport for 90 minutes (1 trip by
subway only)
SOURCE: Department of Transport and Road Infrastructure Development 12

Creation of LRT and BRT routes will offer rapid transit
service to residents without access to subway
Map of prospective LRT and BRT routes Areas with poor public transport
accessibility and population
of over 500 people
Areas with poor public transport
accessibility and population
of less than 500 people Additional carrying capacity of up to
15,000 people per hour, per route
Impact
Schedule based on even cycles (interval
during rush hour 40 sec. to 2 min.)
Public transport for residents with
no access to metro
1
2
3
5
6
8
9
10
11
12
7
4 Volokolamskoye Shosse
Khimki
Yaroslavskoye Shosse,
Mytishchi
Shosse
Entuziastov
Lytkarino,
Dzerzhinsky Lipetskaya
Ulitsa
Sevastopolsky
Prospekt
Leninsky Prospekt
Michurinsky
Prospekt
Mozhaiskoye Shosse
Zvenigorodskoye
Shosse
Shchelkovskoye
Shosse
SOURCE: Department of Transport and Road Infrastructure Development 13
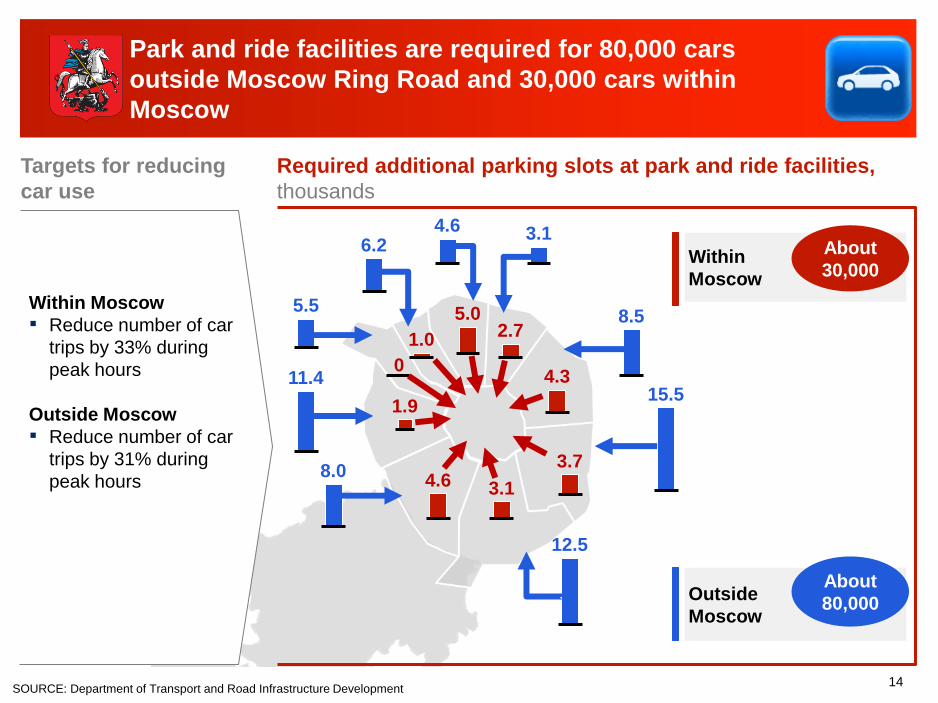
Park and ride facilities are required for 80,000 cars
outside Moscow Ring Road and 30,000 cars within
Moscow
14
3.1 4.6 6.2
5.5
11.4
8.0
12.5
15.5
8.5
1.9
1.0
5.0
4.3
3.7
3.1
2.7
0
Required additional parking slots at park and ride facilities,
thousands
Targets for reducing
car use
Within
Moscow
About
30,000
Outside
Moscow
About
80,000
4.6
Within Moscow
▪ Reduce number of car
trips by 33% during
peak hours
Outside Moscow
▪ Reduce number of car
trips by 31% during
peak hours
SOURCE: Department of Transport and Road Infrastructure Development

15
Developing legal taxi servicse will allow for reduced
waiting times, more comfortable and safer trips
▪ Fare for taxi cabs hailed on the
street determined on the spot
▪ Focus of legal taxi service on long-
distance trips
Taxi cars
and drivers
Trip tariffs
Other elements
Market supply
▪ Tariff regulation for standard-class taxi service,
focus on availability of short-distance trips
▪ Deregulated tariff for premium-class taxi service
▪ Share of the illegal segment -
about 50%
▪ 20,000 legal taxi cabs
▪ Total taxi fleet of 50,000-55,000 cars
▪ Share of the illegal segment – about 0%
▪ Two types of taxis (standard and premium class) with
different approaches to regulation
▪ No car quality or trim-level standards
▪ Low requirements for drivers to
obtain a license
▪ Standard taxi: minimum required technical
specifications and appearance
▪ Premium class – more expensive and comfortable cars
than in the standard class
▪ Requirements for taxi drivers based on taxi class
▪ No responsibility for passengers ▪ Compulsory insurance covering passengers, drivers,
and cars
▪ Special taxi stands
Target model Current situation
SOURCE: Department of Transport and Road Infrastructure Development

Introduction of paid parking facilities and
reduction in the use of illegal parking space
will increase road capacity
+35
46
89
302
Other2
Permanent
public parking
facilities
-46
Street parking
(no violation
of road regulations)1
Street parking
(violating road
regulations)
Target breakdown
159
89
54
0
Current breakdown
348
159
54
The highest priority is to reduce the number of
spaces used for parking against road regulations
Parking space breakdown in the city center
(Central Administrative District), thousand parking spaces Comments
16
1 In 2011 fully free-of-charge, by 2016 – paid parking
2 Yards, houses, cooperatives, garages, guest houses
SOURCE: GUP DGS; Department of Housing and Utilities Infrastructure; Prefecture of the Central Administrative District; Department of Transport and Road
Infrastructure Development
▪ Reduction in the total number
of parking spaces in the Central
Administrative District by
approximately 46,000 by elimi-
nating street parking that violates
road regulations
▪ Introduction of a pilot for paid
parking in November 2012
▪ Privileges for people with limited
mobility, local residents, and
property owners

Deployment of an Intelligent Transportation
System will help increase of average speed
and decrease the accident rate
Purpose
Number of items
by the end of 2013
1 Number of control points
Monitor traffic flow indicators in the streets and roads on
a real-time basis
Traffic flow
sensors 6,700
Maintain control of vehicular traffic and impose
administrative fines on drivers
Road violation-
recording
facilities
8001
17
Inform road users of the actual traffic situation while
they are underway Information
displays 300
Create control stations for adaptive and coordinated
control over traffic lights aimed at increasing street and
road network capacity
Adaptive traffic
lights 1,700
SOURCE: Department of Transport and Road Infrastructure Development
Item

18
▪ Traffic management based on a mathematical model
▪ Estimating the efficiency of the efforts to create dedicated
public transport lines
▪ Minimization of transport losses caused by restricted traffic
due to construction and repair work
Possible applications of the model Examples of decisions made
▪ Forecast of the following activities' impact on the transport
infrastructure
– Development of residential areas
– Construction of industrial and office facilities
Alignment of city
and transport
infrastructure
development plans
Assessment of
transport-related
CAPEX projects
Assessment
of transport policy
measures' efficiency
Control over
transport policy
effectiveness
▪ Prioritization of investment in transport infrastructure
development
– Roads and bridges
– Subway and surface transit lines
– Park and ride facilities
▪ Monitoring of the implemented measures' efficiency
▪ Forecast of traffic situation in the city
A traffic flow model will enable informed
decisions on transport infrastructure development
SOURCE: Department of Transport and Road Infrastructure Development