Embed Size (px)
Citation preview

Human Th1/Th2/Th17 Panel
MosaicTM ELISA
This package insert must be read in its entirety before using this product. For research use only. Not for use in diagnostic procedures.
Catalog Number MEA002
For the simultaneous quantitative determination of concentrations of multiple human T helper cell lineage markers in cell culture supernates, serum, and plasma.
MANUFACTURED AND DISTRIBUTED BY:
USA & Canada | R&D Systems, Inc. 614 McKinley Place NE, Minneapolis, MN 55413, USATEL: (800) 343-7475 (612) 379-2956 FAX: (612) 656-4400E-MAIL: [email protected]
DISTRIBUTED BY:
UK & Europe | R&D Systems Europe, Ltd.19 Barton Lane, Abingdon Science Park, Abingdon OX14 3NB, UKTEL: +44 (0)1235 529449 FAX: +44 (0)1235 533420E-MAIL: [email protected]
China | R&D Systems China Co., Ltd.24A1 Hua Min Empire Plaza, 726 West Yan An Road, Shanghai PRC 200050TEL: +86 (21) 52380373 FAX: +86 (21) 52371001E-MAIL: [email protected]
TABLE OF CONTENTS
SECTION PAGE
INTRODUCTION .....................................................................................................................................................................1PRINCIPLE OF ASSAY ............................................................................................................................................................1TECHNICAL HINTS AND LIMITATIONS...........................................................................................................................2MATERIALS PROVIDED & STORAGE CONDITIONS ...................................................................................................3OTHER SUPPLIES REQUIRED .............................................................................................................................................3SAMPLE COLLECTION & STORAGE .................................................................................................................................4SAMPLE PREPARATION........................................................................................................................................................4REAGENT PREPARATION .....................................................................................................................................................5ASSAY PROCEDURE .............................................................................................................................................................6INSTRUMENTATION ..............................................................................................................................................................7SENSITIVITY .............................................................................................................................................................................7CALIBRATION ..........................................................................................................................................................................7CALCULATION OF RESULTS ...............................................................................................................................................7TYPICAL DATA .........................................................................................................................................................................8PRECISION ............................................................................................................................................................................. 11RECOVERY.............................................................................................................................................................................. 13LINEARITY .............................................................................................................................................................................. 15SAMPLE VALUES .................................................................................................................................................................. 18SPECIFICITY ........................................................................................................................................................................... 19PLATE LAYOUT ..................................................................................................................................................................... 20
www.RnDSystems.com 1
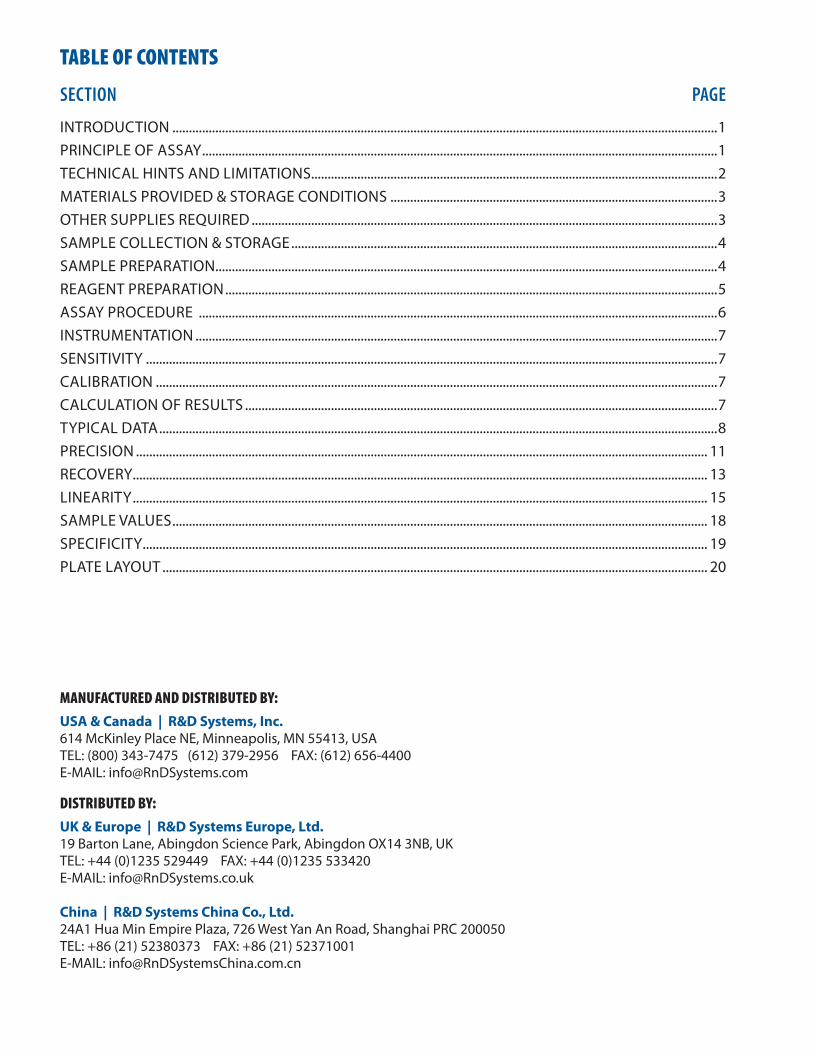
INTRODUCTIONCD4+ T helper (Th) cells are critical mediators of the adaptive immune response. Naïve CD4+ T cells are activated by antigen-presenting cells and subsequently differentiate into Th cell lineages. These include T helper type 1 (Th1) cells, Th2 cells, Th9 cells, Th17 cells, and Th22 cells. The various Th cell subsets are noted for their secretion of specific cytokines that define the function of the cell. Thus, the ability to analyze multiple cytokines simultaneously can be used for the rapid detection of different Th responses. The Mosaic Human Th1/Th2/Th17 ELISA is a powerful tool capable of simultaneously detecting 11different cytokines in the same sample. These include the Th1-related cytokines IL-2, IL-12 p70, IFN-γ, and TNF-α, the Th2-related cytokines IL-4, IL-5, and IL-10, and the Th17-related cytokines IL-7, IL-15, IL-17, and IL-22. Mosaic ELISA Kits employ a multiplex array in each well of a 96-well plate to provide an accurate, efficient, and economical alternative to conducting multiple traditional ELISA experiments.
IL-10
IL-7
IL-22 IFN-γ TNF-α ReferenceSpot
IL-12 p70 IL-15 IL-17
IL-2 IL-4 IL-5
PRINCIPLE OF ASSAYThe Mosaic Human Th1/Th2/Th17 Panel Immunoassay employs a two-site sandwich ELISA technique to simultaneously detect eleven Th lineage markers in cell culture supernates, serum, and plasma. Multiple capture antibodies that specifically recognize the target Th lineage markers have been pre-spotted into each well of a 96 well microplate. Standards and samples are added, and Th lineage markers present in the samples are bound by the immobilized antibodies. After washing away unbound material, biotinylated detection antibodies are used to detect the specific Th lineage markers. Unbound detection antibodies are washed away and streptavidin-HRP is added. Following an additional wash, chemiluminescent substrate reagents are added to the wells, and a signal proportional to the amount of each cytokine bound in the initial step is produced. Plates are read using a digital camera imaging system, and pixel intensity is measured using an analytical software package.
Figure 1: A visualization of the spot layout per well.
For research use only. Not for use in diagnostic procedures.2
TECHNICAL HINTS AND LIMITATIONS• FOR RESEARCH USE ONLY. NOT FOR USE IN DIAGNOSTIC PROCEDURES.
• This kit should not be used beyond the expiration date on the kit label.
• Do not mix or substitute reagents with those from other lots or sources.
• Any variation in buffers, operator, pipetting technique, washing technique, instrumentation, and incubation time or temperature and kit age can alter the performance of the kit.
• Variations in sample collection, processing, and storage may cause sample value differences.
• When mixing or reconstituting protein solutions, always avoid foaming.
• To avoid cross-contamination, change pipette tips between additions of each standard level, between sample additions, and between reagent additions. Also, use separate reservoirs for each reagent.
• Avoid microbial contamination of reagents and buffers.
• To ensure accurate results, proper adhesion of plate sealers during incubation steps is necessary.
• If samples fall outside the dynamic range of the assay, further dilute the samples with the appropriate Calibrator Diluent and repeat the assay.
• Mosaic affords the user the benefit of multianalyte analysis of eleven Th lineage markers in a complex sample. Multipurpose diluents are used to optimize recovery, linearity, and reproducibility. These diluents may not optimize any single analyte to the same degree that a unique diluent selected for analysis of that analyte can optimize conditions. Therefore, some performance characteristics may be more variable than those for assays designed specifically for single analyte analysis.
• This assay is designed to eliminate interference by ligands, proteins, and other factors present in biological samples. Until all factors have been tested, the possibility of interference cannot be excluded.
• Discrepancies may exist in values obtained for the same analyte utilizing different technologies.
• Only the analytes listed on the enclosed Standard Value Card can be measured with this kit.
www.RnDSystems.com 3
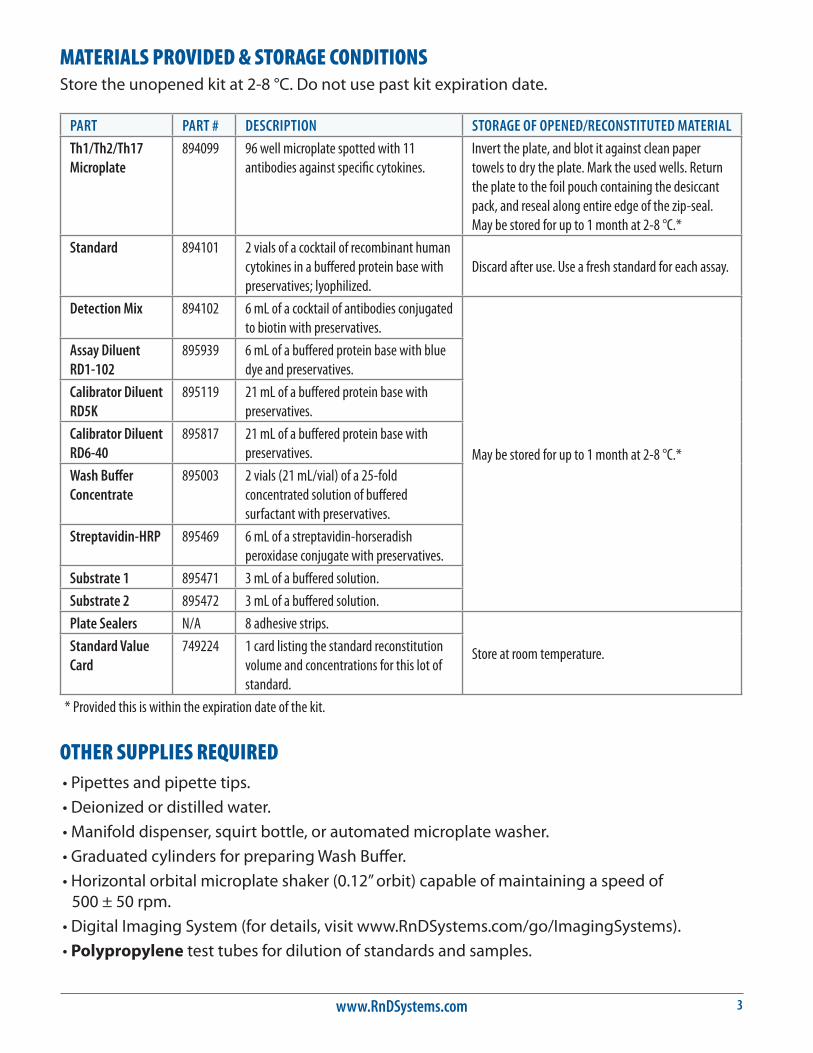
MATERIALS PROVIDED & STORAGE CONDITIONSStore the unopened kit at 2-8 °C. Do not use past kit expiration date.
PART PART # DESCRIPTION STORAGE OF OPENED/RECONSTITUTED MATERIAL
Th1/Th2/Th17 Microplate
894099 96 well microplate spotted with 11 antibodies against specific cytokines.
Invert the plate, and blot it against clean paper towels to dry the plate. Mark the used wells. Return the plate to the foil pouch containing the desiccant pack, and reseal along entire edge of the zip-seal. May be stored for up to 1 month at 2-8 °C.*
Standard 894101 2 vials of a cocktail of recombinant human cytokines in a buffered protein base with preservatives; lyophilized.
Discard after use. Use a fresh standard for each assay.
Detection Mix 894102 6 mL of a cocktail of antibodies conjugated to biotin with preservatives.
May be stored for up to 1 month at 2-8 °C.*
Assay Diluent RD1-102
895939 6 mL of a buffered protein base with blue dye and preservatives.
Calibrator Diluent RD5K
895119 21 mL of a buffered protein base with preservatives.
Calibrator Diluent RD6-40
895817 21 mL of a buffered protein base with preservatives.
Wash Buffer Concentrate
895003 2 vials (21 mL/vial) of a 25-fold concentrated solution of buffered surfactant with preservatives.
Streptavidin-HRP 895469 6 mL of a streptavidin-horseradish peroxidase conjugate with preservatives.
Substrate 1 895471 3 mL of a buffered solution.Substrate 2 895472 3 mL of a buffered solution.Plate Sealers N/A 8 adhesive strips.
Store at room temperature.Standard Value Card
749224 1 card listing the standard reconstitution volume and concentrations for this lot of standard.
* Provided this is within the expiration date of the kit.
OTHER SUPPLIES REQUIRED• Pipettes and pipette tips.• Deionized or distilled water.• Manifold dispenser, squirt bottle, or automated microplate washer.• Graduated cylinders for preparing Wash Buffer.• Horizontal orbital microplate shaker (0.12” orbit) capable of maintaining a speed of
500 ± 50 rpm.• Digital Imaging System (for details, visit www.RnDSystems.com/go/ImagingSystems).• Polypropylene test tubes for dilution of standards and samples.
For research use only. Not for use in diagnostic procedures.4
SAMPLE COLLECTION & STORAGEThe sample collection and storage conditions listed below are intended as general guidelines. Sample stability has not been evaluated.
Cell Culture Supernates - Remove particulates by centrifugation and assay immediately or aliquot and store samples at ≤ -20 °C. Avoid repeated freeze-thaw cycles.
Serum - Allow blood samples to clot for 30 minutes at room temperature before centrifuging for 15 minutes at 1000 x g. Remove serum and assay immediately or aliquot and store samples at ≤ -20 °C. Avoid repeated freeze-thaw cycles.
Plasma - Collect plasma using EDTA or heparin as an anticoagulant. Centrifuge for 15 minutes at 1000 x g within 30 minutes of collection. Assay immediately or aliquot and store samples at ≤ -20 °C. Avoid repeated freeze-thaw cycles.
Note: Citrate plasma has not been validated for use in this assay. Heparin plasma is not recommended for use with IL-7.
SAMPLE PREPARATIONSerum and plasma samples require at least a 2-fold dilution. A suggested 2-fold dilution is 75 μL of sample + 75 μL of Calibrator Diluent RD6-40. Mix thoroughly.
www.RnDSystems.com 5
REAGENT PREPARATIONBring all reagents to room temperature before use.
Wash Buffer - If crystals have formed in the concentrate, warm to room temperature and mix gently until the crystals have completely dissolved. Dilute 20 mL of Wash Buffer Concentrate into deionized or distilled water to prepare 500 mL of Wash Buffer.
Substrate Solution - Substrates 1 and 2 should be mixed together in equal volumes 2-30 minutes prior to use. Protect from light. 50 μL of the resultant mixture is required per well.
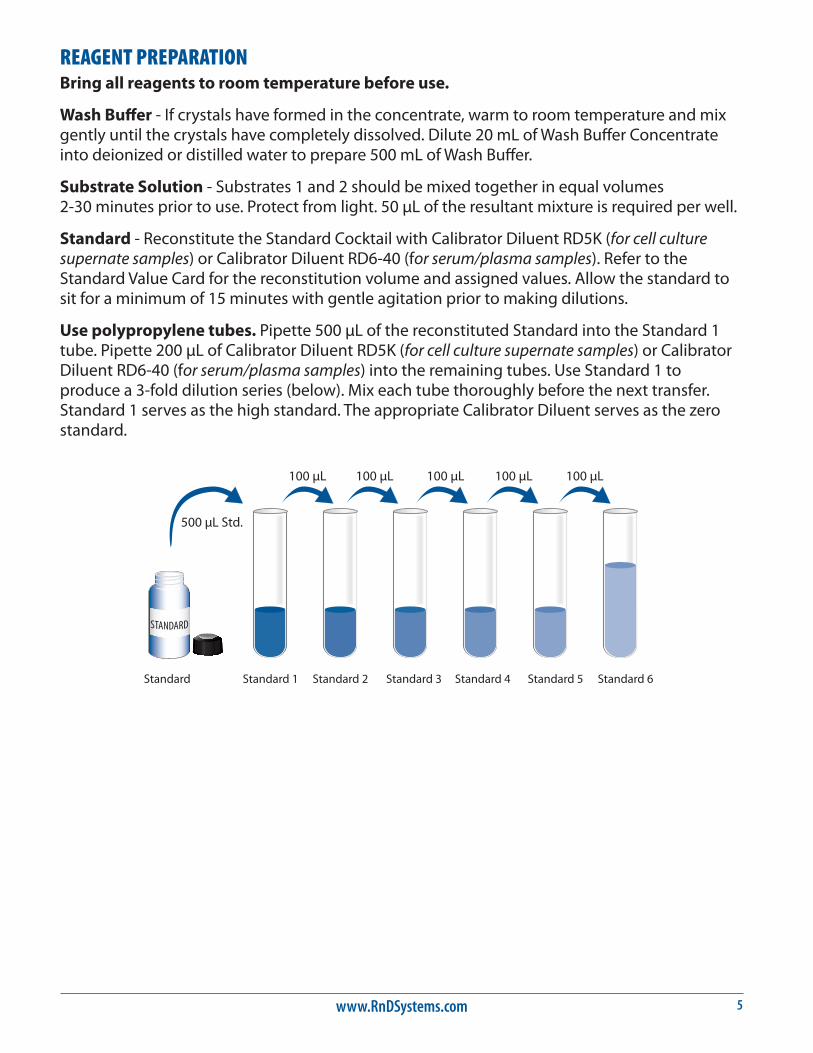
Standard - Reconstitute the Standard Cocktail with Calibrator Diluent RD5K (for cell culture supernate samples) or Calibrator Diluent RD6-40 (for serum/plasma samples). Refer to the Standard Value Card for the reconstitution volume and assigned values. Allow the standard to sit for a minimum of 15 minutes with gentle agitation prior to making dilutions.
Use polypropylene tubes. Pipette 500 μL of the reconstituted Standard into the Standard 1 tube. Pipette 200 μL of Calibrator Diluent RD5K (for cell culture supernate samples) or Calibrator Diluent RD6-40 (for serum/plasma samples) into the remaining tubes. Use Standard 1 to produce a 3-fold dilution series (below). Mix each tube thoroughly before the next transfer. Standard 1 serves as the high standard. The appropriate Calibrator Diluent serves as the zero standard.
500 µL Std.
Standard Standard 1 Standard 2 Standard 3 Standard 4 Standard 5 Standard 6
100 µL 100 µL 100 µL 100 µL 100 µL

For research use only. Not for use in diagnostic procedures.6
ASSAY PROCEDURE Bring all reagents and samples to room temperature before use. It is recommended that all samples and standards be assayed in duplicate.
Note: Protect Streptavidin-HRP and the Substrate from light at all times.
1. Prepare all reagents, working standards, and samples as directed in the previous sections.
2. Add 50 μL of Assay Diluent RD1-102 to each well.
3. Add 50 μL of Standard or sample* per well. Securely cover with a plate sealer. A plate layout is provided as a record of standards and samples assayed. For Cell Culture Supernate samples: Incubate for 2 hours at room temperature on a horizontal orbital microplate shaker (0.12” orbit) set at 500 ± 50 rpm. For Serum/Plasma samples: Incubate for 3 hours at room temperature on the shaker set at 500 ± 50 rpm.
4. Aspirate each well and wash, repeating the process three times for a total of four washes. Wash by filling each well with Wash Buffer (400 μL) using a squirt bottle, manifold dispenser, or autowasher. Removal of liquid at each step is essential to good performance. After the last wash, remove any remaining Wash Buffer by decanting with force over a sink several times. Do not blot against paper towels as this may cause over drying of the wells.
5. Add 50 μL of the Detection Mix to all wells. Securely cover with a plate sealer and incubate for 1 hour at room temperature on the shaker set at 500 ± 50 rpm.
6. Repeat the wash as in step 4.
7. Add 50 μL of Streptavidin-HRP to all wells. Securely cover with a plate sealer and incubate for 15 minutes at room temperature on the shaker set at 500 ± 50 rpm. Protect from light.
8. Repeat the wash as in step 4.
9. Add 50 μL of Substrate Solution to each well. Protect from light.
10. Place the microplate in the imager. Wait no longer than 15 minutes to commence imaging.Note: For details, visit www.RnDSystems.com/go/ImagingSystems.
*Samples may require dilution. See the Sample Preparation section.
www.RnDSystems.com 7
INSTRUMENTATIONThe Mosaic ELISA Kits have been validated on the Q-View™ Imager from Quansys Biosciences. Please visit www.RnDSystems.com/go/ImagingSystems for suitable imaging systems and their instructions for use.
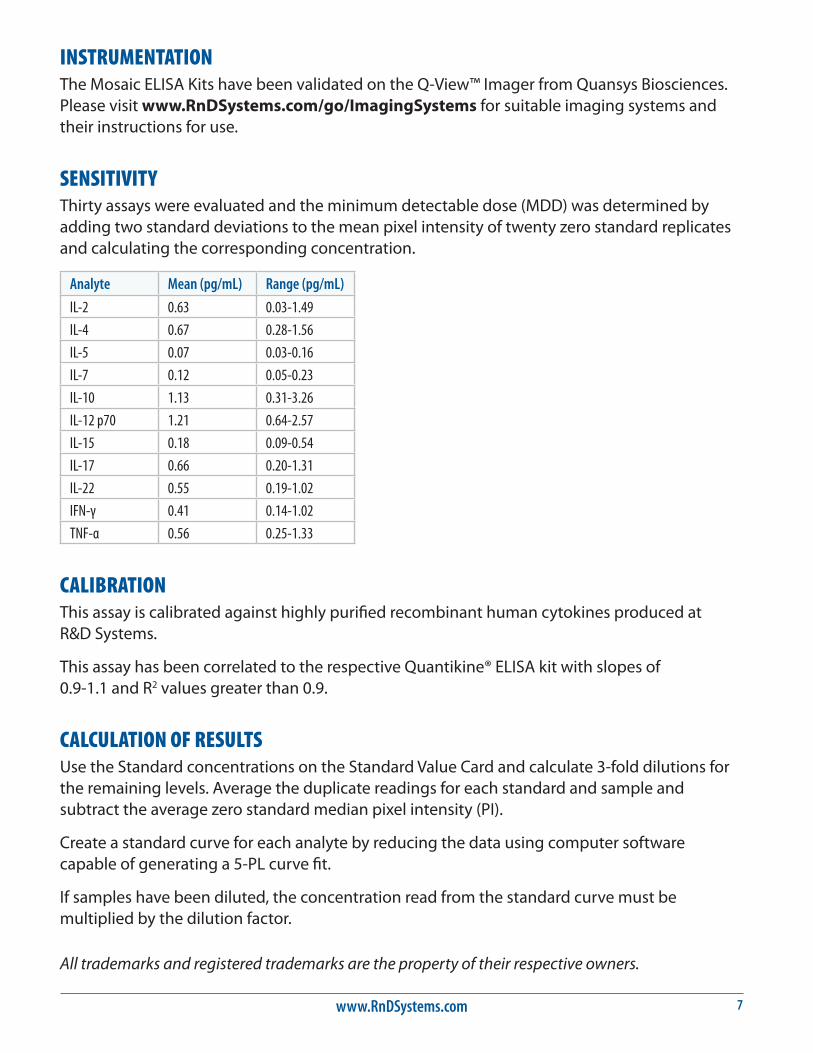
SENSITIVITYThirty assays were evaluated and the minimum detectable dose (MDD) was determined by adding two standard deviations to the mean pixel intensity of twenty zero standard replicates and calculating the corresponding concentration.
Analyte Mean (pg/mL) Range (pg/mL)
IL-2 0.63 0.03-1.49IL-4 0.67 0.28-1.56IL-5 0.07 0.03-0.16IL-7 0.12 0.05-0.23IL-10 1.13 0.31-3.26IL-12 p70 1.21 0.64-2.57IL-15 0.18 0.09-0.54IL-17 0.66 0.20-1.31IL-22 0.55 0.19-1.02IFN-γ 0.41 0.14-1.02TNF-α 0.56 0.25-1.33
CALIBRATIONThis assay is calibrated against highly purified recombinant human cytokines produced at R&D Systems.
This assay has been correlated to the respective Quantikine® ELISA kit with slopes of 0.9-1.1 and R2 values greater than 0.9.
CALCULATION OF RESULTSUse the Standard concentrations on the Standard Value Card and calculate 3-fold dilutions for the remaining levels. Average the duplicate readings for each standard and sample and subtract the average zero standard median pixel intensity (PI).
Create a standard curve for each analyte by reducing the data using computer software capable of generating a 5-PL curve fit.
If samples have been diluted, the concentration read from the standard curve must be multiplied by the dilution factor.
All trademarks and registered trademarks are the property of their respective owners.
For research use only. Not for use in diagnostic procedures.8
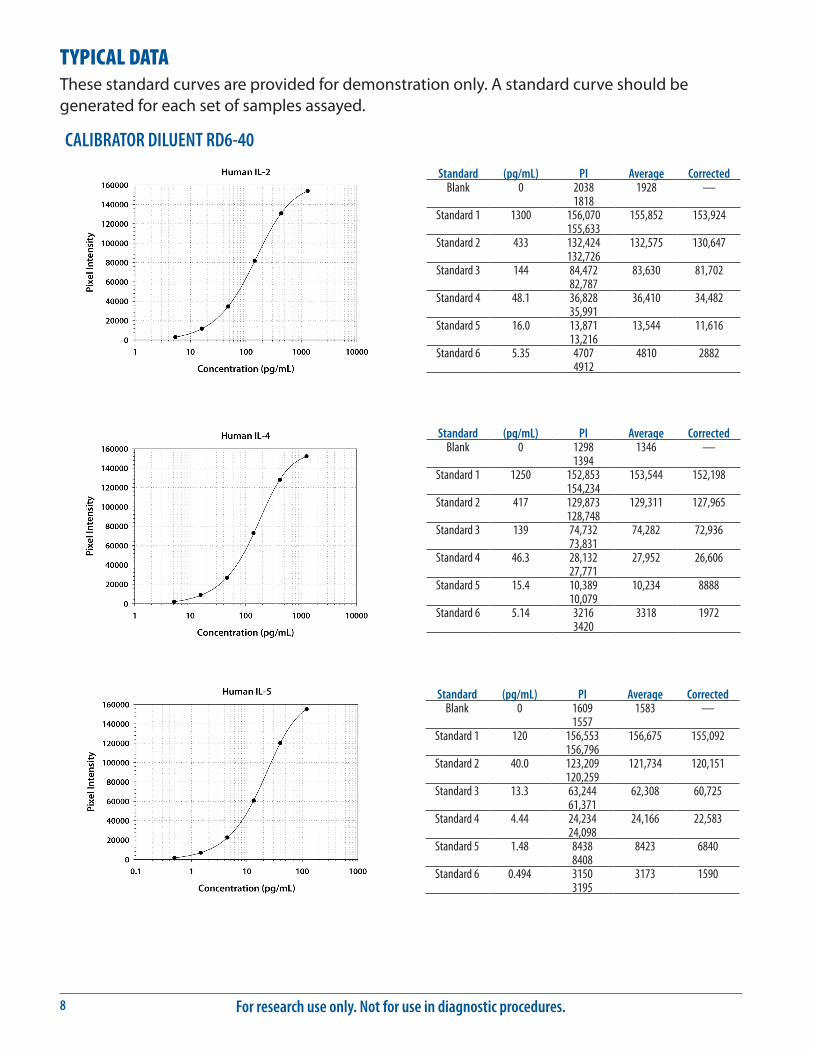
TYPICAL DATAThese standard curves are provided for demonstration only. A standard curve should be generated for each set of samples assayed.
Standard (pg/mL) PI Average CorrectedBlank 0 2038 1928 —
1818Standard 1 1300 156,070 155,852 153,924
155,633Standard 2 433 132,424 132,575 130,647
132,726Standard 3 144 84,472 83,630 81,702
82,787Standard 4 48.1 36,828 36,410 34,482
35,991Standard 5 16.0 13,871 13,544 11,616
13,216Standard 6 5.35 4707 4810 2882
4912
Standard (pg/mL) PI Average CorrectedBlank 0 1298 1346 —
1394Standard 1 1250 152,853 153,544 152,198
154,234Standard 2 417 129,873 129,311 127,965
128,748Standard 3 139 74,732 74,282 72,936
73,831Standard 4 46.3 28,132 27,952 26,606
27,771Standard 5 15.4 10,389 10,234 8888
10,079Standard 6 5.14 3216 3318 1972
3420
Standard (pg/mL) PI Average CorrectedBlank 0 1609 1583 —
1557Standard 1 120 156,553 156,675 155,092
156,796Standard 2 40.0 123,209 121,734 120,151
120,259Standard 3 13.3 63,244 62,308 60,725
61,371Standard 4 4.44 24,234 24,166 22,583
24,098Standard 5 1.48 8438 8423 6840
8408Standard 6 0.494 3150 3173 1590
3195
CALIBRATOR DILUENT RD6-40
www.RnDSystems.com 9
Standard (pg/mL) PI Average CorrectedBlank 0 1519 1595 —
1671Standard 1 220 152,304 151,410 149,815
150,516Standard 2 73.3 118,655 118,814 117,219
118,973Standard 3 24.4 64,111 64,442 62,847
64,773Standard 4 8.15 29,779 29,684 28,089
29,589Standard 5 2.72 11,395 11,331 9736
11,266Standard 6 0.905 4217 4297 2702
4376
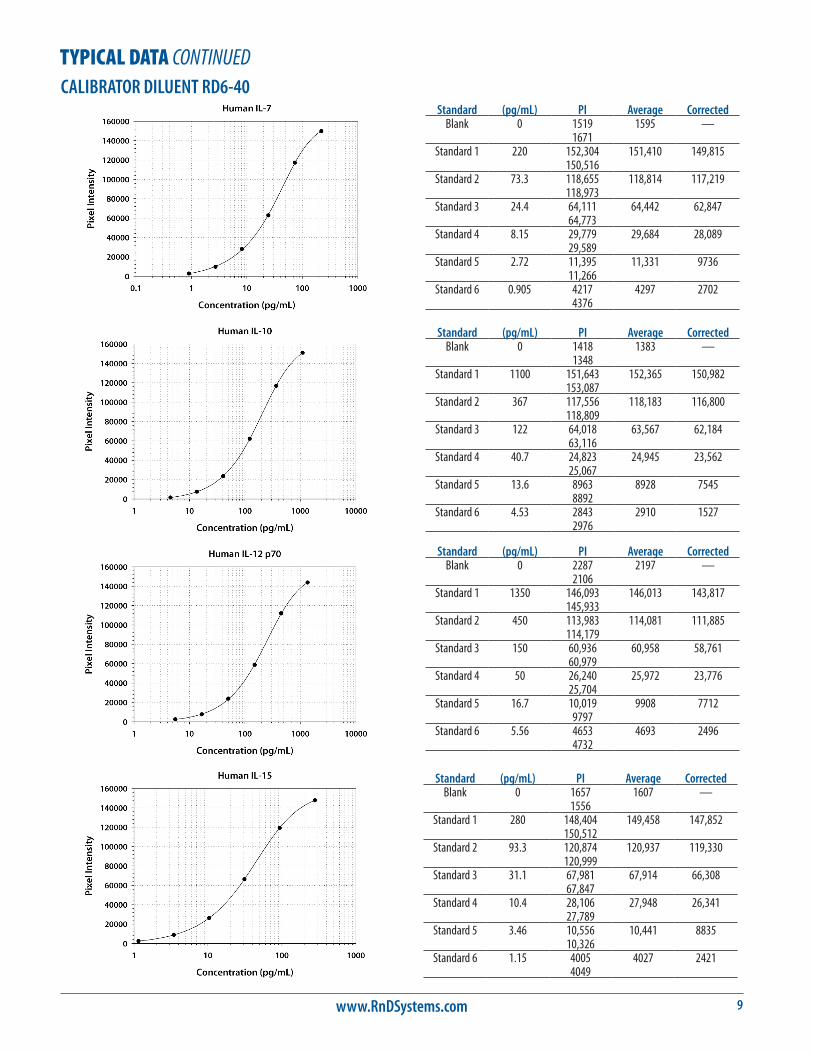
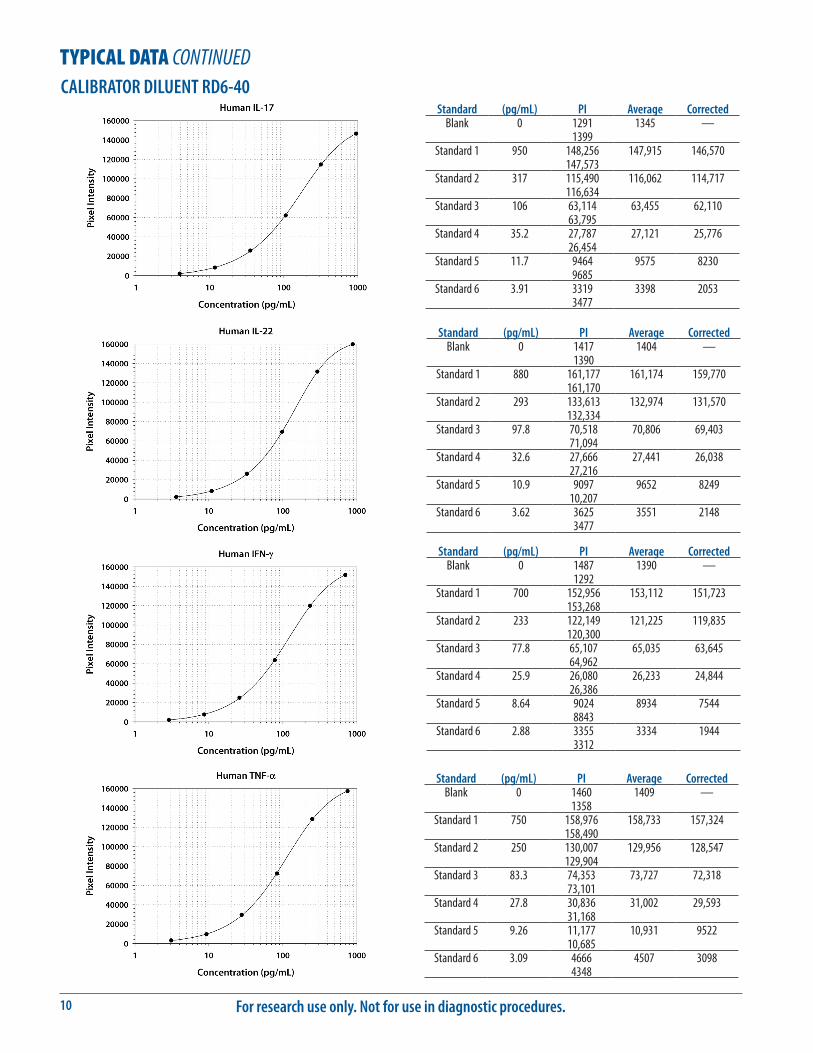
TYPICAL DATA CONTINUED
Standard (pg/mL) PI Average CorrectedBlank 0 1418 1383 —
1348Standard 1 1100 151,643 152,365 150,982
153,087Standard 2 367 117,556 118,183 116,800
118,809Standard 3 122 64,018 63,567 62,184
63,116Standard 4 40.7 24,823 24,945 23,562
25,067Standard 5 13.6 8963 8928 7545
8892Standard 6 4.53 2843 2910 1527
2976
Standard (pg/mL) PI Average CorrectedBlank 0 2287 2197 —
2106Standard 1 1350 146,093 146,013 143,817
145,933Standard 2 450 113,983 114,081 111,885
114,179Standard 3 150 60,936 60,958 58,761
60,979Standard 4 50 26,240 25,972 23,776
25,704Standard 5 16.7 10,019 9908 7712
9797Standard 6 5.56 4653 4693 2496
4732
Standard (pg/mL) PI Average CorrectedBlank 0 1657 1607 —
1556Standard 1 280 148,404 149,458 147,852
150,512Standard 2 93.3 120,874 120,937 119,330
120,999Standard 3 31.1 67,981 67,914 66,308
67,847Standard 4 10.4 28,106 27,948 26,341
27,789Standard 5 3.46 10,556 10,441 8835
10,326Standard 6 1.15 4005 4027 2421
4049
CALIBRATOR DILUENT RD6-40
For research use only. Not for use in diagnostic procedures.10
Standard (pg/mL) PI Average CorrectedBlank 0 1291 1345 —
1399Standard 1 950 148,256 147,915 146,570
147,573Standard 2 317 115,490 116,062 114,717
116,634Standard 3 106 63,114 63,455 62,110
63,795Standard 4 35.2 27,787 27,121 25,776
26,454Standard 5 11.7 9464 9575 8230
9685Standard 6 3.91 3319 3398 2053
3477
Standard (pg/mL) PI Average CorrectedBlank 0 1417 1404 —
1390Standard 1 880 161,177 161,174 159,770
161,170Standard 2 293 133,613 132,974 131,570
132,334Standard 3 97.8 70,518 70,806 69,403
71,094Standard 4 32.6 27,666 27,441 26,038
27,216Standard 5 10.9 9097 9652 8249
10,207Standard 6 3.62 3625 3551 2148
3477
Standard (pg/mL) PI Average CorrectedBlank 0 1487 1390 —
1292Standard 1 700 152,956 153,112 151,723
153,268Standard 2 233 122,149 121,225 119,835
120,300Standard 3 77.8 65,107 65,035 63,645
64,962Standard 4 25.9 26,080 26,233 24,844
26,386Standard 5 8.64 9024 8934 7544
8843Standard 6 2.88 3355 3334 1944
3312
Standard (pg/mL) PI Average CorrectedBlank 0 1460 1409 —
1358Standard 1 750 158,976 158,733 157,324
158,490Standard 2 250 130,007 129,956 128,547
129,904Standard 3 83.3 74,353 73,727 72,318
73,101Standard 4 27.8 30,836 31,002 29,593
31,168Standard 5 9.26 11,177 10,931 9522
10,685Standard 6 3.09 4666 4507 3098
4348
TYPICAL DATA CONTINUEDCALIBRATOR DILUENT RD6-40

www.RnDSystems.com 11
PRECISIONIntra-assay Precision (Precision within an assay) Three samples of known concentration were tested twenty times on one plate to assess intra-assay precision.
Inter-assay Precision (Precision between assays) Three samples of known concentration were tested in fifty-three separate assays to assess inter-assay precision.
IL-2 Intra-Assay Precision Inter-Assay Precision
Sample 1 2 3 1 2 3
n 20 20 20 53 53 53Mean (pg/mL) 23.2 101 398 23.5 95.4 366Standard deviation 1.20 5.63 20.0 3.3 12.2 39.0CV (%) 5.2 5.6 5.0 13.9 12.8 10.7
IL-4 Intra-Assay Precision Inter-Assay Precision
Sample 1 2 3 1 2 3
n 20 20 20 53 53 53Mean (pg/mL) 14.7 49.3 235 15.3 49.5 228Standard deviation 0.68 1.84 11.6 1.79 5.32 20.5CV (%) 4.6 3.7 4.9 11.7 10.7 9.0
IL-5 Intra-Assay Precision Inter-Assay Precision
Sample 1 2 3 1 2 3
n 20 20 20 53 53 53Mean (pg/mL) 2.72 10.4 37.5 2.86 11.6 40.4Standard deviation 0.22 1.01 3.50 0.36 1.44 4.00CV (%) 8.0 9.7 9.3 12.4 12.4 9.9
IL-7 Intra-Assay Precision Inter-Assay Precision
Sample 1 2 3 1 2 3
n 20 20 20 53 53 53Mean (pg/mL) 2.33 10.9 48.6 2.55 11.9 48.7Standard deviation 0.19 0.68 3.41 0.35 1.33 4.08CV (%) 8.2 6.2 7.0 13.7 11.2 8.4
IL-10 Intra-Assay Precision Inter-Assay Precision
Sample 1 2 3 1 2 3
n 20 20 20 53 53 53Mean (pg/mL) 15.2 54.8 230 14.3 58.2 243Standard deviation 1.33 2.40 15.6 1.80 6.02 23.9CV (%) 8.7 4.4 6.8 12.6 10.3 9.8
For research use only. Not for use in diagnostic procedures.12
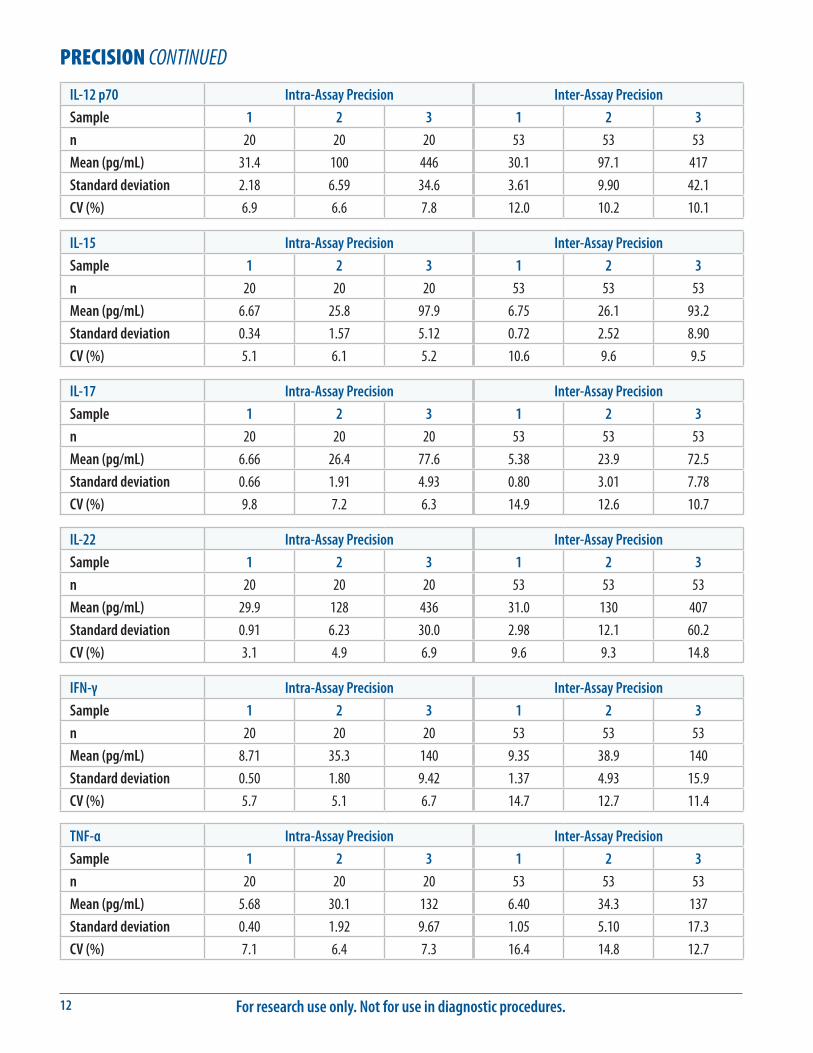
PRECISION CONTINUED
IL-12 p70 Intra-Assay Precision Inter-Assay Precision
Sample 1 2 3 1 2 3
n 20 20 20 53 53 53Mean (pg/mL) 31.4 100 446 30.1 97.1 417Standard deviation 2.18 6.59 34.6 3.61 9.90 42.1CV (%) 6.9 6.6 7.8 12.0 10.2 10.1
IL-15 Intra-Assay Precision Inter-Assay Precision
Sample 1 2 3 1 2 3
n 20 20 20 53 53 53Mean (pg/mL) 6.67 25.8 97.9 6.75 26.1 93.2Standard deviation 0.34 1.57 5.12 0.72 2.52 8.90CV (%) 5.1 6.1 5.2 10.6 9.6 9.5
IL-17 Intra-Assay Precision Inter-Assay Precision
Sample 1 2 3 1 2 3
n 20 20 20 53 53 53Mean (pg/mL) 6.66 26.4 77.6 5.38 23.9 72.5Standard deviation 0.66 1.91 4.93 0.80 3.01 7.78CV (%) 9.8 7.2 6.3 14.9 12.6 10.7
IL-22 Intra-Assay Precision Inter-Assay Precision
Sample 1 2 3 1 2 3
n 20 20 20 53 53 53Mean (pg/mL) 29.9 128 436 31.0 130 407Standard deviation 0.91 6.23 30.0 2.98 12.1 60.2CV (%) 3.1 4.9 6.9 9.6 9.3 14.8
IFN-γ Intra-Assay Precision Inter-Assay Precision
Sample 1 2 3 1 2 3
n 20 20 20 53 53 53Mean (pg/mL) 8.71 35.3 140 9.35 38.9 140Standard deviation 0.50 1.80 9.42 1.37 4.93 15.9CV (%) 5.7 5.1 6.7 14.7 12.7 11.4
TNF-α Intra-Assay Precision Inter-Assay Precision
Sample 1 2 3 1 2 3
n 20 20 20 53 53 53Mean (pg/mL) 5.68 30.1 132 6.40 34.3 137Standard deviation 0.40 1.92 9.67 1.05 5.10 17.3CV (%) 7.1 6.4 7.3 16.4 14.8 12.7
www.RnDSystems.com 13
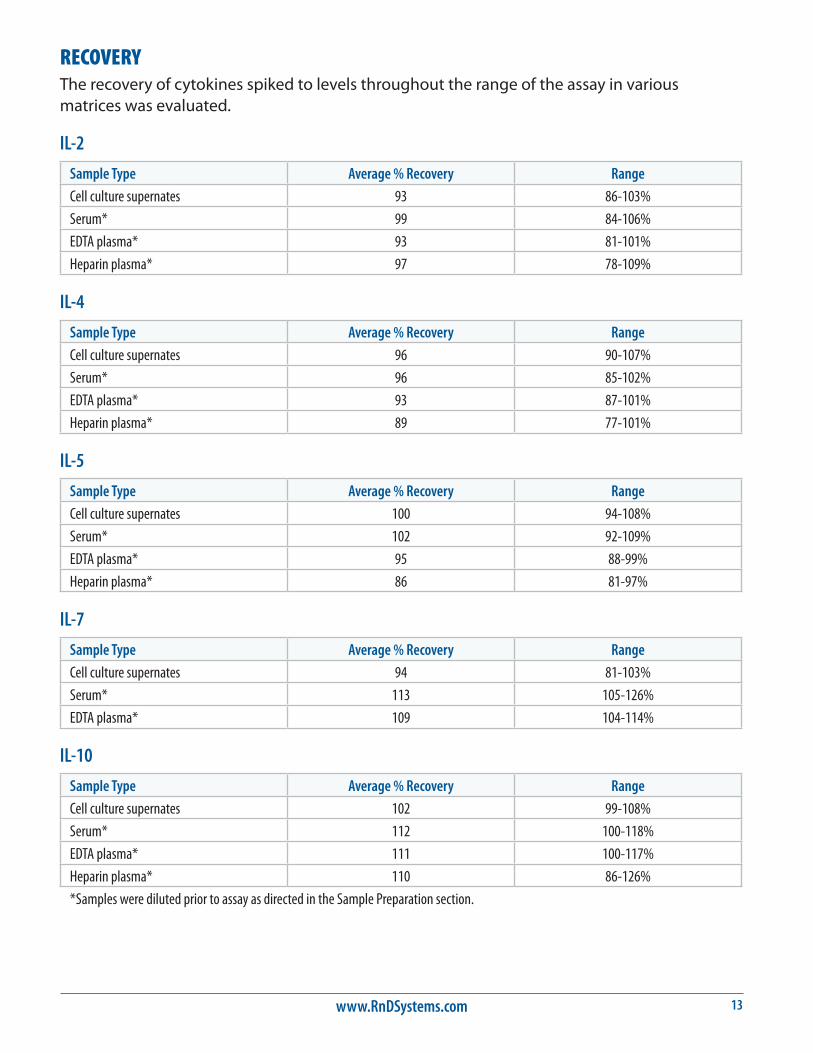
RECOVERYThe recovery of cytokines spiked to levels throughout the range of the assay in various matrices was evaluated.
IL-2
Sample Type Average % Recovery Range
Cell culture supernates 93 86-103%Serum* 99 84-106%EDTA plasma* 93 81-101%Heparin plasma* 97 78-109%
IL-4
Sample Type Average % Recovery Range
Cell culture supernates 96 90-107%Serum* 96 85-102%EDTA plasma* 93 87-101%Heparin plasma* 89 77-101%
IL-5
Sample Type Average % Recovery Range
Cell culture supernates 100 94-108%Serum* 102 92-109%EDTA plasma* 95 88-99%Heparin plasma* 86 81-97%
IL-7
Sample Type Average % Recovery Range
Cell culture supernates 94 81-103%Serum* 113 105-126%EDTA plasma* 109 104-114%
IL-10
Sample Type Average % Recovery Range
Cell culture supernates 102 99-108%Serum* 112 100-118%EDTA plasma* 111 100-117%Heparin plasma* 110 86-126%*Samples were diluted prior to assay as directed in the Sample Preparation section.
For research use only. Not for use in diagnostic procedures.14
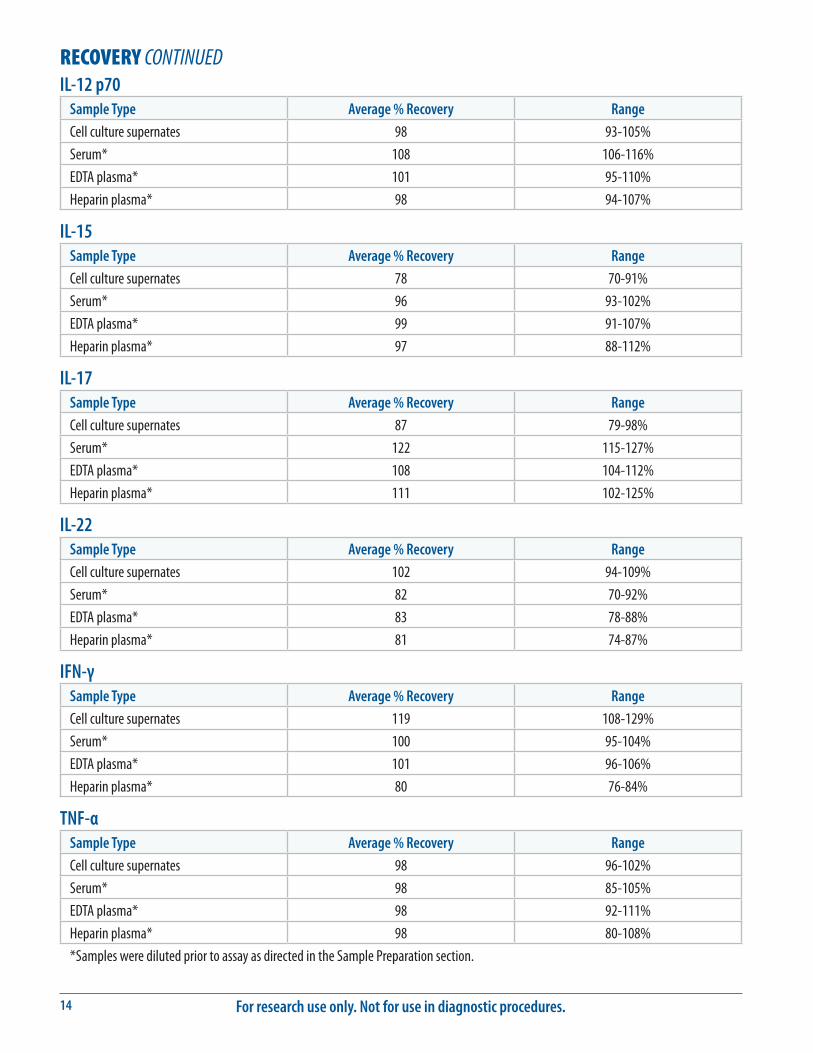
RECOVERY CONTINUEDIL-12 p70
Sample Type Average % Recovery Range
Cell culture supernates 98 93-105%Serum* 108 106-116%EDTA plasma* 101 95-110%Heparin plasma* 98 94-107%
IL-15Sample Type Average % Recovery Range
Cell culture supernates 78 70-91%Serum* 96 93-102%EDTA plasma* 99 91-107%Heparin plasma* 97 88-112%
IL-17Sample Type Average % Recovery Range
Cell culture supernates 87 79-98%Serum* 122 115-127%EDTA plasma* 108 104-112%Heparin plasma* 111 102-125%
IL-22Sample Type Average % Recovery Range
Cell culture supernates 102 94-109%Serum* 82 70-92%EDTA plasma* 83 78-88%Heparin plasma* 81 74-87%
IFN-γSample Type Average % Recovery Range
Cell culture supernates 119 108-129%Serum* 100 95-104%EDTA plasma* 101 96-106%Heparin plasma* 80 76-84%
TNF-αSample Type Average % Recovery Range
Cell culture supernates 98 96-102%Serum* 98 85-105%EDTA plasma* 98 92-111%Heparin plasma* 98 80-108%*Samples were diluted prior to assay as directed in the Sample Preparation section.
www.RnDSystems.com 15
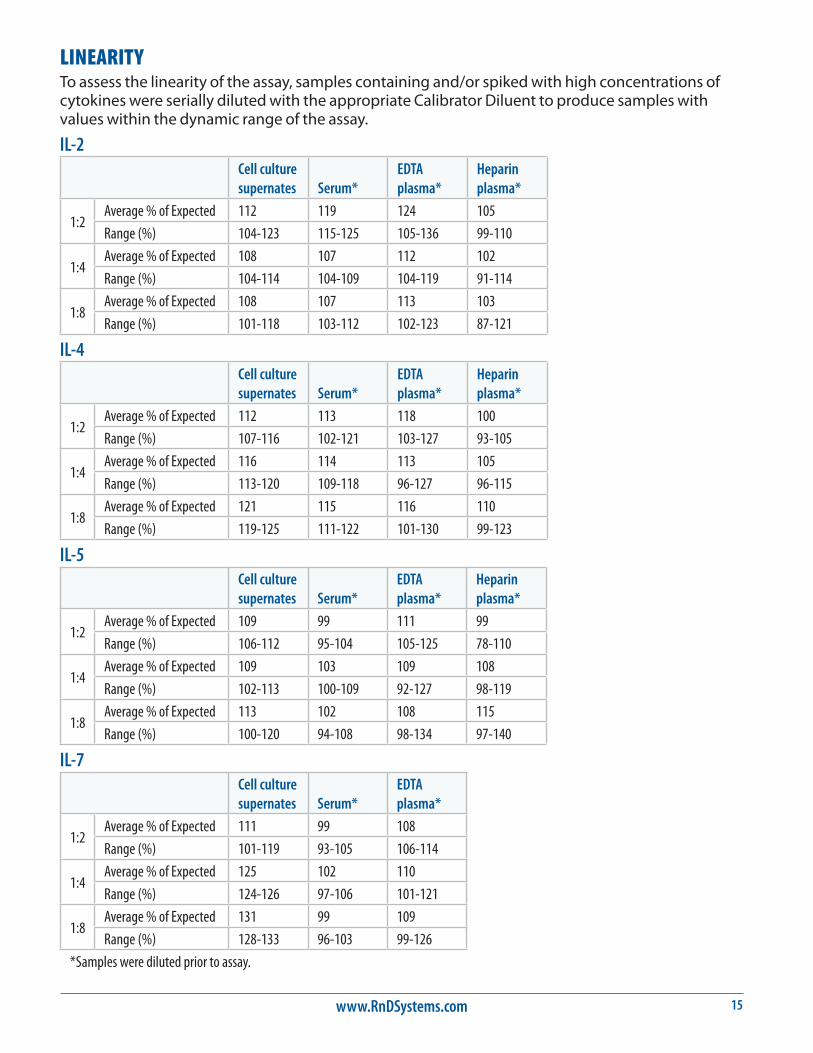
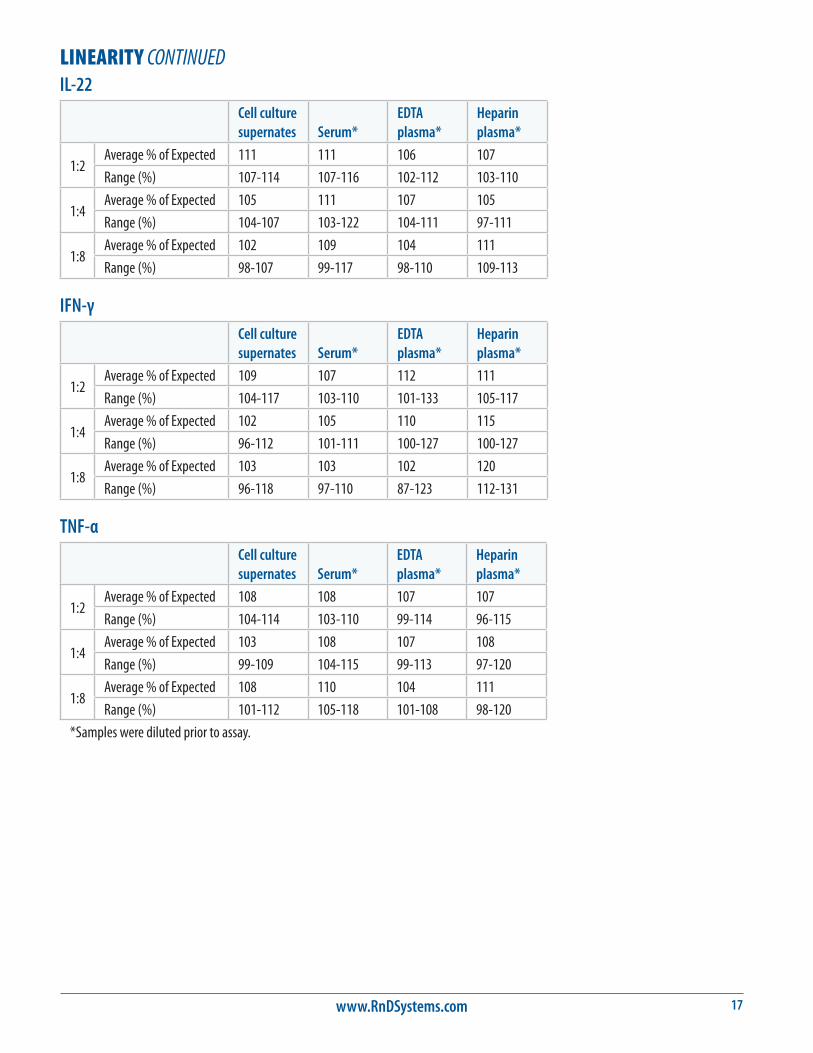
LINEARITYTo assess the linearity of the assay, samples containing and/or spiked with high concentrations of cytokines were serially diluted with the appropriate Calibrator Diluent to produce samples with values within the dynamic range of the assay.
IL-2Cell culture supernates
Serum*
EDTA plasma*
Heparin plasma*
1:2Average % of Expected 112 119 124 105Range (%) 104-123 115-125 105-136 99-110
1:4Average % of Expected 108 107 112 102Range (%) 104-114 104-109 104-119 91-114
1:8Average % of Expected 108 107 113 103Range (%) 101-118 103-112 102-123 87-121
IL-4Cell culture supernates
Serum*
EDTA plasma*
Heparin plasma*
1:2Average % of Expected 112 113 118 100Range (%) 107-116 102-121 103-127 93-105
1:4Average % of Expected 116 114 113 105Range (%) 113-120 109-118 96-127 96-115
1:8Average % of Expected 121 115 116 110Range (%) 119-125 111-122 101-130 99-123
IL-5Cell culture supernates
Serum*
EDTA plasma*
Heparin plasma*
1:2Average % of Expected 109 99 111 99Range (%) 106-112 95-104 105-125 78-110
1:4Average % of Expected 109 103 109 108Range (%) 102-113 100-109 92-127 98-119
1:8Average % of Expected 113 102 108 115Range (%) 100-120 94-108 98-134 97-140
IL-7Cell culture supernates
Serum*
EDTA plasma*
1:2Average % of Expected 111 99 108Range (%) 101-119 93-105 106-114
1:4Average % of Expected 125 102 110Range (%) 124-126 97-106 101-121
1:8Average % of Expected 131 99 109Range (%) 128-133 96-103 99-126
*Samples were diluted prior to assay.
For research use only. Not for use in diagnostic procedures.16
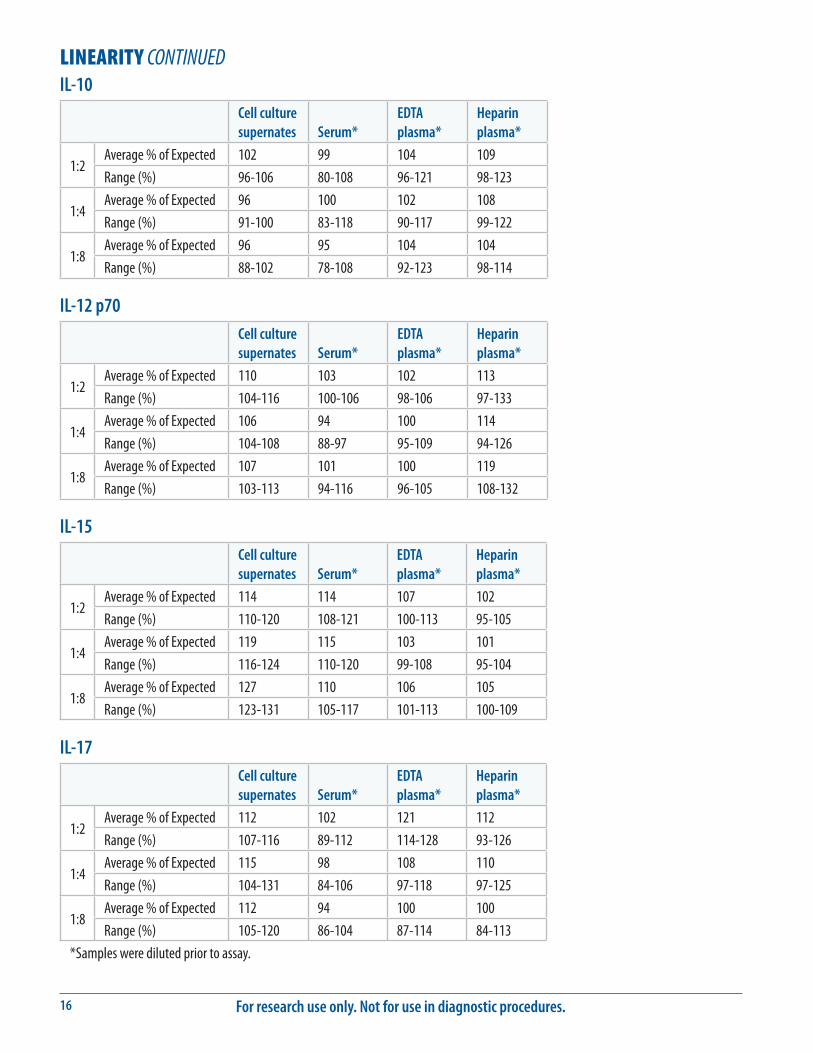
LINEARITY CONTINUEDIL-10
Cell culture supernates
Serum*
EDTA plasma*
Heparin plasma*
1:2Average % of Expected 102 99 104 109Range (%) 96-106 80-108 96-121 98-123
1:4Average % of Expected 96 100 102 108Range (%) 91-100 83-118 90-117 99-122
1:8Average % of Expected 96 95 104 104Range (%) 88-102 78-108 92-123 98-114
IL-12 p70Cell culture supernates
Serum*
EDTA plasma*
Heparin plasma*
1:2Average % of Expected 110 103 102 113Range (%) 104-116 100-106 98-106 97-133
1:4Average % of Expected 106 94 100 114Range (%) 104-108 88-97 95-109 94-126
1:8Average % of Expected 107 101 100 119Range (%) 103-113 94-116 96-105 108-132
IL-15Cell culture supernates
Serum*
EDTA plasma*
Heparin plasma*
1:2Average % of Expected 114 114 107 102Range (%) 110-120 108-121 100-113 95-105
1:4Average % of Expected 119 115 103 101Range (%) 116-124 110-120 99-108 95-104
1:8Average % of Expected 127 110 106 105Range (%) 123-131 105-117 101-113 100-109
IL-17Cell culture supernates
Serum*
EDTA plasma*
Heparin plasma*
1:2Average % of Expected 112 102 121 112Range (%) 107-116 89-112 114-128 93-126
1:4Average % of Expected 115 98 108 110Range (%) 104-131 84-106 97-118 97-125
1:8Average % of Expected 112 94 100 100Range (%) 105-120 86-104 87-114 84-113
*Samples were diluted prior to assay.
www.RnDSystems.com 17
LINEARITY CONTINUEDIL-22
Cell culture supernates
Serum*
EDTA plasma*
Heparin plasma*
1:2Average % of Expected 111 111 106 107Range (%) 107-114 107-116 102-112 103-110
1:4Average % of Expected 105 111 107 105Range (%) 104-107 103-122 104-111 97-111
1:8Average % of Expected 102 109 104 111Range (%) 98-107 99-117 98-110 109-113
IFN-γCell culture supernates
Serum*
EDTA plasma*
Heparin plasma*
1:2Average % of Expected 109 107 112 111Range (%) 104-117 103-110 101-133 105-117
1:4Average % of Expected 102 105 110 115Range (%) 96-112 101-111 100-127 100-127
1:8Average % of Expected 103 103 102 120Range (%) 96-118 97-110 87-123 112-131
TNF-αCell culture supernates
Serum*
EDTA plasma*
Heparin plasma*
1:2Average % of Expected 108 108 107 107Range (%) 104-114 103-110 99-114 96-115
1:4Average % of Expected 103 108 107 108Range (%) 99-109 104-115 99-113 97-120
1:8Average % of Expected 108 110 104 111Range (%) 101-112 105-118 101-108 98-120
*Samples were diluted prior to assay.
For research use only. Not for use in diagnostic procedures.18
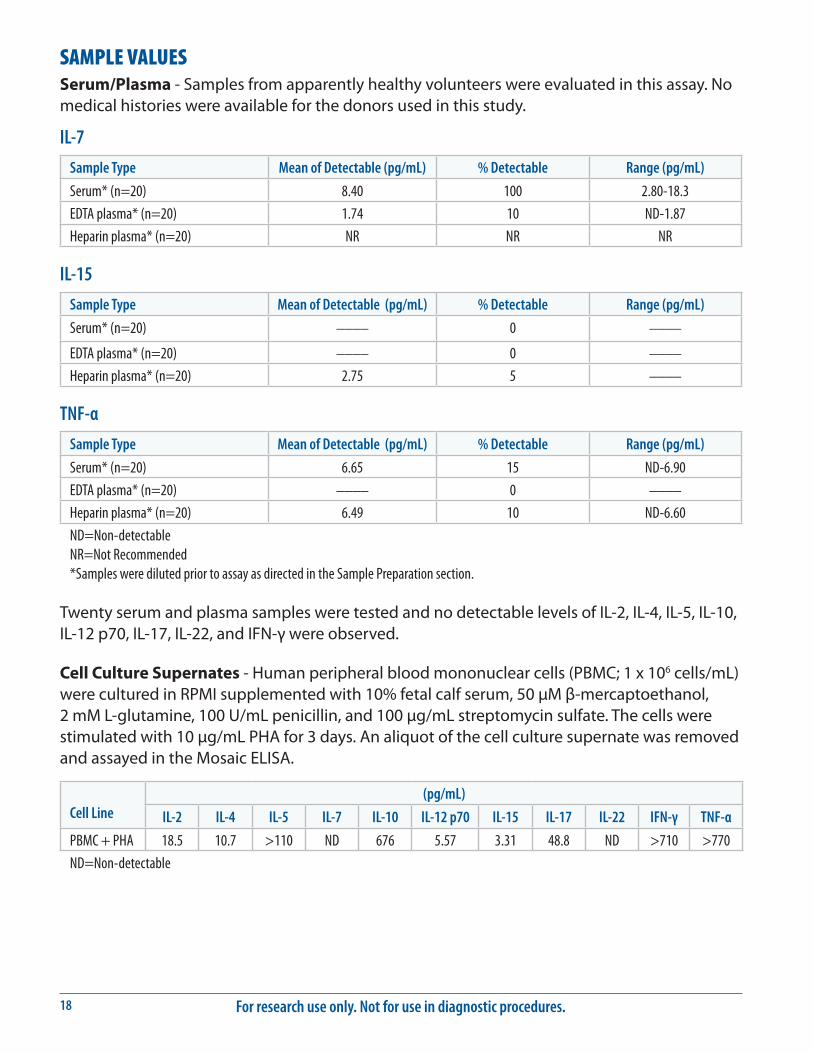
SAMPLE VALUESSerum/Plasma - Samples from apparently healthy volunteers were evaluated in this assay. No medical histories were available for the donors used in this study.
IL-7
Sample Type Mean of Detectable (pg/mL) % Detectable Range (pg/mL)
Serum* (n=20) 8.40 100 2.80-18.3EDTA plasma* (n=20) 1.74 10 ND-1.87Heparin plasma* (n=20) NR NR NR
IL-15
Sample Type Mean of Detectable (pg/mL) % Detectable Range (pg/mL)
Serum* (n=20) ____ 0 ____
EDTA plasma* (n=20) ____ 0 ____
Heparin plasma* (n=20) 2.75 5 ____
TNF-α
Sample Type Mean of Detectable (pg/mL) % Detectable Range (pg/mL)
Serum* (n=20) 6.65 15 ND-6.90EDTA plasma* (n=20) ____ 0 ____
Heparin plasma* (n=20) 6.49 10 ND-6.60ND=Non-detectable NR=Not Recommended *Samples were diluted prior to assay as directed in the Sample Preparation section.
Twenty serum and plasma samples were tested and no detectable levels of IL-2, IL-4, IL-5, IL-10, IL-12 p70, IL-17, IL-22, and IFN-γ were observed.
Cell Culture Supernates - Human peripheral blood mononuclear cells (PBMC; 1 x 10⁶ cells/mL) were cultured in RPMI supplemented with 10% fetal calf serum, 50 µM β-mercaptoethanol, 2 mM L-glutamine, 100 U/mL penicillin, and 100 µg/mL streptomycin sulfate. The cells were stimulated with 10 µg/mL PHA for 3 days. An aliquot of the cell culture supernate was removed and assayed in the Mosaic ELISA.
Cell Line
(pg/mL)
IL-2 IL-4 IL-5 IL-7 IL-10 IL-12 p70 IL-15 IL-17 IL-22 IFN-γ TNF-α
PBMC + PHA 18.5 10.7 >110 ND 676 5.57 3.31 48.8 ND >710 >770ND=Non-detectable
www.RnDSystems.com 19
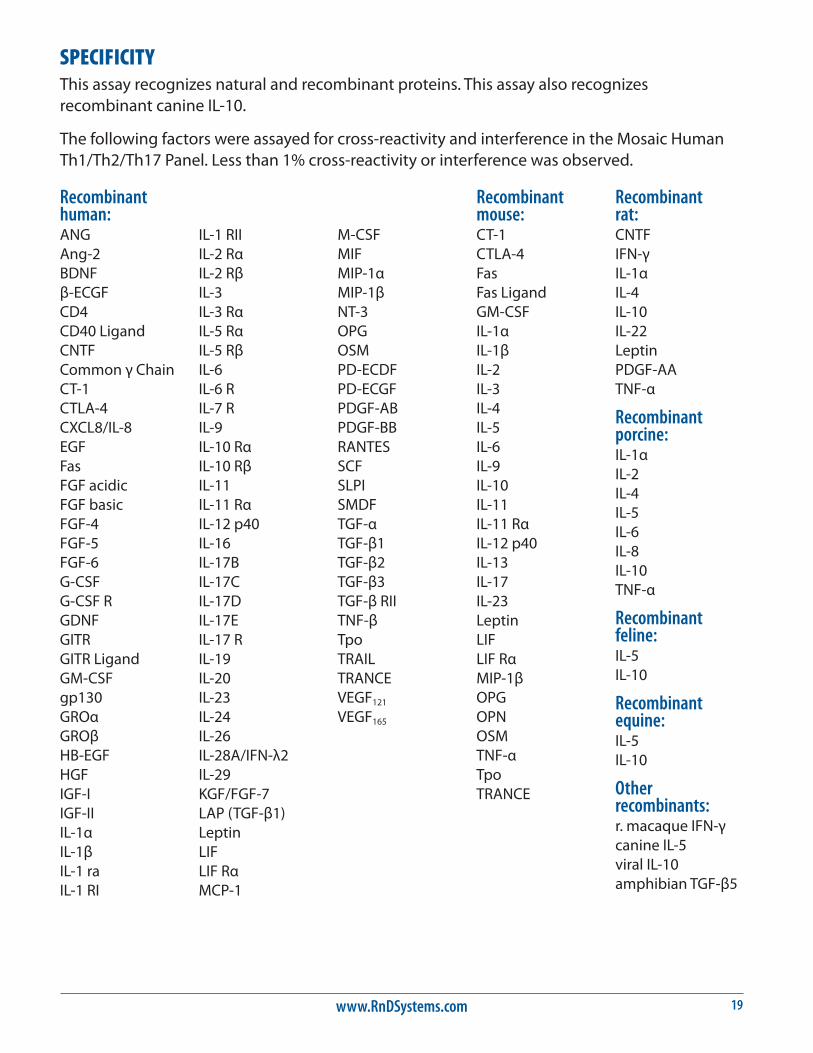
SPECIFICITYThis assay recognizes natural and recombinant proteins. This assay also recognizes recombinant canine IL-10.
The following factors were assayed for cross-reactivity and interference in the Mosaic Human Th1/Th2/Th17 Panel. Less than 1% cross-reactivity or interference was observed.
Recombinant human:ANGAng-2BDNFβ-ECGFCD4CD40 LigandCNTFCommon γ ChainCT-1CTLA-4CXCL8/IL-8EGFFasFGF acidicFGF basicFGF-4FGF-5FGF-6G-CSFG-CSF RGDNFGITRGITR LigandGM-CSFgp130GROαGROβHB-EGFHGFIGF-IIGF-IIIL-1αIL-1βIL-1 raIL-1 RI
IL-1 RIIIL-2 RαIL-2 RβIL-3IL-3 RαIL-5 RαIL-5 RβIL-6IL-6 RIL-7 RIL-9IL-10 RαIL-10 RβIL-11IL-11 RαIL-12 p40IL-16IL-17BIL-17CIL-17DIL-17EIL-17 RIL-19IL-20IL-23IL-24IL-26IL-28A/IFN-λ2IL-29KGF/FGF-7LAP (TGF-β1)LeptinLIFLIF RαMCP-1
M-CSFMIFMIP-1αMIP-1βNT-3OPGOSMPD-ECDFPD-ECGFPDGF-ABPDGF-BBRANTESSCFSLPISMDFTGF-αTGF-β1TGF-β2TGF-β3TGF-β RIITNF-βTpoTRAILTRANCEVEGF121
VEGF165
Recombinant mouse:CT-1CTLA-4FasFas LigandGM-CSFIL-1αIL-1βIL-2IL-3IL-4IL-5IL-6IL-9IL-10IL-11IL-11 RαIL-12 p40IL-13IL-17IL-23LeptinLIFLIF RαMIP-1βOPGOPNOSMTNF-αTpoTRANCE
Recombinant rat:CNTFIFN-γIL-1αIL-4IL-10IL-22LeptinPDGF-AATNF-α
Recombinant porcine:IL-1αIL-2IL-4IL-5IL-6IL-8IL-10TNF-α
Recombinant feline:IL-5IL-10
Recombinant equine:IL-5IL-10
Other recombinants:r. macaque IFN-γcanine IL-5viral IL-10amphibian TGF-β5
For research use only. Not for use in diagnostic procedures.20
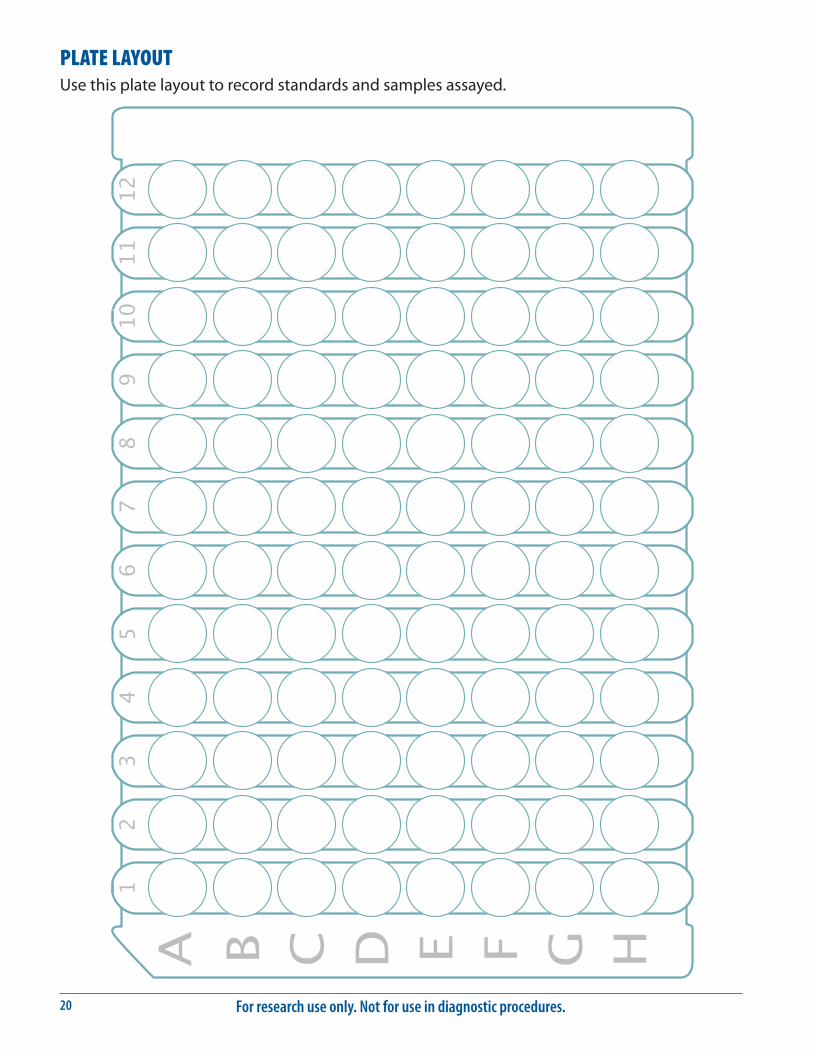
PLATE LAYOUTUse this plate layout to record standards and samples assayed.

www.RnDSystems.com 21
NOTES
For research use only. Not for use in diagnostic procedures.22
04.12 752224.0 4/12
©2012 R&D Systems, Inc.
NOTES
Substrates 1 and 2 are comprised of TMA-6, a product of Lumigen, Inc., Southfield, Michigan, USA, and are covered by the following:
US Patent Numbers: 5,922,558 and 6,858,733
International Patent Numbers: 733,086, 1,019,525, 2,300,071, 1,015,461, 2,002,352,881, ZL02805225.0, and 1,456,716