Embed Size (px)
Citation preview
1
Mortgage and Landlord Possession Statistics Quarterly, England and Wales October to December 2015 Ministry of Justice Statistics bulletin
Published: 11 February 2016
2
Contents
Introduction 3
Court Caseload 3
Case Timeliness 4
Seasonal Adjustment 4
Key Findings 5
Section 1 - Mortgage possession actions 7
Section 2 - Landlord possession actions 14
Annex A - Further information 21
Annex B: Policy changes 23
Annex C: Maps 25
Annex D: Explanatory notes 26
Contact points for further information 27

3
Introduction
This quarterly bulletin presents statistics on mortgage and landlord possession actions in the county courts of England and Wales in October to December 2015. The statistics provide summary figures on the volume and progression of cases that follow the court process of repossessing a property.
The statistics published here report on total county court caseloads that are used to assist the planning of court resources both nationally and locally. For previous publications of Mortgage and Landlords Possession Statistics, please see:
www.gov.uk/government/collections/mortgage-and-landlord-possession-statistics
Court Caseload
A mortgage or landlord possession action starts when a mortgage lender or landlord completes and submits a claim to the courts to repossess a property. The most common reason for repossession is arrears of mortgage or rent. The court process of possessing a property broadly follows four stages:
1. A claim for a mortgage or landlord possession being issued by a mortgage lender or a landlord;
2. An order being made by the county court. This can either be an outright order that the property is to be recovered by a specific date, or a suspended order that is suspended as long as the defendant complies with conditions specified in the order;
3. If the defendant fails to leave the property by the date given in the order or does not meet the terms of a suspended order, the order may be enforced by a warrant of possession. This authorises the county court bailiff to evict the defendant from the property. The bailiff then arranges a date to execute the eviction; and
4. Repossession by a county court bailiff. Repossessions may occur without county court bailiffs, through less formal procedures, so the actual number of repossessions is usually greater than the number carried out by county court bailiffs.
This report also includes UK wide total mortgage repossession figures from the Council of Mortgage Lenders (CML).These are not directly comparable to the other figures in this report, which cover England and Wales only.
Figures for each of these four processes are presented in the Excel tables and CSV files that accompany this publication.
4
The next publication of Mortgage and Landlord Possession Statistics Quarterly, England and Wales is scheduled to be published on 12 May 2016, covering the period January to March 2015.
Case Timeliness
Two measures of case timeliness are included in this bulletin. The first looks at how long it has taken (in weeks) to get to each stage in the relevant court process from the date when the claim was received, whilst the second reports how long it takes, on average, for claims to reach each stage in the process (number of quarters elapsed) alongside the proportion of claims that actually reach each stage.
Further work will be undertaken to better understand trends and drivers.
Seasonal Adjustment
Seasonal adjustment aims to remove regular seasonal patterns in a time series to show how it changes from quarter to quarter and give a clearer picture of the longer term trends. Possession actions tend to vary due to seasonal effects - since these seasonal effects follow a regular annual pattern, their impact on the series can be removed by seasonally adjusting the data. Please see A Guide to Civil and Administrative Justice Statistics1 for more information on how these figures are calculated.
1 www.gov.uk/government/statistics/guide-to-civil-and-administrative-justice-statistics
5
Key Findings
This report presents key statistics on mortgage and landlord possession claims in county courts in England and Wales for the fourth quarter of 2015 (October to December). It includes summary figures of the volume and progression of cases that follow the court process of possessing a property. All figures for the current quarter and 2015 are provisional.
Mortgage possession
In October to December 2015, 4,349 mortgage possession claims were recorded in county courts, down 45% compared to the number issued in the same quarter last year, and the lowest since the time series began 1987.
There were 2,932 orders for possession, 4,974 warrants of possession and 1,150 repossessions by county court bailiffs in October to December 2015; down 48%, 40% and 53% respectively compared to the same quarter last year. All of these were the lowest numbers recorded since the time series began.
Seasonally adjusted data shows an 8% decrease in claims, a 13% decrease in orders, a 20% decrease in warrants and a 16% decrease in repossessions by county court bailiffs compared to last quarter which suggests the recent decline seen in these figures is set to continue.
The annual total of claims issued in 2015 was 19,853, reflecting a 52% decline in number of claims since 2014. These are all the lowest annual figures in the series, which covers the period from 1987. The number of orders, warrants and repossessions in 2015 has also declined since 2014 by 53%, 45% and 53% respectively.
Landlord possession
In October to December 2015, 36,601 landlord possession claims in county courts were recorded, down 4% from the same quarter in 2014.
The profile of types of landlord possession claim (e.g. social landlord, private landlord and accelerated claims) has changed over time. In October to December 2015, the majority of landlord possession claims (62%) were social landlord claims although this proportion has fallen from 83% in 1999 to 62% in 2015 – in contrast, a quarter of claims made in October to December 2015 (25%) were accelerated claims and this proportion has risen from 7% in 1999 to 25% in 2015.
There were 28,476 orders for possession, down 6% on the same quarter last year. Warrants of possession remained stable at 18,644 - a decrease of less than 1% on the same quarter last year. There were 9,775 repossessions by county court bailiffs, down 6% on the same quarter last year.
6
Seasonally adjusted data shows a 2% decrease in claims and orders, a 1% decrease in warrants and a 6% decrease in repossessions by county court bailiffs compared to last quarter.
The annual total of claims issued in 2015 was 153,694, down 7% on the previous year. The numbers of orders and warrants also declined by 7% and 1% respectively. There were 42,728 repossessions by county court bailiffs in 2015, an increase of 2% compared to 2014, and the highest annual figure in the series, which covers the period from 2000.
7
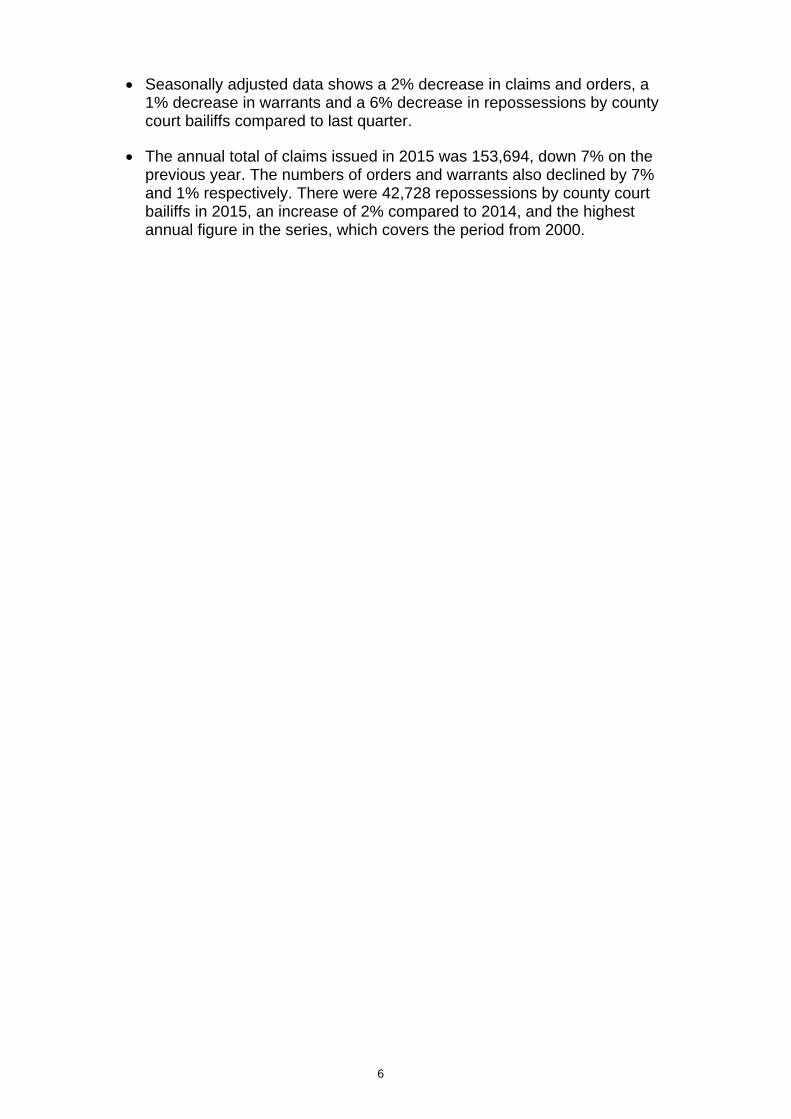
Section 1 - Mortgage possession actions
The number of mortgage possession actions2 in court increased from 2002 to 2008, and has been decreasing since then (Figure 1 and Table 1). The total number of properties repossessed3 has followed a similar trend.
The fall in the number of mortgage possession actions since 2008 coincides with lower interest rates4, a proactive approach from lenders in managing consumers in financial difficulties and other interventions from the government, such as the Mortgage Rescue Scheme. Other factors that may have contributed to the rapid fall in the number of mortgage possession claims and orders since 2008 include the introduction of the Mortgage Pre-Action Protocol (see Annex B on policy changes for more information). Additionally, the downward trend in recent years coincides with a decrease in the proportion of owner-occupiers, from 71% in 2000 to 63% in 2013/145.
Figure 1: Mortgage possession actions (actual and seasonally adjusted) in England & Wales, 2009 Q1 to 2015 Q4
2 Actions includes claims, orders, warrants of possession, and repossession by county court bailiffs
3 Including those not repossessed by county court bailiffs
4 At the end of September 2008, the base rate set by the Bank of England was 5%. By the end of March 2009 it was 0.5%, where it stayed for the rest of the period covered in this bulletin (see www.bankofengland.co.uk/statistics/Pages/default.aspx )
5 As stated in the English Housing Survey: www.gov.uk/government/collections/english-housing-survey

8
Claims issued: A possession claim is created when a claimant begins a legal action for an order for possession of property by making a claim that is then issued in a county court. There were 4,349 mortgage possession claims issued in October to December 2015, down 45% on the same quarter in 2014 (7,941). After seasonal adjustment, the number of claims was 4,378 down 8% on the previous quarter (4,781). In 2015, 19,853 claims were issued, a decrease of 52% compared to 2014. Both the annual and quarterly figures are the lowest recorded since the time series began 1987.

9
Map 1: Mortgage Claims in England & Wales by Local Authority, 2015 Q46,7
The number of mortgage claims per 100,000 households by local authority ranged from zero (City of London, Purbeck and West Devon) to 59 (Corby). There were three other areas with more than 40 mortgage possession claims per 100,000 households (Merthyr Tydfil, Knowsley and Hartlepool) whilst there were 15 other local authorities with less than five claims.
6 Household figures are based on the projections provided by the Department for Communities and Local Government (using ONS 2012-based methodology) and StatsWales (Welsh Government) (using ONS 2011-based methodology). Please see Annex C for more information
7 The Isles of Scilly have been excluded from analysis due to low numbers

10
Orders8: The court may grant an order following a judicial hearing which can be either for immediate possession (outright order) or suspended. There were a total of 2,932 orders in October to December 2015, down 48% on the number of orders in the same period in 2014 (5,634). Seasonally adjusted figures show a 13% decrease compared to the number of orders made in July to September 2015 (from 3,303 to 2863). In 2015 there were 14,022 orders a decrease of 53% compared to 2014. Both the annual and quarterly figures were the lowest since the time series began in 1987.
Forty three percent of mortgage possession orders made in October to December 2015 were suspended. From 2006 to2014, between 46% and 50% of orders were suspended each year - this proportion dropped to 43% in 2015.
Warrants of possession9: Having received an order, or if the terms of a suspended order are broken, the claimant can apply for a warrant of possession. There were 4,974 warrants of possession in October to December 2015, a 40% decrease on the same period in 2014 (8,321). Seasonally adjusted figures show a 20% decrease in the number of warrants on the previous quarter from 6,255 to 4,974. The total number of warrants issued in 2015 was 23,218, down 45% from the previous year (41,900). Both the annual and quarterly figures were the lowest since the time series began in 1987.
Repossessions in England and Wales by county court bailiffs: Once a warrant has been issued, county court bailiffs can repossess the property on behalf of the claimant. There were 1,150 repossessions by county court bailiffs in October to December 2015, down 53% on the same quarter in 2014 (2,434). Seasonally adjusted figures show a 16% decrease on the previous quarter from 1,394 to 1,169. The total number of repossessions in 2015 was 5,594, which is a 53% decrease on the number of repossessions in 2014. Both the annual and quarterly figures were the lowest since the time series began in 1987.
8 Between 2007 and 2009 changes to the method of data collection led to an over-estimate of the total number of orders and warrants. Please see A Guide to Civil and Administrative Justice Statistics for details.
9 Multiple warrants may be issued per claim

11
Map 2: Mortgage Repossessions by County Court Bailiff in England & Wales by Local Authority, 2015 Q410,11
Seventy-nine local authorities show no repossessions by county court bailiffs in October to December 2015 whilst the highest number of repossessions per 100,000 households was 22 (Maldon). There was one
10 Household figures are based on the projections provided by the Department for Communities and Local Government (using ONS 2012-based methodology) and StatsWales (Welsh Government) (using ONS 2011-based methodology). Please see Annex C for more information
11 The Isles of Scilly have been excluded from analysis due to low numbers

12
other area with more than 20 mortgage possession repossessions by county court bailiffs (Burnley).
All repossessions in the UK12: UK-wide, there were 2,500 repossessions in total in July to September 2015. This figure includes repossessions carried out by county court bailiffs and also other types of repossessions.
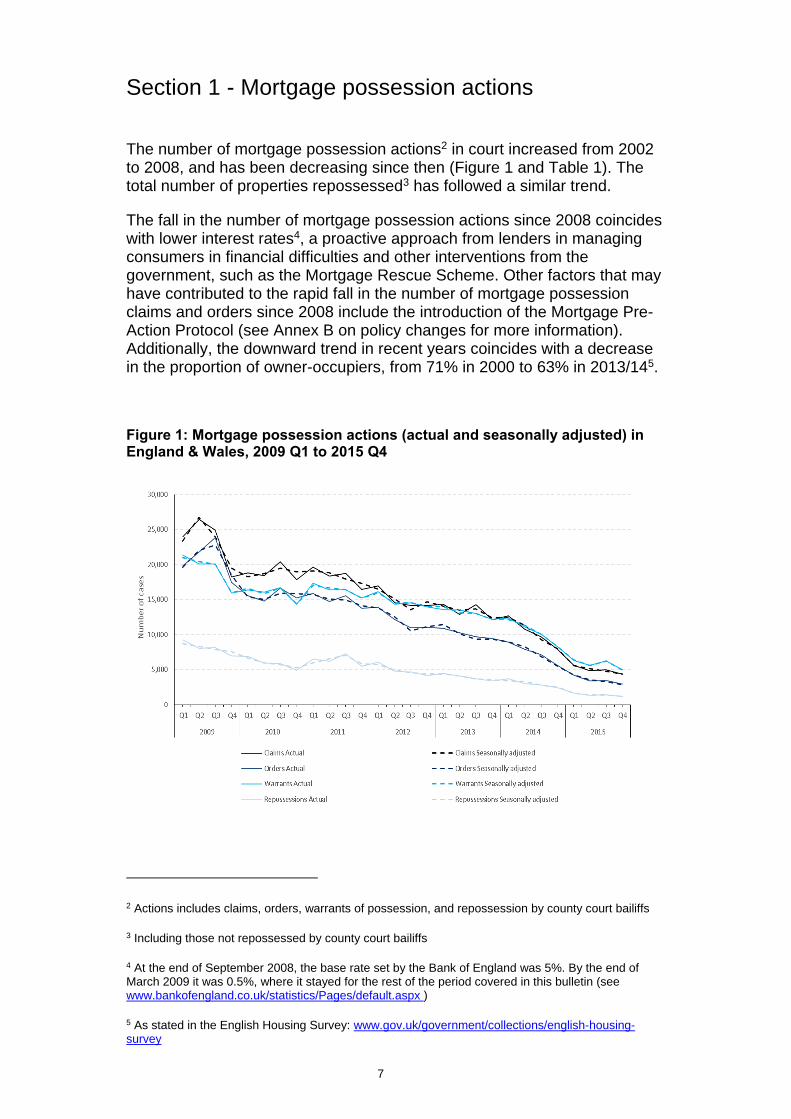
Case Timeliness: Figure 2 shows the average number of weeks taken since the initial claim for those orders, warrants and repossessions made by county court bailiffs in each quarter. Figure 3 shows the percentage of mortgage claims that reach each stage by the number of quarters since the claim was submitted.
Orders: The average number of weeks taken since initial claim has increased steadily from 12 weeks for orders made in 2005 to 15 weeks in 2012 and this remained relatively stable until 2014. Figures for 2015 show an increase in timeliness to 18 weeks. In October to December 2015 the figure stood at 18 weeks. Of those claims submitted in the past five years, 65% have currently progressed to orders. The majority of these (58%) progressed either within the same quarter or by the end of the quarter following that in which the claim was lodged.
Warrants: The average number of weeks taken since initial claim for warrants issued remained steady between 2005 and 2008, and ranged between 32 weeks and 33 weeks. The average began to rise sharply to 72 weeks in 2013 before falling slightly to 70 weeks in 2014. For those warrants recorded in 2015, it took on average 84 weeks from the initial claim, the longest recorded average time since records began. In October to December 2015, the figure stood at 86 weeks. Of those claims submitted in the past five years, 37% have currently progressed to warrants - 16% progressed either within the same quarter (2%) or by the end of the quarter following that in which the claim was lodged (14%).
Repossessions by County Court Bailiffs: The average time taken since initial claim for those repossessions made in the relevant period rose from 40 weeks in 2005 to 88 weeks in 2014 with a rapid increase from 2009 onwards. This increased by 19 weeks to 107 weeks in 2015. In October to December 2015 the figure stood at 116 weeks. Both the annual and quarterly figures are the highest since records began. Of the claims submitted in the past five years, 20% have progressed to repossessions; of which 6% have progressed in the quarter following the quarter in which the claim was lodged and 6% progressed in the subsequent quarter.
12 Information on actual mortgage repossessions is provided by the Council of Mortgage Lenders (CML) and is presented in this bulletin with a delay of three months. Please also note this figure relates to repossessions made in the United Kingdom whereas all other statistics in this bulletin relate to England and Wales. It should also be noted that these figures are rounded by the CML to the nearest hundred. For the most recent quarterly update on actual mortgage repossessions, please see the CML website: www.cml.org.uk/.
13
Figure 2: Average Number of Weeks taken from initial Mortgage Claim for Orders, Warrants and Repossessions made by county court bailiffs, in England and Wales 2009 – 2015 Q4
Figure 3: Percentage of Mortgage Claims that reach each Stage by the Number of Quarters since the Claim was Submitted, in England and Wales 2010 Q3 – 2015 Q4

14
Section 2 - Landlord possession actions
Annually, landlord possession claims decreased between 2002 and 2010 and subsequently increased until 2013. In 2015, this figure then fell (Figure 4 and Table 4) from 2014.
Figure 4: Number of landlord possession actions (actual and seasonally adjusted) in England & Wales, 2009 Q1 to 2015 Q4
Claims issued: A possession claim is created when a claimant begins a legal action for an order for possession of property by making a claim that is then issued in a county court. There were 36,601 landlord possession claims issued in October to December 2015, down 4% on the same quarter in 2014 (38,215). After seasonal adjustment, the number of claims was 37,426 in October to December 2015, a decrease of 2% on the previous quarter (38,047). The total number of possession claims issued in 2015 was 153,694, this reflects a 7% decrease on the total number of claims issued in 2014.
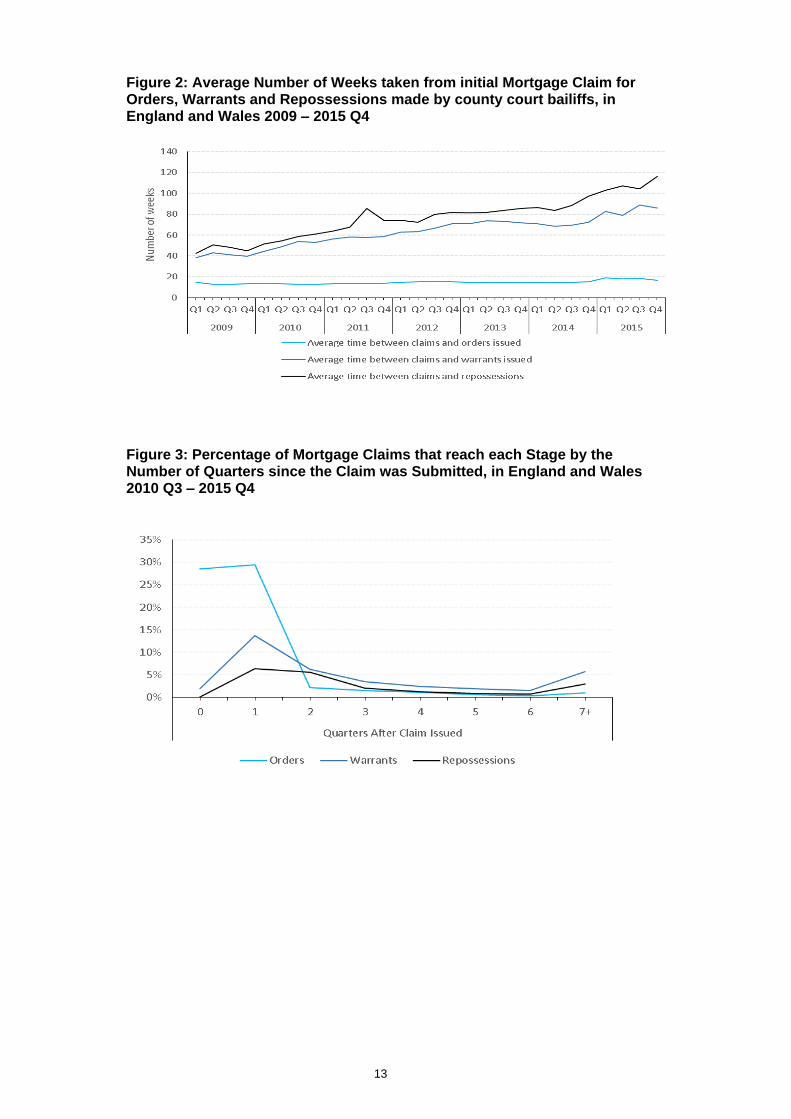
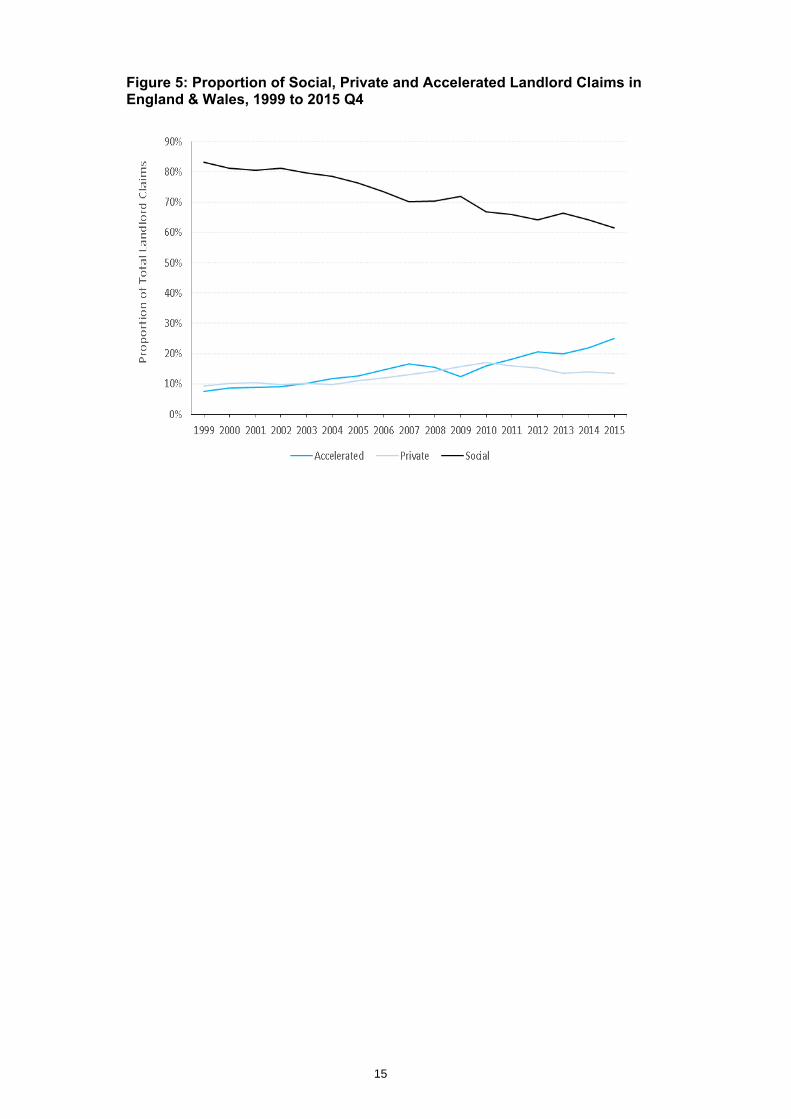
Within landlord possession claims, there are three types of claim: social landlord, private landlord and accelerated claims. Accelerated claims can be used by both private and social landlords under certain circumstances and are usually quicker than normal evictions. In October to December 2015, the majority of landlord possession claims (22,690 or 62%) were social landlord claims, 4,898 (13%) were private landlord claims and 9,013 (25%) were accelerated claims. The proportion of claims made using the accelerated procedure has increased from 7% in 1999 to 25% in 2015, whereas the proportion of claims from social landlords has fallen from 83% in 1999 to 62% in 2015. The proportion of claims made by private landlords increased from 9% in 1999 to 17% in 2010, before falling to 13% in 2015 (Figure 5).
15
Figure 5: Proportion of Social, Private and Accelerated Landlord Claims in England & Wales, 1999 to 2015 Q4
16
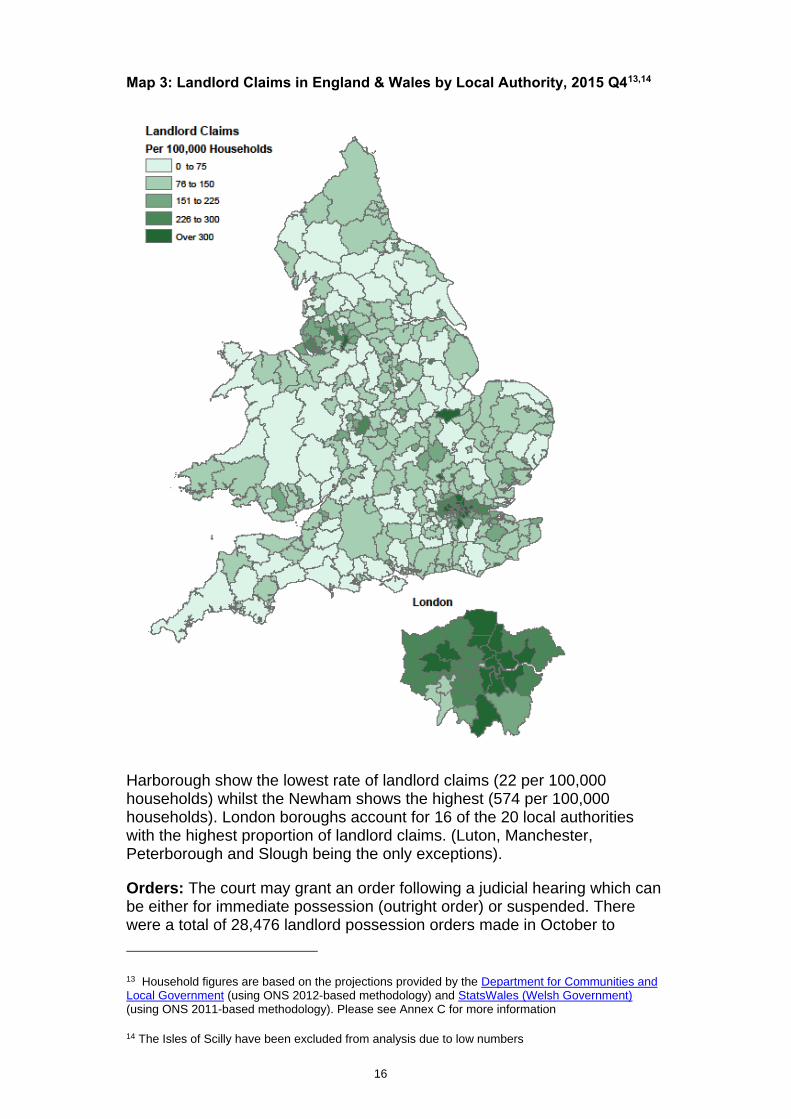
Map 3: Landlord Claims in England & Wales by Local Authority, 2015 Q413,14
Harborough show the lowest rate of landlord claims (22 per 100,000 households) whilst the Newham shows the highest (574 per 100,000 households). London boroughs account for 16 of the 20 local authorities with the highest proportion of landlord claims. (Luton, Manchester, Peterborough and Slough being the only exceptions).
Orders: The court may grant an order following a judicial hearing which can be either for immediate possession (outright order) or suspended. There were a total of 28,476 landlord possession orders made in October to
13 Household figures are based on the projections provided by the Department for Communities and Local Government (using ONS 2012-based methodology) and StatsWales (Welsh Government) (using ONS 2011-based methodology). Please see Annex C for more information
14 The Isles of Scilly have been excluded from analysis due to low numbers
17
December 2015, down 6% on the number of orders in the same period in 2014 (30,391). Seasonally adjusted figures show a 2% decrease from the previous quarter (from 29,276 to 28,712).
In October to December 2015, 39% of landlord possession orders being made were suspended, the second lowest recorded since records began. In 2015, the total number of orders made was 118,481, down 7% compared to 2014 when the number was 127,270.
Warrants of possession15: Having received an order, or if the terms of a suspended order are broken, the claimant can apply for a warrant of possession. There were 18,644 warrants of possession in October to December 2015, a decrease of less than 1% on the same period in 2014 (18,727). Seasonally adjusted figures show a 1% decrease compared to the last quarter, from 19,374 to 19,174. The total number of warrants issued in 2015 was 77,600, down 1% on 2014 (78,268).
Repossessions by county court bailiffs: Once a warrant has been issued county court bailiffs can repossess the property on behalf of the claimant. There were 9,775 landlord repossessions by county court bailiffs in October to December 2015, down 6% on the same period in 2014 (10,382). Seasonally adjusted figures also show a 6% decrease compared to last quarter, from 10,862 to 10,175. The total number of repossessions in 2015 was 42,728, up 2% on 2014 (41,967).
Annually, the trend in repossessions by county court bailiffs differs to that seen in claims, orders and warrants. This can be attributed to the time it takes for claims to be processed through to the repossession stage. The number of landlord possession claims peaked in January to March 2014 and are most likely to be working their way through the system. October to December 2015 was the first quarter in recent years that showed a decrease in the number of repossession by county court bailiffs.
15 Multiple warrants may be issued per claim
18
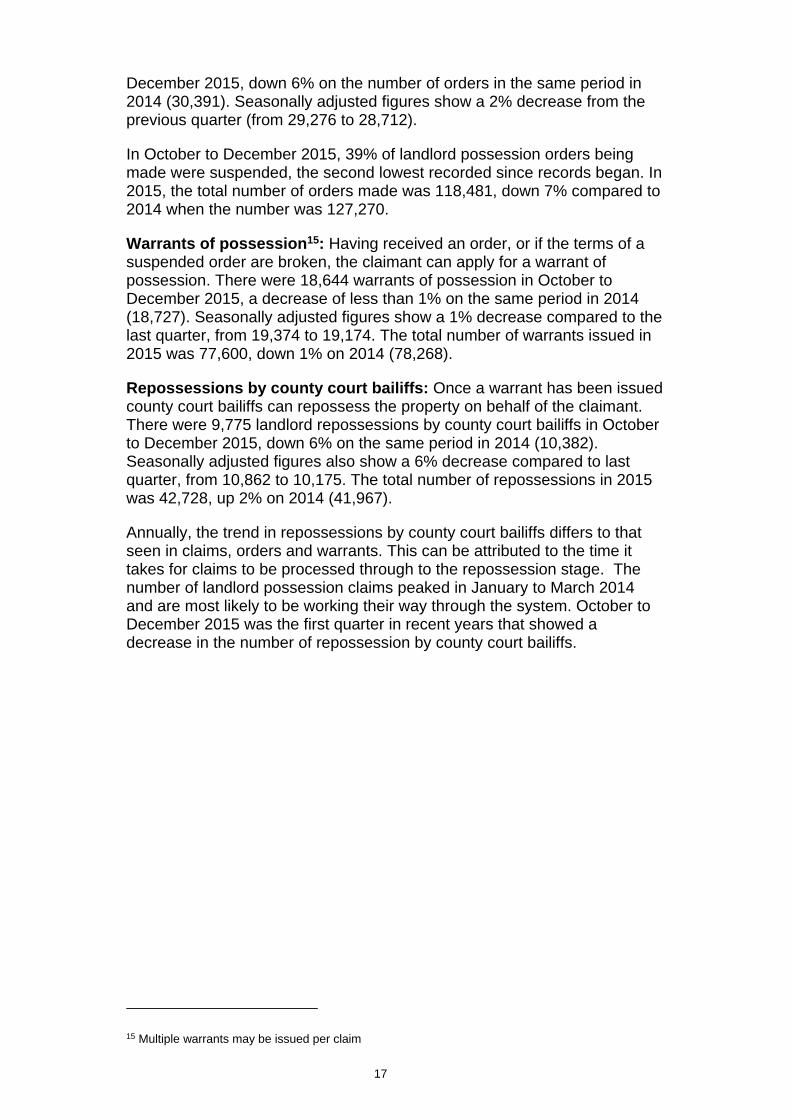
Map 4: Landlord Repossessions by County Court Bailiff in England & Wales by Local Authority, 2015 Q416,17
There were 8 local authorities who show 3 or less landlord repossessions by county court bailiffs in July to September 2015 (City of London, Isle of Anglesey, Lewes, Waverley, North Kesteven, Monmouthshire, Selby and Tonbridge). The London borough of Newham had the highest number (191 per 100,000 households in the area). London local authorities account for
16 Household figures are based on the projections provided by the Department for Local Government and Communities (using ONS 2012-based methodology) and StatsWales (Welsh Government) (using ONS 2011-based methodology). Please see Annex C for more information
17 The Isles of Scilly have been excluded from analysis due to low numbers

19
16 of the 20 boroughs with the highest proportion of landlord repossessions (Harlow, Luton, Medway, and Slough being the only exceptions).
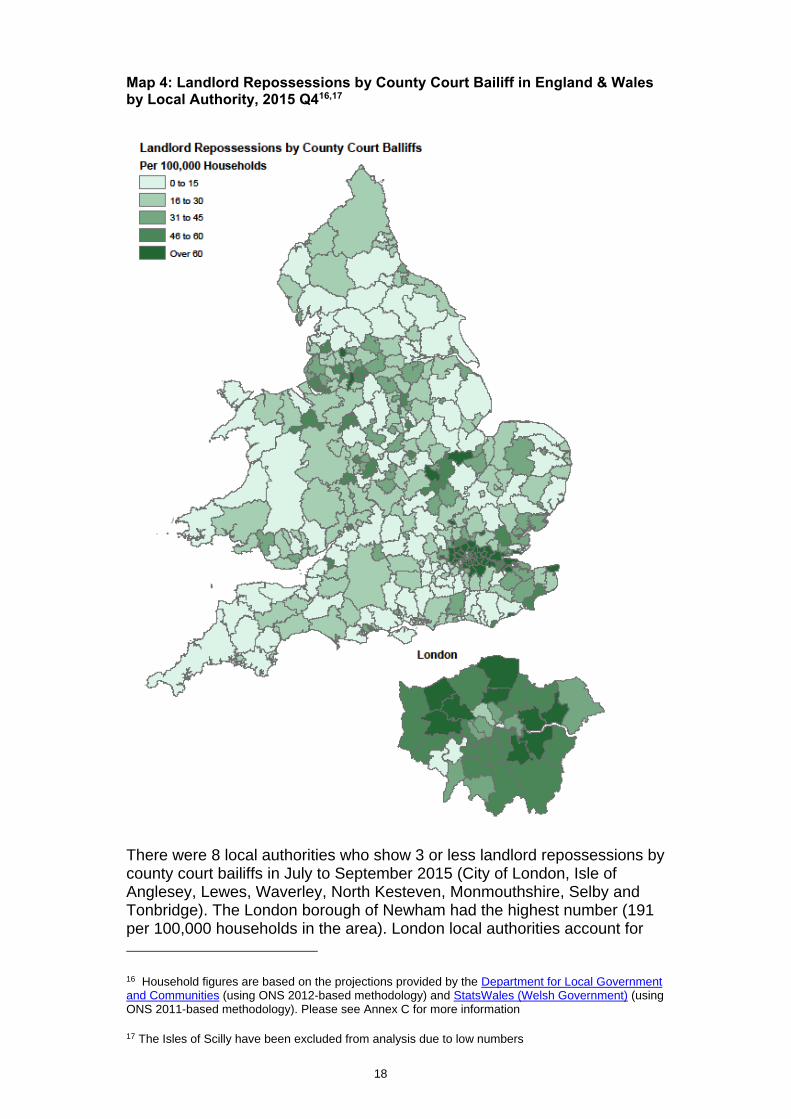
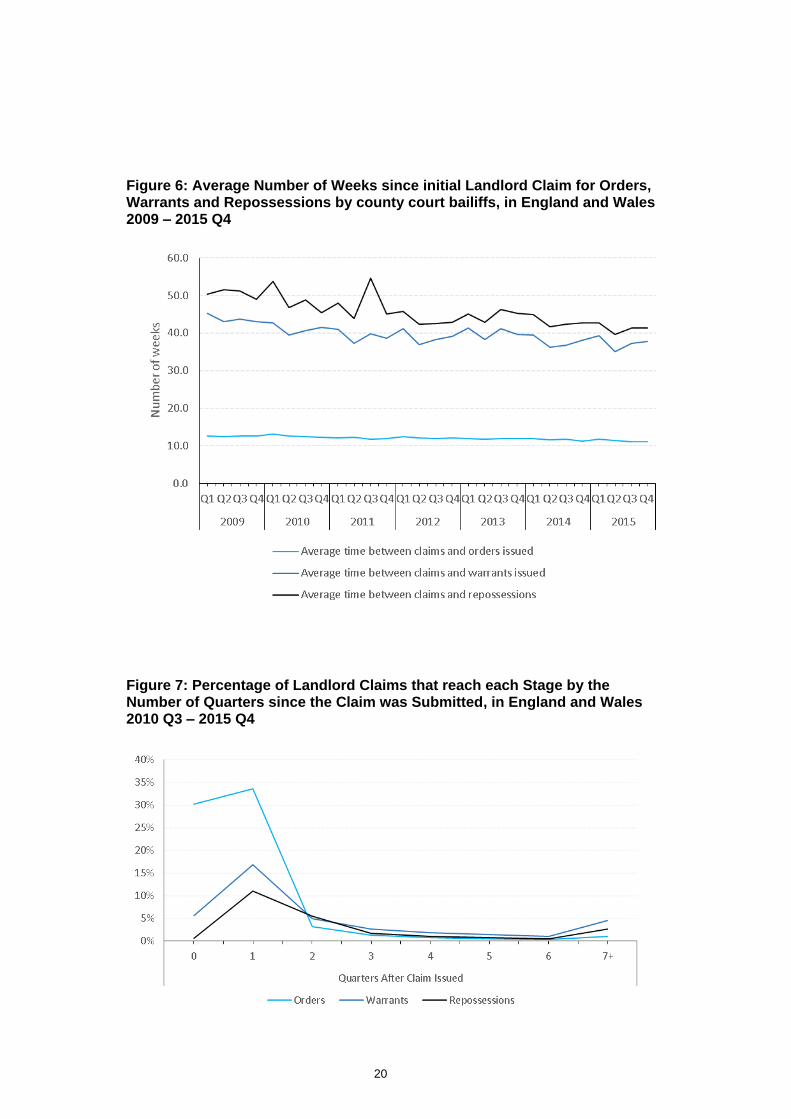
Case Timeliness: Figure 6 shows that the average number of weeks taken from initial claim for those orders, warrants and repossessions by county court bailiffs made in each quarter. Figure 7 shows the percentage of landlord claims that reach each stage by the number of quarters since the claim was submitted.
Orders: Annually, the average number of weeks taken from initial claim remained steady for those order made from 2005 to 2015, ranging from 11 weeks to 13 weeks with 2015 averaging 12 weeks.. The trend has continued this quarter, with the average time taken for orders issued in October to December 2015 from initial claim standing at 11 weeks. Of the claims submitted in the past 5 years, 71% have currently progressed to orders. The majority of these (64%) have progressed by the end of the quarter following the quarter in which the claim was lodged.
Warrants: Annually, the average number of weeks taken since the initial claim for warrants issued each year has been steadily decreasing from 44 weeks in 2005 to 37 weeks in 2015; although there was a small increase to 40 weeks in 2013. The average time taken from initial claim for warrants issued in October to December 2015 was at 38 weeks. Of the claims submitted in the past 5 years, 39% have currently progressed to warrants. Over a half of these (23%) have progressed by the end of the quarter following the quarter in which the claim was lodged.
Repossessions by County Court Bailiffs: Annually, for those repossessions made each year, the average number of weeks since the initial claim rose from 45 weeks in 2005 to 51 weeks in 2009. Since then, it has been steadily decreasing, and was 41 weeks in 2015. The average time taken from initial claim for repossessions orders made by county court bailiffs in October to December 2015 was also 41 weeks. Of the claims submitted in the past 5 years, 24% have progressed to repossessions; of which half (12%) progressed by the end of the quarter following the quarter in which the claim was lodged and 11% have progressed in the subsequent quarter.
20
Figure 6: Average Number of Weeks since initial Landlord Claim for Orders, Warrants and Repossessions by county court bailiffs, in England and Wales 2009 – 2015 Q4
Figure 7: Percentage of Landlord Claims that reach each Stage by the Number of Quarters since the Claim was Submitted, in England and Wales 2010 Q3 – 2015 Q4
21
Annex A - Further information
Supplementary tables and CSV datasets are available alongside this bulletin, allowing users to analyse the data themselves.
The following tables are available, showing data for county courts in England and Wales:
Table 1, Mortgage possession workload in the county courts, 1987 - 2015 Q4
Table 2, Mortgage possession claims that lead to orders, warrants, and repossessions in the county courts, 1999 - 2015 Q4
Table 3a, Average (mean) time in weeks for mortgage possession claims to become an order, warrant and repossession, 2005 - 2015 Q4
Table 3b, Percentage of mortgage claims that reach the each stage by the number of quarters since the claim was submitted, 2011 Q1 - 2015 Q4
Table 4, Landlord possession workload in the county courts, 1999 - 2015 Q4
Table 5, Landlord possession claims that lead to orders, warrants, and repossessions in the county courts, 1999 - 2015 Q4
Table 6a, Average (mean) time in weeks for landlord possession claims to become an order, warrant and repossession, 2005 - 2015 Q4
Table 6b, Percentage of Landlord claims that reach the each stage by the number of quarters since the claim was submitted, 2011 Q1 - 2015 Q4
Table 7, Landlord possession claims in the county courts by type of procedure and landlord, 1999 - 2015 Q4
Table 8, Mortgage and landlord possession workload in the county courts, England, 1999 - 2015 Q4
Table 9, Mortgage and landlord possession workload in the county courts, Wales, 1999 - 2015 Q4
Table 10a, Seasonally adjusted mortgage possession actions in the county courts, 2009 - 2015 Q4
Table 10b, Seasonally adjusted landlord possession actions in the county courts, 2009 - 2015 Q4
22
The CSV datasets contain local authority and court-level breakdowns of claims, orders, warrants and county court bailiff repossessions for England and Wales, for the full amount of time that data are available. Where the value is between 1 and 5, the value is suppressed and shown as “-” to protect the confidentiality of those involved in the claim, order, warrant or repossession. For this reason, the national total number of claims, orders etc. from these datasets will not match the published totals provided in the Excel tables, although the differences are generally small.
For more information, please refer to the separately downloadable Guide to local authority and court-level information, which can be found in the CSV zip folder, which accompanies this publication. Information on the representation status of claimants and defendants in repossession cases can be found in Civil Statistics Quarterly at www.gov.uk/government/collections/civil-justice-statistics-quarterly

23
Annex B: Policy changes
New Bailiff Laws
New laws came into effect on 6 April 2014 to bring an end to bad and aggressive bailiff behaviour, while making sure businesses, local authorities and others can still fairly enforce debts owed to them. These reforms are part of a wider package under changes to the Tribunals, Courts & Enforcement Act 2007.
With roughly 4 million debts collected each year, in future only bailiffs who have been trained and received certification will be allowed to practise. Bailiffs will be banned from entering homes at night and from using physical force against debtors. The changes will also prevent bailiffs from entering properties where only children are at home and includes further measures to protect vulnerable people. Bailiffs will be prevented from taking vital household essentials from debtor’s property, such as a cooker, microwave, refrigerator or washing machines.
A new set of fixed fees for debtors has also been introduced, to end the previous situation where bailiffs were setting their own fees – sometimes at very high levels – and adding these to the amount people in debt had to pay.
Introduction of Mortgage Pre-Action Protocol
A Mortgage Pre-Action Protocol (MPAP), approved by the Master of the Rolls, for possession claims relating to mortgage or home purchase plan arrears came into effect on 19 November 2008. The protocol applies to mortgage arrears on:
First charge residential mortgages and home purchase plans regulated by the Financial Service Authority under the Financial Services and Market Act 2000;
Third charge mortgages for residential property and other secured loans regulated under the Consumer Credit Act 1974 on residential property; and,
Unregulated residential mortgages.
The Protocol gives clear guidance on what the courts expect lenders and borrowers to have done prior to a claim being issued. The main aims of it were to ensure that the parties act fairly and reasonably with each other in any matters concerning the mortgage arrears, to encourage more pre action contact between lender and borrower and to enable efficient use of the court’s time and resources.
24
The introduction of the MPAP coincided with a fall of around 50% in the daily and weekly numbers of new mortgage repossession claims being issued in the courts as evidenced from administrative records. As orders are typically made (when deemed necessary by a judge) around 7 weeks (using 2011 data) after claims are issued, the downward impact on the number of mortgage possession orders being made was seen in the first quarter of 2009.
It has not been possible to adequately quantify the long term impact of the MPAP. This reflects the lack of a good comparator (although the MPAP was not introduced in Scotland, the big lenders in Scotland also operate south of the border and so lender behaviour is likely to be the same as in England and Wales), and the existence of other factors such as changing economic conditions, other measures introduced shortly after the MPAP, and lenders desire to minimise their losses.
More details about the protocol can be viewed using the link:
www.justice.gov.uk/guidance/courts-and-tribunals/courts/procedure-rules/civil/contents/protocols/prot_mha.htm
25
Annex C: Maps
The household projections used to produce the maps are based off the Department for Communities and Local Government 2012-based projections (which cover all local authorities in England) www.gov.uk/government/collections/household-projections and StatsWales’ 2011-based projections (which cover all local authorities within Wales) statswales.wales.gov.uk/Catalogue/Housing/Households/Projections/Local-Authority/2011-Based . Both are the latest datasets available for the areas they cover.
In addition to this, the boundary lines were drawn using the Great Britain local authority districts (LADs) from the ONS Geoportal (geoportal.statistics.gov.uk/geoportal/catalog/main/home.page) which contains the digital vector boundaries for LADs in Great Britain as of December 2014. Therefore, the maps created may not reflect any boundary changes that may have occurred in 2015.
26
Annex D: Explanatory notes
The United Kingdom Statistics Authority has designated these statistics as National Statistics, in accordance with the Statistics and Registration Service Act 2007 and signifying compliance with the Code of Practice for Official Statistics. Designation can be broadly interpreted to mean that the statistics:
meet identified user needs;
are well explained and readily accessible;
are produced according to sound methods, and
are managed impartially and objectively in the public interest.
Once statistics have been designated as National Statistics, it is a statutory requirement that the Code of Practice shall continue to be observed.
The statistics in this bulletin relate to cases in the county courts in England and Wales. Calendar year statistics are also provided.
Revisions
The statistics in the latest quarter are provisional, and are therefore liable to revision to take account of any late amendments to the administrative databases from which these statistics are sourced. The standard process for revising the published statistics to account for these late amendments is as follows:
An initial revision to the statistics for the latest quarter may be made when the next edition of this bulletin is published. Further revisions may be made when the figures are reconciled at the end of the year. If revisions are needed in the subsequent year, these will be clearly annotated in the tables.
For more information please see the Guide to Civil and Administrative Justice Statistics.
Symbols and conventions
The following symbols have been used throughout the tables in this bulletin:
.. no data available - Between one and five. Low numbers are suppressed to prevent individuals being identified (r) Revised data (p) Provisional data
27
Contact points for further information
Current and previous editions of this publication are available for download at:
www.gov.uk/government/collections/mortgage-and-landlord-possession-statistics
Press enquiries should be directed to the Ministry of Justice press office:
Sebastian Walters Tel: 0203 334 3529 Email: [email protected]
Queries on the wider policy implications of these statistics should be directed to the Department for Communities and Local Government’s press office:
Matthew Gorman Email: [email protected];
Queries on statistics shown for ‘Properties taken into possession’ and other related statistics should be directed to the Council of Mortgage Lenders’ press office on 020 7438 8922.
Other enquiries about these statistics should be directed to:
Alison Colquhoun Justice Statistics Analytical Services 7th Floor Ministry of Justice 102 Petty France London SW1H 9AJ Email: [email protected]
Other National Statistics publications, and general information about the official statistics system of the UK, are available from statisticsauthority.gov.uk/about-the-authority/uk-statistical-system
© Crown copyright Produced by the Ministry of Justice
Alternative formats are available on request from [email protected]