Embed Size (px)
Citation preview
Mornington Harbour Wave Investigation
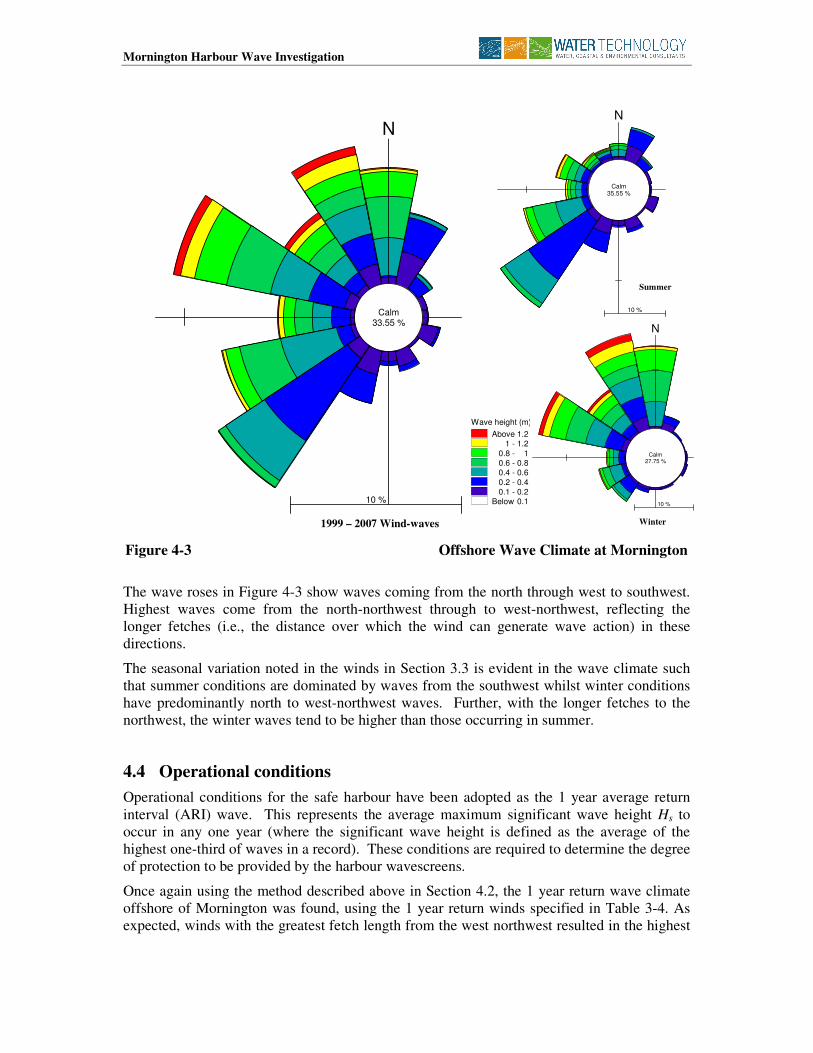
Figure 4-3 Offshore Wave Climate at Mornington
The wave roses in Figure 4-3 show waves coming from the north through west to southwest.
Highest waves come from the north-northwest through to west-northwest, reflecting the
longer fetches (i.e., the distance over which the wind can generate wave action) in these
directions.
The seasonal variation noted in the winds in Section 3.3 is evident in the wave climate such
that summer conditions are dominated by waves from the southwest whilst winter conditions
have predominantly north to west-northwest waves. Further, with the longer fetches to the
northwest, the winter waves tend to be higher than those occurring in summer.
4.4 Operational conditions
Operational conditions for the safe harbour have been adopted as the 1 year average return
interval (ARI) wave. This represents the average maximum significant wave height Hs to
occur in any one year (where the significant wave height is defined as the average of the
highest one-third of waves in a record). These conditions are required to determine the degree
of protection to be provided by the harbour wavescreens.
Once again using the method described above in Section 4.2, the 1 year return wave climate
offshore of Mornington was found, using the 1 year return winds specified in Table 3-4. As
expected, winds with the greatest fetch length from the west northwest resulted in the highest
Wave height (m)
Above 1.21 - 1.2
0.8 - 10.6 - 0.80.4 - 0.6
0.2 - 0.40.1 - 0.2
Below 0.1
N
Calm33.55 %
10 %
N
Calm35.55 %
10 %
N
Calm27.75 %
10 %
1999 – 2007 Wind-waves
Summer
Winter
Mornington Harbour Wave Investigation
J648/R01-W, October 2008, Rev 07 Page 14
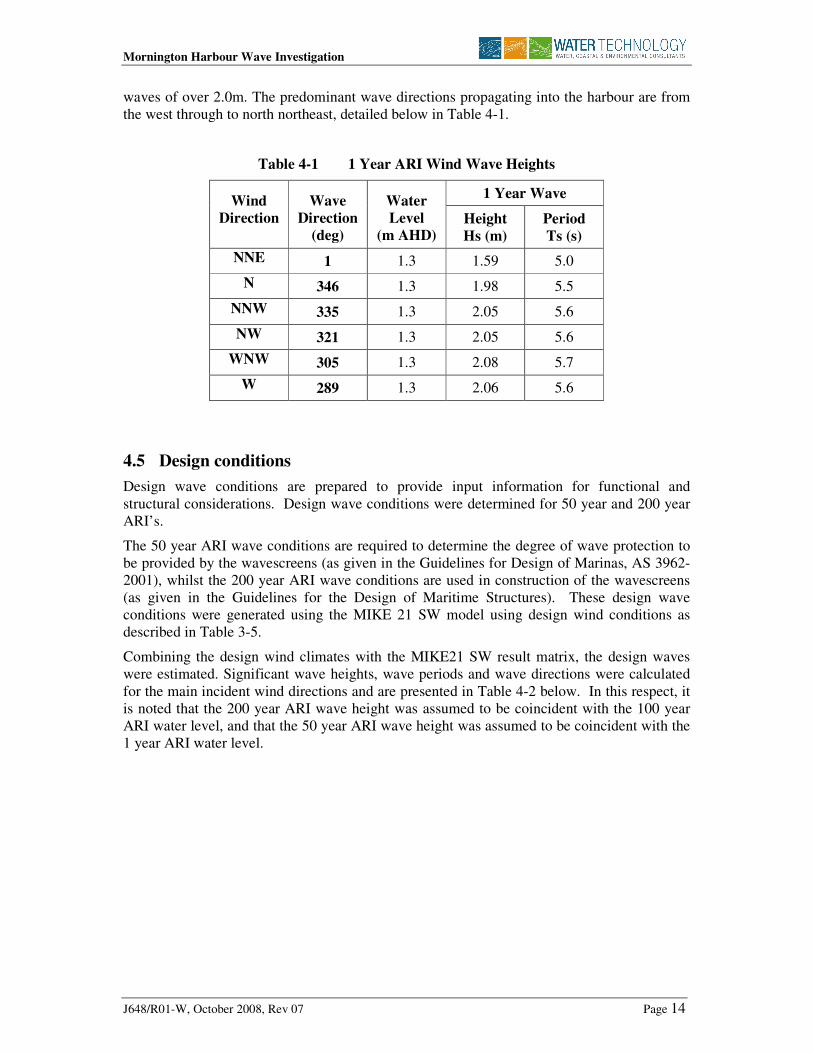
waves of over 2.0m. The predominant wave directions propagating into the harbour are from
the west through to north northeast, detailed below in Table 4-1.
Table 4-1 1 Year ARI Wind Wave Heights
Wind
Direction
Wave
Direction
(deg)
Water
Level
(m AHD)
1 Year Wave
Height
Hs (m)
Period
Ts (s)
NNE 1 1.3 1.59 5.0
N 346 1.3 1.98 5.5
NNW 335 1.3 2.05 5.6
NW 321 1.3 2.05 5.6
WNW 305 1.3 2.08 5.7
W 289 1.3 2.06 5.6
4.5 Design conditions
Design wave conditions are prepared to provide input information for functional and
structural considerations. Design wave conditions were determined for 50 year and 200 year
ARI’s.
The 50 year ARI wave conditions are required to determine the degree of wave protection to
be provided by the wavescreens (as given in the Guidelines for Design of Marinas, AS 3962-
2001), whilst the 200 year ARI wave conditions are used in construction of the wavescreens
(as given in the Guidelines for the Design of Maritime Structures). These design wave
conditions were generated using the MIKE 21 SW model using design wind conditions as
described in Table 3-5.
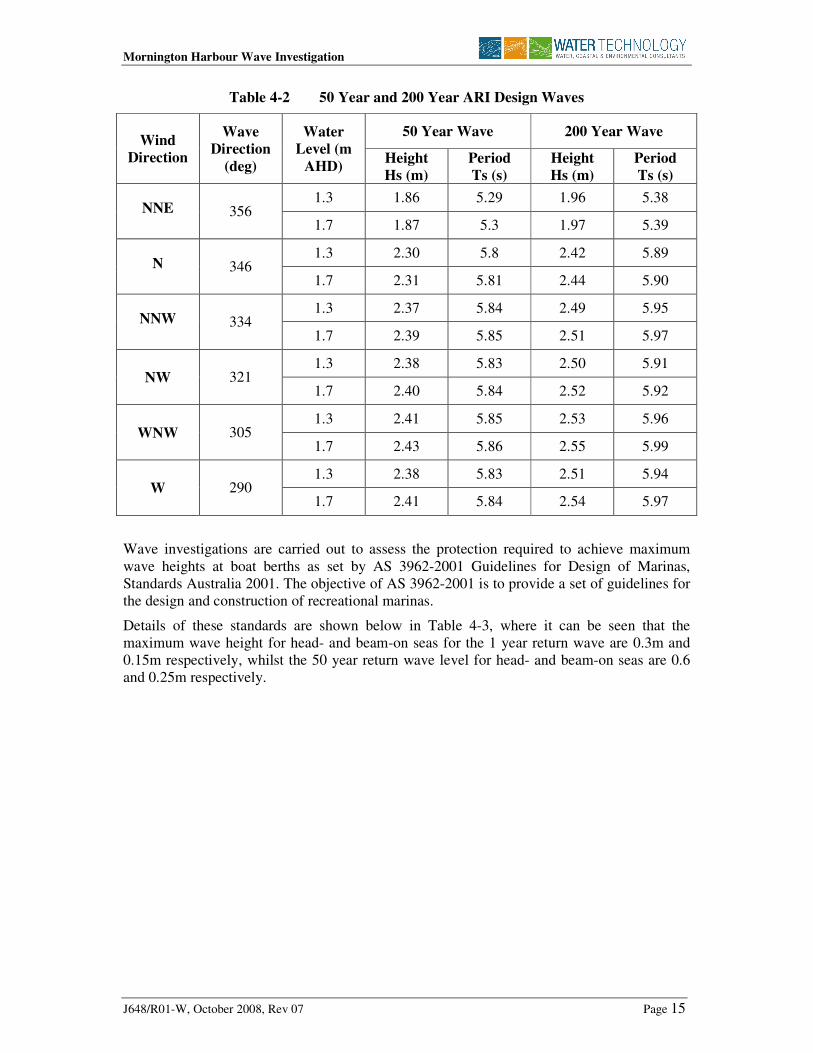
Combining the design wind climates with the MIKE21 SW result matrix, the design waves
were estimated. Significant wave heights, wave periods and wave directions were calculated
for the main incident wind directions and are presented in Table 4-2 below. In this respect, it
is noted that the 200 year ARI wave height was assumed to be coincident with the 100 year
ARI water level, and that the 50 year ARI wave height was assumed to be coincident with the
1 year ARI water level.
Mornington Harbour Wave Investigation
J648/R01-W, October 2008, Rev 07 Page 15
Table 4-2 50 Year and 200 Year ARI Design Waves
Wind
Direction
Wave
Direction
(deg)
Water
Level (m
AHD)
50 Year Wave 200 Year Wave
Height
Hs (m)
Period
Ts (s)
Height
Hs (m)
Period
Ts (s)
NNE 356 1.3 1.86 5.29 1.96 5.38
1.7 1.87 5.3 1.97 5.39
N 346 1.3 2.30 5.8 2.42 5.89
1.7 2.31 5.81 2.44 5.90
NNW 334 1.3 2.37 5.84 2.49 5.95
1.7 2.39 5.85 2.51 5.97
NW 321 1.3 2.38 5.83 2.50 5.91
1.7 2.40 5.84 2.52 5.92
WNW 305 1.3 2.41 5.85 2.53 5.96
1.7 2.43 5.86 2.55 5.99
W 290 1.3 2.38 5.83 2.51 5.94
1.7 2.41 5.84 2.54 5.97
Wave investigations are carried out to assess the protection required to achieve maximum
wave heights at boat berths as set by AS 3962-2001 Guidelines for Design of Marinas,
Standards Australia 2001. The objective of AS 3962-2001 is to provide a set of guidelines for
the design and construction of recreational marinas.
Details of these standards are shown below in Table 4-3, where it can be seen that the
maximum wave height for head- and beam-on seas for the 1 year return wave are 0.3m and
0.15m respectively, whilst the 50 year return wave level for head- and beam-on seas are 0.6
and 0.25m respectively.
Mornington Harbour Wave Investigation
J648/R01-W, October 2008, Rev 07 Page 16
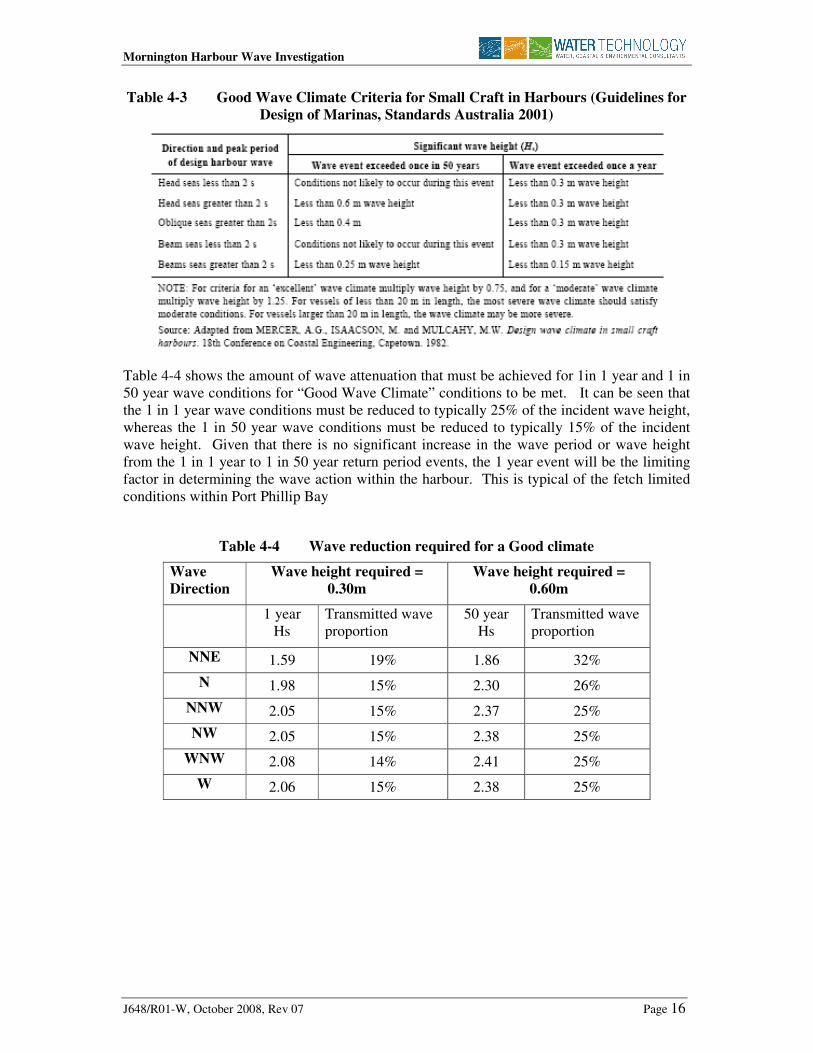
Table 4-3 Good Wave Climate Criteria for Small Craft in Harbours (Guidelines for
Design of Marinas, Standards Australia 2001)
Table 4-4 shows the amount of wave attenuation that must be achieved for 1in 1 year and 1 in
50 year wave conditions for “Good Wave Climate” conditions to be met. It can be seen that
the 1 in 1 year wave conditions must be reduced to typically 25% of the incident wave height,
whereas the 1 in 50 year wave conditions must be reduced to typically 15% of the incident
wave height. Given that there is no significant increase in the wave period or wave height
from the 1 in 1 year to 1 in 50 year return period events, the 1 year event will be the limiting
factor in determining the wave action within the harbour. This is typical of the fetch limited
conditions within Port Phillip Bay
Table 4-4 Wave reduction required for a Good climate
Wave
Direction
Wave height required =
0.30m
Wave height required =
0.60m
1 year
Hs
Transmitted wave
proportion
50 year
Hs
Transmitted wave
proportion
NNE 1.59 19% 1.86 32%
N 1.98 15% 2.30 26%
NNW 2.05 15% 2.37 25%
NW 2.05 15% 2.38 25%
WNW 2.08 14% 2.41 25%
W 2.06 15% 2.38 25%
Mornington Harbour Wave Investigation
J648/R01-W, October 2008, Rev 07 Page 17
5 BOUSSINESQ WAVE MODELLING
To investigate the effect on wave conditions in and adjacent to the proposed Mornington Safe
Harbour, Boussinesq wave modelling was undertaken. A numerical wave model was
developed using DHI Software’s MIKE 21 Boussinesq Wave (BW) module (see Section
2.1.2).
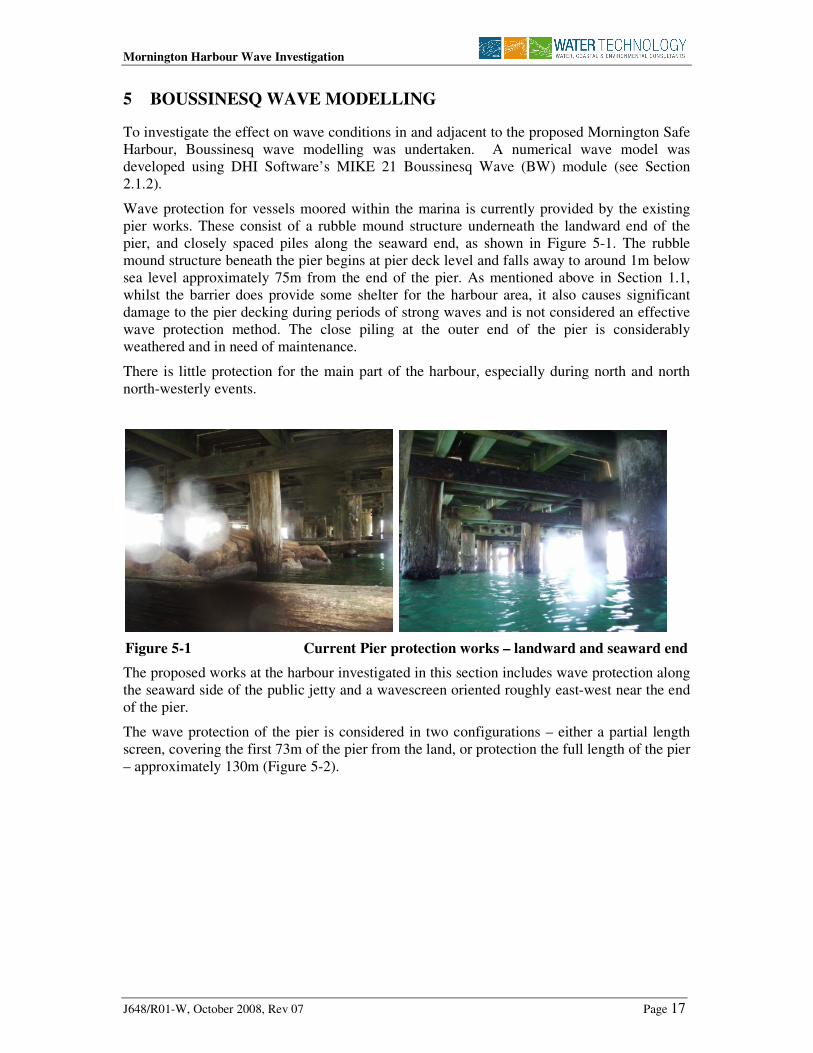
Wave protection for vessels moored within the marina is currently provided by the existing
pier works. These consist of a rubble mound structure underneath the landward end of the
pier, and closely spaced piles along the seaward end, as shown in Figure 5-1. The rubble
mound structure beneath the pier begins at pier deck level and falls away to around 1m below
sea level approximately 75m from the end of the pier. As mentioned above in Section 1.1,
whilst the barrier does provide some shelter for the harbour area, it also causes significant
damage to the pier decking during periods of strong waves and is not considered an effective
wave protection method. The close piling at the outer end of the pier is considerably
weathered and in need of maintenance.
There is little protection for the main part of the harbour, especially during north and north
north-westerly events.
Figure 5-1 Current Pier protection works – landward and seaward end
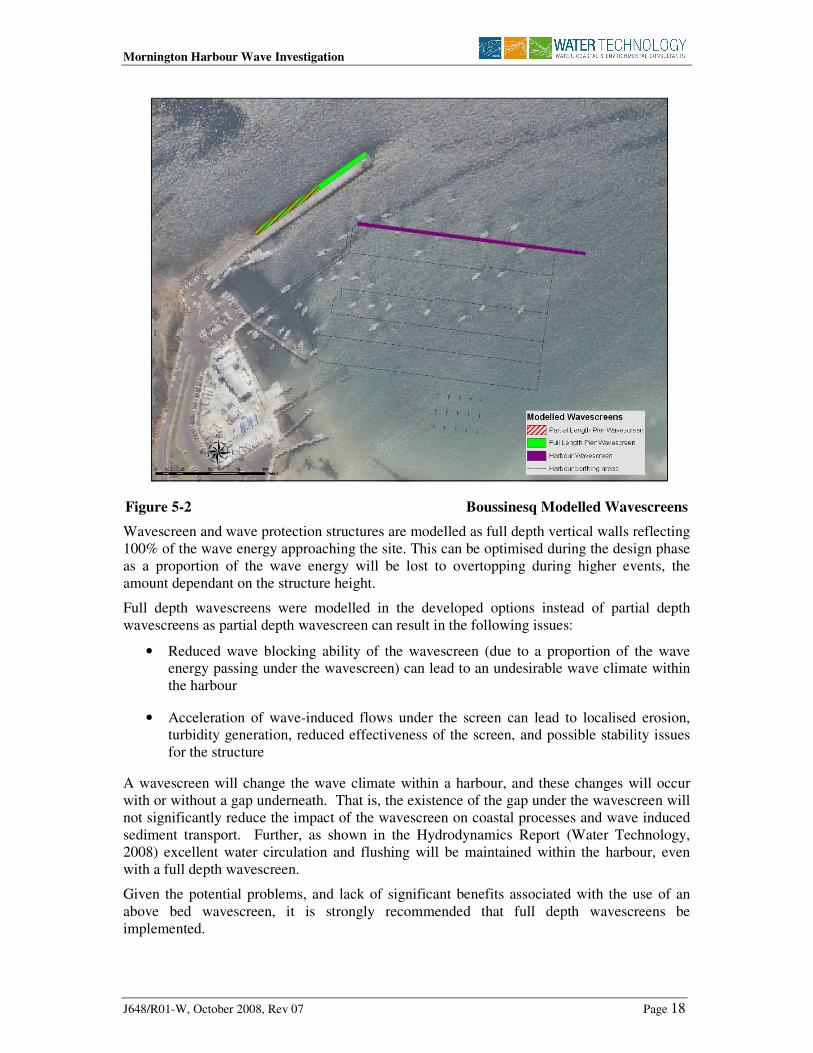
The proposed works at the harbour investigated in this section includes wave protection along
the seaward side of the public jetty and a wavescreen oriented roughly east-west near the end
of the pier.
The wave protection of the pier is considered in two configurations – either a partial length
screen, covering the first 73m of the pier from the land, or protection the full length of the pier
– approximately 130m (Figure 5-2).
Mornington Harbour Wave Investigation
J648/R01-W, October 2008, Rev 07 Page 18
Figure 5-2 Boussinesq Modelled Wavescreens
Wavescreen and wave protection structures are modelled as full depth vertical walls reflecting
100% of the wave energy approaching the site. This can be optimised during the design phase
as a proportion of the wave energy will be lost to overtopping during higher events, the
amount dependant on the structure height.
Full depth wavescreens were modelled in the developed options instead of partial depth
wavescreens as partial depth wavescreen can result in the following issues:
• Reduced wave blocking ability of the wavescreen (due to a proportion of the wave
energy passing under the wavescreen) can lead to an undesirable wave climate within
the harbour
• Acceleration of wave-induced flows under the screen can lead to localised erosion,
turbidity generation, reduced effectiveness of the screen, and possible stability issues
for the structure
A wavescreen will change the wave climate within a harbour, and these changes will occur
with or without a gap underneath. That is, the existence of the gap under the wavescreen will
not significantly reduce the impact of the wavescreen on coastal processes and wave induced
sediment transport. Further, as shown in the Hydrodynamics Report (Water Technology,
2008) excellent water circulation and flushing will be maintained within the harbour, even
with a full depth wavescreen.
Given the potential problems, and lack of significant benefits associated with the use of an
above bed wavescreen, it is strongly recommended that full depth wavescreens be
implemented.
Mornington Harbour Wave Investigation
J648/R01-W, October 2008, Rev 07 Page 19
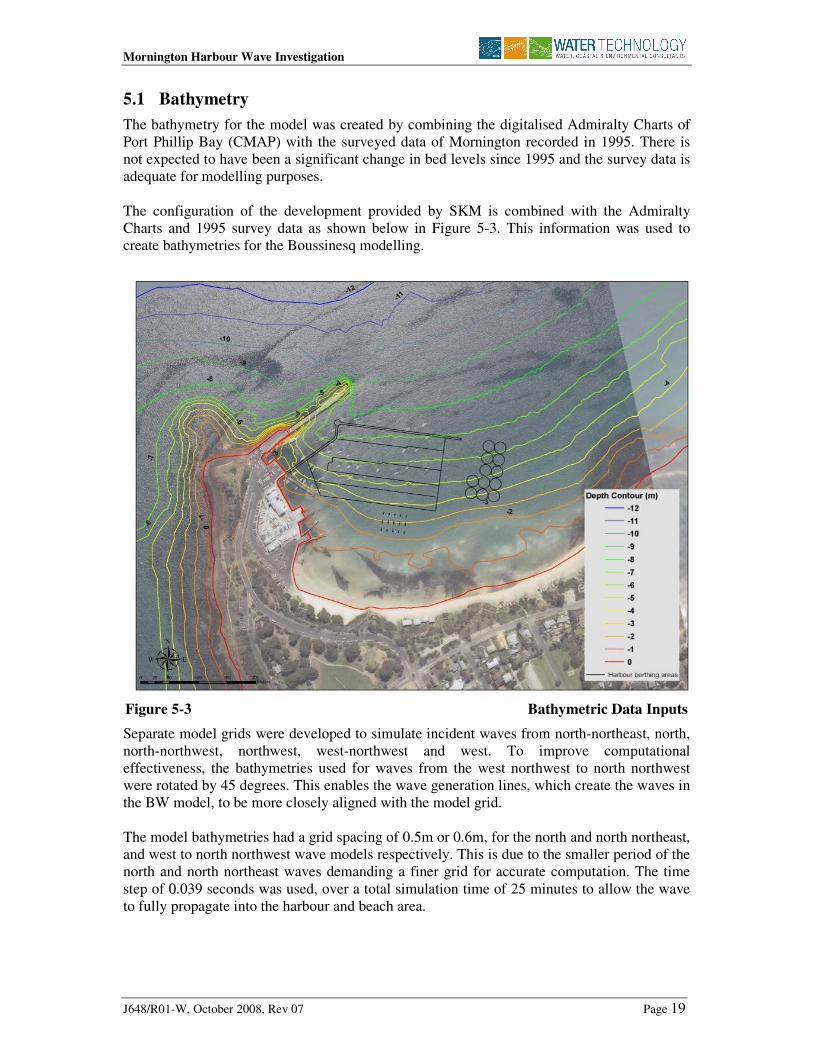
5.1 Bathymetry
The bathymetry for the model was created by combining the digitalised Admiralty Charts of
Port Phillip Bay (CMAP) with the surveyed data of Mornington recorded in 1995. There is
not expected to have been a significant change in bed levels since 1995 and the survey data is
adequate for modelling purposes.
The configuration of the development provided by SKM is combined with the Admiralty
Charts and 1995 survey data as shown below in Figure 5-3. This information was used to
create bathymetries for the Boussinesq modelling.
Figure 5-3 Bathymetric Data Inputs
Separate model grids were developed to simulate incident waves from north-northeast, north,
north-northwest, northwest, west-northwest and west. To improve computational
effectiveness, the bathymetries used for waves from the west northwest to north northwest
were rotated by 45 degrees. This enables the wave generation lines, which create the waves in
the BW model, to be more closely aligned with the model grid.
The model bathymetries had a grid spacing of 0.5m or 0.6m, for the north and north northeast,
and west to north northwest wave models respectively. This is due to the smaller period of the
north and north northeast waves demanding a finer grid for accurate computation. The time
step of 0.039 seconds was used, over a total simulation time of 25 minutes to allow the wave
to fully propagate into the harbour and beach area.
Mornington Harbour Wave Investigation
J648/R01-W, October 2008, Rev 07 Page 20
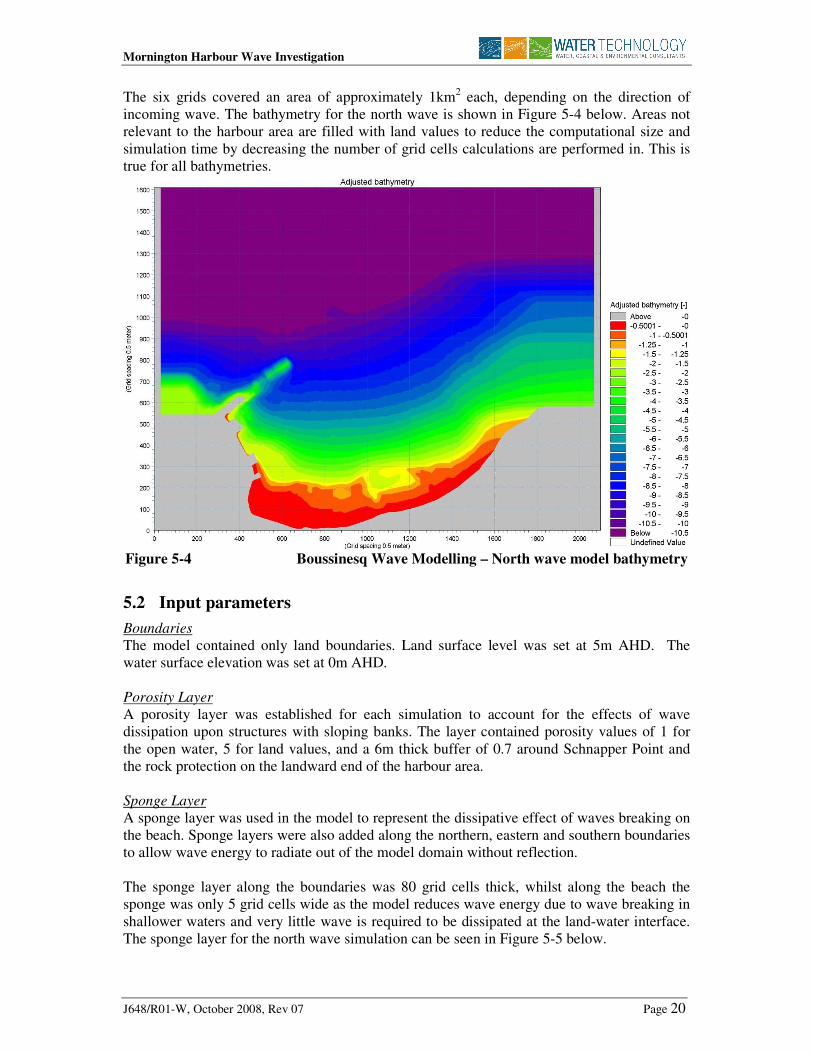
The six grids covered an area of approximately 1km2 each, depending on the direction of
incoming wave. The bathymetry for the north wave is shown in Figure 5-4 below. Areas not
relevant to the harbour area are filled with land values to reduce the computational size and
simulation time by decreasing the number of grid cells calculations are performed in. This is
true for all bathymetries.
Figure 5-4 Boussinesq Wave Modelling – North wave model bathymetry
5.2 Input parameters
Boundaries
The model contained only land boundaries. Land surface level was set at 5m AHD. The
water surface elevation was set at 0m AHD.
Porosity Layer
A porosity layer was established for each simulation to account for the effects of wave
dissipation upon structures with sloping banks. The layer contained porosity values of 1 for
the open water, 5 for land values, and a 6m thick buffer of 0.7 around Schnapper Point and
the rock protection on the landward end of the harbour area.
Sponge Layer
A sponge layer was used in the model to represent the dissipative effect of waves breaking on
the beach. Sponge layers were also added along the northern, eastern and southern boundaries
to allow wave energy to radiate out of the model domain without reflection.
The sponge layer along the boundaries was 80 grid cells thick, whilst along the beach the
sponge was only 5 grid cells wide as the model reduces wave energy due to wave breaking in
shallower waters and very little wave is required to be dissipated at the land-water interface.
The sponge layer for the north wave simulation can be seen in Figure 5-5 below.

Mornington Harbour Wave Investigation
J648/R01-W, October 2008, Rev 07 Page 21
Figure 5-5 Boussinesq Wave Model Sponge Layer (North wave simulation)
Wave Generation
From an analysis of the wave climate detailed in Section 4, it was found that the highest
waves would approach the site from northwest and west northwest (the direction with the
longest fetch). The models were tested for waves coming from the north northeast, north,
north northwest, northwest, west northwest and west. Wave conditions from these directions
are specified above in Section 4.4.
The MIKE 21 Toolbox Random Wave Generator was used to create the incident waves using
the above parameters. The waves were generated as irregular waves using a standard
JONSWAP spectrum with a peak enhancement factor gamma of 3.3 over a 30 degree spread
of frequency independent distribution cosine8.
Each simulation covered a 25 minute period of which the final 5 minutes were used to
calculate the wave response within the harbour.
Model Validation
The MIKE21 Boussinesq Wave model has been extensively validated against a wide range of
analytical solutions, as well as against measurements and physical model tests results for
numerous applications around the world. Within Port Phillip Bay, Water Technology
completed a study for the design of the Martha Cove breakwaters where combined physical
and Boussinesq modelling showed excellent correlation of wave heights within the harbour
entrance.
Mornington Harbour Wave Investigation
J648/R01-W, October 2008, Rev 07 Page 22
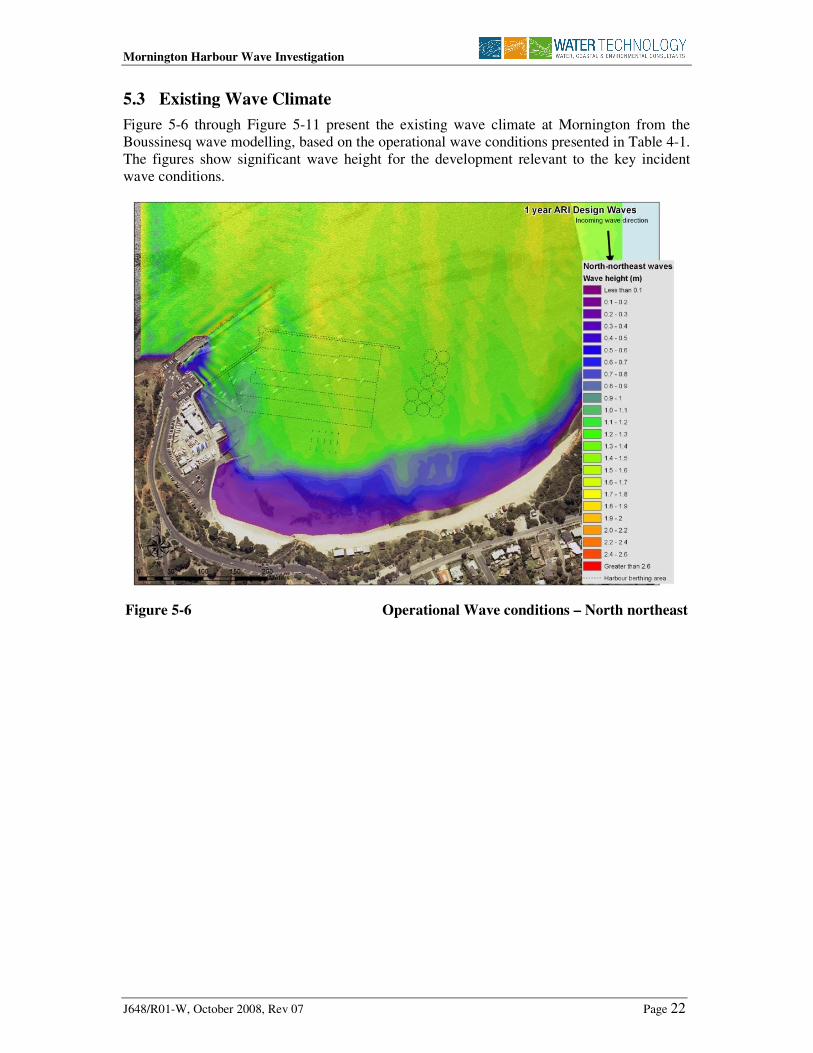
5.3 Existing Wave Climate
Figure 5-6 through Figure 5-11 present the existing wave climate at Mornington from the
Boussinesq wave modelling, based on the operational wave conditions presented in Table 4-1.
The figures show significant wave height for the development relevant to the key incident
wave conditions.
Figure 5-6 Operational Wave conditions – North northeast