Embed Size (px)
Citation preview
Rilis augiati siscilit venis nim
2014 edition
Morbidity statistics in the EU Report on pilot studies
Exer in vu
lla faci blam
con
se euis n
ibh
el utat d
ip ex elestisim
R
ilis aug
iati siscilit venis n
im
Statistical working papers
ISSN 1681-4789
2013
ed
ition
ISSN 2315-0807


Report on pilot studies
2013 edition
Morbidity statistics in the EU
Statistical working papers
2014 edition

Europe Direct is a service to help you find answersto your questions about the European Union.
Freephone number (*):
00 800 6 7 8 9 10 11(*) The information given is free, as are most calls (though some operators, phone
boxes or hotels may charge you).
More information on the European Union is available on the Internet (http://europa.eu).
Cataloguing data can be found at the end of this publication.
Luxembourg: Publications Office of the European Union, 2014
ISBN 978-92-79-36886-8ISSN 2315-0807doi:10.2785/52346Cat. No: KS-TC-14-003-EN-N
Theme 3: Population and social conditionsCollection: Statistical working papers
© European Union, 2014Reproduction is authorised provided the source is acknowledged.

Table of contents
3Morbidity statistics in the EU — Report on pilot studies
Table of contents Table of contents ......................................................................................................................... 3 Executive summary ..................................................................................................................... 5 Acknowledgments ....................................................................................................................... 6 Chapter 1— Introduction ............................................................................................................ 7
1.1 The importance of having European statistics on diagnoses-based morbidity ................... 7 1.2 Current data collections completing the information on Health in the EU ......................... 12 1.3 The importance of morbidity statistics in the International context .................................... 14 1.4 The importance of morbidity statistics at National level .................................................... 15 1.5 Background to this report ................................................................................................... 15 1.6 Structure of this report ....................................................................................................... 17
Chapter 2 — Examples from the pilots ................................................................................... 18 2.1 Current ‘experiments’ and promising developments ......................................................... 18 2.2 Some results achieved by the pilots and lesson learned .................................................. 18
Chapter 3 — Main findings ....................................................................................................... 29 3.1 The General approach for establishing diagnosis-specific morbidity statistics at EU level .................................................................................................................................... 29 3.2 Indicators: from theory to practice ..................................................................................... 30 3.3 Some diseases-specific examples on the definitions in use ............................................. 38 3.4 Potential data sources at national level ............................................................................. 39 3.5 Methods used for producing estimates .............................................................................. 43 3.6 Quality of results ................................................................................................................ 44
Chapter 4 — Conclusions and recommendations ................................................................. 53 4.1 Conclusions ....................................................................................................................... 53 4.2 Specific conclusions and recommendations per disease .................................................. 54 4.3 Recommendations ............................................................................................................. 60
Annexes ...................................................................................................................................... 63 Annex 1— In-depth analysis of pilot studies in 16 Member States: an Assessment of quality and comparability of the provided information across Member States.................................... 63 Annex 2 — Rev 11_11_13 — Report on in-depth analysis of pilot studies in 16 Member States on diagnosis-specific morbidity statistics — Prioritized ShortList MORB ..................... 64 Annex 3 — Abbreviations ........................................................................................................ 68 Annex 4 — Guidelines developed by the MSDG (Morbidity Statistics Development Group) and used during the pilot studies ............................................................................................. 70 Annex 5 — Task Force on Diagnosis-Specific Morbidity Statistics — Terms of reference – Rev. 15.11.2011 ...................................................................................................................... 71 Annex 6 — The self-assessment of sources’ quality done by pilot countries ......................... 75 Annex 7 — Data delivered by the pilot countries..................................................................... 80

Table of contents
4Morbidity statistics in the EU — Report on pilot studies
Annex 8 — Summary of pilot data and age-standardised estimates reported (range and ratio) ...................................................................................................................... 87 Annex 9 — Technical descriptions of the call for proposals launched in the years 2004, 2007 and 2009 ......................................................................................................................... 95 Annex 10 — Mapping of SANCO funded projects .................................................................. 96

Executive summary
5Morbidity statistics in the EU — Report on pilot studies
Executive summary Eurostat activities in the domain of health status and health determinants are currently covered by surveys; however, one core activity is missing: the regular collection of diagnosis-specific morbidity data with incidence and prevalence rates. A legal basis for such data collection is provided by Regulation No 1338/2008 establishing a framework for Community statistics on public health and health and safety at work. That regulation foresees an implementation of morbidity statistics at EU level.
Eurostat’s commitment in developing the conceptual and methodological framework for establishing such data collection on morbidity has a long-standing tradition; however, this ambitious goal has not yet been achieved. The reason behind is that from a methodological and operational point of view, establishing morbidity statistics is an extremely complex exercise, in particular with regards to comparability of data across countries. To guide the MS in the piloting phase, detailed guidelines were produced by the Morbidity Statistics Development Group in 2007: for each entry in the recommended shortlist the appropriate measures on incidence and/or prevalence for data delivery were indicated. Each country had to find appropriate sources for producing best national estimates. The main criteria for the inclusion of a data source was statistical robustness on the main data quality parameters and hence permit reliable inter country comparisons. Hence, like many Eurostat statistics, the compilation of diagnosis-specific morbidity statistics is output driven and not source oriented.
Altogether 16 MS participated at pilot studies on diagnosis-specific morbidity statistic from 2005 to 2011. In 2011, Eurostat established the Task Force on Morbidity Statistics (TF MORB) for analysing the pilots’ results, especially in view of sources and best estimates. TF MORB is presenting this report with an in-depth analysis of the pilot studies and methodological recommendations for paving the way ahead to overcome the pioneering stage.
The establishment of diagnosis-based morbidity statistics will be crucial for filling an information gap on the health status of the EU population which has severely hampered the development of public health indicators at EU level.
The draft of this report has been presented and discussed at the Technical Group on Morbidity in June 2013; the final version has been presented at the Working Group on Public Health Statistics (WGPH) in December 2013 which endorsed it.

Acknowledgments
6Morbidity statistics in the EU — Report on pilot studies
Acknowledgments
Production
Authors and members of the Task Force ‘Morbidity’: Monica Pace (1)(2), Hartmut Buchow (1), Margarida Domingues de Carvalho (1), Willem Aelvoet (2), Jacques Bonte (2), Gráinne Cosgrove (2), Rita Gaidelyte (2), Mika Gissler (2), Georgeta-Marinela Istrate (2), Merike Rätsep (2), Ieva Strele (2), Bogdan Wojtyniak (2). Former members of the Task Force ‘Morbidity’: Prof. Howard Meltzer (3), Anne Fagot-Campagna (3), Jean-Marc Schaeffer (1). Layout and dissemination: Isabelle Fiasse (4).
(1) Eurostat, Directorate F ‘Social Statistics’. (2) Monica Pace is Seconded National Expert from the Italian National Institute of Statistics, Willem Aelvoet is from the Belgian Federal Public
Service Health, Jacques Bonte Private Expert, Gráinne Cosgrove is from the Irish Department of Health, Rita Gaidelyte is from the Lithuanian Institute of Hygiene, Mika GIissler is from the Finnish National Institute for Health and Welfare, Georgeta-Marinela Istrate is from the Romania National Institute for Statistics, Merike Rätsep is from the Estonian National Institute for Health Development, Ieva Strele is from Riga Stradins University, Riga, Latvia, Bogdan Wojtyniak is from the National Institute of Public Health-National Institute of Hygiene, Warsaw, Poland.
(3) Former members of the Task Force Morbidity: Prof. Howard Meltzer was from the Department of Health Sciences College of Medicine, Biological Sciences and Psychology University of Leicester, UK (member until September 2012), Anne Fagot-Campagna was from the French Institute for Health Surveillance (member until March 2012), Jean-Marc Schaeffer Eurostat, Directorate F ‘Social Statistics’ (member until April 2012).
(4) Eurostat, Directorate B ‘Methodology; corporate statistical and IT services’.

1 Introduction
7Morbidity statistics in the EU — Report on pilot studies
Chapter 1 — Introduction
1.1 The importance of having European statistics on diagnoses-based morbidity
Eurostat activities in the domain of health status and health determinants are currently covered by three surveys: the five-yearly European Health Interview Survey (EHIS); the newly established disability survey (European Survey on Health and Social Integration - ESHSI), and a basic set of health-related questions that are included in the annual EU Survey on Income, Social Inclusion and Living Conditions (EU-SILC).
However, one core activity is missing: the regular collection of diagnosis-specific morbidity data with incidence and prevalence rates. A legal basis for such data collection is provided by Regulation No 1338/2008 establishing a framework for Community statistics on public health and health and safety at work (5). That regulation foresees an implementation of morbidity statistics at EU level. The Community action Programme on Public Health 2008–13 and the Community Statistical Programme 2008–12 foresee the implementation of that Regulation as a key statistical element of a sustainable health monitoring system.
In addition, the Commission Communication Solidarity in health also emphasizes the importance of having Regulations developed in each domain of public health statistics. (6)
The recent Commission staff working document Investing in health (7) (which is an accompanying document to the ‘Social Investment Package’ defines the role of health as part of the Europe 2020 policy framework and points out that an improvement in health data collection is needed, in particular in using the European Core Health Indicators (ECHI) and developing tools to better assess the efficiency of health systems. In addition, the statistical information on specific chronic diseases is a key component in underpinning and addressing policies to improve the labour market participation, risk of social exclusion and risk of poverty.
Eurostat’s commitment in developing the conceptual and methodological framework for establishing a data collection on morbidity dates back to the mid-nineties. Following the analysis of pilot studies in 16 Member States this report of the Eurostat Task Force on Morbidity (TF MORB) is now paving the way ahead to overcome the pioneering stage with a set of recommendations.
The feasibility of such statistics, in particular in view of using data from different sources, will be markedly enhanced by the current revision of the EU statistical law (8). It will be the legal basis to ensure and encourage a better use of existing sources by improving access to and exploitation of administrative data, e.g. by merging or linkages of the existing datasets.
The establishment of diagnosis-based morbidity statistics is crucial for filling an information gap on the health status of the EU population. Key elements of innovation for that approach are:
• the best estimates from multiple sources that can be used (namely physicians issuing diagnoses/prescriptions or health records from registers, health institutions and insurances)
• the possibility to compare best estimates on incidence and prevalence of diseases
• the comprehensive coverage of morbidity data
• the coverage of the whole population, by providing national estimates, and
• diseases and conditions to be reported in terms of EU relevance and the Public Health perspective.
In 2007 Eurostat and Member States (MS) developed a methodology and a shortlist for collecting such data at EU level. It addresses diseases and conditions with major impact on health care and health-care related costs, annual death rates, or potential years of life lost. Examples range from heart/circulatory and respiratory diseases, cancer or metabolic diseases such as diabetes to mental diseases, injuries and their consequences and
(5) Regulation (EC) No 1338/2008 of 16 December 2008, OJ L 354, p.70. (6) Communication from the Commission to the European Parliament, the Council, the European Economic and Social Committee and the
Committee of the Regions. Solidarity in Health: Reducing Health Inequalities in the EU. COM (2009) 567 final. Available at: http://eur-lex.europa.eu/LexUriServ/LexUriServ.do?uri=COM:2009:0567:FIN:EN:PDF. (7) Document complementing the Commission Communication ‘Towards Social Investment for Growth and Cohesion’. Available at:
http://ec.europa.eu/health/strategy/docs/swd_investing_in_health.pdf. (8) Available at: http://epp.eurostat.ec.europa.eu/portal/page/portal/about_eurostat/introduction.

1 Introduction
8Morbidity statistics in the EU — Report on pilot studies
external causes. An attempt to highlight the main diseases for which morbidity statistics are needed is presented in the EU short list on morbidity, which has been followed throughout this pilot phase by the participating countries.
The actual lack of systematic and official data on morbidity has severely hampered the development of public health indicators at EU level which are required to support health policy makers.
Diagnoses-based morbidity statistics at EU level: a difficult exercise
For selected diseases the health status of the EU population is known thanks to diseases-registers, ad-hoc studies and as self-reported information from the EHIS or EU-SILC surveys. Currently, the principal and most reliable source for establishing and monitoring public health policies is information derived from Causes of Death statistics. While this type of source is well established and provides reliable and comparable public data collection for all EU countries, Cause of Death data does not provide information on incidence and prevalence of diseases and in particular lacks information on comorbidities that would be necessary for a comprehensive picture of public health.
A regular and systematic data collection and dissemination of statistics (9) on diagnoses-based morbidity does not exist either at EU or at global level (10). The reason behind this is that from a methodological and operational point of view, the collection of morbidity statistics is an extremely complex exercise, in particular with regards to comparability of data across countries. Specific efforts will be required in each country to produce operational definitions of variables that are based on many different available sources. So far these difficulties have hampered attempts to establish a morbidity data collection based on (mainly) administrative data similar to those already existing for causes of death or for health care data based on hospital discharges.
The recent new release of the work on the Global burden of diseases (11) is a tentative step towards filling in the existing information gap on health.
The demand for statistical data on diagnosis-based morbidity is increasing; however, the capability to respond to this increasing demand is constrained by limited data availability, quality, and use. A set of diagnoses-based morbidity indicators have been developed in the context of the ECHI (European Core Health Indicators (12)) list, but most of these indicators are not collected yet and the list is not exhaustive. It is therefore important to collect morbidity statistics in order to have these indicators thoroughly implemented both in terms of definition and data. (13)
The paradox for Europe is that while sometimes there is a wealth of information available for specific diseases; this information can often be scattered, sparse, not representative of the total population, not collected systematically and not addressing the multidimensional characteristics of health. And for many other diseases there are only scarce examples at national level.
The result is:
• a fragmented picture of the occurrence of diseases in the EU, often driven by the needs of single-disease program or ad-hoc data collection;
• information on incidence (or prevalence) only for those diseases where both indicators should be advisable;
• an inefficient use of the available sources of collected information and allocated resources.
Lastly, it should not be forgotten that the legal framework for accessing and processing the available data from many different sources poses obstacles that need to be addressed and solved. The proposed revision of the statistical law (14) will allow Eurostat and the partner countries within the ESS to use both their technical IT capabilities and the legal mandate for working towards this goal.
(9) The definition of European statistics is according to Article 2 (2) of the COMMISSION DECISION of 17 September 2012 on Eurostat
(2012/504/EU). (10) Chan M, Kazatchkine M, Lob-Levyt J, et al. Meeting the demands for results and accountability: a call for action on health data from eight health
agencies. PLoS Med 2010; 7: e100023. (11) http://www.thelancet.com/themed/global-burden-of-disease. (12) Previously ‘European Community Health Indicators’. (13) ECHI indicators relevant for diagnoses-based morbidity statistics are: No 20. Cancer incidence; No 21(b). Diabetes: register-based prevalence;
No 22. Dementia; No 23(b). Depression: register-based prevalence; No 24. Acute myocardial infarction (AMI); No 25. Stroke; No 26(b). Asthma: register-based prevalence; No 27(b). Chronic obstructive pulmonary disease (COPD): register-based prevalence.
(14) http://eur-lex.europa.eu/LexUriServ/LexUriServ.do?uri=COM:2012:0167:FIN:EN:PDF

1 Introduction
9Morbidity statistics in the EU — Report on pilot studies
The pilot studies in 16 Member States (MS) that were analysed for this report have shown the feasibility of the proposed methodology for many of the 105 indicators (both for incidence and prevalence) included in the Eurostat Morbidity Short List (15).
Demands for diagnoses-specific morbidity in EU programmes on public health
The responsibility for the organisation and delivery of health services and healthcare is largely held by the Member States at national and sub-national level. However, the Commission is asked for actions whenever there is a need to complement Member States’ health policies, in particular in areas such as health promotion, prevention, research or dissemination of information by public health data collections within the ESS (European Statistical System).
The provision of statistics on public health is closely linked to the Community Action Programme in the field of public health 2008–2013, which covers health status including morbidity and is implementing the strategy ‘Together for health: a strategic approach for the EU 2008-2013’ (COM (2007) 630) (16).
The most relevant point addressing the importance of health data is the following: ‘… Finally, health policy must be based on the best scientific evidence derived from sound data and information, and relevant research. The Commission is in a unique position to assemble comparable data from the Member States and regions and must answer calls for better information and more transparent policymaking, including through a system of indicators covering all levels (national and sub-national)’ (page 4).
In an ageing society diagnosis-specific morbidity statistics are of particular importance in view of addressing issues such as self-management of multi-morbidity and prevention of long-term care. Time-trends from morbidity statistics will be a major pillar to enhance information and knowledge as requested by the proposed Regulation for establishing a ‘Health for Growth’ Programme, the third multi-annual programme of EU action in the field of health for the period 2014–20 (17). In fact, in the objectives it is stated that ‘… the Programme will support actions on Health information and knowledge to contribute to evidence-based decision making, including collecting and analysing health data and wide-ranging dissemination of the results of the Programme’ (page 7).
The challenge of increasing costs of health in EU economic programme
A population in bad health status is likely to cause higher overall expenditure due to both direct and indirect costs linked to ill-health, such as more people partially or totally inactive during their productive working years, as well as a burden from unhealthy retired people.
Spending on health is not just a cost; it is an investment in order to reduce the burden from diagnosis- and treatment-related costs related to diseases and their derived limitations, impairments and disabilities. Some examples (although not exhaustive) are chronic diseases (diabetes, mental disorders, neurodegenerative conditions, coronary heart disease, cancers, etc...) or diseases impairing the productive years of younger people, such as injuries and their long-lasting consequences.
The recent report on ageing from ECFIN clearly highlights the lack of comparable, quantifiable measures of health status (morbidity) required to evaluate the most likely possible scenario for estimating projections of health care costs in the EU. Providing that data on health expenditure are available, it is assumed that age/gender specific expenditure profiles provides a proxy for health status (i.e. morbidity). In other words, higher expenditure captures higher morbidity (18).
The ageing process in the EU is likely to raise demand for healthcare while also decreasing the working population. This could result in an increase in healthcare spending of 1 % to 2 % of GDP in Member States by 2050. On average this would amount to approximately a 25 % increase in healthcare spending as a share of GDP based on the present health expenditure which ranged from 6 to 12 per cent of GDP in 2009. However, Commission projections show that if people can remain healthy as they live longer, the rise in healthcare spending due to ageing would be halved.
On average across EU MS, health spending per capita increased by 4.6 % per year in real terms between 2000 and 2009, but this was followed by a reduction of 0.6 % in 2010, consequent to the current economic crisis
(15) https://circabc.europa.eu/sd/d/cad2be69-b24e-4e60-84fc-ed5d9370d027/Diagnosis-specific-morbidity-(European shortlist 6 March 2007).xls (16) http://ec.europa.eu/health/strategy/white_paper/index_en.htm (17) http://ec.europa.eu/health/programme/docs/prop_prog2014_en.pdf (18) The 2012 Ageing Report: Underlying Assumptions and Projection Methodologies European Economy 4|2011. (DG ECFIN)
http://ec.europa.eu/economy_finance/publications/european_economy/2011/pdf/ee-2011-4_en.pdf.

1 Introduction
10Morbidity statistics in the EU — Report on pilot studies
(Figure 1) (19). Given the significant reduction in health care expenditure in some European countries, the importance of morbidity statistics will be even greater for monitoring the resulting impact on Public Health.
On the other hand more effective prevention influences incidence and/or prevalence of diseases and thus has an impact on health expenditure. Following such developments of morbidity gives indications for expected impacts on health expenditure.
Figure 1: Annual average growth rate in per capita health expenditure, per capita, in real terms, 2000 to 2010 (or nearest year)
Source: OECD Health Data 2012; Eurostat Statistics Database; WHO Global Health Expenditure Database.
In terms of the potential impact of this changing scenario on the development of morbidity statistics, should the costs per capita reduction be confirmed for the next coming years, it could have impact on both the kind of sources to be identified and used for the data collection, with a possible shift from the public sector to the private sector, and of course in terms of changes in the incidence and prevalence of diseases. This illustrates the concept of ‘reverse causation’ meaning that morbidity estimates are not just a cause of expenditure, but also a result of it.
At present information on diagnoses-based incidence and prevalence of diseases to assess the burden at population level or on the cost of diseases to assess the burden on health systems is not yet available in the EU in the form of a harmonised, regular data collection that is capable of delivering this information as part of the disseminated EU official statistics. This information gap is likely to have negative drawbacks on the possibility of establishing effective EU policies for health and efficient allocation of resources, both at the level of the MS and at EU level. These two components of the overall picture on health should be equally developed, and the establishment of morbidity statistics is the first step to be made towards this direction.
An example of how the problem has been addressed at country level is provided by The Netherland by a RIVM-analysis of the cost of illness conducted in cooperation with Statistics Netherlands (20). The main reasons for the increase in costs are: 1. ageing of the population (explains about 15 % of the cost rise over the entire period 1999–2010); 2. price inflation (explains about 35 %); 3. interrelated set of causes such as policy changes, easier access to services, the growth of the number of patients treated, more intensive treatment and the implementation of new medical technology (explains about 50 %). In spite of ageing, the largest increase in costs over 2005–2010 occurred in young people (ages 1–24). A higher use of youth care and a change in the
(19) OECD (2012), Health at a Glance: Europe 2012, OECD Publishing. http://dx.doi.org/10.1787/9789264183896-en. (20) Available at: http://www.kostenvanziekten.nl/systeem/service-menu-rechts/homepage-engels/.

1 Introduction
11Morbidity statistics in the EU — Report on pilot studies
rules for admittance to care for the people with disabilities explain this fast rise. Although women use more health care than men, since 2005 the costs increased faster for men than for women. This is partially due to improved male health: they live longer, and therefore use more health care, particularly at older ages.
Longer lives and Health in EU social programmes Life expectancy at birth in the EU-28 increased over the last 50 years by about ten years due to several factors, including medical progress and improved hygiene, better living conditions and education and access to high quality health care. In 2012 life expectancy at 65 years of age in EU-28 is 19.6 (Figure 2).
Figure 2: Life expectancy in years at 65 years in the EU-28 countries (2012)
Notes: data for EU-28. Source: Eurostat
As a result, a significant proportion of the population reaches advanced ages, which is associated with a change in patterns of the diseases from infectious to non-communicable diseases. With respect to the notable gain in life years, a crucial question to be addressed is also how the life of EU population is spent in terms of health. To answer this fundamental question the healthy life years (HLY) indicator was included in 2005 as a Lisbon Structural Indicator, to underline that the population’s life expectancy in good health — not just length of life — was a key factor for economic growth. The increase by two years in the average of HLY in the EU population by 2020 is also one of the aims of the Commission pilot initiative ‘European Innovation Partnership on active and healthy ageing’ (21).
The recent evidence (2007–2011) for HLY indicator shows that the number of healthy life years at birth slightly increased for men — from 61.7 to 61.8 — and decreased for women — from 62.6 to 62.2 years in the EU-27; this represents an average of 80.2 % and 75.4 % of total life expectancy at birth for men and women respectively. Not surprisingly, as life expectancy has still increased during this time, a similar reduction in the proportion of healthy life years occurred in both sexes in the three last years. In fact, for men the observed values range from 81.1 % in 2007 to 79.8 % in 2011 and for women from 76.2 % in 2007 to 74.8 % in 2011. Healthy life years have slightly increased in 2012 compared to 2010, and in 2012 were 61.3 for males and 61.9 for females (Figure 3). The actual data on HLY are derived yearly from EU-SILC, and this measure could be refined and/or complemented by using diagnoses based data, especially prevalence.
(21) http://ec.europa.eu/health/ageing/policy/index_en.htm

1 Introduction
12Morbidity statistics in the EU — Report on pilot studies
Figure 3: Healthy life years in absolute value at birth in EU-28 countries by sex (2012)
Data for EU-28. Source: Eurostat
For survivors at the age of 65, the number of remaining healthy life years is 8.7 years for men and 8.8 years for women (Eurostat, Key figures on Europe, 2013). It is therefore crucial to know the incidence and prevalence of conditions such as ischemic heart diseases, cerebrovascular diseases, cancers, diabetes, and dementias, which are the largest proportion of causes of deaths after 65 years of age (22). Diagnosis-based morbidity statistics at EU-level will be essential for delivering that information.
Quality of life and well-being in Commission context
In its Communication on ‘GDP and beyond: measuring progress in a changing world’ (23) the Commission announced that it would work on developing indicators on ‘quality of life’ and this is also a recommendation that is part of the Stiglitz-Sen-Fitoussi Commission (SSFC) report:
‘Recommendation 6: Quality of life depends on people’s objective conditions and capabilities. Steps should be taken to improve measures of people’s health, education, personal activities and environmental conditions…’ (24)
In the context of ‘quality of life’ indicators, health is indicated as one of the eight dimensions and within the dimension ‘health’ the emphasis is inter alia not only on physical health but — even more — on mental health.
At present indicators associated with mental health well-being derived from the Official Public Health statistics are death rate for suicides (population-based census), hospitalisation rates and self-reported depression (population-based survey). Undoubtedly these are insufficient indicators for providing a complete picture on such a complex and major health problem in the EU. It is therefore not surprising that the Commission requested that Eurostat address the following: ‘There is a need to improve the knowledge base on mental health: by collecting data on the state of mental health in the population’. (25)
Gradually diagnosis based statistics should replace the self-reported data as sources for the health indicators for specific diseases.
1.2 Current data collections completing the information on Health in the EU
The results and indicators derived from some existing data collections would benefit from the extra dimension of diagnosis specific statistics.
(22) Circulatory diseases – Main causes of death for persons aged 65 and more in Europe, 2009 – Issue number 7/2012 Statistics in focus,
Eurostat. (23) http://eur-lex.europa.eu/LexUriServ/LexUriServ.do?uri=COM:2009:0433:FIN:EN:PDF. (24) Report by the Commission on the Measurement of Economic Performance and Social Progress. JE Stiglitz, A Sen, JP Fitoussi. Available at: http://epp.eurostat.ec.europa.eu/portal/page/portal/gdp_and_beyond/documents/Stigliz_Sen_Fitoussi_report_14092009.pdf (25) European Pact for Mental Health and Well-Being: http://ec.europa.eu/health/mental_health/docs/mhpact_en.pdf
0
10
20
30
40
50
60
70
80
EU-2
8
Aust
ria
Belg
ium
Bulg
aria
Cro
atia
Cyp
rus
Cze
ch R
epub
lic
Den
mar
k
Esto
nia
Finl
and
Fran
ce
Ger
man
y
Gre
ece
Hun
gary
Irela
nd
Italy
Latv
ia
Lith
uani
a
Luxe
mbo
urg
Mal
ta
Net
herla
nds
Pola
nd
Portu
gal
Rom
ania
Slov
akia
Slov
enia
Spai
n
Swed
en
Uni
ted
King
dom
Males Females
1 Introduction
13Morbidity statistics in the EU — Report on pilot studies
Morbidity as perceived and reported by people
The current sources available at Eurostat for assessing self-perceived health are EU- SILC and EHIS. The information available from these sources will still be valuable even if and when the diagnoses-based morbidity statistics is established. The two aspects of measuring health as self-perceived or diagnosed by a professional should be seen as complementary to each other, which is in line with a modern approach of the social and economic role and integration of individuals as the main pillar of Social Statistics. However some well-known limitations of surveys restrict their scope and use. In particular: 1) they miss acute serious illnesses with high fatality rate / low survival; 2) sample sizes often do not allow for more precise estimation of prevalence by age groups (e.g. diabetes in younger age groups) as there are simply too few respondents with a given disease per age group – this is especially a problem in small countries where sample sizes are relatively small; and 3) non-response overall (and non-response increases) and biased responses; 4) the financial cost and burden on respondents.
To overcome these limitations morbidity statistics will be comparatively cheap and will provide estimates based on the whole population. Morbidity information on individuals cannot therefore be represented only by ‘diagnoses’ or only by ‘perception’, but hopefully by the full integration of these two components, as the complete description of the status of health should include population based diagnosis, surveys and mortality by cause. Data from health interview surveys and diagnosis-specific morbidity data are therefore complementary sources: both are essential for evidence based policy making. This complementarity will have an invaluable impact on the data produced and their subsequent interpretation and use.
The comparisons between EHIS / MORB estimates have been included in the Annex 1, as part of the data received from the pilot countries.
Addressing inequalities and access to health care for all the EU population
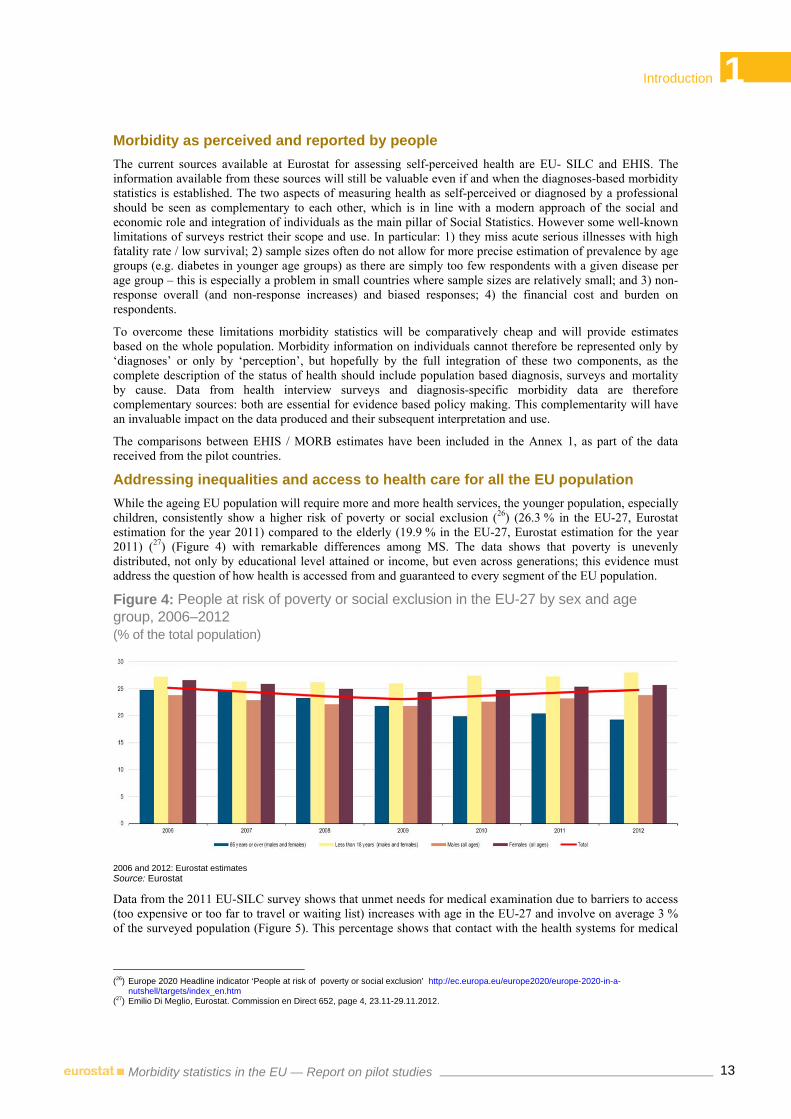
While the ageing EU population will require more and more health services, the younger population, especially children, consistently show a higher risk of poverty or social exclusion (26) (26.3 % in the EU-27, Eurostat estimation for the year 2011) compared to the elderly (19.9 % in the EU-27, Eurostat estimation for the year 2011) (27) (Figure 4) with remarkable differences among MS. The data shows that poverty is unevenly distributed, not only by educational level attained or income, but even across generations; this evidence must address the question of how health is accessed from and guaranteed to every segment of the EU population.
Figure 4: People at risk of poverty or social exclusion in the EU-27 by sex and age group, 2006–2012 (% of the total population)
2006 and 2012: Eurostat estimates Source: Eurostat
Data from the 2011 EU-SILC survey shows that unmet needs for medical examination due to barriers to access (too expensive or too far to travel or waiting list) increases with age in the EU-27 and involve on average 3 % of the surveyed population (Figure 5). This percentage shows that contact with the health systems for medical
(26) Europe 2020 Headline indicator ‘People at risk of poverty or social exclusion’ http://ec.europa.eu/europe2020/europe-2020-in-a-
nutshell/targets/index_en.htm (27) Emilio Di Meglio, Eurostat. Commission en Direct 652, page 4, 23.11-29.11.2012.

1 Introduction
14Morbidity statistics in the EU — Report on pilot studies
examination is relatively guaranteed; however those below 18 years of age are not included in this analysis from EU-SILC survey.
Figure 5: Self-reported unmet needs for medical examination for reasons of barriers of access (too expensive or too far to travel or waiting list) in the EU-28 by age, 2011 (%)
Source: Eurostat
In the scenario where deprivation could increase, a comparison between the explicit demand and access to care will be particularly relevant. Therefore, the availability of more accurate and complete information about which major diseases affect the EU population is going to contribute to:
• reducing the burden of specific conditions on the population,
• strengthening those parts of the health systems where necessary (prevention, rehabilitation, etc.),
• responding to major Public Health challenges (emerging diseases, etc.),
• tackling inequalities in access to appropriate care for specific diseases (at EU global level, or subnational-, gender-, education-, age- or income-based),
• establishing and monitoring adequate actions and policies.
The information currently available on outcome, namely causes of death statistics, only highlight the ‘worst scenarios’ by producing figures on those who died from a certain condition.
There is a strong demand from within the Commission on having evidence where the morbidity statistics are going to be one of the building blocks, as in the case of the communication ‘Solidarity in Health’ where the need for more health data is clearly identified as one of the foreseen EU-level actions: ‘Support the further development and collection of data and health inequalities indicators by age, sex, socio-economic status and geographic dimension’ (page 6) (28).
1.3 The importance of morbidity statistics in the International context
The Global Burden of disease 2010 (29)
The purpose of this paragraph is not to summarise the overwhelming amount of information that can be derived from this global, world-wide effort on health data, nor to compare the existing differences in estimates
(28) Communication from the Commission to the European Parliament, the Council, the European Economic and Social Committee and the
Committee of the Regions. Solidarity in Health: Reducing Health Inequalities in the EU. COM(2009) 567 final. Available at: http://eur-lex.europa.eu/LexUriServ/LexUriServ.do?uri=COM:2009:0567:FIN:EN:PDF (29) http://www.thelancet.com/themed/global-burden-of-disease

1 Introduction
15Morbidity statistics in the EU — Report on pilot studies
provided by the Global Burden of Disease 2010 (GBD 2010) in comparison with institutions such as WHO, Eurostat or OECD.
The EU is in several cases in a privileged situation with respect to access to and availability of several of the health data presented by the GBD 2010 study. However, the huge contribution to highlighting the burden of disease for the population and for the national health systems has to be emphasised. In fact, some aspects relevant to the development of EU morbidity statistics should be taken into account from this study (30):
• the methods developed and used for measuring the burden of diseases and risk factor prevalence, estimation methods;
• the efforts made on ensuring a certain level of comparability by involving a consistent number of researchers to estimate incidence and prevalence of diseases, (as well as causes of death, risk-factor exposure and attributable burden, and health life expectancy);
• An innovative and comprehensive approach to cross-validation of data (mainly against evidence from mortality/causes of death), by including conditions leading to disabilities such as visual impairment, hearing loss and anaemia;
• Comorbidities that were taken into account for the estimation of the years lived with disability (YLDs) indicator;
• Quantification of uncertainties across all the components of the study, thus communicating to users the limitations of the estimates for different diseases, injuries and risk factors;
• The commitment of 486 authors from 302 institutions in 50 countries who reviewed the final articles.
UN sustainable development goals
Building upon the Millennium Development Goals one of the main outcomes of the Rio+20 Conference in 2013 was the agreement to develop a set of Sustainable Development Goals (SDGs). Health is one of the topics that are addressed in the context of the post 2015 strategy. It has been discussed each year as a cross-cutting issue during each two-year cycle. This approach will of course need the availability of selected health indicators that can be used to monitor the specific goals in the social, environmental and economic domains.
1.4 The importance of morbidity statistics at National level
The above paragraphs highlighted the increasing demand and importance for having Morbidity Statistics established at EU level. However, the benefits for MS to collect and report a set of data that are comparable at EU level should not to be underestimated. On the one hand morbidity statistics at national level are cornerstones for monitoring and evaluation of morbidity developments in general and programmes in particular. On the other hand morbidity statistics that are comparable to other EU-28 are the basis for comprehensive planning of different nature, e.g. in view of monitoring specific health and welfare programmes as compared to other countries on needs of human and physical resources, insurance costs and expenditures for health care activities.
A specific example for the needs for internationally comparable morbidity data is represented by issues on cross-border health care provisions, an increasing phenomenon and burden in several MS, finally, the pilot studies showed that for several diseases coverage of the total of the population is far from being achieved in all MS. At the same time, some coverage by existing data is missing substantial numbers of cases, such as patients whose diseases are treated by general practitioners who are not part of the national data collection system. Such lack of information may distort the national estimates on the incidence and prevalence of diseases, as well as the sub-national and local allocation of resources.
1.5 Background to this report
This paragraph summarizes the development towards the development of morbidity statistics in Eurostat.
(30) GBD 2010: a multi-investigator collaboration for global comparative descriptive epidemiology. Murray CJL, Lopez AD, et al. Lancet 2012;
380:2055-2058.

1 Introduction
16Morbidity statistics in the EU — Report on pilot studies
The Morbidity Statistics Development Group (MSDG) 2006–2007
Since the mid-90s the Commission (Eurostat and DG-SANCO) launched several activities aimed at establishing diagnosis-specific morbidity statistics at European level. Initiatives and projects are summarized in the final guidelines of the Morbidity Statistics Development Group (MSDG; see below).
Building on those activities carried out before 2006, the MSDG was set up in order to bring forward the methodological framework for diagnosis-specific morbidity statistics. The purpose of the MSDG (31) was to develop proposals, to produce implementation plans and to monitor the progress of an EU-wide system of disease-specific morbidity statistics to be built on the ‘matrix approach’ for a set of diseases, by identifying and using the best possible sources.
The MSDG revised the morbidity short list and produced guidelines (Annex 4) and recommendations for the piloting phase of the diagnoses-based morbidity data collection covering variables, sources, and methods of data collection (32).
The pilot studies - characteristics of waves I (2005–2006) and II (2007, 2009) Two waves of pilots have been carried out with common objectives as follows (see Annex 9 for the pilots’ technical descriptions):
a. Inventory of potential national sources for diagnosis-specific morbidity data The aim of this part of the methodological approach was to identify and to describe and evaluate the potential main national sources for diagnosis-specific morbidity statistics.
b. Elaboration of a methodology for producing best national estimates on incidence and prevalence, according to the short list MORB
The emphasis was on providing the best national estimate through a well described and valid procedure.
c. Pilot data collection
The proposed methodology was subsequently tested by a pilot project, thereby avoiding any duplication of work with on-going data collections such as for infectious diseases and cancers.
The countries participating in the pilots were the following:
• Wave I (2005–2006). In the context of the pilot projects on morbidity statistics funded by the Transition Facility Programme 2005, 9 MS — Cyprus, the Czech Republic, Estonia, Hungary, Lithuania, Latvia, Malta, Slovenia and Slovakia — assessed the overall practicality and feasibility of the methodology proposed by the MSDG.
• Wave II (2007, 2009). The projects covering years 2007-2009 involved Austria, Belgium (for a subset of the diseases included in the short list), Finland, Germany, Poland, The Netherlands, and Romania. The final reports from this second wave were completed and made available for analysis in 2011.
The Eurostat task force on morbidity statistics
From 2009 to 2011 Eurostat activities on morbidity stopped for about a year and half due to lack of resources. The activities were resumed in the second half of 2011 when the Task Force on Morbidity (TF MORB) was agreed at the WGPH meeting.
The TF MORB (33) is assisting Eurostat in the preparation of a regular data collection on morbidity within the ESS, with focus on the revision and refinement of existing methodological tools. The goal of the earlier pilot studies was to test the MSDG methodology for accurate morbidity estimates at national level. The aim of the TF MORB has been to help Eurostat in assessing the quality and comparability of those estimates across the MS, and to revise the methodology in the MSDG guidelines and the short list of conditions. The Task Force Terms of Reference are shown in Annex 5.
The TF MORB concluded its work on autumn 2013.
(31) Participants to the MSDG were: Roberta Crialesi (Italy), Liis Rooväli (Estonia), Jacques Bonte (Belgium), Howard Meltzer (United Kingdom),
Björn Smedby (Sweden), Sabine Gagel (Eurostat), Marleen De Smedt (Eurostat). (32) Available on CIRCABC: https://circabc.europa.eu/sd/d/401738a1-0ca8-4beb-a453-48ab8e1f39cd/MSDG%20guidelines%2023-04-2007.pdf. (33) Members of the Eurostat task force on morbidity were: Willem Aelvoet (BE), Merike Rätsep (EE), Mika Gissler (FI), Anne Fagot-Campagna (FR,
until March 2012), Gráinne Cosgrove (IE), Rita Gaidelyte (LT), Ieva Strele (LV), Bogdan Wojtyniak (PL), Georgeta-Marinela Istrate (RO), Howard Meltzer (UK, until September 2012), Jacques Bonte (private expert, from October 2012), Hartmut Buchow (ESTAT), Monica Pace (ESTAT), Jean-Marc Schaefer (ESTAT, until April 2012), Margarida Domingues de Carvalho (ESTAT, from August 2012).

1 Introduction
17Morbidity statistics in the EU — Report on pilot studies
1.6 Structure of this report
The results presented in this report are the first systematic attempt to obtain and analyse data on sources and estimates as provided by 16 MS in accordance with the guidelines and shortlist on morbidity adopted at EU level for this purpose. The efforts required for presenting a synthesis of the current state of art were considerable. The increase in knowledge and methods provided by the pilot studies will be the basis for further developments with the aim of establishing a regular ESS data collection on morbidity in the near future.
Chapter 1 is an overview of the current demand for health indicators in the context of the EU policies. Reasons on how the morbidity statistics will improve the different dimensions of health are provided as well. Besides these aspects, the steps and methods followed for establishing the routine data collection of morbidity statistics strand are provided.
Chapter 2 provides an overview of the main findings, problematic aspects and proposed solutions for moving towards a Eurostat morbidity data collection. The graphs in chapter two are based on standardised rates only. In order to present the most relevant aspects in a readable format, it was decided to present some prototypal situations which the TF faced during the analysis of the sources and estimates in view of their accessibility, usefulness, overall quality and comparability. Case studies dealing with the quality of the identified sources and estimates are shown in the form of questions in order to make the report more readable.
Chapter 3 includes the main findings on: sources and their quality, methods, indicators’ definitions, summary of results, conclusions from TF experts at ICD-10 chapter level.
Chapter 4 includes the conclusions and recommendations.
An in-depth analysis for the most important aspects related to quality is provided in Annex 1 for each (or group of) indicators identified in the morbidity Short List. The estimates provided by each pilot country are also presented in two set of graphs, one for crude rates and one for age-standardised rates. The indicators in each graph have been grouped according to the identified sources in order to make the effective comparisons of estimates easier for the reader.
Annex 2 shows the prioritised shortlist, including the revisions proposed at the Technical Group morbidity meeting held on June 2013.
Annex 3 presents the list of abbreviations used in the report.
Annex 4 shows the guidelines developed by the MSDG (Morbidity Statistics Development Group) and used during the pilot studies.
Annex 5 shows the terms of reference of the Task Force ‘Morbidity’.
Annex 6 shows the self-assessment of quality of (primary) sources done by pilot countries who participated to the second wave of the present study (AT, BE, CZ, FI, NL, PL, RO).
Annex 7 lists the data delivered by the pilot countries.
Annex 8 shows the summary of pilot data and age-standardised estimates reported (range and ratio).
Annex 9 reports the technical descriptions of the call for proposals launched for the pilot studies.
Annex 10 lists the relevant projects to Morbidity funded by DG-SANCO.

2 Examples from the pilots
18Morbidity statistics in the EU — Report on pilot studies
Chapter 2 — Examples from the pilots
2.1 Current ‘experiments’ and promising developments
The European Statistical System (ESS) is undergoing a process of modernisation, and one of the pillars of this is the improved use of administrative sources (34). From this standpoint the pilots performed in 16 Member States (MS) show a reasonably complete range of the methodological challenges that need to be addressed in order to establish an EU data collection on morbidity.
The results provided by the different pilot countries show in some cases the best national estimates for the requested indicators on incidence and prevalence as from the morbidity short list range can potentially be provided by linking individual data from different registers at population level. However in other cases data are available based only on the existing national data source on a specific disease. Finally, in several cases the estimates show that the methodologies followed permit a preliminary comparison across EU MS.
2.2 Some results achieved by the pilots and lesson learned
In this chapter a selection of examples (35) is given as an illustration of the results obtained and to demonstrate the potential for regular reporting according to the short list. Also these examples outline some of the issues with the methodology for the collection of diagnosis data in MS and reporting to Eurostat, as described in the guidelines. For each of the diseases chosen a particular aspect is highlighted.
The detailed results of the analysis are presented in Annex 1. Annex 8 shows the summary of pilot data and age-standardised estimates reported (range and ratio).
The importance of unambiguous diagnosis and definition: the case of schizophrenia
The detailed analysis of the pilot studies shows the importance of clear, univocal diagnostic criteria for the selected disease and suitable national sources for obtaining quite comparable estimates across countries. This is the case for schizophrenia (F20-F29), where estimates for age-standardised rates for period prevalence have been made available by nine countries. Only 2 countries (CY, MT) have no data for schizophrenia. Eight countries (CZ (only crude rates provided), (DE not shown (36)), EE, FI, HU, LT, PL, and RO) used health insurance data, of which PL and FI used a combination of insurance and hospitals data and RO DRG-based data. Five countries (AT, LV, NL, SI, and SK) used health statistics based sources; best national estimates were provided by three of these countries. The case of Latvia is interesting because a specific ‘Register of patients of the State Mental Health Agency’ exists and provides results of the same scale as those derived from the insurance datasets. However the full comparability of these figures is not guaranteed because some of the identified sources are episode-based (HU) and some others are clearly stated as person-based (PL).
(34) Communication from the Commission to the Europeans Parliament and the Council on the production method of EU statistics: a vision for the
next decade. Available at: http://eur-lex.europa.eu/LexUriServ/LexUriServ.do?uri=COM:2009:0404:FIN:EN:PDF. (35) The sources presented in the following graphs have been grouped according to criteria agreed within the task force: for the description of the
different categories of sources, please refer to Table 6 in Annex 1. (36) The data for Germany are not shown in this report, based on a specific request made by the German Institutions that conducted the pilots.

2 Examples from the pilots
19Morbidity statistics in the EU — Report on pilot studies
Figure 6: Schizophrenia, 2005 (period prevalence)
Why is this example important?
It shows that comparable estimates can be obtained: 1. In the case of clear case definition and diagnostic criteria; 2. when suitable, even if different types of sources are available and used alone (Diseases-specific register for LV, or insurance data for EE, HU, LT, PL, or ambulatory care providers data for SK) or in combination (FI: linkage of Hospital Discharge Register for health institutions and Social Insurance Institution data on disability allowances). On the other hand purely administrative data such as hospital in-patient based data (SI and RO) do not provide realistic estimates for schizophrenia. 3. In the case of schizophrenia, the treatment requires the use of specific medicines and the prescriptions are recorded by health insurance data, which are therefore a suitable source, as identified by some pilot countries in their national contexts. 4. As prevalence of schizophrenia is more or less the same across populations (around 1 %), the systems in place in several counties seem to provide similar information.
How to decide whether a source is good enough: the case of Parkinson’s disease
Where the relevant source on prescriptions exists, it is likely that for selected diseases best estimates can be provided if the pharmacological category of the drug used for treatment is completely disease-specific. An example of this is Parkinson’s disease in Belgium. However, the results of this approach showed in reality that these drugs are indeed overused for (mis-diagnosed) cases of parkinsonism. This negative outcome has been ruled out thanks to the availability of data from specific studies with confirmed diagnoses of Parkinson’s disease done in Belgium. One common problem faced by the pilot countries was that if only one data source was available, it was not possible to validate it against any known ‘golden standard’ and to make an-evidence-based decision on rejecting/accepting/integrating it. In future the decisions should be made based on epidemiological knowledge and agreed criteria.
On the other hand, even in cases where more than one source was evaluated, as was done by Germany, a final consensus on which one was the best source in order to provide best national estimates was not achieved.
These issues enforce the need to further develop methodologies to consolidate the valuable experiences done so far. Based on the example reported below on Parkinsonism, it is evident that MS are in the best position to assess the quality of each data source.
0
10
20
30
40
50
60
70
80
LV NL SI EE HU LT PL RO FI AT CY CZ MT SK
Dis.-spec.reg.
Prov.ambul.healthcare
Hosp.data
Insurance Comb. N/A
Age-
stan
dard
ised
rate
per
10 00
0
Male Female

2 Examples from the pilots
20Morbidity statistics in the EU — Report on pilot studies
Figure 7: Parkinson’s disease, 2005 (period prevalence)
Why is this example important?
It shows that: 1. pilot countries have made efforts in trying to distinguish those cases where the identified source seemed to be a reliable one in the beginning of the exercise. 2. The availability of a comparative source from an ad hoc study allowed an over reporting problem in one of the pilot countries to be identified; it is important to use a multi-source approach that can validate the final estimates obtained from the source(s) considered the most reliable; this can in turn lead to statistical computation of the best national source(s) for a specific disease.
The good news from the registers of pathologies: the case of incidence of malignant neoplasms
The most commonly used source for estimating cancer incidence is usually cancer registers established in almost all countries. For malignant neoplasms all of the pilot countries could provide the requested estimates, as this is a very well established data collection followed and disseminated by IARC. Although the registration of new cancer cases is usually mandatory, the main threat to the validity of cancer incidence data could be the incomplete reporting of new cancer cases by health professionals and the inability to account for those cases of cancer which are observed after death.
Figure 8: All malignant neoplasms (cancer), 2005 (incidence by person)
However, sometimes the reasons for selecting one source over another are not clear. For example in the case of cancer registry in PL, data from this source are constantly lower when compared to other sources i.e. hospital data. The preference almost always goes to the cancer registry because the diagnoses are confirmed, while the
0
10
20
30
40
50
60
NL SI BE EE HU LT PL RO FI AT CY CZ LV MT SK
Prov.ambul.healthcare
Hosp.data
Insurance Comb. N/A
Age-
stan
dard
ised
rate
per
10 00
0
Male Female
0
10
20
30
40
50
60
70
80
AT BE CY CZ EE FI HU LT LV MT NL PL RO SI SK
Disease-specific register
Age-
stan
dard
ised
rate
per
10 00
0
Male Female

2 Examples from the pilots
21Morbidity statistics in the EU — Report on pilot studies
data from hospital may be less precise. However, in this case the cancer register has questionable coverage: under reporting is estimated on the basis of the indicators in other countries with a similar economic development level (it was estimated on the level of 17 % at the time of the pilot exercise). The cause of under reporting is non-compliance to obligation to register cancer incidence cases by the doctors; only the estimation of total number of all cancers is published in Poland.
Why is this example important?
It shows that: 1. Even for estimates derived from the same kind of source, i.e. disease-specific registers, the coverage and comparability issues are far from being solved. 2. As the data collection and sources are well established, the question remains ‘are the observed differences real ones’?
The limitations of the registers of pathologies: the case of prevalence for malignant neoplasms
The most commonly used source for estimating overall cancer prevalence was cancer registers. However, some limitations appear evident in estimating prevalence across the pilot countries. The age-standardised rates for PL and SI from the national registers seem to underestimate the prevalence. Similarly, for CY who has provided these data according to EHIS survey. Estonia used the national insurance data as a source. The main difficulties of working with measures of prevalence are due to different definitions used by the pilot countries with respect to the period to be considered; the cases to be included; follow-up procedures to ensure that recovered persons/deaths are not counted, and so on. These limits apply in many cases to register-based data for prevalence for other diseases that are curable.
Figure 9: All malignant neoplasms (cancer), 2005 (period prevalence)
Why is this example important?
It shows that: 1. prevalence data are different for cancers due to some variations in the definitions and estimation methods applied. 2. The issue of coverage is of course relevant for prevalence as already mentioned for incidence. 3. Other sources could be potentially available beside the registers, EE chose the source ‘insurance’ for the estimation of total cancer prevalence. 4. In some cases there might be an overestimation of prevalence due to the lack of appropriate procedures (including inability to access other sources by the cancer registries) to exclude those cases not to be counted as prevalent in a specified period of time. 5. Epidemiological registers should follow people with a disease until relapse or death, but generally no information is collected if the person is fully recovered and when this happened.
Diseases of primary importance for Public Health: the case of acute myocardial infarction (AMI)
Only 7 out of the 16 participating countries were able to provide age-standardised AMI incidence estimates, and 10 provided prevalence estimates despite AMI being a health problem of paramount importance in terms of

2 Examples from the pilots
22Morbidity statistics in the EU — Report on pilot studies
frequency, seriousness, social and economic costs, amenability to medical intervention and priority-ranking by policy makers and the community. If these results could be encouraging for some other diseases, the expectations on the possibility of having a more complete insight into this disease were partly not met.
Some of the notable difficulties faced during the pilots were: differences in definition (ICD coding-based or based on diagnostic criteria) changes in definition, and the diversity of the various diagnostic assays may have heavily affected AMI incidence rates and AMI-Case Fatality Rates. With the projected increase of those aged ≥ 65 years to 20 % of the adult population in developed regions of the world by 2025, the burden of AMI will be felt even more acutely in the years to come.
Since both case-fatality rates vary by hospital and by sex, it appears that medical practice varies as well (37).
AMI mortality in non- hospitalised cases is very high in the first two hours, implying the need to combine causes of death statistics and hospitalisation data to obtain incidence figures.
Most non-fatal AMI-cases are referred to hospital for treatment. Hence combining hospital-data of non-fatal cases with CoD data might be possible for an important proportion of EU member states; this approach could however face difficulties as discharge data in several countries are not person-based, but episode-based. As shown in the figure below on incidence by person, three pilot countries (BE, FI, PL) could link/merge two different sources, resulting in quite similar figures.
Figure 10: Acute myocardial infarction, 2005 (incidence by person)
In general it seems that incidence per person was the most difficult indicator to estimate, as in the case of AMI the pilot countries had problems with definitions for diseases with ‘attacks’ (such as for asthma and Chronic Obstructive Pulmonary Disease).
Ten Countries provided age-standardised AMI period prevalence rates. In the case of Cyprus and Malta data sourced from self-reported surveys (HIS) were used, probably leading to an important overestimation. The graph below shows reasonably comparable figures for the other countries.
(37) Schiele F, et al. Eur Heart J 2005; 26(9):873-880.

2 Examples from the pilots
23Morbidity statistics in the EU — Report on pilot studies
Figure 11: Acute myocardial infarction, 2005 (period prevalence)
Why is this example important?
It shows that: 1. Even for a disease which represents one of the major causes of death in Europe, we still base our knowledge on partial and not fully comparable data. This information gap must be filled in the forthcoming years. 2. Based on EUROCISS project, the indicator should be calculated as ‘Age-standardised attack rate by sex’ with linkage between data on hospital care and causes of death or disease-specific register data (ECHI indicator 24). However, the pilot results for incidence by person suggest permitting the inclusion of different kind of sources. 3. If EHIS data are excluded from this example, the prevalence estimates show relatively similar values, suggesting that more in-depth analysis is required for assessing the real comparability of estimates.
Estimates derived from hospital discharge data: the case of femur fracture
This injury occurs frequently, particularly among older age groups, and can be a potentially deadly injury. It is important to measure the incidence of fracture of femur, as it creates a significant burden on the health care system in terms of hospitalisation, rehabilitation, long term consequences, on-going care, and potentially high delayed fatality rates. Next to this femur fracture can also be seen as a proxy of accidental falls in the elderly.
Figure 12: Fracture of femur, 2005 (incidence by episode)

2 Examples from the pilots
24Morbidity statistics in the EU — Report on pilot studies
Why is this example important?
It shows that: 1. Although five countries (BE, FI, NL, SI, SK) used the same source (hospital data) for femur fracture incidence, the estimates show a high level of variation. As femur fracture is an injury which needs to be treated in hospital, this source is expected to be the best one. 2. The registration and coding of diseases in hospital discharges data needs to be investigated as there could be data quality issues (as reported by NL). 3. Estimates derived from reimbursement-driven sources (EE, LT) are reasonably similar to data derived from non-reimbursement driven insurances sources. 4. Countries have different data collection and coding practices regarding the number of primary and secondary diagnosis, and the pilot countries may have used only primary diagnoses or a limited number of secondary diagnoses to identify the cases for the shortlist of diseases.
Should we use data from the Health Interview surveys for producing morbidity statistics?
Despite the clear instructions in the guidelines that only diseases diagnosed and reported by physicians should be used, some pilot countries were confronted by the fact that HIS (or EHIS) data were the only available sources for providing information on some of the selected diseases.
The TF conclusion on this aspect reiterates that health interview surveys are not recommended for the compilation of morbidity statistics for a number of reasons. These include the information collected from such a surveys is very subjective; the respondents may interpret the specific medical questions differently and could mix up symptoms and diseases; the response rates can be low; and the surveys can be limited to specific diseases and may exclude younger ages. Also institutionalised people are often excluded from all surveys leading to underestimated prevalence figures.
The evidence from the pilot studies shows that for those countries that provided HIS/EHIS data only the level of estimates are not comparable to those of the other pilot countries. One example of this is given by the indicator on eating disorders where it is clear that the self-reported estimates provided by Malta are many times higher than those provided by other diagnoses-based sources.
In general, a substantial underestimation of this condition is expected (as well as for migraine, visual impairments, hearing loss, back pain, and other conditions for which a contact with health care providers is rarely required, or where these are not reported as the most relevant diagnoses by physicians).
Figure 13: Eating disorders, 2005 (period prevalence)
On the other hand, the example on migraine highlights that HIS data can be a relevant source in those cases where the disease can be assimilated with symptoms of different underlying aetiology when self-reported. In the case of migraine/headache syndromes the physicians will most likely code the underlying condition thus resulting in lower estimates for this group of diseases.

2 Examples from the pilots
25Morbidity statistics in the EU — Report on pilot studies
Figure 14: Migraine and other headache syndromes, 2005 (period prevalence)
Why are these examples important?
They show that: 1. Self-reported health status usually differs from morbidity estimates, generally (but not always) showing higher rates for the specified diseases; 2. The two examples highlight the importance of correctly addressing the questions at population level: what is the real proportion of the population suffering from migraine/headache? Even in presence of a correctly diagnosed condition the perceived quality of the health status may differ and the identification of the appropriate source(s) is crucial. 3. Striking differences in the levels of the provided estimates show that considering just EHIS data could significantly impact the allocation of economic resources for tackling some diseases. On the other hand, for such conditions diagnosis-based data are not good enough for getting accurate estimates from the identified sources, and further analyses and methodological improvements should be worked out. 4. The inclusion of co-morbidities would be of particular of importance, as those conditions and diseases are often reported as secondary diagnoses only.
What we could gain from low-prevalence diseases: the case of multiple sclerosis
The case of multiple sclerosis is relevant in the sense that the estimates are derived from several different sources and show a consistent higher prevalence in females, in accordance with the scientific literature.
Figure 15: Multiple sclerosis, 2005 (period prevalence)

2 Examples from the pilots
26Morbidity statistics in the EU — Report on pilot studies
Why is this example important?
It shows that: 1. With the possible exception of hospital data, different population-based sources could be used for estimating multiple sclerosis prevalence. 2. The gender pattern of higher prevalence in females compared to males is consistently observed in all of the reporting countries. Despite this evidence, other problems such as under coverage or similar biases cannot be ruled out, but it confirms a general pattern known from the literature, and upon which some methodological refinements could be built. 3. The estimates computed from the pilot studies show that the proposed approach could represent a considerable improvement compared to the traditional tools such as HIS surveys, particularly for a disease with such a relatively low rate of prevalence. In fact, for low-prevalence neurodegenerative diseases such as Parkinson’s disease or multiple sclerosis (or even for epilepsy), substantially large sample sizes are required, with considerably higher costs for performing the data collection.
When data linkage seems to be the solution: the case of Dementia (including Alzheimer)
Prevalence estimates for dementia including Alzheimer disease were requested in the morbidity shortlist. The importance of linkages can be clearly seen in the following example from the Finnish pilot study. The numbers of patients with dementia (including Alzheimer’s disease) were similar in the hospital discharge register covering health and social welfare institutions (79 656) and in the disability allowance register (80 612), but merging these data sources with ID number gave a significantly higher number of people with dementia (134 284) increasing the estimates based on a single source by 69 % and 67 %, respectively. As reported in the graph below the estimates from FI are much higher compared to those of other pilot countries regardless of the type of source used.
Linkage of individual records however is not frequently feasible in other countries, due to legal restrictions, high costs or time-consuming linkage processes. In some countries, these kinds of data linkages can be done by using unique personal identity code (deterministic record linkage). Alternatively, probabilistic record linkages can be done by using available variables, such as sex, birth date, name and address of the registered person. The latter option may cause a minor bias, but the successful linkages often reach a success rate of 95 % or more.
Figure 16: Dementia (incl. Alzheimer’s disease), 2005 (period prevalence)
Why is this example important?
It shows that: 1. The possibility of linking relevant data sources indicates high potential for the establishment of an EU regular data collection on morbidity and for its success and reliability. 2. Other similar approaches, such as merging of aggregated data should be further investigated, as these could be feasible in other EU countries.
2 Examples from the pilots
27Morbidity statistics in the EU — Report on pilot studies
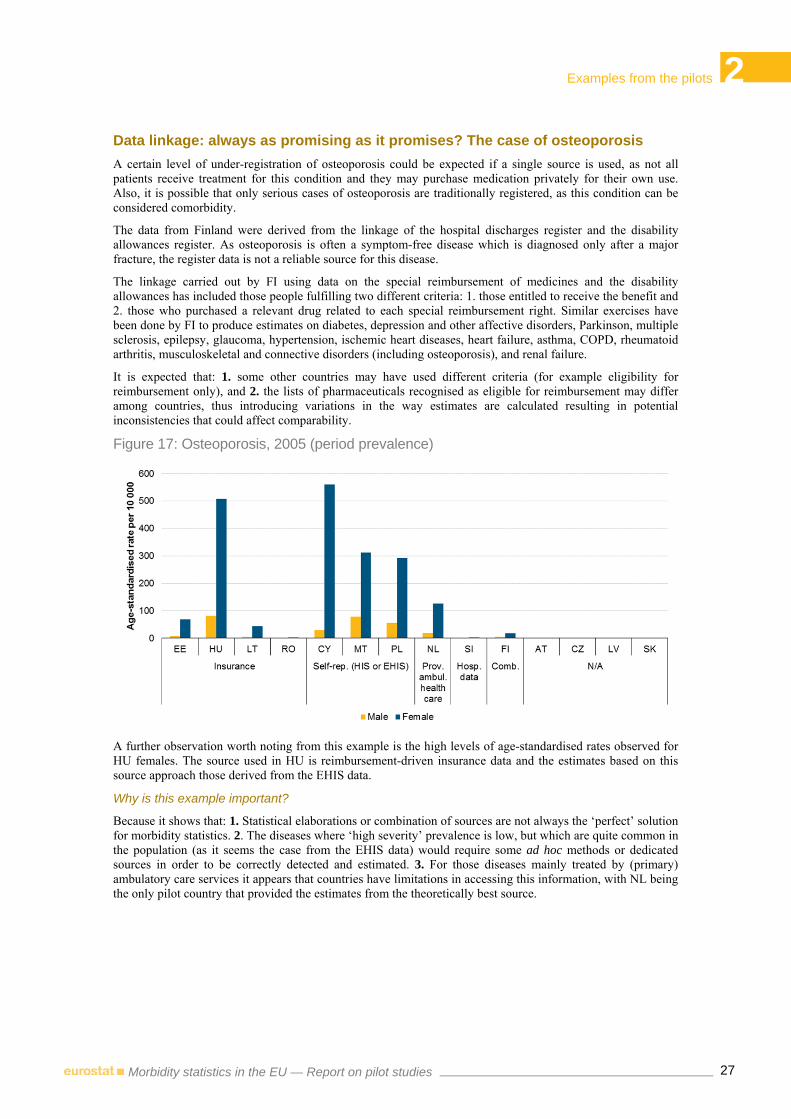
Data linkage: always as promising as it promises? The case of osteoporosis
A certain level of under-registration of osteoporosis could be expected if a single source is used, as not all patients receive treatment for this condition and they may purchase medication privately for their own use. Also, it is possible that only serious cases of osteoporosis are traditionally registered, as this condition can be considered comorbidity.
The data from Finland were derived from the linkage of the hospital discharges register and the disability allowances register. As osteoporosis is often a symptom-free disease which is diagnosed only after a major fracture, the register data is not a reliable source for this disease.
The linkage carried out by FI using data on the special reimbursement of medicines and the disability allowances has included those people fulfilling two different criteria: 1. those entitled to receive the benefit and 2. those who purchased a relevant drug related to each special reimbursement right. Similar exercises have been done by FI to produce estimates on diabetes, depression and other affective disorders, Parkinson, multiple sclerosis, epilepsy, glaucoma, hypertension, ischemic heart diseases, heart failure, asthma, COPD, rheumatoid arthritis, musculoskeletal and connective disorders (including osteoporosis), and renal failure.
It is expected that: 1. some other countries may have used different criteria (for example eligibility for reimbursement only), and 2. the lists of pharmaceuticals recognised as eligible for reimbursement may differ among countries, thus introducing variations in the way estimates are calculated resulting in potential inconsistencies that could affect comparability.
Figure 17: Osteoporosis, 2005 (period prevalence)
A further observation worth noting from this example is the high levels of age-standardised rates observed for HU females. The source used in HU is reimbursement-driven insurance data and the estimates based on this source approach those derived from the EHIS data.
Why is this example important?
Because it shows that: 1. Statistical elaborations or combination of sources are not always the ‘perfect’ solution for morbidity statistics. 2. The diseases where ‘high severity’ prevalence is low, but which are quite common in the population (as it seems the case from the EHIS data) would require some ad hoc methods or dedicated sources in order to be correctly detected and estimated. 3. For those diseases mainly treated by (primary) ambulatory care services it appears that countries have limitations in accessing this information, with NL being the only pilot country that provided the estimates from the theoretically best source.

2 Examples from the pilots
28Morbidity statistics in the EU — Report on pilot studies
When episodes count: the case of Tuberculosis
The majority of the countries that participated in the pilot have a disease-specific register on tuberculosis, as in most countries reporting tuberculosis is part of a compulsory notification or surveillance system. Multiple episodes of tuberculosis may occur during the same year, and the result of the pilots show that this is indeed the case especially for males and particularly in EE, HU, LV, PL, LT. The purpose of collecting incidence by episode for a disease is mainly to address the burden on the health system and its capability in terms of preventive measures and efficacy of treatment. One possible limitation of estimating incidence by episode for TB lies in the possible different definitions adopted by the pilot countries: relapsed/recurrent episodes (and re-infections) should be counted based on laboratory confirmation and clear personal identification. Moreover, people with a continuing episode of TB that requires a treatment change should be considered as prevalent cases, not incident ones.
Figure 18: Tubercolosis, 2005 (incidence by episode)
Why is this example important?
It shows that: 1. Alternative sources to diseases registers can also be explored for selected infectious diseases. 2. Incidence by episode may be meaningful provided that the definition of ‘episodes’ is clear enough (and distinguished from ‘re-infections’) and feasibility of collecting data according to the definition is at an acceptable level in the pilot countries.

3 Main findings
29Morbidity statistics in the EU — Report on pilot studies
Chapter 3 — Main findings
3.1 The General approach for establishing diagnosis-specific morbidity statistics at EU level
The present pilot builds on several activities which were launched by Eurostat towards establishing diagnosis-specific morbidity statistics at European level. These activities can be summarised as follows. First the different methods for collecting morbidity statistics have been explored and laid down in a working paper (1998). An important seminar took place in London (2003) during which a matrix approach was accepted for identifying best sources for a shortlist of diagnoses. Subsequently during meetings of the Partnership Health Statistics all elements were brought together in a pilot project (2005–06) for testing the proposed shortlist and data sources.
The conclusions and recommendations of these activities have been worked out by the Morbidity Statistics Development Group – MSDG (2006–07), in particular by means of the guidelines aiming at a framework for regular dissemination of statistical results at EU level, which is tested in the present pilot.
The different pilot waves have been closely monitored by Eurostat by the procedures for projects management until 2009, when the activities on morbidity were temporarily stopped due to reorganization of priorities. In 2011, when the work on morbidity was resumed, Eurostat launched the present Task Force.
The MSDG established a framework for the development of EU morbidity statistics along the following lines.
At European level the focus is on regular data compilation for a selected set of diseases (a shortlist) within the European Statistical System (ESS) in order to provide a general picture of diagnosis-specific morbidity at population level in line with the shortlist for mortality. Such a description is at a high level of aggregation for general use by politicians and health managers, the public and media, industry and insurance, and research. Depending on specific purposes the statistical description of public’s health by means of data from HIS, MORB and Causes of death will need to be complemented by results from specific research.
The original idea of the recommended matrix approach (2003) (38) was that for an agreed shortlist of diagnosis (i.e. a list of selected diseases) a list of best possible sources should be established. It was assumed that for each disease of the shortlist a single data source could be found for incidence and / or prevalence data while at the same time, data sources could differ for different diseases. However, this assumption on the availability of single sources turned out to be unrealistic. Therefore, the methodological approach for diagnosis-specific morbidity statistics further develops the original matrix approach beyond the use of single sources towards using information from several sources (if needed) to produce best national estimates. The main emphasis is on a common output at EU level, irrespective of the national sources.
For each entry in the recommended shortlist (39) the appropriate measures for data delivery are indicated: incidence, prevalence, etc. Each country has to find appropriate sources which can be used for the production of best national estimates. The main precondition for the inclusion of a data source is that it has to be as far as possible statistically robust on the main relevant data quality parameters and hence permit reliable inter country comparisons. Whenever necessary any suitable source may be adapted in order to improve the quality of the measure. In some cases where no reliable data at national level are available, regional data or survey results can be recalculated in order to obtain reliable estimates at national level. Methods of imputation which are commonly used in statistics may also yield better results. This also implies that special attention should be given to the metadata in order to keep the estimation processes transparent. Countries need to clearly document and explain how the best national estimates were achieved.
Hence, like many Eurostat statistics, the compilation of diagnosis-specific morbidity statistics is output driven and not source oriented. The shortlist for diagnosis-specific morbidity is following a feasibility approach in view of relevance and dissemination. The dissemination according to the shortlist is based on data delivered by Member States (40) from the most appropriate (national) sources. These sources differ among Member States, although some sources can be identical, e.g. on communicable diseases. The reason for this is that most sources
(38) See also 1.5 — London morbidity seminar. (39) Diagnosis-specific morbidity – European shortlist, version 6 March 2007. (40) For (groups of) diagnosis, existing international data sources could also be the data provider; this needs to be investigated together with the
countries.

3 Main findings
30Morbidity statistics in the EU — Report on pilot studies
in Member States are strongly influenced by the organisation of the health care services and/or health information services. For instance data from general practitioners are not fully comparable because in some Member States patients can go directly to medical specialists whereas in other Member States they have to go first to a general practitioner who may or may not refer them to a specialist.
On the basis of these general approaches each Member State is recommended to gradually develop a reporting system of diagnosis-specific morbidity data using the most appropriate national data sources together with statistical and other scientific methods to improve results of a given source and to achieve the most accurate estimation of diagnosis-specific morbidity (41).
The recommended stepwise approach includes the following steps:
• Step 1: list and describe all potential national sources for each ‘cell’, i.e. each entry of the shortlist and the required measures (incidence, prevalence). This is the national meta information (output 1). This step has been performed in each country. However it may be that in some cases the rubric ‘additional data sources’ and ‘international data sources’ are not complete.
• Step 2: decide on the most appropriate method for estimating the national data for each disease. This is the national plan of operations (output 2). This step is up to the countries to make. Some have detailed plans and others rather general ones.
• Step 3: calculate the estimates for submission of tables to Eurostat according to the methods described in step 2 using the sources of step 1. This is the national implementation plan (output 3). This is the difficult part of the study and several countries faced unexpected difficulties and hesitated to combine different sources to come to a synthetic disease measure. It can be assumed that more prototype techniques will improve this part of the data delivery and hence improve substantially the quality of the international data and comparability at EU level.
3.2 Indicators: from theory to practice
The morbidity statistics are primarily measured in incidence and prevalence. Incidence can be subdivided into incidence by person and incidence by episode. Prevalence can be subdivided into period prevalence and point prevalence. These four indicators are differently collected for the 67 diseases of the shortlist. As for some diseases, like chronic diseases (e.g. glaucoma, chronic obstructive pulmonary disease and rheumatoid arthritis) only 12 month prevalence is conceptually and statistically meaningful, for others, like HIV/AIDS, there is a need for incidence and prevalence data.
Definitions, use and proposed improvements for estimating incidence
The incidence of a disease is defined in the guidelines (Annex 4) as ‘the rate at which new cases occur in a population in a given time period, usually in the past 12 months. The numerator is the number of new cases; then denominator is the population at risk at the time when the cases were ascertained’. Incidence is reported as either incidence by person or incidence by episode.
For some diseases such as juvenile diabetes that can be contracted only once during lifetime, it may be more relevant to measure the first event only per person in the given time period. This is referred to as incidence by person. Incidence by person is used mainly for chronic diseases. In the present pilots it has been collected for diseases including cancer and Acute Myocardial Infarction (Table 2 — this table includes EHIS/HIS data).
For other diseases a person may experience the same event on more than one occasion during the specified time period. It is therefore more appropriate to measure all occurrences of such diseases within the specified time period. This is referred to as incidence by episode, and is used mainly for communicable diseases. In the present pilots it has been collected for diseases such as infectious diseases and injuries.
Incidence by episode is collected for seventeen diseases (Table 1 — this table includes EHIS/HIS data).
(41) This means that there are some similarities with the approach used to produce data for the System of Health Accounts (SHA).

3 Main findings
31Morbidity statistics in the EU — Report on pilot studies
Table 1: Diseases for which incidence by episode is required and number of countries that collected these data (age-standardised rates)
Incidence
by episode
Chapter I. Certain infectious and parasitic diseases
1. Tuberculosis (A15-A19, B90) 11
2. Sexually transmitted diseases (STD) (A50-A64) 9
3. Viral hepatitis (incl. hepatitis B) (B15-B19) 10
4. Human immunodeficiency virus disease (HIV/AIDS) (B20-B24, Z21) 11
Chapter X. Diseases of the respiratory system
39. Influenza (J09-J11) 6
40. Pneumonia (J12-J18) 6
Chapter XIX. Injury, poisoning and certain other consequences of external causes
57. All morbidity due to injury, poisoning and certain other consequences of external causes (S00-T98)
6
58. Intracranial injury (S06) 8
59. Fracture of femur (S72) 9
60. Poisoning by drugs, medicaments and biological substances and toxic effects of substances chiefly non medicinal as to source (T36-T65)
6
Chapter XX. External causes of morbidity
A. All morbidity due to external causes (injuries, poisonings, etc.) (V01-Y89) 5
B. Land transport accidents (V01-V89) 7
C. Accidental falls (W00-W19) 5
D. Accidental poisoning (X40-X49) 6
E. Intentional self-harm (incl. suicidal attempt) (X60-X84) 6
F. Assault (X85-Y09) 5
G. Complications of medical and surgical care (Y40-Y66, Y69-Y84) 4

3 Main findings
32Morbidity statistics in the EU — Report on pilot studies
Table 2: Diseases for which incidence by person is required and number of countries that collected these data (age-standardised rates)
Incidence by person
Chapter II. Neoplasms
5. All malignant neoplasms (C00-C97) 16
6. Malignant neoplasm of oesophagus (C15) 16
7. Malignant neoplasm of stomach (C16) 16
8. Malignant neoplasm of colon, rectum and anus (C18-C21) 16
9. Malignant neoplasm of trachea, bronchus and lung (C33, C34) 16
10. Malignant melanoma of skin (C43) 15
11. Mesothelioma (C45) 15
12. Malignant neoplasm of breast (C50) 16
13. Malignant neoplasm of cervix uteri (C53) 15
14. Malignant neoplasm of uterus other than cervix (C54, C55) 16
15. Malignant neoplasm of ovary(C56) 16
16. Malignant neoplasm of prostate (C61) 16
17. Malignant neoplasm of bladder (C67) 15
18. Leukaemia and other malignant neoplasms of lymphoid and haematopoietic tissue (C81-C96) 16
Chapter IV. Endocrine, nutritional and metabolic diseases
19. - Diabetes mellitus (E10-E14) 7
Chapter IX. Diseases of the circulatory system
36. Acute myocardial infarction (I21, I22) 8
38. Cerebrovascular diseases (I60-I69) 6
Chapter X. Diseases of the respiratory system
41. Asthma (J45, J46) 4
42. Chronic lower respiratory disease (J40-J44, J47) 4
Chapter XI. Diseases of the digestive system
46. Cholelithiasis (K80) 5
Chapter XIV. Diseases of the Genitourinary System
56. Urolithiasis (N20 - N23) 4
For diseases where special notification systems or registers exist (like infectious diseases and cancer), collection of incidence data is not a problem for most of the countries.
Complete information on incidence by episode for infectious diseases was given by 9 to 11 pilot countries. The data were mainly based on mandatory surveillance data on infectious diseases.
Data on incidence by person of cancer are available in 15-16 countries, as registration of new cancer cases is mandatory and follows international guidelines and rules. Cancer registers are the main data source of cancer statistics in all countries. Nearly all countries have estimated cancer incidence by person using cancer register data. The main threat to validity of cancer incidence estimation based on a cancer register data is the possible incomplete reporting of new cancer cases by health professionals, and the inability to account for those cases of cancer which are found after death only. These issues were noted by some of the countries during the pilot.
Complete information on incidence for other diseases (diabetes, acute myocardial infarction, cerebrovascular diseases, influenza, pneumonia, asthma, chronic lower respiratory disease, cholelithiasis, urolithiasis, for injuries, poisoning and certain other consequences of external causes, external causes) was presented by 4 to 9
3 Main findings
33Morbidity statistics in the EU — Report on pilot studies
countries. Generally specific registers do not exist for most of these diseases. Therefore collection of incidence data is quite complicated.
For example in the case of injuries, poisoning and certain other consequences of external causes, it’s difficult to have a clear image as there are several sources that collect the information and many countries cite difficulties in finding a suitable algorithm in order to identify unique cases. Some countries reported that, in the future, it is envisaged the injury registers may be developed.
In some countries (EE, LT, partly DE) incidence estimates are based physicians’ choices as to whether the diagnosis is new or not. Those countries use special modifiers to mark the new cases. However most of the countries are unable to identify incidence cases directly. Therefore some algorithms should be used. The Netherlands suggested the following definition: incidence by person could be defined as the number of persons that had contact with the health care system in the reporting year, and did not have previous contacts for the same disease in the past x years.
Incidence by person and incidence by case
An important issue is the differentiation between incidence by person and incidence by case. If a unique patient identifier is used it is easier to calculate incidence by person.
Nearly all countries have estimated cancer incidence for specific cancers by person, however there were countries clearly stating that they cannot identify individuals, but just ‘new cancer cases’ (PL). This may also apply to other countries. Only a few countries were able to estimate incidence by person by cancer site. However, the estimation of incidence by person may be possible in the future. Overall, the comparability of cancer incidence data across countries may be considered to be acceptable.
Internationally accepted recommendations define cancer incidence as the number of new cancer cases in a given period in a given population. The definition ‘incidence by person’, as proposed by the MSDG, implies that instead of counting new cancer cases, persons newly diagnosed with cancer must be counted. The difference between the number of cases and number of persons occurs in situations when one person has multiple primary cancers. Different definitions should not substantially influence estimates, because the number of persons with multiple cancers is likely to be low. However the focus on persons and not cases has resulted in inconsistencies.
Where the data collection is not based on cases, it can be difficult to distinguish between new cases of acute diseases and the continuation of treatment of the same case. This is particularly important for diseases that a person could contract multiple times per year (some infectious diseases, influenza, pneumonia, injuries). Therefore countries should develop their own algorithms (or operational definitions) to solve such problems depending on the source and data registration method.
A number of countries calculate incident cases as new cases identified in a particular year, without reference to previous years. However other countries have made recommendations that a number of previous years should also be examined when calculating this indicator.
For example, Hungary considers that if a person was not observed with the same disease in the previous 5 years then it is a new incidence.
The Netherlands also use a period of 5 years for indicators that are based on hospital discharge date. They define the clinical incidence as the number of persons having at least one hospital discharge for the disease in the reporting year, and not having a discharge for the same disease in the preceding 5 years.
Other countries have defined incidence by person as the number of first occurrences of a disease in a year, without reference to the previous number of years. Some countries have not indicated how they defined incidence by person.
Hungary recommended that a time period should be defined for each disease that is used to distinguish between recurrences of disease and previous episodes of a disease.
They suggest that for example a patient observed with influenza at a given date and also observed with influenza one month later but none in between, should be considered to be two different cases. This is based on the assumption influenza rarely lasts longer than a month. They suggest that the assignment of such time periods should be done in a co-ordinated way among all participating countries in the project. The Netherlands also identify this issue. Their data on injuries assumes that every discharge is related to a different acute event, and is not a re-admission related to a previous injury. This may lead to an overestimation of the true incidence by episode.

3 Main findings
34Morbidity statistics in the EU — Report on pilot studies
This issue is also shown in the comments on incidence by episode for fracture of femur; where Estonia specified a time period of 2 months to distinguish between new episodes of a fracture and treatment for a previous injury.
Definitions, use and proposed improvements for estimating prevalence
Prevalence is measured as either point prevalence or period prevalence. Point prevalence is defined as ‘a rate which is calculated by dividing the number of individuals with a disease by the size of the population under consideration at a specific point in time’. Point prevalence is collected for HIV/AIDS and diabetes.
Period prevalence can often be a better measure for many diseases; particularly short-term diseases, or those with intermittent episodes which may not be included in an estimate of point prevalence. Period prevalence is defined as ‘the individuals with a disease at any time (within a specified time period) as a proportion of the population under consideration.’ It is noted in the guidelines that it is common practice to use 12 months as the study period. Period prevalence is requested for the majority of diseases in the shortlist, with the exception of STDs and influenza.
Not all countries provided information in their reports on how they defined prevalence and incidence, or the methodologies used to calculate these indicators. However, a number of countries provided considerable detail which is very useful in identifying the relevant issues which require a solution. A number of countries (Czech Republic, Finland, Germany, Latvia, Lithuania, the Netherlands, and Slovenia) also identified difficulties with the interpretation of the definitions, and recommended that the definitions should be refined and defined more clearly. It was recognised that the lack of specifications in the definitions could result in ambiguities. For example, the Netherlands recommend in their report that for future data collections on morbidity, it is advisable to define more precise and practical definitions of the desired prevalence and incidence measures, based on the type of data sources of diagnosed morbidity available in most European countries.
Period or/and point prevalence is required for all diseases from the shortlist except for influenza (Table 3 and Table 4 — these tables include EHIS/HIS data).
Table 3: Diseases for which period prevalence is required and number of countries that collected these data (age-standardised rates)
Period
prevalence
Chapter I. Certain infectious and parasitic diseases
1. Tuberculosis 9
2. Sexually transmitted diseases (STD) 6
3. Viral hepatitis (incl. hepatitis B) 7
4. Human immunodeficiency virus disease (HIV/AIDS) 7
Chapter II. Neoplasms
5. All malignant neoplasms (cancer) 11
6. Malignant neoplasm of oesophagus 10
7. Malignant neoplasm of stomach 10
8. Malignant neoplasm of colon, rectum and anus 10
9. Malignant neoplasm of trachea, bronchus and lung 10
10. Malignant melanoma of skin 10
11. Mesothelioma 10
12. Malignant neoplasm of breast 10
13. Malignant neoplasm of cervix uteri 10
14. Malignant neoplasm of uterus other than cervix 10
15. Malignant neoplasm of ovary 10
16. Malignant neoplasm of prostate 10
17. Malignant neoplasm of bladder 10

3 Main findings
35Morbidity statistics in the EU — Report on pilot studies
Period
prevalence
18. Leukaemia and other malignant neoplasms of lymphoid and haematopoietic tissue 10
Chapter IV. Endocrine, nutritional and metabolic diseases
19. Diabetes mellitus 13
Chapter V. Mental and behavioural disorders
20. Dementia (incl. Alzheimer’s disease) 9
21. Mental and behavioural disorders due to use of alcohol (incl. alcohol dependence) 9
22. Mental and behavioural disorders due to use of psychoactive substances other than alcohol and tobacco (incl. drug dependence)
8
23. Schizophrenia 9
24. Depression and other affective disorders 10
25. Anxiety disorders 9
26. Eating disorders 9
Chapter VI. Diseases of the nervous system
27. Parkinson’s disease 9
28. Multiple sclerosis 9
29. Epilepsy 8
30. Migraine and other headache syndromes 10
Chapter VII. Diseases of the eye and adnexa
31. Cataract 8
32. Glaucoma 9
Chapter VIII. Diseases of the ear and mastoid process
33. Hearing loss 10
Chapter IX. Diseases of the circulatory system
34. Hypertensive diseases 10
35. Ischaemic heart diseases 9
36. Acute myocardial infarction 10
37. Heart failure 8
38. Cerebrovascular diseases 8
Chapter X. Diseases of the respiratory system
40. Pneumonia 7
41. Asthma 9
42. Chronic lower respiratory diseases other than asthma (incl. COPD) 8
Chapter XI. Diseases of the digestive system
43. Gastric and duodenal ulcer (peptic ulcer) 11
44. Alcoholic liver disease 9
45. Diseases of liver other than alcoholic 9
46. Cholelithiasis 9
Chapter XII. Diseases of the skin and subcutaneous tissue
47. Dermatitis and eczema 8
48. Psoriasis 8

3 Main findings
36Morbidity statistics in the EU — Report on pilot studies
Period
prevalence
Chapter XIII. Diseases of the Musculoskeletal System
49. Rheumatoid arthritis 9
50. Arthrosis 8
51. Systemic connective tissue disorders 7
52. Spondylopathies and other dorsopathies (incl. low back pain) 9
53. Osteoporosis 10
Chapter XIV. Diseases of the Genitourinary System
54. Glomerular and renal tubulo-interstitial diseases 8
55. Renal failure 8
56. Urolithiasis 10
Chapter XIX. Injury, poisoning and certain other consequences of external causes
57. All morbidity due to injury, poisoning and certain other consequences of external causes
6
58. Intracranial injury 8
59. Fracture of femur 10
60. Poisoning by drugs, medicaments and biological substances and toxic effects of substances chiefly non medicinal as to source
7
Chapter XX. External causes of morbidity
A. All morbidity due to external causes (injuries, poisonings, etc.) 5
B. Land transport accidents 6
C. Accidental falls 6
D. Accidental poisoning 7
E. Intentional self harm (incl. suicidal attempt) 7
F. Assault 6
G. Complications of medical and surgical care 5
Table 4: Diseases for which point prevalence is required and number of countries that collected these data (age-standardised rates)
Point
prevalence
Chapter I. Certain infectious and parasitic diseases
4. Human immunodeficiency virus disease (HIV/AIDS) 4
Chapter IV. Endocrine, nutritional and metabolic diseases
19. Diabetes mellitus 3
For most of the countries and most of the diseases the collection of prevalence data is a problem, as generally there are no specific registers or registration systems. Existing registers usually collect incidence but not prevalence.

3 Main findings
37Morbidity statistics in the EU — Report on pilot studies
Between 4 and 9 countries have presented data for prevalence for different infectious diseases. Point prevalence for HIV/AIDS was presented by 4 countries only. Prevalence data is less important for infectious diseases. If prevalence data is to be collected, it should cover tuberculosis and HIV/AIDS only.
Complete cancer prevalence data are available in 10 countries. It appears (although this is not clearly stated) that the cancer registers in some countries (CZ, FI, LT, LV, RO) and the health insurance data base in EE, provide an opportunity to identify prevalent cases directly (using identification numbers) as no additional computations are reported.
However the estimation of prevalence data for cancer turned out to be complicated for many countries. Not all cancer registers allow the identification of individuals. Some cancer registers do not have sufficient historical data. Thus, various approaches were used to calculate prevalence from cancer registers. Some countries recognize that their cancer registers are not a suitable data source for cancer prevalence estimation, thus they have used health insurance data, health interview surveys or did not estimate cancer prevalence at all.
Some countries (AT, SI) argue that partial prevalence might be more appropriate indicator. E.g., AT has estimated all indicators of prevalence (point, partial (2-year, 5-year, 10-year) and period) and concludes that the partial prevalence is a more valuable measure. SI has estimated partial 1-year prevalence, PL – 5-years prevalence. Consequently, the prevalence rates for SI and PL were lower than in other countries. SI was the only country where prevalence rates were lower than incidence rates.
AT raises debate whether cancer discovered only after death have to be included in prevalence estimates or not.
Apart from that, there is a variety of approaches for prevalence calculation used. Some countries have estimated prevalence from incidence data and indicators of mortality / survival (AT, HU, PL) or by adding point prevalence at the beginning of the year and incidence during next year (NL), or by adding point prevalence at the end of the year and deaths during last year. AT has calculated prevalence indicators in several steps from point prevalence to partial prevalence and to period prevalence.
Complete information for period prevalence for other diseases was presented by 5 to 13 countries.
Some countries developed their own algorithms to calculated prevalence. One of the problems that countries encountered is to differentiate between confirmed and suspected diagnosis. In some countries (LT, EE) special modifiers exist to mark confirmed cases. Some countries (DE) have developed algorithms such as the number of times per year the disease should be registered in order to be calculated like confirmed diagnosis. For some diseases, the possibility of linkage of different databases, such as the use of particular medication, could be criteria for including into prevalence (BE, FI).
The report from Lithuania addresses the issue of how long a person with a previous history of a disease should be included in a measure of prevalence. For example, in Lithuania it is possible to calculate 5 year period prevalence of alcohol and drug related diseases. However, persons might no longer be using alcohol and drugs, and so it is questionable whether they should be included in a measure of prevalence.
Suggested definition (NL): prevalence could be defined as the number of persons that had contact with the health care system for the particular disease in the reporting year (year prevalence), or in the last x years up to the reporting year. The latter could also be used for approximating lifetime prevalence. The Netherlands consider it important to define meaningful time periods in relation to prevalence for all diseases. The decisions on this should be made after international discussion in order to get comparable data. One problem for calculating lifetime prevalence is that today’s data sources do not allow an assessment of the whole lifetime period.
For some diseases, especially diseases with short duration, the types of indicators to be delivered could be reconsidered. For instance in the case of pneumonia and external causes of morbidity, it is not clear what the value is of period prevalence as an indicator. If we are talking about fractures, only patients recorded in the reference year should be taken into account, or cases still in treatment after an injury that took place outside the reference year should also be counted?
Point prevalence is required only for 2 diseases: HIV/AIDS and diabetes. Only 3-4 countries have presented complete data for it. Point prevalence is the problem for most of the countries: it requires linkage with mortality data what is not always possible for different reasons (data protection, no personal ID).
Current usage and futures needs
Currently very few morbidity indicators for limited number of diseases are being used in most of the countries. They are incidence indicators for infectious diseases, cancer, injuries and prevalence of a few diseases mostly

3 Main findings
38Morbidity statistics in the EU — Report on pilot studies
calculated from Health Interview Surveys. For health policy planning there is an urgent need for more detailed morbidity statistics: more diseases and more indicators.
Each of the measures may require a different approach in curable diseases of short duration, curable or intermittent diseases with duration of several years, or incurable diseases. In general, period prevalence should be defined as year prevalence for diseases of short duration, and as lifetime prevalence for incurable diseases. It is sometimes debatable when a disease can be considered as cured. For example cataract - is a person still a prevalent case after replacement of the affected lens? And is a person who had cancer in childhood prevalent for the rest of his life? For acute diseases with a short duration, period (year) prevalence does not seem to add much to the incidence by episode measure (e.g. in the case of pneumonia, and external causes of morbidity).
In most of the countries existing data sources do not allow to the direct calculation of all required indicators and diseases from the shortlist. Therefore, most of the countries have developed special algorithms or operational definition for estimates. BE and FI used the definitions related to treatment. EE, LT, partly DE have special modifiers to differentiate between incidence and prevalence. DE developed special methods for calculation and validation of incidence and prevalence.
For very few cases some countries (CZ, SK, PL, LV) have incidence and prevalence data available directly from annual reports or specialised registries/databases.
For future data collections more precise definitions (at EU level) of the prevalence and incidence measures are recommended for each item in the morbidity shortlist. As the national sources of diagnosed morbidity are often registers of patients having health care contacts (contact-based registers), it might be advisable to define the prevalence and incidence measures in terms of health care contacts. Prevalence could e.g. be defined as the number of persons that had contact with the health care system for the particular disease in the reporting year (year prevalence), or in the last x years up to the reporting year. The latter can also be used for approximating lifetime prevalence. And incidence by person could be defined as the number of persons that had contact with the health care system in the reporting year, and did not have previous contacts for the same disease in the past x years. By defining the desired number of years of measurement (x) for each indicator and disease, it is expected that the international comparability of the outcome data will be improved.
3.3 Some diseases-specific examples on the definitions in use
Many countries commented on the definitions of incidence and prevalence for each specific disease, and other countries commented on the definitions applied according to each source used. The next paragraphs summarise some of the comments on the definitions of incidence and prevalence for specific diseases (cancer, fracture of femur and acute myocardial infarction). These diseases were selected as they provide an overview of many of the comments on incidence and prevalence, and they can relate to many other diseases. General comments from countries that are applicable to most diseases are also included below.
Period Prevalence for Cancer
A number of countries (Austria, Czech Republic, Estonia, Hungary, Lithuania, Malta, the Netherlands, and Slovenia) addressed the issue of how best to define cancer prevalence in their reports. It was noted that there are significant differences in the interpretation of prevalence within the ‘cancer community’, and also that the type of period prevalence required in the pilot was not clear.
The international recommendations (IARC) specify several cancer prevalence indicators. One of these indicators is complete / total prevalence, where all persons who ever had cancer are included. According to this definition, period prevalence has been estimated in at least four countries (HU, LT, LV, NL). Some countries (CY, PL) comment that the history of their cancer registers is not sufficiently long for such an approach. Obviously, health insurance data (DE, EE) do not conform to this approach, as recovered persons may not have contact with the health services related to their history of cancer and, therefore, they do not appear in these data.
Some countries (AT, SI) argue that partial prevalence might be more appropriate indicator. E.g., AT has estimated all indicators of prevalence (point, partial (2-year, 5-year, 10-year) and period) and concludes that the partial prevalence is a more valuable measure. SI has estimated partial 1-year prevalence, PL – 5-years prevalence. Consequently, the prevalence rates for SI and PL were lower than in other countries. SI was the only country where prevalence rates were lower than incidence rates.
It can be useful to differentiate between lifetime prevalence and partial prevalence. Lifetime prevalence can be defined as the total number of people alive who have ever been diagnosed with cancer. Partial prevalence can be defined as the number of people alive having been diagnosed a number of years before the reference date

3 Main findings
39Morbidity statistics in the EU — Report on pilot studies
(usually 2, 5 or 10 years). This is more relevant for quantifying resource requirements and estimating the burden of the disease.
The report for Austria noted that they consider partial prevalence to be the most useful measure in context of health care planning and resource allocation. Many other countries and organisations also use the concept of partial prevalence (or limited duration prevalence) in relation to cancer.
Note however that EUROPREVAL (a Europe-wide project to estimate the prevalence of the most important cancers) defines point prevalence as the proportion of individuals who have ever been diagnosed with cancer that are still alive at a given time. Hence it is assumed that cancer is an irreversible disease and diagnosed individuals remain cancer cases until death.
The Netherlands defined period prevalence as lifetime prevalence, because cancer is considered to be a chronic disease. However, their report questions whether a person who had cancer in childhood should be considered to be prevalence for the rest of their life.
Estonia recommended using point prevalence of cancer, as this is routinely used in cancer registries.
The issue of whether to count cancers rather than patients was also noted (i.e. how multiple malignant tumours should be counted). Slovenia reported that as the definition of period prevalence was not very clear, they used the same definition that was used in GLOBOCAN 2002 (http://www-dep.iarc.fr/globocan/database.htm), i.e. cancer cases (not persons) diagnosed within one year (1 January 2005 to 31 December 2005) where the persons were still alive at the end of the year (on 31 December 2005).
Incidence by Episode and Period Prevalence for Acute Myocardial Infarction
In general it appears that many countries had difficulties in accurately estimating the incidence and prevalence of diseases which involve ‘attacks’, such as AMI, asthma and COPD.
The report from Belgium notes that is it important that the measures requested for AMI are clear, as unlike many of the other diseases in the shortlist AMI is not a chronic disease. The report also notes that in relation to AMI, the term ‘incidence rate’ can mean the first occurrence of the disease, and the term ‘attack rate’ can refer to the incidence rates of all events, either first or recurrent. The report from Belgium notes that prevalence could be defined as patients who in their lifetime have ever suffered from AMI. The report notes that it is extremely difficult to obtain this type of information, as it requires longitudinal morbidity data in which people are followed over time. This data is not available at a national level. It is also noted that the term period prevalence is not usually used for acute conditions such as AMI.
The information provided by the Netherlands on AMI advises that they consider AMI to be an acute disease, and so have defined period prevalence as one year prevalence.
Incidence by Episode and Period Prevalence for Fracture of Femur
The report for Belgium noted that the number of patients with more than one fracture of femur during the same year is minimal. This results in very similar estimates for incidence per episode and period prevalence. Therefore lifetime or 5 year prevalence could be recommended instead.
Estonia calculated the incidence by episode of fracture of femur based on all non-hospital deaths with femur fracture reported on the death certificate, plus all hospitalisations of femur fracture that were identified as new cases and were at least 2 months after a previous injury. Period prevalence was calculated as the number of people with at least one invoice for a fracture of femur code during the year plus all non-hospital deaths due to fracture of femur.
The incidence of fracture of femur as reported by the Netherlands is based on hospital discharge data, and assumes that every discharge relates to a different acute event (episode), and is not a re-admission of patients who had a previous fracture.
The prevalence of fracture of femur was considered by the Netherlands to only include acute events, i.e. the number of people who had a fracture of femur in the reporting year. However the report notes that particularly for older patients, the rehabilitation treatment could continue in a subsequent year. It is not clear whether cases that are still receiving rehabilitation should be counted in the annual prevalence.
3.4 Potential data sources at national level
The following sources have been identified and recommended for calculating the best national estimates:

3 Main findings
40Morbidity statistics in the EU — Report on pilot studies
• Disease-specific registers. Such registers are primarily a source of incidence data.
• Administrative notifications (routine surveillance systems). These exist mainly for infectious diseases for which mandatory notification systems are in place in all EU countries. Other notification systems, e.g. on road traffic victims or suicides, are generally not harmonised in the EU.
• Hospital records for in-patients and out-patients. These data can contribute to diagnosis-specific incidence data but only to a limited extent.
• General practice (GP) records (primary care). GP records include information on consultations, diagnosis, prescriptions, treatments and test results.
• Sentinel practice networks. In many countries primary care based sentinel networks are operational on a continuous basis.
• Health insurance databases. The utilisation of health insurance data (public and private) can represent a valuable (and cost-effective) data source.
• International data sources. Potential data sources for diagnosis-specific morbidity statistics can also exist at the international level, e.g. the network of cancer registries under the aegis of JRC, or through projects funded by DG SANCO (42).
• Additional data sources. COD, epidemiological and public health studies, research data bases, data from patient organisations. These sources may contribute substantially to developing and/or improving algorithms at national level.
Participants of morbidity pilot studies had to describe and evaluate all potential data sources by criteria according to Eurostat methodology. In addition, for the wave 2 countries an assessment of the quality of sources (both primary and complementary) was requested. The pilot countries were asked to rate (from 0 to 5) the sources’ quality according to the standard parameters used in Eurostat for assessing quality dimensions for statistical information. Conclusions on the self-assessment of the primary sources are presented in Annex 6.
A large number of different health data sources exist in member states. Countries used different approaches — some strictly left out dubious source, others acknowledged that it was the only data source, although with deficiencies and included it. However, during the evaluation process many data sources were recognised as being unsuitable for producing morbidity shortlist estimates. The main reasons for not using data sources were: inadequate representativeness for the whole population; low data coverage because of voluntary registering; noncompliance of diagnoses for morbidity shortlist; infeasibility to convert diagnoses into ICD-10; episode rather than person based data providing unreliable results.
Disease registers and compulsory notification systems
These information systems have been built up for disease surveillance purposes and are widely used for statistics and research. They are not reimbursement driven; data collection is often mandatory and information is regularly updated. In many countries these systems cover the whole population. Thus, disease registers might be seen as a more reliable source compared to other data sources. Accessibility to these data differs by country (e.g., access is more restricted in BE) and also by specific disease (e.g., HIV and sexually transmitted infections are more sensitive issues than cancer), but in general the costs associated with producing estimates are low.
The usage of this type of data source, however, is limited to a minority of the shortlist diseases. There are two main groups of diseases — infectious diseases and cancers — with established traditions of surveillance and registration. Nevertheless, the actual quality and completeness of registration may not be perfect even if reporting is mandatory. Particularly, in the case of sexually transmitted infections, the completeness of reporting was frequently questioned and underreporting suspected. Moreover, there are some differences in legislation among countries regarding the specific infectious diseases which are subject to mandatory notification/reporting.
Disease registers were the most preferred data source for estimates of cancer indicators, and there were hardly any alternatives discussed. Only a few countries have recognised possible underreporting (PL, LT, RO). In the
(42) Information about projects funded by DG SANCO is available at http://ec.europa.eu/health/ph_programme/programme_en.htm See also Annex
10.

3 Main findings
41Morbidity statistics in the EU — Report on pilot studies
case of other diseases, an existence of the disease specific register is rather an exception than a norm (e.g., multiple sclerosis in LV). There are some registers which cover only limited set of diagnoses or only hospitalised patients; therefore, they were not chosen as a suitable data source. In some countries the reporting to disease surveillance systems is voluntary not obligatory, thus leading to non-representativeness and significant underreporting, e.g. on diabetes in BE). These registers usually were not considered to be an appropriate data source, but exceptions exist (e.g., HIV in NL).
Disease registers were rarely linked to or combined with other data sources, except the Causes of death registers. Adding the cases from the death registers is more important in some groups of diseases (e.g., cancers, external causes, acute myocardial infarction) than in others. Regarding cancers, several countries have reported the inability to do this linkage either because of legal restrictions or lack of identification numbers.
Insurance sources
More than half of the countries chose the reimbursement-driven sources as best source for several diseases.
Usually the purpose of insurance databases is to evaluate and assist the planning of medical expenses, and not to generate health statistics. For this reason there are often problems with using this source of data, including difficulties with accessibility to data and resistance to proposed methodological changes in the systems. However, some countries (HU, LV, LT) have already integrated insurance data with national health statistics. Although not intended for producing health statistics, most of the insurance databases used in the pilot were regular, official and sustainable data sources. Physicians are required to send necessary information about a case to the insurance database in order to be paid.
One advantage of insurance databases is they generally include coverage of the large part of the population.
The primary source allows computation of data for different care types, regions, diagnoses and age groups in majority of countries that used the insurance data. Insurance databases may allow for the possibility of linking data by unique personal identification number. However unfortunately this was not always practical in number of countries because of data protection restrictions, or excessively time-consuming and/or expensive data access procedures.
Most of the insurance databases are missing data from health care institutions that do not have contracts with the insurance fund or where the services are paid for directly by the patient. However they can attain quite good coverage (over 90 %) depending on the country. Coverage is clearly insufficient for most diagnoses when only hospital cases are included in insurance databases, such as in the case of DRG payments by Romania. Some insurance databases (PL, HU) did not cover primary care services and could be inappropriate for specific diagnoses. If prescription databases were used (BE, EE, FI) for some diseases only cases treated with medicines were included. Generally all diagnoses are covered with some exceptions such as external causes and traffic accidents for some countries.
Insurance databases are relatively new sources for computing morbidity indicators and not so much information about the quality assessment exists. Insurance funds definitely control data accuracy but usually with objectives other than the quality of morbidity statistics. Countries have mentioned that deficiencies in quality control exist, particularly for coding validity by physicians despite the use of ICD-10 in the majority of countries. Some differences in coding habits are unavoidable but coding quality needs more analyses. Influence of the reimbursement systems is described more in hospital cases.
Hospital data
Hospital inpatients databases exist in most countries and three-quarters of countries used hospital data for computing morbidity indicators. Data are generally collected regularly for a long time, are delivered to international organisations databases and there is substantial progress in harmonising data at international level. Data collecting is sustainable and access is easy in most countries.
Generally hospital databases cover all hospitals, although in some countries private hospitals and/or specialized hospitals are not included or psychiatric care is separated. Obviously there are differences in national definitions of nursing care and including or excluding it in different countries. In most cases hospital outpatient care is excluded (except FI). Sometimes only the main diagnoses are registered, and secondary diagnoses are not captured.

3 Main findings
42Morbidity statistics in the EU — Report on pilot studies
Hospital databases are usually of good quality. However for morbidity statistics they may sometimes be less useful because they are designed for collecting information per case and not per person. For international purposes there may be bias due to differences in the organisation of health services. Furthermore inpatient database are not always suitable for diseases in morbidity shortlist that normally do not require hospitalisation. Inpatient databases are appropriate in conjunction with other sources but as was seen in pilots inability to link databases is often a problem. Record linkage with death data was more feasible than with outpatient databases. Sometimes different databases were summarised or incomplete linkage was performed and these procedures could cause quality problems.
Providers of ambulatory health care
Theoretically, several diseases from the shortlist should be effectively covered by the ambulatory care providers (e.g., diabetes, hypertension, and arthrosis). In regard to comparability among countries, the task can be challenged by differences in a health care organization as the particular health care system dictates what services under what rules are provided by GPs, specialists etc.; and it may vary by disease and by subpopulations.
In reality, such information systems on ambulatory care, which would be independent from the reimbursement and financing, are scarce. E.g. NL has already developed an approach how to use GPs electronic records in order to get information for public health purposes (still, GP participation is voluntary, and this system is used also for financial purposes). Regular reports from GPs / family doctors exist in some other countries as well (SK, HU, RO); but the list of reported diseases and medical conditions vary. One of the diseases most often covered by ambulatory care data is diabetes; overall six countries have adapted the usage of this source to monitor diabetes morbidity, obviously, seen to be an important public health issue.
The need to link or combine ambulatory care data with hospital data and/or death registers has been recognised. Obstacles range from the lack of common identifiers in both data bases to restrictions imposed by existing legislation. Thus, the usage of this data source has been rather limited so far.
Contributory sources
Although the variety of different data sources may provide useful information, the most popular secondary data sources have been Causes of death registers and Health interview surveys.
Causes of death registers rarely can be regarded as a the main data source for morbidity statistics; however they can be effectively used in combination with other sources (hospital discharge data, health insurance data etc.) particularly for diseases and medical conditions with high fatality rate. Indeed, several countries (EE, BE, NL, PL) have generated morbidity estimates by adding cases from the death register to the main data source. This approach was used mainly for diseases and medical conditions such as acute myocardial infarction, cerebrovascular disease and external causes of morbidity. This practice is routinely used also in the field of cancer statistics. Again, lack of unique identifiers and legal restrictions may challenge a universal adoption of this approach; as simple summing up of cases may lead to the double counting if the same person appears in several data sets.
Health interview surveys, although considered to be only contributory sources for purposes of diagnosis-specific statistics, have been quite often recognised to be the only data source in some countries (CY, MT) and for a group of diseases and medical conditions such as mental and behavioural disorders, headache syndromes, osteoporosis, cardiovascular diseases and other chronic conditions. Unfortunately, self-reported health data, albeit being a very essential method of measuring population health, is not compatible with the aim of this particular project.
Metadata
To keep the estimation process transparent, accurate and complete metadata is important. Eurostat itemised minimum criteria for describing national sources, their coverage, potential biases and their overall quality.
Generally countries followed the proposed methodology, except a few who described data sources inadequately.

3 Main findings
43Morbidity statistics in the EU — Report on pilot studies
Some characteristics of a data source were described insufficiently more often than others. Coverage is one of these because of the need to describe different aspects. In some cases the issue was not addressed at all so it is not possible to say if the authors did not know the answer or they missed the point. For example for insurance sources it was not always described what population groups are covered with insurance and what proportion of the total population they cover. The possible impact of the organisation of the national health care system was not always described either.
For the second wave more precise criteria were given and the description of sources was more systematic and coherent.
3.5 Methods used for producing estimates
The MSDG produced some recommendations in view of the best estimates outputs on morbidity statistics. Considerable efforts were undertaken by the pilot countries in order to comply with the agreed methodologies and in several cases described the steps followed to adopt the best possible methodology.
Four main approaches have been followed by the pilot countries and these are summarised below:
1. Avoiding duplications: the main example is represented by additional checks and validation steps done on one single source in order to avoid duplication of persons; this may be done by excluding persons with the same personal ID or with coincident information when composite keys are used.
2. Merging of sources: the main example is represented by the addition of persons who died for a specific cause of death to those discharged alive from the hospital for the same diagnosis.
3. Linkage of sources: the main example is represented by individual record linkages based on personal unique ID or the use of composite keys.
4. Estimating the national incidence or prevalence from a sample: this method was used by The Netherlands.
Six (BE, EE, FI, NL, PL, SI) out of the sixteen pilot countries explored the possibility of linking/merging data or did some kind of combination of national sources in order to obtain the best estimates for selected indicators. The majority among them combined two different sources with the only exception of Finland who combined three sources for calculating e.g. the best estimates for depression and acute myocardial infarction.
The mostly frequently combined sources were hospital discharges (BE, FI, NL, PL (43)) and causes of death register (BE, EE, NL, PL). Estonia combined insurance data with the CoD register. Finland made a wide use of registers of Social benefits under the National Health Insurance scheme both for reimbursement of medicine and disability allowances; Poland merged information on in-patients and out-patients who contacted health care specialists. The Netherlands is the only pilot country that used the information system on general practitioners by linking information with the hospital discharge register.
As an example of limitations faced by the pilot countries in combining different sources, the report from Lithuania is very useful. In fact, despite the possibility of combining sources identified by Lithuania, most of epidemiological registers or databases had problems with prevalence data due to the strict confidentiality requirements of the national law on data protection. Due to this reason, the linkage with Population Register or Causes of Death Database was not possible, resulting in many cases in an evident discrepancy between the data provided by the main insurance-based system and diseases registers. These last in fact had no possibility to update their data with information on deaths occurred to persons included in the registers or include cases discovered only after death (information from death certificates or autopsies). Therefore data on prevalence (point or period) is either not presented at all or the quality of data was considered to be insufficient.
The pilot countries found it useful/feasible to combine sources mainly for the Period Prevalence indicators (36 overall occurrences out of 65 mentions in the shortlist, 55.4 % of the pilot countries) followed by Incidence by Episode indicators (5 overall occurrences out of 17 mentions in the shortlist,
(43) ‘Hospital morbidity study’.

3 Main findings
44Morbidity statistics in the EU — Report on pilot studies
71.4 % of the pilot countries) and then Incidence by Person indicators (4 overall occurrences out of 21 mentions in the morbidity Shortlist, 19.0 % of the pilot countries).
As from the type of measure chosen by the pilot countries for calculating the requested estimates, it can be noticed (table XX) that sometimes (SI, BE, NL, PL) similar sources were combined for estimating different indicators, e.g. incidence vs. prevalence for acute myocardial infarction. The significance of these different choices can reside in differences in the intended use of a specific source as in the case of hospital in-patients/discharge records which can be patient-oriented or case-driven. If the number or estimates on re-admissions is known or can be derived from other sources (i.e. insurance systems) than the problem can be solved for ‘best estimates’.
The actual possibilities of estimating different indicators from similar linkages should be further explored during the next steps of the establishment of the morbidity data collection. In the case of Hospital discharge and Causes of death combination for instance, some countries used this approach for incidence indicators, while in other cases it was considered feasible to provide only prevalence estimations because all the previous admissions for the same diagnosis in the previous few years should be ruled out. This requires a good quality hospital discharge database for a certain amount of consecutive years with the possibility of identifying the patients. It is not always clear if these types of controls have been done by the other pilot countries in order to provide estimates on incidence for specific diseases.
Finally, in some cases, the pilot countries (SI, PL, NL) deliberately choose to perform a combination-of-sources exercise only on a limited subset among the requested indicators in order to test the technical feasibility and/or to gain some expertise in this field. The availability of results from combined sources should therefore be evaluated carefully.
A variety of methodologies were used by the pilot countries, depending on the available sources and diseases. These ranged from merging different databases, excluding potential duplicates, to individual record linkages (deterministic or probabilistic), with some variations in between. The experience gained is generally reported as positive by the pilot countries, and an update on the current situation in MS regarding the potential difficulties still in place is very much needed in order to proceed with the establishment of a data collection on morbidity at EU level.
Based on the detailed analysis made on the countries reports, it appears that the main problems faced by the pilot countries on the methodology to be applied were the following:
1. Legal limitations in accessing and combining different data sources;
2. Difficulties in accessing data owned/managed by different institutions in charge of specific data collections;
3. Lack of resources/in-house expertise and experience in applying the potential and/or available methods;
4. Technical problems that was not possible to overcome during the short period of the pilots, such as limited availability of several consecutive data-years.
3.6 Quality of results
Annex 1 shows the ‘In-depth analysis of pilot studies in 16 Member States: an Assessment of quality and comparability of the provided information across Member States’; Annex 7 lists the ‘Data delivered by the pilot countries’; Annex 8 shows a ‘Summary of pilot data and age-standardised estimates reported (ranges and ratios)’.
Chapter I. Infectious diseases
Between 9 and 12 countries reported complete incidence data and between 7 and 9 countries complete prevalence data for the four diseases. Infectious diseases are collected at national level either as compulsory notifications in a register or through sentinel networks of a sample of health care actors. In some cases, only infectious diseases confirmed in laboratory are included. For sexually transmitted infectious, not all countries cover Chlamydia, which explains the large difference in the incidence and prevalence rates between the pilot countries.

3 Main findings
45Morbidity statistics in the EU — Report on pilot studies
The definitions of the four infectious diseases were clear. Despite the fact that all countries (except LT) did not cover the ICD-10 code B90 (Sequelae of tuberculosis) in identifying tuberculosis, similar data were given in the pilot study to the data reported for ECDC and WHO. Lithuania, however, was an exception: the estimate in the pilot study was almost double compared to the rates reported to WHO and ECDC, probably due to inclusion of B90 in Eurostat pilots, or to some other factors that are worth exploring.
Most of sexually transferred infections (STI) are Chlamydias, but several countries do not collect data on them (yet) or the coverage is very limited. The data collection of WHO does not cover Chlamydia and ECDC has only recently started more detailed data collection. Different coverage of national surveillance systems also explained the significant differences in the incidence figures in the nine pilot countries that provided data on STIs. National information systems on infectious diseases should be expanded to cover Chlamydias.
For viral hepatitis, including Hepatitis B, the combination of different viral hepatitis (A, B and C) as one category is not the most ideal way to collect data because of the different aetiology and risk factors of each disease. Excluding LT and LV, the incidences reported by ECDC and WHO were similar to those given for the pilot studies. SK reported similar incidence and prevalence figures, and the prevalence was lower than the incidence for NL, suggesting quality problems in the pilot data.
The pilot data on Human immunodeficiency virus disease (HIV/AIDS) reflected the current understanding of the epidemics with significant differences between EU-15 (low incidence, high prevalence), Central and Eastern European countries (low incidence, low prevalence) and the Baltic countries (low incidence excluding Estonia, high prevalence after the epidemics in the late 1990s).
No country could use the ICD-10 code Z21 (Asymptomatic human immunodeficiency virus [HIV] infection status) to identify the cases, but HIV/AIDS incidence data reported by ECDC and WHO were similar to the data given in the pilot studies.
In some cases national morbidity pilot studies gave higher incidence data than found in the international databases. This suggests that the international data on infectious diseases was underreported in 2005 and their quality should primarily be improved at national level.
General assessment
At EU level, the European Centre for Disease Prevention and Control (ECDC) analyse and disseminate information on infectious diseases. The incidence data on four infectious diseases in the Eurostat Morbidity Shortlist — Tuberculosis, Sexually transmitted infections (STI), Viral hepatitis (incl. hepatitis B) and Human immunodeficiency virus disease (HIV/AIDS) — are a part of ECDC’s Surveillance System (TESSy), which should be used as the primary source. New data collection on infectious diseases would not be advisable.
Excluding sexually transmitted diseases, the data on incidence is relatively comparable and reflect the real country differences
Prevalence data is less important for infectious diseases. If prevalence data is to be collected, it should cover tuberculoses and HIV/AIDS only. This data are currently available for WHO estimates on tuberculosis (44) and UNAIDS estimates on HIV/AIDS (45).
Chapter II. Neoplasms
Fifteen countries provided complete incidence and ten countries complete prevalence data. In most countries, the data came from Cancer Registers. One country also used private health insurance data to calculate incidences. In some countries, multiple cancers of the same person could not be distinguished. The estimates for period prevalence came from cancer registers (ten countries), while some countries used health insurance data (one country), linkage of multiple sources (one county) or HIS (two countries).
Cancer incidence estimates vary in the range from 18.8 per 10 000 in RO females to 75.4 per 10 000 in HU males leading to a ratio of 4; but, in fact, the sex stratified ratio is even lower: approximately 3. Some part of the variation may be attributed to the real differences in cancer morbidity as the risk of many
(44) http://www.who.int/tb/country/en/index.html. (45) http://www.unaids.org/globalreport/Global_report.htm.

3 Main findings
46Morbidity statistics in the EU — Report on pilot studies
cancers is related to life-style factors. However, other potential sources of variation cannot be excluded: incomplete reporting of new cancer cases by health professionals; inability to account for those cases of cancer which are found after death only, as such problems were mentioned by some countries. Some concern may also be raised regarding two approaches to incidence calculation — by person or by case. Overall, the comparability of cancer incidence data across countries may be judged to be acceptable.
An estimation of prevalence data turned out to be complicated for many countries. Some countries considered their cancer registers to be unsuitable for cancer prevalence estimation and used other data sources (health insurance data, health interview survey) or did not estimate cancer prevalence at all. Besides lack of valid data sources, the estimation was challenged by the proposed prevalence definition, resulting in several different interpretations of cancer prevalence. These difficulties are reflected by tenfold difference in prevalence estimates, which is substantially larger than differences in incidence: the highest 348.6 per 10 000 in CZ males and the lowest 32.2 per 10 000 in SI females. At least partially, that difference is explained by prevalence definitions actually used by countries; e.g. the lowest prevalence in SI is a result of the adopted definition. If SI data are removed, as well as PL data (also different prevalence definition used) and CY data from HIS, the lowest prevalence is seen in seen in RO, thus leading to the ratio between highest and lowest prevalence to be just 2.3 in males and 2.2 in females.
General assessment
The data taken from Cancer Registers is mostly comparable. For some site-specific cancers, e.g. Mesothelioma, the number of new cases during one year may be low and causing random variation for small countries. Prevalence data is less available and less comparable.
Chapter IV. Endocrine, nutritional and metabolic diseases
All countries presented data from at least one source for at least one measure of diabetes. Period prevalence data (13 countries with complete data) was more often available than the data on incidence (7 countries) and point prevalence (3 countries). Countries have chosen different data sources for diabetes. Hospital data does not appear to be the best source for diabetes. Patients with medication do not fully represent the diabetes cases, as some diabetes patients may be treated by diet without medication. GP’s/primary health care or outpatient care data is more complete as most of the diabetes cases are treated in primary or outpatient care level. Linkage of data sources for diabetes would increase the data quality, but this was used only by one country.
General assessment
There are significant differences in diabetes estimates between the countries (especially in period prevalence - up to 41 times difference), which are mostly caused by use of different data sources and variations in their coverage. However, after excluding data of hospital discharges and HIS the range ratio for period prevalence dropped to 3.5. Most of the countries have reported underestimations of diabetes cases, since undiagnosed, untreated, and unregistered people with diabetes are excluded.
Chapter V. Mental and behavioural disorders
Between 8 and 10 countries provided complete data for these seven diseases. Hospital data does not appear to be the best source for any of these mental and behavioural disorders as most of these conditions do not normally require admission (excluding late stages of eating disorders). Linkages of data sources for some mental and behavioural disorders were used only by three countries.
General assessment
There are significant differences in the estimates of mental and behavioural disorders (from 13.3 to 1413 times depending on disease) between the countries. The ratio of minimum and maximum value is much lower once data based on hospital discharges and HIS are excluded. In this case the range ratio dropped to 2.6 for schizophrenia, 10.7 for depression and other affective disorders, 13.4 for dementia (incl. Alzheimer’s disease), 14.1 for mental and behavioural disorders due to use of alcohol (incl. alcohol dependence), 14.3 for anxiety disorders, 16.4 for mental and behavioural disorders due to use of psychoactive substances other than alcohol and tobacco (including drug dependence), 55.5 for eating disorders. The pilot studies reported underestimates for dementia (people living in social institutions are usually not included) and for mental and behavioural disorders due to use of alcohol and drugs (those not seeking health care are excluded). Schizophrenia is well defined disease, coded similarly in different countries and mostly treated using medication (covered by
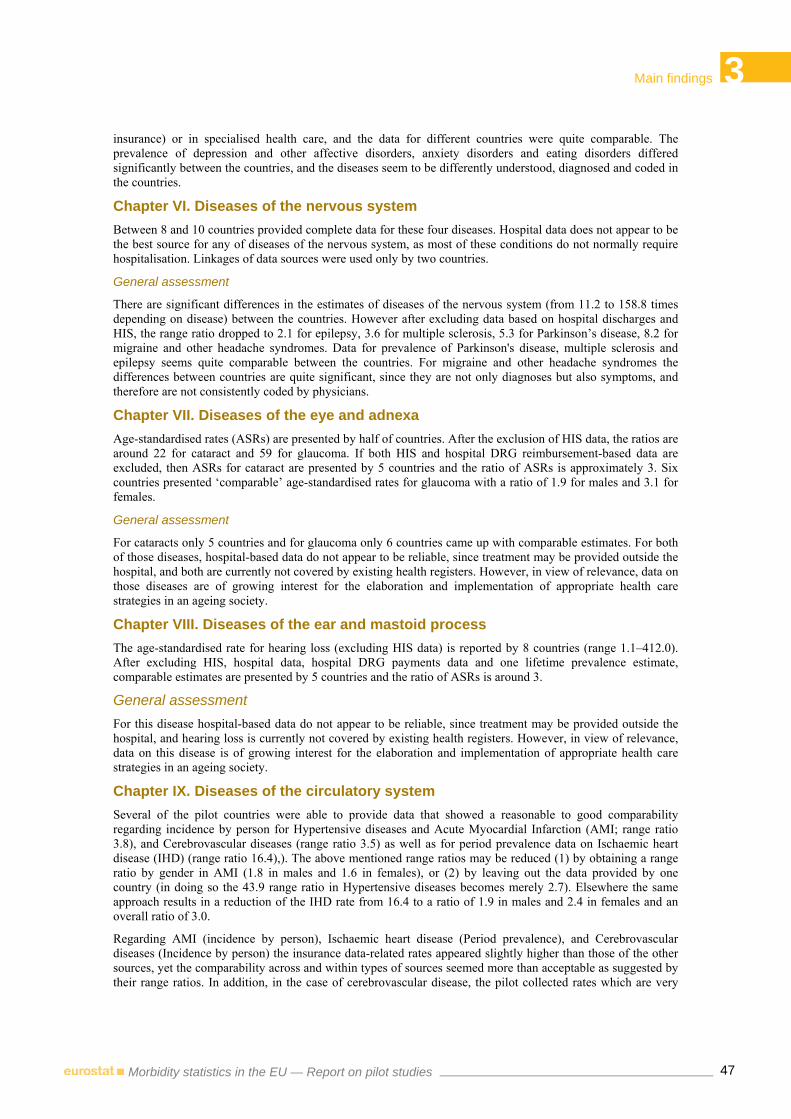
3 Main findings
47Morbidity statistics in the EU — Report on pilot studies
insurance) or in specialised health care, and the data for different countries were quite comparable. The prevalence of depression and other affective disorders, anxiety disorders and eating disorders differed significantly between the countries, and the diseases seem to be differently understood, diagnosed and coded in the countries.
Chapter VI. Diseases of the nervous system
Between 8 and 10 countries provided complete data for these four diseases. Hospital data does not appear to be the best source for any of diseases of the nervous system, as most of these conditions do not normally require hospitalisation. Linkages of data sources were used only by two countries.
General assessment
There are significant differences in the estimates of diseases of the nervous system (from 11.2 to 158.8 times depending on disease) between the countries. However after excluding data based on hospital discharges and HIS, the range ratio dropped to 2.1 for epilepsy, 3.6 for multiple sclerosis, 5.3 for Parkinson’s disease, 8.2 for migraine and other headache syndromes. Data for prevalence of Parkinson's disease, multiple sclerosis and epilepsy seems quite comparable between the countries. For migraine and other headache syndromes the differences between countries are quite significant, since they are not only diagnoses but also symptoms, and therefore are not consistently coded by physicians.
Chapter VII. Diseases of the eye and adnexa
Age-standardised rates (ASRs) are presented by half of countries. After the exclusion of HIS data, the ratios are around 22 for cataract and 59 for glaucoma. If both HIS and hospital DRG reimbursement-based data are excluded, then ASRs for cataract are presented by 5 countries and the ratio of ASRs is approximately 3. Six countries presented ‘comparable’ age-standardised rates for glaucoma with a ratio of 1.9 for males and 3.1 for females.
General assessment
For cataracts only 5 countries and for glaucoma only 6 countries came up with comparable estimates. For both of those diseases, hospital-based data do not appear to be reliable, since treatment may be provided outside the hospital, and both are currently not covered by existing health registers. However, in view of relevance, data on those diseases are of growing interest for the elaboration and implementation of appropriate health care strategies in an ageing society.
Chapter VIII. Diseases of the ear and mastoid process
The age-standardised rate for hearing loss (excluding HIS data) is reported by 8 countries (range 1.1–412.0). After excluding HIS, hospital data, hospital DRG payments data and one lifetime prevalence estimate, comparable estimates are presented by 5 countries and the ratio of ASRs is around 3.
General assessment
For this disease hospital-based data do not appear to be reliable, since treatment may be provided outside the hospital, and hearing loss is currently not covered by existing health registers. However, in view of relevance, data on this disease is of growing interest for the elaboration and implementation of appropriate health care strategies in an ageing society.
Chapter IX. Diseases of the circulatory system
Several of the pilot countries were able to provide data that showed a reasonable to good comparability regarding incidence by person for Hypertensive diseases and Acute Myocardial Infarction (AMI; range ratio 3.8), and Cerebrovascular diseases (range ratio 3.5) as well as for period prevalence data on Ischaemic heart disease (IHD) (range ratio 16.4),). The above mentioned range ratios may be reduced (1) by obtaining a range ratio by gender in AMI (1.8 in males and 1.6 in females), or (2) by leaving out the data provided by one country (in doing so the 43.9 range ratio in Hypertensive diseases becomes merely 2.7). Elsewhere the same approach results in a reduction of the IHD rate from 16.4 to a ratio of 1.9 in males and 2.4 in females and an overall ratio of 3.0.
Regarding AMI (incidence by person), Ischaemic heart disease (Period prevalence), and Cerebrovascular diseases (Incidence by person) the insurance data-related rates appeared slightly higher than those of the other sources, yet the comparability across and within types of sources seemed more than acceptable as suggested by their range ratios. In addition, in the case of cerebrovascular disease, the pilot collected rates which are very

3 Main findings
48Morbidity statistics in the EU — Report on pilot studies
similar to those observed in the Framingham cohort (46) and are not contradictory to 2000-2001 data from Scotland (47). The reported hypertension rates are largely lower than those reported in a study of the late nineties wherein hypertension was defined at the 140/90mm HG threshold (48).
In the light of the preceding, the rates provided may be assimilated to ‘best estimates’, provided Hypertension was defined uniformly across the member states. Regarding AMI, combining hospital discharge data with CoD should be feasible for most MS. These indicators seem ‘ready’ to be routinely collected by the MS.
The range of the age-standardized rates of Cerebrovascular diseases (period prevalence), amounts to 5.8 and is not influenced by leaving out the hospital data. Discarding data of one country, we obtain a range ratio of 2.3 in men but still a rather sizable 4.6 in women. In agreement with some studies we observe higher rates in men and variations of rates across countries and sex (49). The presence of excluded groups, which in addition differ across countries, makes it questionable to designate the provided rates as ‘best estimates’. It appears to be difficult to overcome this drawback. An experts’ consultation seems necessary to develop a consensus on how to tackle this problem and to fix a time window for the data collection.
Although the other indicators (mostly period prevalence indicators) are a high priority from the public health viewpoint, it is not possible for them to be considered ‘best estimates’ due to their poor comparability.
General assessment
The lowest range ratios are observed in the incidence-based measures. Several of the pilot countries were able to provide comparable data regarding Hypertensive diseases, AMI and Cerebrovascular diseases (incidence by person) and Ischaemic heart disease (period prevalence). In addition the estimates of AMI, IHD, and Cerebrovascular diseases are quite comparable to studies mentioned in the literature.
The other indicators, mostly of the type of period prevalence, exhibit several problems that should be solved in order to obtain them routinely.
Chapter X. Diseases of the respiratory system
Age-standardised rates (ASR) of Influenza (Incidence by episode) data are reported by 4 countries. Their range ratio amounts to an extremely high 64.0 and is not significantly influenced by leaving out Hospital data. In addition we observe huge differences within the same source: self-reported (Estonia vs Poland), and insurance (Lituania vs Romania).
In relation to pneumonia, six countries provided age-standardises rates of Incidence by episode and 7 countries supplied age-standardises rates of Period prevalence. The range ratio, across the 6 countries delivering incidence ASRs, of 11.5 is very high but leaving out the hospital data reduces it to 4.0. However this does not necessarily mean that hospital data are an underestimation: the providers of ambulant care in the Netherlands and a Finnish incidence study (50) supply data comparable with the hospital data. The range ratio of 8.6 between the 7 countries that reported prevalence ASRs is sizable and is reduced to 4.0 by leaving out Hospital data. The quality and coverage of the data sources are such that between-countries comparison seems hazardous. Since pneumonia is not a chronic disease, the burden could be estimated by the combination of several years of the incidence by episode, implying the consideration of a possible revision of this indicator (Pneumonia, period prevalence) in the short list.
Only 4 countries supplied asthma (Incidence by person) data, that, in addition, showed very differing ASRs, with a range ratio of 6.6. The range ratio of 69.0 between the 9 countries that reported prevalence ASRs is extremely high yet discarding data of one country reduces the ratio to 4.4 in men and 4.8 in women. In doing so, data for 5 countries were retained. Even within the same type of source the rates show significant variation. If period prevalence data for asthma is required, a significant effort is required to eliminate the above mentioned drawbacks; to define the source(s) to be used; and to agree on a precise time window for the data collection. This objective will not be accomplished easily, hence, at the moment, the indicator should be considered for inclusion in future data collections on morbidity.
(46) Carandang R, Seshadri S, Beiser A, Kelly-Hayes M, Kase CS, Kannel WB et al. Trends in Incidence, Lifetime Risk, Severity, and 30-Day
Mortality of Stroke Over the Past 50 Years. JAMA: The Journal of the American Medical Association 2006; 296(24):2939-2946. (47) Syme PD, Byrne AW, Chen R, Devenny R, Forbes JF. Community-Based Stroke Incidence in a Scottish Population: The Scottish Borders
Stroke Study. Stroke 2005; 36(9):1837–1843. (48) Wolf-Maier K. Hypertension prevalence and blood pressure levels in 6 european countries, canada, and the united states. JAMA: The Journal
of the American Medical Association 2003; 289(18):2363–2369. (49) WRITING GROUP, Rosamond W, Flegal K, Furie K, Go A, Greenlund K et al. Heart Disease and Stroke Statistics -- 2008 Update: A Report
From the American Heart Association Statistics Committee and Stroke Statistics Subcommittee. Circulation 2008; 117(4):e25-e146. Appelros P, Stegmayr B, Terent A. Sex Differences in Stroke Epidemiology: A Systematic Review. Stroke 2009; 40(4):1082–1090. Prevalence of Stroke — United States, 2006–2010. JAMA: The Journal of the American Medical Association 2012; 308(3):228–230.
(50) Welte T, Torres A, Nathwani D. Clinical and economic burden of community-acquired pneumonia among adults in Europe. Thorax 2012; 67(1):71–79.

3 Main findings
49Morbidity statistics in the EU — Report on pilot studies
The range ratio of 71.4 between the 4 countries that reported Chronic lower respiratory disease (Incidence by person) ASRs, is substantial. Leaving out the country that provided figures based on medication data reduces the rate to 2.3, but doing so leaves only 3 countries with ASRs by sex.
On average 5–15 % of adults in industrialised countries have COPD defined by spirometry (51). None of the 7 countries that supplied chronic lower respiratory disease (Period prevalence) reported ASRs within those ranges, which seems to suggest a difficulty in collecting adequate data. The range ratio of 24.9 between these 7 countries is very high. No hospital data were supplied. Prevalence data regarding chronic lower respiratory disease are essentially to be collected in ambulatory care. Insurance data may be an alternative source. However, the variability in the range rate is extremely high and the drawbacks in the actual registration systems are not easily removed. On the other hand, it could be possible to collect this type of data through a survey wherein an ambulatory spirometry is performed.
General assessment
Only a few countries came up with incidence data, which in addition, were not particularly comparable. The comparability was improved by leaving out either hospital data or medication-based data or the data from a one particular country. The improvement in comparability was obtained at the expense of a reduction of the number of countries providing ‘comparable’ data, putting even more stress on the generalisation of the indicator to the MS. In addition, the comparability within the same type of source was rather limited. The preceding invalidates the assumption of these rates being ‘best estimates’.
The reason for these significant differences seems apparently unrelated to a particular type of source and merit further clarification. Unfortunately, the latter, necessitating an in-depth ‘inquiry’, appears rather complex and since these indicators are considered important, they should be considered for inclusion in future data collections on morbidity.
More countries delivered age-standardized prevalences. However, huge range ratios are observed, although the exclusion of either hospital data or data from a single country improves them. Another problem lies with the exclusion of certain population groups (e.g. private care or institutionalized patients) from the actual registration systems. Comparability, let alone the labelling of ‘best estimates’, remains questionable.
The particularity of each of these indicators asks for a specific approach as to how to proceed with.
Chapter XI. Diseases of the digestive system
Gastric and duodenal ulcer (peptic ulcer) (K25-K28) - Period prevalence
Nine countries reported age-standardised diagnosis-specific rates (excluding HIS data). The range 3.2–230.6 is extremely large. Two HIS based, 3 hospital based, and 1 hospital DRG payment had to be discarded to obtain ASR range ratios of less than 15 (although still very high). The large variability does not seem to be dependent on data source type.
Alcoholic liver disease (K70) - Period prevalence
Nine countries came up with age-standardised diagnosis-specific rates. The data show an extremely divergent scattering of estimates with a range of 0.0 to 212.2. Discarding hospital data (3 countries) did not improve the comparability. The second highest rate however amounts only to 20.0. We obtain then a range of 0.0 to 20.0, and within the countries much higher rates in males. Even between Eastern Europe countries (higher alcohol consumption levels) and excluding the country with the highest age-standardised rate (experts from that country suspect underreporting), the results show only limited comparability.
Diseases of liver other than alcoholic (K71-K77) - Period prevalence
For this disease also, 9 countries came up with age-standardised diagnosis-specific rates. The range of estimates varied between 2.0 and 97.0. Even if the exclusion of hospital data (3 countries) reduced the rate ratio from 48.5 to 12.1 in males and from 29.8 to 5.8 in females, the variability of the rates remains extremely high especially in males.
(51) Anto JM, Vermeire P, Vestbo J, Sunyer J. Epidemiology of chronic obstructive pulmonary disease. European Respiratory Journal 2001;
17(5):982–994.

3 Main findings
50Morbidity statistics in the EU — Report on pilot studies
Excluding in addition the country with the highest age-standardised rate (the same country as in alcoholic liver disease) , the ratio of ASR for diseases of liver other than alcoholic fell to 3.5 for males and 2.6 for females, but then only 5 countries remain in the comparison.
Cholelithiasis (K80) - Incidence by person and Period prevalence
Age-standardised rates of incidence by person are reported by 5 countries with a range of 9.0–36.0, whereas regarding period prevalence rates are reported by 9 countries with a range of 9.8–108.0.
Rates of incidence are fairly comparable and do not appear to be influenced by the type of source.
Excluding hospital cases and hospital DRG payments does not reduce the range ratio of prevalence substantially, probably due to the high proportion of patients undergoing surgery. Most variability of the rates lies within the insurance type of sources.
General assessment
Apart from the prevalence rates of cholelithiasis, only a few countries came up with comparable estimates.
The quality of differentiation of alcoholic and non-alcoholic liver diseases by physicians can be questioned, but it is not recommended to merge them, given the different aetiology. Prevention of alcohol overuse is an important issue in public health and occurrence of alcoholic liver disease is one indicator to evaluate prevention activities. The question of how to improve the underreporting of alcoholic liver disease remains. It does not seem to be feasible for countries to collect comparable data in the immediate future.
Regarding cholelithiasis, incidence data seem difficult to collect. Prevalence data however, seems to be easier to collect, but display greater variability within the insurance type of source.
Chapter XII. Diseases of the skin and subcutaneous tissue
Dermatitis and eczema (L20-L30) — Period prevalence Although 8 countries provided age-standardised rates, the estimates vary so extremely, with a range of 4.9–800.0, that geographical variation in disease-prevalence does not appear to constitute a valuable explanation.
After excluding HIS, hospital cases and hospital DRG payments data, an ASR for dermatitis and eczema is available for 6 countries and the ratio of ASR amounts to 8.1 for males and 10.0 for females.
Psoriasis (L40) — Period prevalence
Countries supplied varying rates for this indicator (range: 1.2–64.0 after dropping out HIS). After exclusion of HIS, hospital cases and hospital DRG payments data, an ASR for psoriasis is available for 5 countries and the ratio of ASR amounts to 3.5 for males and 4.0 for females.
General assessment
One reason why the results are not comparable even after excluding HIS and hospital data is the coverage insufficiency, especially due to missing primary care data. Skin problems are frequent and often treated by patients themselves. ICD-10 codes, proposed in the morbidity list for dermatitis and eczema, include several acute conditions and recurrences of chronic diseases, a possible cause of the sizeable variation of results. The question is, do we need all this composite information or data on serious chronic dermatitis only.
Chapter XIII. Diseases of the musculoskeletal system and connective tissue
Rates on period prevalence were requested for these diseases. The availability of age-standardised rates varied from 7 countries for systemic connective tissue disorders to 10 for osteoporosis. For each of the diseases there is a wide variation in the results, mainly due to differences in data sources.
General assessment
Three countries used data from health interview surveys (HIS) as the main source; their results are significantly outside the range reported by the other countries, indicating that HIS data should not be used to derive measures of prevalence for these diseases.
Diseases of the musculoskeletal system normally do not require hospitalisation, and so hospital discharges data or DRG payments data as the only source are insufficient. However, hospital-based sources may be useful if combined with other sources such as primary care or outpatient databases.

3 Main findings
51Morbidity statistics in the EU — Report on pilot studies
Given that the data derived from HIS, hospital discharges and DRG payments systems only are insufficient, the pilots indicate that data availability for these indicators is very low.
Data derived from insurance related sources appear to provide the most comparable results for diseases in this chapter, but even among countries providing such data there is still a wide variation in the results. The reasons for such variation require further investigation.
Finally, the analysis of the pilot data shows substantial differences between the age-standardised rates and the crude rates, and also significant variations between male and female rates. This emphasizes the need for all countries to provide age-standardised rates for males and females separately.
Chapter XIV. Diseases of the Genitourinary System
Rates on period prevalence were requested for all diseases in this chapter, and incidence by person was also requested for urolithiasis. The availability of age-standardised rates varied from 4 countries (urolithiasis incidence per person) to 10 (urolithiasis period prevalence). The range of results varied between 5.5 to 199 per 10 000 population for glomerular and renal tubulo-interstitial diseases and 9.4 to 29 for urolithiasis (incidence). That variation was reduced after discarding results from HIS and from hospitals only.
General assessment
As for other disease groups, data sourced from health interview surveys differ substantially from data from other data sources and therefore should not be considered.
Diseases of the genitourinary system do not necessarily require hospitalisation, and so the use of hospital activity based sources result in estimates that vastly underestimate the true prevalence or incidence. Therefore for this group of indicators, data sourced only from hospital discharges or DRG payments are clearly insufficient.
Data derived from insurance related sources seem to provide the most comparable data for all diseases in this chapter. However, there are still wide variations in the estimates reported although the range is somewhat less. The reasons for the variations may be a natural difference in the prevalence of diseases and medical conditions in different countries, or due to distorting effects resulting from the reimbursement, or different definitions or methodologies used for estimating prevalence.
Chapter XIX. Injury, poisoning and certain other consequences of external causes
Data reported for those diseases show a low response rate and poor comparability, mainly due to lack of reliable sources, so the analysis of the quality of such data was restricted.
General assessment
Most countries that provided both incidence and prevalence estimates used the same data sources; however, some countries choose to provide data for prevalence only as they were unable to identify new cases. Another problem in data comparability of prevalence data was indicated for fracture of the femur: whether to include only patients with fractures recorded in the reference year or also cases of continued treatment, e.g. by the GP, of an injury that happened before the reference year.
Intracranial injury incidence rates refer for most countries to hospitalized cases, except for one country that used primary care data. That is why the ratio between minimum and maximum age-standardised estimates values for intracranial injury is the highest in this chapter, 491.2 for incidence. But if the rates that are calculated only with primary care data are eliminated, the ratio drops significantly to 4.3.
Most cases for this group of diseases are referred to hospital treatment, so best estimates for both incidence per person and period prevalence were reached by linking insurance data on inpatients with Causes of death data, or by linking inpatient and outpatient data, respectively.
Countries that were able to link inpatient and outpatient sources resulted in higher reporting rates and better comparability of the estimates. Although some countries considered Causes of death registers as data sources, they were unable to link it with other sources (except for EE).
Chapter XX. External causes of morbidity
Analysis for chapter XX of the data shows a low response rate. Some countries anticipate that measures to collect such data may be available in the future.

3 Main findings
52Morbidity statistics in the EU — Report on pilot studies
Prevalence rates were provided by more countries than incidence rates. Nevertheless, as indicated by NL and LV, in view of the nature of the injuries, prevalence rates seem to be of less importance for public health purposes.
Similar to chapter XIX, the quality of data for the ‘all morbidity due to external causes’ is lower than that for specific categories in this chapter, such as for land transport accidents, accidental falls, accidental poisoning, intentional self-harm etc. Based on the result we can assume that the best quality estimates can be obtained by using both inpatient and outpatient data, plus linkage to Causes of death registers.
The comparison between countries shows large discrepancies, the ratio of minimum and maximum age-standardised estimates values ranging from 38.1 (accidental falls — period prevalence) to 215.4 (complications of medical and surgical care — incidence by episode).
General assessment
Morbidity due to external causes had a low reporting rate mostly due to the non-availability of data sources: no sufficient codifications, incomplete information in the databases, and problems with linking different data sources. Only 2 countries reported estimates from combined sources: EE (Health Insurance Fund + Causes of death Registry) for all indicators except for period prevalence of complications of surgical care, and NL (Hospital Discharge Register + Causes of death Register for prevalence data), which seems to be reflected in the data quality. FI in its report estimates to have a low degree of reliability and recommends linkage with causes-of-death register.

4 Conclusions and recommendations
53Morbidity statistics in the EU — Report on pilot studies
Chapter 4 — Conclusions and recommendations
4.1 Conclusions
General
The study results indicate the feasibility of developing diagnosis-specific morbidity statistics that fit the requirements of the European Statistical System (ESS) in general and of the European public health statistics system in particular. Following Regulation No 1338/2008 this system is built on three domains: Health status and determinants; health care and COD. In particular, the approach based on the best national estimates, as identified and described in the existing guidelines, proved to be feasible in different MS with different health and information systems.
At the same time those results indicate caveats at different levels that prevented the study from reaching complete data sets for all participating countries.
The main challenge for the TF members was the investment in time needed for the analysis of the data from 16 Member States (MS), the preparation for meetings and of the documents for these meetings and the drafting of the report.
The TF concluded that despite the many caveats in data collection and data quality the final result is promising for further development and implementation of diagnosis-specific morbidity statistics aiming at regular statistical reporting.
On data sources and collection Pilot studies from 16 MS on applying the MDSG method for diagnosis-specific morbidity statistics demonstrated the feasibility of producing such data collections for comparisons at EU-level. However, the analysis of the data indicates major problems in evaluating the quality of results. The requirements for the first wave of countries in view of data delivery differed markedly from the second wave, in particular in view of structure and details of data and information to be delivered. In addition, participants could choose whether they want to cover just some major or all of the diseases as listed in the shortlist.
Only a few pilot countries took the chance or had the opportunity to develop algorithms for best estimates from different sources, but instead chose data from the source that they judged to be the best national ones. Unfortunately a single source is appropriate only for a limited number of diseases, e.g. cancers. For many diagnoses the use of a single source was not satisfactory, either due to limitations by the purpose of that single source or by restrictions in coverage. It was clear that combining different sources to obtain the best estimates for diagnosis is a rather new approach and less familiar in health statistics. Nevertheless it is indispensable for most of the diseases in view of coverage of reporting: hospital data covers only part of the sick but the whole population; insurance data covers only the insured part of the sick and of the population, and also ambulatory or outpatient care data are only part of the total. In view of health interview survey (HIS) data it is clear that it does not fit to a diagnosis-specific data collection.
There is evidence that due to restrictions in time and resources many countries did not exhaustively explore the use of potential sources, e.g. due to difficulties with access to datasets and lack of experience in analysis and comprehensive research. The differences in diseases as well as the differences in national sources and approaches to arrive at good epidemiological data per disease require flexibility in the use/combination of sources for reaching best comparable estimates at EU-level. For diseases of high burden in view of quality of life or healthy life years lost on the one side but low rate of hospital treatment on the other side (such as for diabetes, depression and other affective disorders, asthma or ischemic heart disease), the combination of information on hospital and ambulatory care as well as from additional sources such as data on causes of death statistics is a pre-requisite for best estimates.
On definitions and methodology The comparability of data at EU-level is hampered by the use of different definitions for diagnosis and indicators per disease or group of diseases, both within a country and among countries. In addition, the influence of different priorities within national health care systems has to be considered when analysing statistical information at EU level.
It was also observed that for national purposes MS use national definitions which do not always correspond to the pilot requirements. Computation of best estimates at national level by combining/linking information from different sources requires harmonization of definitions at national level, which was not always the case.

4 Conclusions and recommendations
54Morbidity statistics in the EU — Report on pilot studies
While the methodology for the pilots is person based — incidence or prevalence — many countries use a case based approach in their national data collections, for example data on hospital discharges.
An agreed approach towards person based data collections would improve the analysis of the individual burden by disease for the single citizen as well as for the health systems. Health policy strategies depend on person-based information such as co-morbidity and risk factors over time. A person based approach is also a pre-requisite for linking data from different data sources in view of the burden per disease and the influence of health policy actions over time. Finally, the statistical methodologies for producing best national estimates for diagnosis-specific morbidity should be further improved in view of linking data from different sources, given that an effective integration of data from multiple sources is required in many cases.
On results at EU level The availability of data on incidence by episode, incidence by person and period prevalence varied among the pilot countries. Conclusions on which indicator to use are often dependant on the specific disease, and therefore listed in the next paragraph 4.2. They are also reflected in the revised SL which is recommended by the TF based on the analysis of the existing pilot studies (see paragraph 4.3 on recommendations and Annex 2).
In order to get a full picture of morbidity in the EU some of the current limitations need to be overcome in the future. For example, some ICD chapters were not covered by the SL (i.e. chapter III ‘diseases of the blood and blood-forming organs and certain disorders involving the immune mechanism’), as well as the ICD chapters dealing with maternal and paediatric diseases and conditions and malformations (chapters XV, XVI and XVII).
The TF recommends refraining from a data collection on point prevalence as the pilot studies showed low availability of such data.
Where international data collections already exist, e.g. on cancer and infectious diseases, it was noted that these are generally from well-established sources for obtaining the required data on morbidity in good quality. However, in the case of cancer data some MS reported higher incidence and prevalence data in the pilot studies than in international data collections. Co-operation with the respective organizations should ensure accurate harmonized data sets.
4.2 Specific conclusions and recommendations (52) per disease
Chapter I. Certain infectious and parasitic diseases: tuberculosis (A15-A19, B90), sexually transmitted diseases (A50-A64), viral hepatitis, including Hepatitis B (B15-B19), and Human immunodeficiency virus disease (HIV/AIDS) (B20-B24, Z21)
Sources
Infectious diseases are collected at national level either as compulsory notifications in a register or through sentinel networks of a sample of health care actors. In some cases, only infectious diseases confirmed by laboratory diagnosis are included. One of the most frequently sexually transmitted diseases, Chlamydia, was not covered by any of the pilot studies, thereby in line with WHO.
Indicators
The indicator recommended for the collection of these diseases is incidence by person per reference year. However, for communicable diseases with short-term treatment and in particular sexually transmitted diseases incidence by episode would be recommended.
For communicable diseases with longer or even life-long persistence and treatment incidence per person will be more appropriate for informing on the burden for patients and for the health system, such as for tuberculosis and HIV/AIDS. However, for tuberculosis a new incidence should be assumed, as compared to a relapse or the continuation of treatment of the same infection, if the patient did not have contact with the health care system for the same infection within the recent five years.
No point prevalence data are to be collected.
In addition, period prevalence that is defined for individuals with a disease who had the disease in the course of the year, irrespective of their status at the end of year (died, recovered, emigrated) could be considered for tuberculosis and HIV/AIDS. However, in principle prevalence data is less important and should not be collected for other communicable diseases.
(52) As a result of the TF MORB conclusions see recommendations for a revised shortlist, please refer to Annex 2 (not in this document).

4 Conclusions and recommendations
55Morbidity statistics in the EU — Report on pilot studies
Conclusion
Incidence data collected by The European Centre for Disease Prevention and Control (ECDC) should be used as a primary data source for morbidity statistics on ICD chapter I diseases, given that those data are in line with the ESS quality requirements. The possibility of using existing prevalence estimates collected by WHO on tuberculosis (http://www.who.int/tb/country/en/index.html) and by UNAIDS on HIV/AIDS (http://www.unaids.org/globalreport/Global_report.htm) should be considered.
Chapter II. Malignant neoplasms: all malignant neoplasms (C00-C97) and cancers of specific site (C15; C16; C18-C21; C33,C34; C43; C45; C50; C53; C54,C55; C56; C61; C67; C81-C96)
Sources
In most countries, the data for the pilots came from Cancer Registers. Incidence data are mostly of good quality. However, prevalence data is less available and less comparable due to different estimation methods.
Indicators
The indicator to be addressed is incidence of cancer per person per reference year. The rare event of different primary cancers per person should be counted as separate incidence per person per year. The TF recommends considering that a new incidence could be assumed, as compared to a relapse or continuation of treatment of the same cancer, when the person did not have contact with the health care system for the same primary cancer within the recent five years. However, it would imply that incident cases identified by registers should be checked against health service data to ensure such rule.
In addition, period prevalence defined as individuals who had the disease in the course of the year, irrespective of their status at the end of year (died, recovered, emigrated) should be considered. However, following the arguments for different prevalence definitions used in the pilot studies and also in view of the recommendations of IARC the calculation of best estimates for 5-years partial prevalence seems to be most appropriate.
Conclusion
For incidence data on all cancers and by site the use of data that are collected from the registries affiliated to the European Network of Cancer Registries (ENCR) and organized for public accessibility on the European Cancer Observatory (ECO) website could be considered. In view of the re-organisation of the responsibility for cancer data collections at EU level from the Lyon-based International Agency for Research on Cancer (IARC – WHO) to the Joint Research Centre (JRC) (53) (JRC now supports cancer information policy of DG SANCO (54)). Such joint dissemination could be organised by a joint focal point per MS.
Cancer prevalence data from statistical or register sources follow different definitions. Here it is of utmost importance to agree on a single definition (either life-time prevalence or 1-, 3- or 5-years partial prevalence).
A clear coordination of incidence and prevalence data collections at national level will be essential.
Chapter IV. Endocrine, nutritional and metabolic diseases: diabetes mellitus (E10-E14)
Sources
Data on hospital care only or medication only are not the best source for diabetes and other diseases in chapter IV, as some patients may be treated by diet without medication and many patients do not require hospitalisation. GP’s/primary health care or outpatient care data is more complete as most patients are treated at primary or outpatient care level. Linkage of data from different sources seems essential in order to increase data quality and comparability at EU level, however, e.g. for diabetes this was only done by one country.
Indicators
The indicator recommended for the collection for these diseases is period prevalence, which is defined as individuals who had the disease in the course of the year, irrespective of their status at the end of year (died, emigrated). In addition, incidence by person per reference year would be important for assessing the burden of disease in view of onset and efficiency of the health systems over time. For both of these indicators additional efforts are needed to agree on methods for identifying new cases, improving accuracy of data and avoiding double counting.
Conclusion
Chapter IV diseases and in particular diabetes require patient based indicators with best estimates from different sources, in particular from ambulatory as well as hospital care in order to ensure complete population coverage. The
(53) http://ihcp.jrc.ec.europa.eu/our_activities/public-health/cancer_policy_support/encr-jrc-collaboration-and-official-website-launch. (54) http://ihcp.jrc.ec.europa.eu/our_activities/public-health/cancer_policy_support.

4 Conclusions and recommendations
56Morbidity statistics in the EU — Report on pilot studies
methodology should be refined in order to reach comparable estimates even though sources in the MS may be different.
In the longer term additional efforts such as EU health examination surveys (EHES) for estimating undiagnosed and untreated cases may be a solution in view of the increasing burden and significant public health importance of diabetes.
Chapter V. Mental and behavioural disorders: dementia including Alzheimer's disease (F00-F03, G30), mental and behavioural disorders due to use of alcohol including alcohol dependence (F10), mental and behavioural disorders due to use of psychoactive substances other than alcohol and tobacco including drug dependence (F11-F16, F18, F19), schizophrenia (F20-F29), depression and other affective disorders (F30-F39), anxiety disorders (F40, F41), eating disorders (F50)
Sources
The pilots indicated significant differences in quality and completeness of the data collections for diseases in chapter V. Some mental disorders such as schizophrenia are well defined and coded similarly in different MS, and with specific medical treatment that is reflected in comparable insurance or hospital data. However, data for others such as dementia/Alzheimer´s disease or for behavioural disorders are often incomplete: either patients are living in institutions that are not included in the data collections or they do not require hospital admission. In addition, the wide range ratios between countries suggest differences in definitions, diagnosis and coding of such disorders.
Indicators
The indicator recommended for the collection for these diseases is period prevalence, which is defined as individuals who had the disease in the course of the year, irrespective of their status at the end of year (died, recovered, emigrated).
Conclusion
The use of multiple data sources is required for all mental and behavioural disorders to get more reliable and comparable estimates on prevalence. Standards for definitions and data collections and algorithms for linking data from different sources should be developed and agreed in the short-term before starting regular data collections at EU-level.
Chapter VI. Diseases of the nervous system: Parkinson’s disease (G20), multiple sclerosis (G35), epilepsy (G40, G41) and migraine and other headache syndromes (G43, G44)
Sources
Hospital data only are not the best source for any of the diseases of chapter VI, which are often taken care of at ambulatory care or outpatient facilities. While the data for Parkinson’s disease, multiple sclerosis and epilepsy are quite comparable among the countries, data for migraine and other headache syndromes indicated significant differences, possibly because physicians often see them as a symptom rather than a disease and do not code them.
Indicators
The indicator recommended for collection for these diseases is period prevalence, which is defined as individuals who had the disease in the course of the year, irrespective of their status at the end of year (died, recovered, emigrated).
Conclusion
Data on Parkinson’s disease, multiple sclerosis and epilepsy can be collected, but due to the nature of those diseases a combination of data from different sources is required. Algorithms need to be developed and agreed that ensures standardised data collection and coding as a basis for completeness of the data and its comparability among MS. For migraine and other headache syndromes that could be rather a mid-term approach, since data on primary health care is needed.
Chapter VII. Diseases of the eye and adnexa: cataract (H25, H26, H-28) and glaucoma (H40, H42)
Sources
For cataract and glaucoma, only 5 to 6 countries came up with comparable estimates. For both of those diseases, hospital-based data alone are not reliable, since treatment is often provided without inpatient hospital stay.

4 Conclusions and recommendations
57Morbidity statistics in the EU — Report on pilot studies
Indicators
The indicator recommended for collection for these diseases is period prevalence, which is defined as individuals who had the disease in the course of the year, irrespective of their status at the end of year (died, recovered, emigrated).
Conclusion
Collection of data for those diseases is recommended, in particular for health policy strategies in an ageing society. For cataract the health care data collections on surgical procedures and its influence on morbidity data over time will be of particular interest for linking those data.
Chapter VIII. Diseases of the ear and mastoid process: hearing loss (H90, H91)
Sources
Diagnosis and treatment of hearing loss is often provided outside hospital, therefore hospital-based data alone are not reliable. Computation of best estimates from different sources will be needed, in particular due to the fact that not all patients look for (regular) treatment.
Indicators
The indicator recommended for collection for these diseases is period prevalence, which is defined as individuals who had the disease in the course of the year, irrespective of their status at the end of year (died, recovered, emigrated).
Conclusion Although an important burden for an ageing society, data on diseases of chapter VIII need improvement in view of availability, comparability and completeness, which may rather be of a long-term perspective.
Chapter IX. Diseases of the circulatory system: Hypertension (I10-I13, I15), Ischemic Heart disease (I20-I25), Acute Myocardial Infarction (AMI; I21, I22), Heart failure (I50) and Cerebrovascular disease (I60-I69)
Sources
The range ratios for incidence-based data collections for AMI and cerebrovascular disease indicated similar rates among MS, which suggest good or satisfactory comparability of estimates from the different sources used. Comparable quality results were also received for period prevalence data for hypertension, ischemic heart disease and AMI. On the contrary, the quality of prevalence data for cerebrovascular disease and comparability of data on heart failure is hampered by restricted coverage that differs among countries, such as inpatients only, insured people only or exclusion of primary care patients.
Indicators
Important indicators for AMI, cerebrovascular disease and hypertensive diseases are incidence by person, as well as period prevalence for all chapter IX diseases. Data on incidence per person are most useful in the context of prevention and promotion strategies. In addition, data on incidence per episode would be particularly important for AMI in view of monitoring the burden of disease.
Conclusions
Pilot results on incidences for AMI, ischemic heart disease and cerebrovascular diseases indicated that Member States data collections are ready for implementation into a regular ESS. Combining hospital discharge data with Causes of death should be feasible for most MS and would improve the quality of the data. Since they are very close to the notion of ‘attack rates (55)’, incidence rates by episode may constitute a more meaningful alternative to the incidence by person rates. The same problems of case-definition and distinction between initial and subsequent episode of care (e.g. rehabilitation service) hold for both types of indicators (56).
For the other indicators, mostly of the type of prevalence, improvements in case definitions and standardisation on how to collect the data are recommended next steps.
Chapter X. Diseases of the respiratory system: Influenza (J09-J11), pneumonia (J12-J18), asthma (J45, J46), chronic lower respiratory disease (J40-J44, J47)
Sources
The comparability among MS, even when coming from the same type of source, was rather limited for the few pilot data sets on incidence. More countries delivered age-standardized prevalences, however, with huge range ratios. A
(55) Tunstall-Pedoe H, Kulasmaa K, Tolonen H, Davidson M, Mendis S, 64 other contributors. MONICA Monograph and Multimedia Sourcebook. Geneva:
WHO; 2003. (56) Aelvoet W, Terryn N, Molenberghs G, De BG, Vrints C, van SM. Do inter-hospital comparisons of in-hospital, acute myocardial infarction case-fatality
rates serve the purpose of fostering quality improvement? An evaluative study. BMC Health Serv Res 2010; 10(1):334.

4 Conclusions and recommendations
58Morbidity statistics in the EU — Report on pilot studies
major problem in view of comparability was the exclusion of certain population groups (e.g. private care or institutionalized patients) from the actual registration systems.
Indicators
For both pneumonia and influenza, as earlier indicated for other infectious diseases incidence by person per reference year only should be recommended for collection. For pneumonia, the indicator period prevalence, may be replaced by incidence by episode for monitoring the burden of disease. For asthma the pilots for both of the indicators, incidence per person and period prevalence, did not show promising results, even when comparing data from same sources. The same is true for period prevalence data on chronic lower respiratory disease.
Conclusion
The chapter X diseases are important public health threats; however, pilot studies indicated that problems for receiving best estimates for comparability at EU-level cannot be easily pinpointed to single methodological issues or sources. The incidence indicators necessitate a rather complex in-depth ‘inquiry’, however, due to their importance for health policy actions, they should be considered for inclusion in future data collections on morbidity.
Pneumonia is not a chronic disease, and its burden could be estimated by the incidence by episode.
The period prevalence of asthma is a public health high priority indicator, and therefore collection of data is recommended. However, the data sets are not yet ready for implementation into the ESS. As a first step the TF recommends considering in-depth discussions with MSs on how best to improve definitions and standards for data collections with a subsequent revision of the guidelines. Prevalence data regarding chronic lower respiratory diseases may fit better for collection through a survey wherein an ambulatory spirometry is performed.
Chapter XI. Diseases of the digestive system: Gastric and duodenal ulcer (peptic ulcer) (K25-K28), alcoholic liver disease (K70), diseases of liver other than alcoholic (K71-K77), cholelithiasis (K80)
Sources The most widely used sources were the health insurance databases. None of the pilots provided a combination of data from different sources.
Indicators Incidence per person was required for cholelithiasis only. Five countries submitted data, which were fairly comparable, independent from type of source. Nine countries submitted period prevalence data for all diseases; that data were based on single sources, with almost half of the data sets being incomplete.
Conclusion Apart from data for cholelithiasis, only a few countries came up with comparable estimates for chapter XI diseases, which may in part be due to differences in interpretation of definitions and coding practice. In particular the quality of differentiation of alcoholic and non-alcoholic liver diseases by physicians may need better guidance and standards, given that prevention of excess use of alcohol is an important public health goal and occurrence of alcoholic liver disease is the main indicator to monitor prevention activities.
In view of public health relevance the collection of data for these diseases is recommended. However, in the short-term, additional consultation with Member States is needed in order to revise and set clear standards for definitions and data requirements for improving data coverage and comparability of data.
Chapter XII. Diseases of the skin and subcutaneous tissue: Dermatitis and eczema (L20-L30), psoriasis (L40)
Sources
Data from different single sources were provided including hospital data, disease specific registers, insurance data, ambulatory care and HIS data. Most patients are diagnosed and treated as outpatients or in primary care, so hospital data only are insufficient for total coverage. On the other hand, skin problems are frequent and often treated by patients themselves, which explains the high rates from HIS collections.
Indicators
Period prevalence is recommended.
Conclusion
In order to receive comparable data of high quality the TF recommends revising the guidelines by concentrating on serious and chronic cases of those diseases. A combination of hospital and ambulatory cases, including GP practices, is essential. Mid-term data collections of comparable estimates seem to be feasible.

4 Conclusions and recommendations
59Morbidity statistics in the EU — Report on pilot studies
Chapter XIII. Diseases of the muscoloskeletal system and connective tissue: rheumatoid arthritis (M05, M06), arthrosis (M15-M19), systemic connective tissue disorders (M30-M36), spondylopathies/other dorsopathies (M45-M54), and osteoporosis (M80-M82)
Sources
Diseases of the musculoskeletal system normally do not require hospitalisation. Therefore hospital discharges data or DRG payments data as the only source are insufficient. However, hospital-based data may be useful if combined with data from other sources such as primary care and outpatient databases. Similarly, data from health interview surveys (HIS) are insufficient, as these can deliver only subjective estimates for those diseases. Data derived from insurance related sources appear to provide the most comparable results; however there is a wide variation in those results. The pilot data also showed that the combination of data from different sources may not necessarily be a solution: FI combined data from hospital discharges and disability allowance data, but as compared to other studies it resulted in unreliably low estimates, since data on primary health care were not available.
Indicators
Period prevalence is recommended for those diseases.
Conclusion
In order to receive comparable data of high quality for those diseases, the TF recommends that initially the methodological guidelines should be improved in view of minimum standards for definitions and for the population coverage. The computation of best estimates requires a combination of data from complementary sources such as from hospitals and GP or primary health care.
Chapter XIV. Diseases of the genitourinary system: Glomerular and renal tubulo-interstitial diseases (N00-N08, N10-N16), renal failure (N17-N19), and urolithiasis (N20-N23)
Sources
Diseases of the genitourinary system do not necessarily require hospitalisation. Therefore neither the use of hospital activity based data nor data from HIS as single sources result in best estimates for prevalence or incidence. However, hospital activity sources may be useful if combined with other sources such as primary care or outpatient databases.
Indicators
For all chapter XIV diseases indicators period prevalence is recommended for collection. In addition, incidence by person for urolithiasis is required for monitoring prevention strategies.
Conclusion
The quality of pilot data for this chapter indicates that additional efforts are needed to reach accurate results that are comparable at EU level. Standards for definitions and basic data collections, concrete guidelines in view of needs for linking data from which sources and their algorithms should be agreed by MS and Eurostat before starting regular data collections at EU-level. Hospital activity sources may be useful if combined with other sources such as primary care or outpatient databases. From the analysis of the pilot data it seems that insurance related sources provide the most comparable estimates. However, the possibility of bias in the data resulting from the reimbursement nature of the source should be considered and adjusted for if necessary.
Chapter XIX. Injury, poisoning and certain other consequences of external causes: all morbidity due to injury, poisoning and certain other consequences of external causes (S00-T98), intracranial injury (S06), fracture of femur (S72), poisoning by drugs, medicaments and biological substances and toxic effects of substances chiefly non-medicinal as to source (T36-T65)
Chapter XX. External causes of morbidity: Shortlist subgroups A to G: All morbidity due to external causes (injuries, poisonings, etc.) (V01-Y89); land transport accidents (V01-V89); accidental falls (W00-W19); accidental poisoning (X40-X50); intentional self-harm, incl. suicidal attempt (X60-X84); assault (X85-Y09); complications of medical and surgical care (Y40-Y66, Y69-Y85)
Sources
Due to differences in severity of cases diagnosis and treatment are following different paths and end up in hospital databases for inpatients or outpatients, databases of medical specialists’ or GPs’ or in causes of death records.
4 Conclusions and recommendations
60Morbidity statistics in the EU — Report on pilot studies
However, only few countries provided pilot estimates that were based on linking data from such different sources. As a result comparability among countries by data from single but different sources is low. In addition, all countries experienced problems due to the lack of coding or the poor quality of coding of external causes.
Indicators
Although most countries provided prevalence estimates, the reason behind was not higher quality of those data when compared to incidence ones, but the missing means for identifying new cases. Countries such as SI, NL and LV noted that due to the nature of external causes the request for prevalence should be reconsidered. The TF agrees with that reasoning and recommends collecting incidence by person as well as by episode in order to monitor results of prevention activities as well as the burden of morbidity by external causes over time.
Conclusion
For both chapters XIX and XX the best estimates for injuries and external causes of morbidity comes from a linkage of inpatient, outpatient and causes of death data. Countries that were able to link data from inpatient and outpatient care resulted in higher reporting rates and better comparability of the estimates.
Improvement of data quality, in particular in view of availability and comparability, could be reached on medium term by harmonisation of definitions and an agreed method on linking data from different administrative sources.
4.3 Recommendations
Following the analysis of pilot studies from 16 Member States, and in view of the conclusions drawn for each of the diseases of the underlying shortlist, the TF members agreed on the following:
In order to overcome the problems indicated in the report and to continue working towards the goal of a minimum data set on diagnosis-specific morbidity statistics the TF MORB recommends a two-steps approach: A. A follow up project morbidity, based on results of the TF MORB with the following elements:
a. an inventory on national morbidity data collections for all EU-28 with discussion on the quality of currently available and accessible sources, definitions and potentials/barriers for data linking and proposals for overcoming those barriers;
b. a subsequent update/harmonization of the methodology, with revised definitions for indicators, clear requirements in data quality and methodology, to reach overall comparability in general and for each disease/group of diseases per MS;
c. results to be discussed with and proposed for agreement by TG MORB and WGPH.
B. A first round of morbidity data collection, based on the revised methodology for a minimum data set in all MS by gentlemen´s agreement, with conclusions for the ESS:
a. results to be presented and discussed at the TGMORB/WGPH, and
b. subsequent fine-tuning for implementation into the ESS.
4.3.1 General recommendations
The TF MORB recommends initially concentrating on revising the methodology based on the results of the pilot studies. Such revision will address:
• the identification of best sources, • approaches for integration of data from best sources, and • an agreement on best indicators and the associated definitions
in order to reach a core set of diagnosis-specific morbidity data which reach ESS quality.
That revision will in particular consider the current state of the art in the MS for reaching best estimates, which has substantially changed since 2007, when the first pilots started. The revised methodology and adapted shortlist should be agreed within two years. Subsequently, the regular data collection at EU-level could be implemented.
The following should be addressed in particular:
A. Agreed requirements and definitions
Comparability of data at EU level requires clear and univocal definitions for diagnosis and indicators per disease or group of diseases at national and at EU level.

4 Conclusions and recommendations
61Morbidity statistics in the EU — Report on pilot studies
a. Use of best estimates by combining/linking information from different sources needs harmonization of definitions for those sources at national level.
b. Comparability of data at EU-level needs harmonization of definitions at EU-level.
B. Agreed methodology
a. While the methodology for the pilots is person based — incidence or prevalence — many countries use a case based approach in their national data collections for example on hospital discharges.
b. An agreed approach towards person based data collections would improve comparability of the individual burden by disease per patient and to monitor expenditure per person and disease. It would set the basis for analysing the efficiency of health systems in view of individual and public health outcome.
c. Such a person based approach is also desirable for linking data from different data sources in view of burden per disease and the influence of health policy actions over time. While some data collections are mainly hospital driven, such as incidences on acute myocardial infarction (AMI), others are mainly derived from ambulatory care services or need a combination of both, such as for diabetes. Finally, only the combination from different data collections such as health care activities and causes of death data can give the total picture, such as for AMI or cancers.
d. From the pilot results the need to combine or link data from different sources is obvious. Therefore the TF recommends the introduction of personal/statistical identifiers for public health data collections, and to address obstacles which may partly lie in national legislation or EU-regulations.
e. Insurance data for hospital reimbursement are usually derived from an allocation of costs by diagnosis-related groups (DRG), not by functional classes. The purpose of DRG is to develop a classification system that identifies the ‘products’ that the patient received. DRGs are assigned by a ‘grouper’ tool based on ICD (International Classification of Diseases) diagnoses, procedures, age, sex, discharge status, and the presence of complications or comorbidities. Keeping that in mind, the comparability of DRG data and data from non-hospital sources following the ICD has to be taken into account. In order to improve comparability at EU-level and to link morbidity data with data from other sources, such as causes of death data, the common use of the ICD-10 classification for public health data collections should be agreed as major step towards comparability of best estimates.
f. The main reason for developing statistics on diagnosis-based morbidity (MORB) is to provide a quantitative view on the burden of diseases for citizens and the health systems as compared to person-based health surveys (HIS). Both of the data collections will be complementary as a main step forward for public health analysis and evidence based health policy. It means that neither MORB data can just be replaced by data collected via HIS, nor vice-versa. However, differences in diseases require different approaches – data on broken legs or fatal myocardial infarction can be better quantified than migraine or back pain. An agreed approach will be crucial in order to give guidance for reaching best estimates for diagnosis-specific morbidity statistics.
C. Flexibility in the use and combination of sources
a. The difference in diseases as well as the difference in national approaches for arriving at good epidemiological data per disease requires flexibility in the use/combination of sources for reaching best comparable estimates at EU-level.
b. The combination of information from different sources frequently enhances reliability and completeness of the data. However, for some diseases and conditions it is crucial in order to reach accurate and comparable results. The needs and the means for such combination, e.g. via data linking, should be defined and agreed.
c. As indicated for schizophrenia and cancer as examples, the accuracy of single as well as of a combination of sources should be ensured by an agreed set of quality controls.
d. Coverage of the total population is crucial. For diseases of high burden in view of quality of life or healthy life years lost on the one side but low rate of hospital treatment on the other side (such as for diabetes, depression and other affective disorders, asthma or ischemic heart disease) the combination of information on hospital and ambulatory care as well as from sources such as data on causes of death statistics is a pre-requisite for best estimates. However, such combination or data linking requires availability and access to ambulatory care data as well as an agreed methodology following ESS quality standards.

4 Conclusions and recommendations
62Morbidity statistics in the EU — Report on pilot studies
4.3.2 Specific Recommendations
On the shortlist for morbidity reporting
R1: Following the conclusions on the 16 pilot studies the TF MORB proposes a revised shortlist (Annex 2) as the basis for further development.
R2: The data should be collected for three measures depending on the disease: for incidence by episode, incidence by person and period prevalence.
R3: For the time being point prevalence is not to be collected. In view of period prevalence the discussion of a lifetime prevalence will be a point for follow up.
R4: For reporting along the shortlist incidence by episode, incidence by person and period prevalence should be defined specifically for each disease and condition.
On data sources and collection
R5: The TF recommends that national efforts will be made with support by Eurostat towards developing algorithms for best estimates from best quality sources.
R6: Eurostat should promote the exchange of best practices among MS, e.g. by means of workshops, in order to support MS in improving their methodology on best estimates.
R7: Member States and Eurostat should agree on metadata templates for informing and updating on the quality of sources, definitions and algorithms used or on any deviation from agreed definitions and reporting.
R8: Common efforts at national and EU level are required to solve the problems related to legal limitations in accessing and linking data from different sources in Member States.
On methodology
R9: If necessary, the national incidence or prevalence can be estimated from a representative sample of the population, providing that the collected information is quantifiable and diagnosis-based.
R10: Member States should consider disaggregating the national data collections by residents and non-residents. (see causes of death statistics). However, since morbidity statistics rely on a multitude of national sources and methods established for different goals, the TF could not investigate the issue of resident population and morbidity and recommends dealing with this subject in the future.
On results at EU level
R11: The TF recommends implementing the diagnosis specific morbidity statistics as part of the ESS. It is a crucial pillar for the European health statistics system that is currently missing.
R12: The TF recommends establishing a small advisory group of experts and Eurostat staff in order to regularly review and analyze the quality of the data collection and the dissemination of results in view of user needs. That group should also review the national metadata on best estimates for reporting and the Shorlist Morbidity. These reviews should be done in the initial phase of the regular data collection, e.g. during a five year period, because adaptations will be needed according to recommendations as listed above. The reports of the group should be submitted to the Working Group of Public Health Statistics.
R13: If for specific sets of morbidity data an international data collection for EU Member States already exists, the TF recommends co-operation in order to avoid a duplication of burden. That should be particularly explored for cancer or infectious diseases (IARC/JRC; ECDC). Such co-operation could follow approaches similar to the joint health care data collections of Eurostat, WHO and OECD, where Member States send harmonized data sets to Eurostat and WHO/OECD via one focal point.
R14: The sustainability of the data collection on morbidity can benefit from integrating results of EU studies funded by DG-SANCO or DG-RESEARCH, whenever feasible. The TF recommends that a list of those studies should be made available to MS.
R15: The implementation of morbidity statistics at EU level should be supported and facilitated by Eurostat by the organization of workshops on methodologies and best practices.
R16: A roadmap for the implementation and further development of morbidity statistics should be made for approval by the next working group on public health statistics. Attention should be paid to time required by MS for the preparation of the new data collection.
Annex 2: Revised prioritized short list (version 12 November 2013), as part of the recommendations.

Annexes
63Morbidity statistics in the EU — Report on pilot studies
Annexes
Annex 1 — In-depth analysis of pilot studies in 16 Member States: an Assessment of quality and comparability of the provided information across Member States
Click here to access Annex 1.

Annexes
64Morbidity statistics in the EU — Report on pilot studies
Annex 2 — Rev 11_11_13 — Report on in-depth analysis of pilot studies in 16 Member States on diagnosis-specific morbidity statistics — Prioritized ShortList MORB
Legend:
X → recommended for collection
Y → recommended after methodological improvement
(Y) → To be considered/re-considered after methodological improvement
Z → Not to be collected
Diagnosis-specific morbidity — European shortlist Rev. 11_11_2013
Shortlist group
number Diseases in the shortlist ICD10 codes
Measures
Incidenceby
episode
Incidence by
person
Period pre-
valence
Point prevalence
I Certain infectious and parasitic diseases
1 Tuberculosis A15-A19 X X Z
2 Sexually transmitted diseases (STD) A50-A64 Y Z
3 Viral hepatitis (incl. hepatitis B) B15-B19 X Z
4 Human immunodeficiency virus disease (HIV/AIDS°
B20-B24, Z21 X X Z
II Neoplasms
5 All malignant neoplasms (cancer) C00-C43, C44 (*), C45-C97
X Y Z
thereof
6 Malignant neoplasm of oesophagus C15 X Y Z
7 Malignant neoplasm of stomach C16 X Y Z
8 Malignant neoplasm of colon, rectum and anus
C18-C21 X Y Z
9 Malignant neoplasm of trachea, bronchus and lung
C33, C34 X Y Z
10 Malignant melanoma of skin C43 X Y Z
11 Mesothelioma C45 (Y) (Y) Z
12 Malignant neoplasm of breast C50 X Y Z
13 Malignant neoplasm of cervix uteri C53 X Y Z
14 Malignant neoplasm of uterus other than cervix
C54, C55 X Y Z
15 Malignant neoplasm of ovary C56 X Y Z
16 Malignant neoplasm of prostate C61 X Y Z
17 Malignant neoplasm of bladder C67 X Y Z
18 Leukaemia and other malignant neoplasms of lymphoid and haematopoietic tissue
C81-C96 X Y Z
III Diseases of the blood and blood-forming organs and certain disorders involving the immune mechanism
(*) Data on C44 ‘Other malignant neoplasms of skin’ should be reported separately.
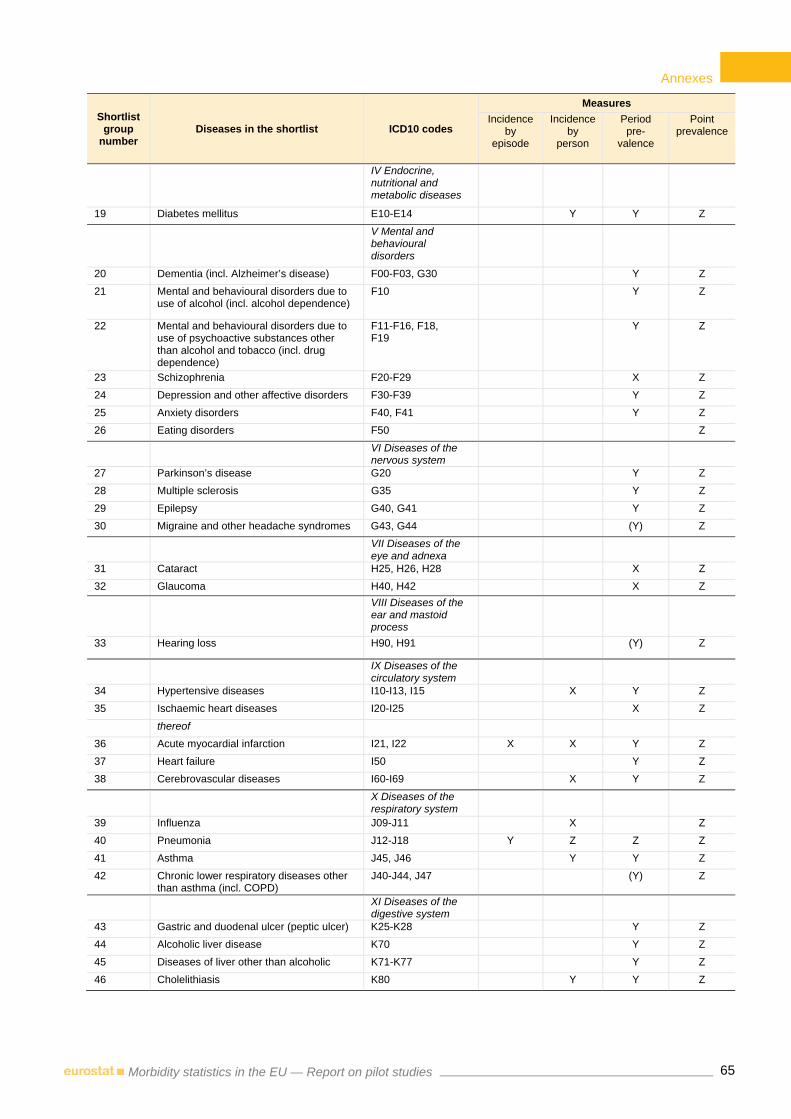
Annexes
65Morbidity statistics in the EU — Report on pilot studies
Shortlist group
number Diseases in the shortlist ICD10 codes
Measures
Incidenceby
episode
Incidence by
person
Period pre-
valence
Point prevalence
IV Endocrine, nutritional and metabolic diseases
19 Diabetes mellitus E10-E14 Y Y Z
V Mental and behavioural disorders
20 Dementia (incl. Alzheimer’s disease) F00-F03, G30 Y Z
21 Mental and behavioural disorders due to use of alcohol (incl. alcohol dependence)
F10 Y Z
22 Mental and behavioural disorders due to use of psychoactive substances other than alcohol and tobacco (incl. drug dependence)
F11-F16, F18, F19
Y Z
23 Schizophrenia F20-F29 X Z
24 Depression and other affective disorders F30-F39 Y Z
25 Anxiety disorders F40, F41 Y Z
26 Eating disorders F50 Z
VI Diseases of the nervous system
27 Parkinson’s disease G20 Y Z
28 Multiple sclerosis G35 Y Z
29 Epilepsy G40, G41 Y Z
30 Migraine and other headache syndromes G43, G44 (Y) Z
VII Diseases of the eye and adnexa
31 Cataract H25, H26, H28 X Z
32 Glaucoma H40, H42 X Z
VIII Diseases of the ear and mastoid process
33 Hearing loss H90, H91 (Y) Z
IX Diseases of the circulatory system
34 Hypertensive diseases I10-I13, I15 X Y Z
35 Ischaemic heart diseases I20-I25 X Z
thereof
36 Acute myocardial infarction I21, I22 X X Y Z
37 Heart failure I50 Y Z
38 Cerebrovascular diseases I60-I69 X Y Z
X Diseases of the respiratory system
39 Influenza J09-J11 X Z
40 Pneumonia J12-J18 Y Z Z Z
41 Asthma J45, J46 Y Y Z
42 Chronic lower respiratory diseases other than asthma (incl. COPD)
J40-J44, J47 (Y) Z
XI Diseases of the digestive system
43 Gastric and duodenal ulcer (peptic ulcer) K25-K28 Y Z
44 Alcoholic liver disease K70 Y Z
45 Diseases of liver other than alcoholic K71-K77 Y Z
46 Cholelithiasis K80 Y Y Z

Annexes
66Morbidity statistics in the EU — Report on pilot studies
Shortlist group
number Diseases in the shortlist ICD10 codes
Measures
Incidenceby
episode
Incidence by
person
Period pre-
valence
Point prevalence
XII Diseases of the skin and subcutaneous tissue
47 Dermatitis and eczema L20-L30 Y Z
48 Psoriasis L40 Y Z
XIII Diseases of the musculoskeletal system and connective tissue
49 Rheumatoid arthritis M05, M06 Y Z
50 Arthrosis M15-M19 Y Z
51 Systemic connective tissue disorders M30-M36 Y Z
52 Spondylopathies and other dorsopathies (incl. low back pain)
M45-M54 Y Z
53 Osteoporosis M80-M82 Y Z
XIV Diseases of the genitourinary system
54 Glomerular and renal tubulo-interstitial diseases
N00-N08, N10-N16 Y Z
55 Renal failure N17-N19 Y Z
56 Urolithiasis N20-N23 Y Y Z
XV Pregnancy, childbirth and puerperium
XVI Certain conditions originating in the perinatal period
XVII Congenital malformations, deformations and chromosomal abnormalities
XVIII Symptoms, signs and abnormal clinical and laboratory findings, not elsewhere classified
XIX Injury, poisoning and certain other consequences of external causes
57 All morbidity due to injury, poisoning and certain other consequences of external causes
S00-T98 Y Y Z Z
thereof
58 Intracranial injury S06 Y Y Z Z
59 Fracture of femur S72 Y Y Z Z
60 Poisoning by drugs, medicaments and biological substances and toxic effects of substances chiefly nonmedicinal as to source
T36-T65 Y Y Z Z
XXI Factors influencing health status and contact with health services

Annexes
67Morbidity statistics in the EU — Report on pilot studies
Shortlist group
number Diseases in the shortlist ICD10 codes
Measures
Incidenceby
episode
Incidence by
person
Period pre-
valence
Point prevalence
External causes of morbidity (for additional tabulation, only including cases with a main diagnosis in ICD chapter XIX Injury, poisoning and certain other consequences of external causes)
XX External causes of morbidity and mortality
A All morbidity due to external causes (injuries, poisonings, etc.)
V01-Y89 X Y Z
thereof
B Land transport accidents V01-V89 Y Y Z Z
C Accidental falls W00-W19 Y Y Z Z
D Accidental poisoning X40-X49 Y Y Z Z
E Intentional self harm (incl. suicidal attempt)
X60-X84 Y Y Z Z
F Assault X85-Y09 Y Y Z Z
G Complications of medical and surgical care
Y40-Y66, Y69-Y84 Y Y Z Z

Annexes
68Morbidity statistics in the EU — Report on pilot studies
Annex 3 — Abbreviations
AIDS Acquired Immunodeficiency Disease Syndrome
AMI Acute Myocardial Infarction
ASRs Age-standardised rates
CoD Causes of Death
COPD Chronic Obstructive Pulmonary Disease
CVA Cerebrovascular accident (disease)
DBs Data Bases
DCO Death Certificate Only
DRG Diagnosis Related Groups
ECDC European Centre for Disease Prevention and Control
ECFIN Directorate General for Economic and Financial Affairs
ECHI European Core Health Indicators
EHES EU health examination surveys
EHIS European Health Interview Survey
ESHSI European Survey on Health and Social Integration
ESS European Statistical System
EU European Union
EUROCISS European Cardiovascular Indicators Surveillance
EUROPREVAL Europe-wide project to estimate the prevalence of the most important cancers
GBD Global Burden of Disease
GLOBOCAN Estimated cancer Incidence, Mortality, Prevalence and Disability-adjusted life years
GP General Practitioners
HDR Hospital Discharge Records
HIS Health Interview Survey
HLY Healthy Life Years
HIV Human Immunodeficiency virus
IARC International Agency for Research on Cancer
ICPC-1 International Classification of Primary Care
ICD-9-CM International Classification of Diseases – Ninth Revision – Clinical Modification
ICD-10 International Classification of Diseases – Tenth Revision
ICD-10-AM International Classification of Diseases –Tenth Revision – Australian Modification
ICD-10-GM International Classification of Diseases –Tenth Revision – German Modification
IHD Ischaemic Heart Disease
ISHMT International Shortlist for Hospital Morbidity Tabulation
IT Information Technology
JRC Joint Research Centre
MS Member States
MSDG Morbidity Statistics Development Group
OECD Organisation for Economic Co-operation and Development
RIVM The National Institute for Public Health and the Environment (NL)
SDGs Sustainable Development Goals
SILC Survey on Income, Social Inclusion and Living Conditions
SL Short List
STI Sexually Transmitted Infections
TF Task Force

Annexes
69Morbidity statistics in the EU — Report on pilot studies
TF MORB Task Force on Morbidity Statistics
TB Tuberculosis
TESSy ECDC’s Surveillance System
TGMORB Technical Group on Morbidity Statistics
UN United Nations
UNAIDS Joint United Nations Programme on HIV/AIDS
WHO World Health Organization
WGPH Working Group on Public Health
Country codes AT Austria
BE Belgium
CY Cyprus
CZ Czech Republic
DE Germany
EE Estonia
FI Finland
HU Hungary
LT Lithuania
LV Latvia
MT Malta
NL The Netherlands
PL Poland
RO Romania
SI Slovenia
SK Slovakia

Annexes
70Morbidity statistics in the EU — Report on pilot studies
Annex 4 — Guidelines developed by the MSDG (Morbidity Statistics Development Group) and used during the pilot studies
Click here to access Annex 4.

Annexes
71Morbidity statistics in the EU — Report on pilot studies
Annex 5 — Task Force on Diagnosis-Specific Morbidity Statistics — Terms of reference – Rev. 15.11.2011
A. Background information on morbidity statistics
Since 2005 Eurostat has worked towards the development of a set of morbidity statistics as a regular part of the European Statistical System, ESS. The overall aim of such a strand is to contribute to the establishment of an EU-wide system of consistent diagnosis-specific morbidity statistics, i.e. data on health as observed by medical professionals for a selected set of diseases that allows comparisons at EU level.
Several activities were launched towards this aim, namely the London Morbidity Seminar (2003) and the ad-hoc Task Force Morbidity List (2003). In parallel, a project funded by DG SANCO prepared an inventory on the availability of morbidity data sources in all EU countries (*). At the level of Eurostat, the work resulted in a diagnosis-related morbidity — European shortlist (version 18 May 2005) as well as in a number of recommendations for testing the feasibility to compile diagnosis related morbidity statistics for the proposed list. Aim of that shortlist was to set the framework for a consistent reporting on disease-specific morbidity statistics, mainly incidence and prevalence, at EU-level. First experiences on the compilation of morbidity statistics were gathered by the ‘Pilot project on morbidity statistics’ (Eurostat 2004 grant action awarded to EE-DE-LT; the final report was submitted at the end of 2006).
Building on activities carried out before 2006, the Morbidity Statistics Development Group (MSDG) was set up in order to make progress with the methodological framework for diagnosis-specific morbidity statistics. As major outcome the MSDG developed an agreed shortlist for diagnosis-specific morbidity statistics, called the European shortlist (version 6 March 2007), and the Principles and guidelines for diagnosis-specific morbidity statistics (version 23 April 2007), a methodological description of the process for producing best national estimates for diagnosis-specific morbidity statistics (see annexes).
From 2007 onwards, work has focused on pilot data collections.
Pilot studies
In the context of the Transition Facility Programme 2005, nine Member States (MS) — Cyprus, the Czech Republic, Estonia, Hungary, Lithuania, Latvia, Malta, Slovenia and Slovakia — assessed the overall practicability and feasibility of the proposed methodology until 2008.
From 2007 to 2009 a second group of 7 MS — Austria, Belgium, Finland, Germany, the Netherlands, Poland and Romania — received Eurostat funds for pilot studies. The final results of that group will be available by September 2011.
Aims of the pilot studies
The main objective of the national pilot projects was to test the feasibility of the Principles and guidelines for diagnosis-specific morbidity statistics in the various national contexts (i.e. different health care systems, different data sources). It was to be tested if and how reliable national estimates can be produced for a shortlist of diseases by using different available sources and/or combination thereof. Main emphasis was on a common output at EU level, irrespective of the national sources.
The projects were composed of three phases.
Firstly, MS should make an inventory of all potential national sources for diagnosis-specific morbidity data that could be used to supply data for the Diagnosis related morbidity – European shortlist and its requested measures (incidence, prevalence). The aim of this part of the methodological approach was to identify, to describe and to evaluate the potential main national sources and — whenever adequate — additional sources for diagnosis-specific morbidity statistics.
Based on that inventory the second phase consisted in elaborating a methodology for calculating best national estimate from one or several data sources. For each entry of the shortlist (incidence, prevalence), available sources (main and additional data sources) had to be critically evaluated in view of their usefulness and reliability for that estimation process. The emphasis was on providing the best national estimate (through a well described and valid procedure), and on its documentation (metadata).
Finally, once the matrix had been established, each MS was asked to carry out a pilot data collection to test the feasibility of their methodology for various sources in order to reach best estimates for most of the diseases of the list. That part included the documentation on why a source failed to provide the requested data as well as an evaluation of the quality of the data obtained from a specific source. Whenever feasible, an indication of the expected cross-country comparability of the data from that source should be included. In case different sources were reliable for one disease, the various sources were to be compared in terms of coverage, quality, periodicity etc..
(*) EUMIP 1 and EUMIP 2.

Annexes
72Morbidity statistics in the EU — Report on pilot studies
Deliverables of the pilot studies
Based on the national experiences, the final report should contain:
⎯ An inventory — matrix ‘Diagnosis related morbidity – European shortlist’ — of all potential data sources for each entry of the shortlist and its measures (incidence, prevalence). The comprehensive evaluation of each source was of utmost importance;
⎯ A pilot data collection for the diseases of the shortlist or parts thereof. The MS should provide documentation on how the work on developing the matrix was carried out and on why a source failed to provide the requested data. The metadata should include an evaluation of the quality of data obtained from a specific source;
⎯ A project report on evaluation of results, including suggestions for European routine data collection. It should also contain an overall assessment of the feasibility of the proposed approach as well as recommendations on how to improve the proposed guidelines.
Results from the first set of pilot studies
The results of the pilot projects for the first 9 countries were presented at the Core Group Morbidity (CG MORB) meeting in February 2009, Doc 09-MORB-3-3.1 — A, Results of pilot projects carried out within the MCTF 2005 program, see annex. MS indicated that they would need more detailed definitions for the measurements presented in the European shortlist (incidence/prevalence). They asked for specification of a time window to be used to separate recurrences of a disease from the series of health care episodes for the same case of illness. They also stated the need to clarify whether relapses of a particular condition, for instance tuberculosis, should be counted as new cases.
Based on those results, the CG MORB emphasised the needs for harmonized definitions for all the measurements, if possible. A special TF should be devoted to that work. The output of the TF should be to improve the MSDG guidelines in order to reach a methodological basis for regular data compilations at EU level. That idea was endorsed by the management group of the partnership on public health statistics in April and by the Technical Group Morbidity (TG MORB) in May 2009.
B. Task Force on Diagnosis-Specific Morbidity Statistics (TF)
Aim
The aim of this TF is to provide criteria and recommendations on how to calculate the best estimates for the measurements presented in the European shortlist including harmonized definitions for the different indicators.
The work of the TF should be based on the existing MSDG documents and on the results of the pilot projects of 16 MS. It should aim at improving the methodological guidelines in order to implement diagnosis-specific morbidity statistics within the European Statistical System (ESS) and to assist Eurostat in developing an implementing measure for regulation 1338/2008 on public health statistics.
The TF should reflect on the following questions:
⎯ Which types of data sources should be used to calculate the estimates?
⎯ Which are the best methods for estimating incidence and prevalence indicators from existent data sources?
⎯ Which of the proposed estimates (incidence, point prevalence and period prevalence) are suiting best for each of the different diseases?
Objectives of the TF
1. Analyze the classification of data sources as proposed by the 16 pilots and make recommendations in view of the suitability of those data sources to estimate morbidity measures.
2. Assess the adaptation of the definitions for the proposed measurement of morbidity to the different data sources (incidence by person, incidence by episode, point prevalence and period prevalence). As a result the TF should propose algorithms to estimate the incidence and prevalence of selected diseases from the different types of data sources.
3. Address the problems of estimation when there are missing data (due to problems of coverage with respect to the diagnoses or the population) and propose algorithms and/or recommendations to calculate best estimates.
4. Make specific recommendations
⎯ with special attention to the estimates of incidence and prevalence:
i. in chronic diseases, e.g. how to count incident and/or prevalent cases when there is not a specific disease registry and the measures must be derived from health care records, and

Annexes
73Morbidity statistics in the EU — Report on pilot studies
ii. for special groups of diseases such as tuberculosis (should relapses or sequels of tuberculosis be counted as incident cases?), neoplasm (should point prevalence for neoplasm be calculated instead of period prevalence?), diabetes (should point prevalence and period prevalence for diabetes be estimated?), migraine and other headache syndromes (should it be kept in the shortlist as there is concern about how it is registered in the data sources?), myocardial infarction (persons who died without reaching medical treatment should be counted?) etc.;
⎯ in view of the time span problem regarding the estimation of prevalence in some acute diseases, example: Should a person with an accidental fall, fracture of femur or myocardial infarction be counted as prevalent case for all the years to come after the incidence or just for a specified time span?).
5. Finally, assess the quality and comparability of the estimates across Member States based on a set of agreed criteria.
C. Membership
Composition
The TF will have a maximum of 8 to 10 members from the MS plus one representative from Eurostat, who will chair the TF.
Members of the TF will be invited to participate on the basis of their personal expertise. They could be experts in the morbidity field with knowledge of the health information system or they could have a broad experience and expertise in morbidity projects.
Well-recognized international organizations or projects which have expertise in the field could be invited as observers.
TF members will be reimbursed for travel expenses according to Eurostat rules.
Responsibilities
Members of the TF contribute substantively to the work of the group on particular items, with considerable contributions to the in-depth analysis of the 16 pilot studies and the drawing up of the subsequent documents and recommendations.
If specific decisions have to be made the group will strive for consensus. If consensus cannot be reached the group will follow the majority view.
D. Meetings - Operating principles
The TF will meet for a maximum of three face-to-face meetings. In addition, e-mail, telephone conferences etc. will be used to ensure additional consultations and discussions whenever needed.
TF members may suggest work topics that are clearly related to the objectives of the group and will be relevant for the deliverables.

Annexes
74Morbidity statistics in the EU — Report on pilot studies
E. Reporting – Deliverables
The TF will deliver two papers:
1. Document on an in-depth analysis of the 16 pilot studies that were performed at national level. That report will include an assessment of the quality and the comparability of the estimates across Member States.
For that piece of work Eurostat will provide a synthesis of the results of those pilots and provide an excel table with all data that were delivered per participating country.
2. Based on that analysis the TF will prepare a report with definitions, algorithms and recommendations on how to calculate the 91 estimates as required by the European shortlist.
That report will include two major parts:
— Completion of the MSDG methodological guidelines & short list of disease-specific variables with relevant definitions for each of the different indicators and
— Recommendations on calculating best estimates.
Proposed time frame
⎯ Establish the TF by September 2011
⎯ Start the work by November 2011 – first TF meeting
⎯ Conclude on analysis paper by May 2012 – second TF meeting
⎯ Draft subsequent report on definitions, algorithms and recommendations and submit the two deliverables to the TG MORB for written comments by October 2012 with request for feed-back by early January 2013
⎯ Revise/finalise the two deliverables by March 2013 – third TF meeting
⎯ Send the two final deliverables to the TG MORB by end of April/first week of May 2013 for final discussion and endorsement at the TG MORB meeting in early June 2013
⎯ Eurostat will subsequently present the final documents to the Working Group on Public Health Statistics for adoption.

Annexes
75Morbidity statistics in the EU — Report on pilot studies
Annex 6 — The self-assessment of sources’ quality done by pilot countries
In the pilot wave II (2007-2009) the countries were asked to rate (from 0 to 5) the sources’ quality according to the standard parameters used in Eurostat for assessing quality dimensions for statistical information. This exercise was not foreseen for wave I and therefore it provides a partial view of the situation in the pilot countries at the time the studies were carried out. Detailed tables by source and score were provided by the pilot countries both for primary and secondary sources (not included here).
In this paragraph the self-assessment for primary sources is reported. The sources were grouped based on the classification provided in table 6 of annex 1 and the scores were averaged if more than one primary source was included in a group for a specific country. The average score for all pilot countries for each dimension is also shown in each graph.
The following quality dimensions were scored: (1) Relevance: the degree to which a database meets current and potential users' needs. To which extent the
database is useful do produce incidence and prevalence statistics;
(2) Accuracy: The closeness of estimates based on the database to the exact or trues values. Different types of errors that should be considered are: (a) Sampling errors (only relevant in case of sample surveys); (b) Coverage errors (e.g. no data for a certain geographical area); (c) Measurement errors (e.g. ICD codes given by a health professional); (d) Processing errors (e.g. errors in data entry); (e) Non response errors (e.g. person with illness not responding to a survey); (f) Model assumption errors (e.g. errors in using the available database to come to national estimates);
(3) Timeliness & punctuality: timeliness reflects the length of time between their availability and the event or phenomena that they describe. Punctuality refers to the time lag between the release data of data and the target date when it should be delivered.
(4) Accessibility & clarity: accessibility refers to the physical conditions in which users can obtain data: where to go, how to order, delivery time, clear pricing policy… Clarity refers to the data’s information environment whether data are accompanied with appropriate metadata, illustrations such as graphs and maps, whether information on their quality is available, etc;
(5) Comparability (geographical and over time): the extent to which differences between statistics are attributed to differences between trues values of the statistical characteristics. For diagnosis-specific morbidity statistics, both geographic comparability (e.g. between member states) and comparability between domains (i.e. different diagnoses) are of particular interest. Also the comparability over time is important;
(6) Coherence: when originating from a single course, statistics are normally coherent in the sense that elementary results derived from the concerned survey can be reliably combined in numerous ways to produce more complex results;
(7) General assessment/source kept: The score for the general assessment was calculated as the average scores of the 6 other criteria.
Concerning the sources grouped in the category ‘Disease-specific register sources’, Figure 19 shows that when all the countries are considered the coherence is, in average, the less punctuated parameter (3 points, while all the other parameters have an average of 4 points).
Finland and Austria only punctuated the general assessment parameter, both giving 5 points to their sources.
In general, the scores given to the different parameters to assess the disease-specific register sources do not present significant variations. The Czech Republic stands out from the other countries with a parameter less punctuated - coherence (3 points) – and one more punctuated – accessibility and clarity (5 points).
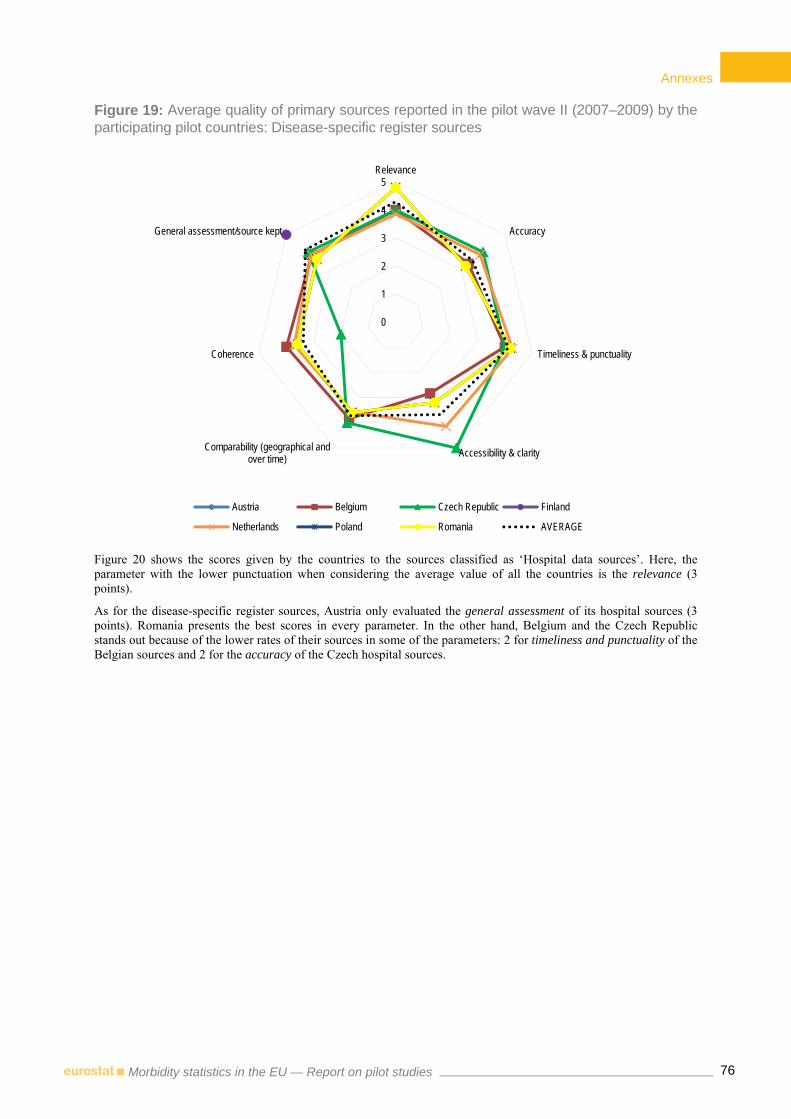
Annexes
76Morbidity statistics in the EU — Report on pilot studies
Figure 19: Average quality of primary sources reported in the pilot wave II (2007–2009) by the participating pilot countries: Disease-specific register sources
Figure 20 shows the scores given by the countries to the sources classified as ‘Hospital data sources’. Here, the parameter with the lower punctuation when considering the average value of all the countries is the relevance (3 points).
As for the disease-specific register sources, Austria only evaluated the general assessment of its hospital sources (3 points). Romania presents the best scores in every parameter. In the other hand, Belgium and the Czech Republic stands out because of the lower rates of their sources in some of the parameters: 2 for timeliness and punctuality of the Belgian sources and 2 for the accuracy of the Czech hospital sources.
0
1
2
3
4
5Relevance
Accuracy
Timeliness & punctuality
Accessibility & clarityComparability (geographical andover time)
Coherence
General assessment/source kept
Austria Belgium Czech Republic Finland
Netherlands Poland Romania AVERAGE

Annexes
77Morbidity statistics in the EU — Report on pilot studies
Figure 20: Average quality of primary sources reported in the pilot wave II (2007–2009) by the participating pilot countries: Hospital data sources
Figure 21 refers to the quality of the sources classified as ‘providers of ambulatory health care sources’. As in previous group of sources, Romania stands out with a very good classification of its sources in all the parameters (except for the comparability: 3 points). If we consider the average for the four countries that self-assessed their ambulatory health care sources, the less punctuated parameter is precisely the comparability.
Poland reports a value below the average for the relevance of its sources and above the average for the comparability parameter.
0
1
2
3
4
5Relevance
Accuracy
Timeliness & punctuality
Accessibility & clarityComparability (geographical andover time)
Coherence
General assessment/source kept
Austria Belgium Czech Republic Netherlands
Poland Romania AVERAGE
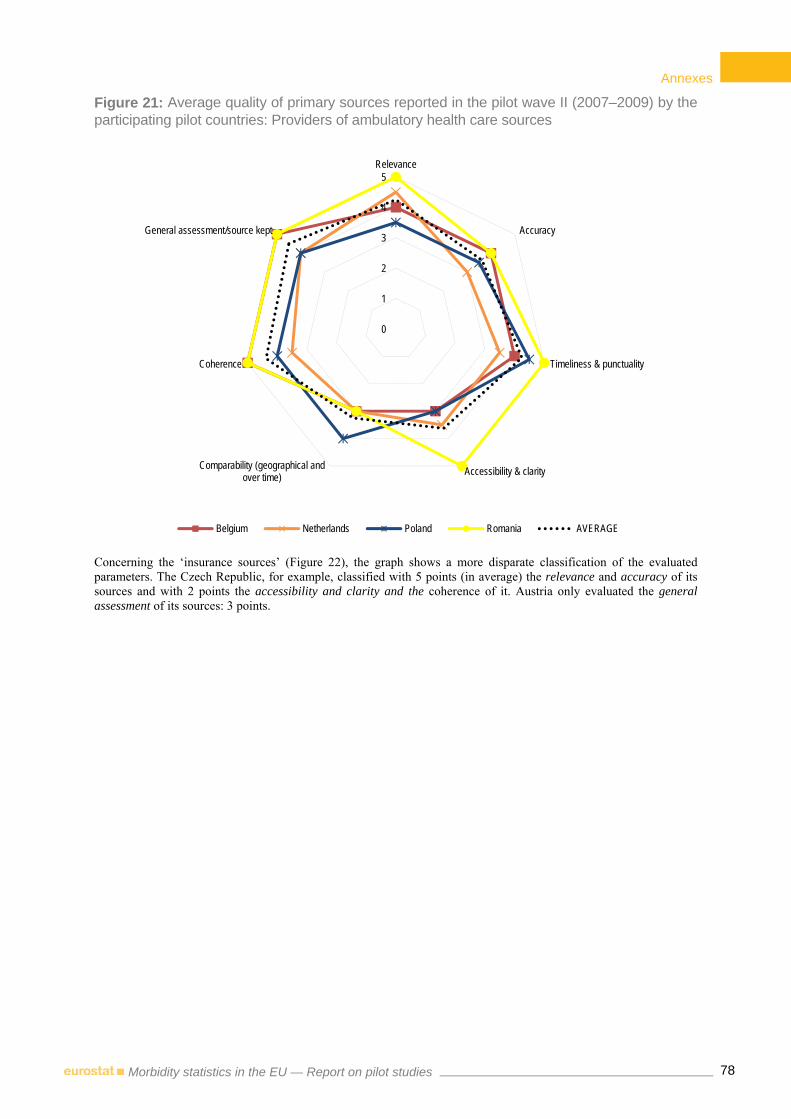
Annexes
78Morbidity statistics in the EU — Report on pilot studies
Figure 21: Average quality of primary sources reported in the pilot wave II (2007–2009) by the participating pilot countries: Providers of ambulatory health care sources
Concerning the ‘insurance sources’ (Figure 22), the graph shows a more disparate classification of the evaluated parameters. The Czech Republic, for example, classified with 5 points (in average) the relevance and accuracy of its sources and with 2 points the accessibility and clarity and the coherence of it. Austria only evaluated the general assessment of its sources: 3 points.
0
1
2
3
4
5Relevance
Accuracy
Timeliness & punctuality
Accessibility & clarityComparability (geographical andover time)
Coherence
General assessment/source kept
Belgium Netherlands Poland Romania AVERAGE

Annexes
79Morbidity statistics in the EU — Report on pilot studies
Figure 22: Average quality of primary sources reported in the pilot wave II (2007–2009) by the participating pilot countries: Insurance sources
If we consider the four kinds of sources evaluated, the ‘Providers of ambulatory health care sources’ are, averagely, the ones that received more punctuation, whereas the ‘insurance’ ones were the less punctuated. If we look at the countries, and consider the score given to the four kinds of sources in all the parameters, then we see that the Czech Republic is the country reporting the lowest average (3.4), while Finland the highest – 5 points (although in this case the average refers only to the self-assessment of the disease-specific register sources and only to the general assessment parameters).
0
1
2
3
4
5Relevance
Accuracy
Timeliness & punctuality
Accessibility & clarityComparability (geographical and
over time)
Coherence
General assessment/source kept
Austria Belgium Czech Republic Poland AVERAGE

Annexes
80Morbidity statistics in the EU — Report on pilot studies
Annex 7 — Data delivered by the pilot countries
Crude rates
Diseases in the shortlist
Measures
Countries that reported crude rates estimates and type of source
Disease-specific register
Hospital data
Providers of ambulatory health care
Insurance
Self-reported (HIS or EHIS)
Combined Total
Chapter I. Certain infectious and parasitic diseases
1. Tuberculosis
Incidence by episode
AT, CZ, EE, FI, HU, LV, MT, NL, PL,
SI, SK
LT 12
Period prevalence
AT, CZ, EE, HU, LV, NL, PL, RO, SI,
SK
LT 11
2. Sexually transmitted diseases (STD)
Incidence by episode
CZ, EE, FI, LV, MT, PL,
SI, SK LT 9
Period prevalence
CZ, EE, LV, PL, RO, SK
LT DE 8
3. Viral hepatitis (incl. hepatitis B)
Incidence by episode
AT, CZ, EE, FI, LV, MT, PL, SI, SK
NL, RO LT 12
Period prevalence
AT, CZ, EE, PL, SK
HU, NL, RO LT DE 10
4. Human immunodeficiency virus disease (HIV/AIDS)
Incidence by episode
AT, BE, CZ, EE, FI, LT,
LV, MT, NL, PL, SI, SK
12
Period prevalence
AT, EE, HU, LT, NL, PL,
RO, SK 8
Point prevalence
AT, CZ, LT, LV, NL, PL,
SK DE 8
Chapter II. Neoplasms
5. All malignant neoplasms (cancer)
Incidence by person
AT, BE, CZ, EE, FI, HU, LT, LV, MT, NL, PL, RO,
SI, SK
DE 15
Period prevalence
AT, CZ, FI, HU, LT, LV, NL, PL, RO,
SI
EE DE 12
6. Malignant neoplasm of oesophagus
Incidence by person
AT, BE, CZ, EE, FI, HU, LT, LV, MT, NL, PL, RO,
SI, SK
DE 15
Period prevalence
AT, CZ, FI, HU, LT, LV, NL, PL, RO,
SI
EE DE 12

Annexes
81Morbidity statistics in the EU — Report on pilot studies
Diseases in the shortlist
Measures
Countries that reported crude rates estimates and type of source
Disease-specific register
Hospital data
Providers of ambulatory health care
Insurance
Self-reported (HIS or EHIS)
Combined Total
7. Malignant neoplasm of stomach
Incidence by person
AT, BE, CZ, EE, FI, HU, LT, LV, MT, NL, PL, RO,
SI, SK
DE 15
Period prevalence
AT, CZ, FI, HU, LT, LV, NL, PL, RO,
SI
EE DE 12
8. Malignant neoplasm of colon, rectum and anus
Incidence by person
AT, BE, CZ, EE, FI, HU, LT, LV, MT, NL, PL, RO,
SI, SK
DE 15
Period prevalence
AT, CZ, FI, HU, LT, LV, NL, PL, RO,
SI
EE DE 12
9. Malignant neoplasm of trachea, bronchus and lung
Incidence by person
AT, BE, CZ, EE, FI, HU, LT, LV, MT, NL, PL, RO,
SI, SK
DE 15
Period prevalence
AT, CZ, FI, HU, LT, LV, NL, PL, RO,
SI
EE DE 12
10. Malignant melanoma of skin
Incidence by person
AT, BE, CZ, EE, FI, HU, LT, LV, MT, NL, PL, RO,
SI, SK
DE 15
Period prevalence
AT, CZ, FI, HU, LT, LV, NL, PL, RO,
SI
EE DE 12
11. Mesothelioma
Incidence by person
AT, BE, CZ, EE, FI, HU, LT, LV, MT, NL, PL, RO,
SI, SK
DE 15
Period prevalence
AT, CZ, FI, HU, LT, LV, NL, PL, RO,
SI
EE DE 12
12. Malignant neoplasm of breast
Incidence by person
AT, BE, CZ, EE, FI, HU, LT, LV, MT, NL, PL, RO,
SI, SK
DE 15
Period prevalence
AT, CZ, FI, HU, LT, LV, NL, PL, RO,
SI
EE DE 12

Annexes
82Morbidity statistics in the EU — Report on pilot studies
Diseases in the shortlist
Measures
Countries that reported crude rates estimates and type of source
Disease-specific register
Hospital data
Providers of ambulatory health care
Insurance
Self-reported (HIS or EHIS)
Combined Total
13. Malignant neoplasm of cervix uteri
Incidence by person
AT, BE, CZ, EE, FI, HU, LT, LV, MT, NL, PL, RO,
SI, SK
DE 15
Period prevalence
AT, CZ, FI, HU, LT, LV, NL, PL, RO,
SI
EE DE 12
14. Malignant neoplasm of uterus other than cervix
Incidence by person
AT, BE, CZ, EE, FI, HU, LT, LV, MT, NL, PL, RO,
SI, SK
DE 15
Period prevalence
AT, CZ, FI, HU, LT, LV, NL, PL, RO,
SI
EE DE 12
15. Malignant neoplasm of ovary
Incidence by person
AT, BE, CZ, EE, FI, HU, LT, LV, MT, NL, PL, RO,
SI, SK
DE 15
Period prevalence
AT, CZ, FI, HU, LT, LV, NL, PL, RO,
SI
EE DE 12
16. Malignant neoplasm of prostate
Incidence by person
AT, BE, CZ, EE, FI, HU, LT, LV, MT, NL, PL, RO,
SI, SK
DE 15
Period prevalence
AT, CZ, FI, HU, LT, LV, NL, PL, RO,
SI
EE DE 12
17. Malignant neoplasm of bladder
Incidence by person
AT, BE, CZ, EE, FI, HU, LT, LV, MT, NL, PL, RO,
SI, SK
DE 15
Period prevalence
AT, CZ, FI, HU, LT, LV, NL, PL, RO,
SI
EE DE 12
18. Leukaemia and other malignant neoplasms of lymphoid and haematopoietic tissue
Incidence by person
AT, BE, CZ, EE, FI, HU, LT, LV, MT, NL, PL, RO,
SI, SK
DE 15
Period prevalence
AT, CZ, FI, HU, LT, LV, NL, PL, RO,
SI
EE DE 12

Annexes
83Morbidity statistics in the EU — Report on pilot studies
Diseases in the shortlist
Measures
Countries that reported crude rates estimates and type of source
Disease-specific register
Hospital data
Providers of ambulatory health care
Insurance
Self-reported (HIS or EHIS)
Combined Total
Chapter IV. Endocrine, nutritional and metabolic diseases
19. Diabetes mellitus
Incidence by person
BE, LV MT CZ, NL, PL,
SK EE, LT DE, FI 11
Period prevalence
LV, RO SI HU, NL, PL BE, EE, LT AT, MT DE, FI 13
Point prevalence
LV CZ, NL, SK LT 5
Chapter V. Mental and behavioural disorders
20. Dementia (incl. Alzheimer’s disease)
Period prevalence
LV AT, SI NL, SK CZ, EE, HU, LT, PL, RO
MT DE, FI 14
21. Mental and behavioural disorders due to use of alcohol (incl. alcohol dependence)
Period prevalence
LV AT, PL,
SI SK
CZ, EE, HU, LT, RO, FI
NL DE 13
22. Mental and behavioural disorders due to use of psychoactive substances other than alcohol and tobacco (incl. drug dependence)
Period prevalence
LV AT, PL,
SI SK
CZ, EE, HU, LT, RO, FI
NL DE 13
23. Schizophrenia Period prevalence
LV AT, SI NL, SK CZ, EE, HU, LT, PL, RO
DE, FI 13
24. Depression and other affective disorders
Period prevalence
LV AT, RO,
SI NL, SK
CZ, EE, HU, LT, PL
MT DE, FI 14
25. Anxiety disorders
Period prevalence
LV AT, SI NL, SK CZ, EE, HU, LT, PL, RO
MT DE, FI 14
26. Eating disorders Period prevalence
LV AT, SI NL, SK CZ, EE, HU, LT, PL, RO
MT DE, FI 14
Chapter VI. Diseases of the nervous system
27. Parkinson’s disease
Period prevalence
AT, SI NL, SK BE, CZ, EE, HU,
LT, PL, RO DE, FI 13
28. Multiple sclerosis
Period prevalence
LV AT, SI HU, NL, SK CZ, EE, LT, RO
DE, FI, PL 13
29. Epilepsy Period prevalence
AT, SI NL, SK CZ, EE, HU, LT, PL, RO
DE, FI 12
30. Migraine and other headache syndromes
Period prevalence
AT, FI, SI NL, SK
CZ, EE, HU, LT, MT, PL,
RO
DE 13
Chapter VII. Diseases of the eye and adnexa
31. Cataract Period prevalence
AT CZ, EE, HU, LT, PL, RO
MT DE, FI, NL 11
32. Glaucoma Period prevalence
CZ AT, SI,
SK NL
EE, HU, LT, LV, PL,
RO DE, FI 13

Annexes
84Morbidity statistics in the EU — Report on pilot studies
Diseases in the shortlist
Measures
Countries that reported crude rates estimates and type of source
Disease-specific register
Hospital data
Providers of ambulatory health care
Insurance
Self-reported (HIS or EHIS)
Combined Total
Chapter VIII. Diseases of the ear and mastoid process
33. Hearing loss Period prevalence
AT, SK NL EE, HU,
LT, PL, RO CZ, MT DE, FI 12
Chapter IX. Diseases of the circulatory system
34. Hypertensive diseases
Period prevalence
CZ SK HU, NL EE, LT, LV,
RO MT, PL AT, DE, FI 13
35. Ischaemic heart diseases
Period prevalence
CZ AT, SK EE, LT, LV,
PL, RO MT DE, FI 13
36. Acute myocardial infarction
Incidence by person
CZ SK NL EE, LT BE, FI, PL 8
Period prevalence
CZ SK EE, HU,
LT, PL, RO MT
AT, DE, FI, NL, SI
13
37. Heart failure Period prevalence
AT, SK NL CZ, EE, HU, LT,
LV, PL, RO DE, FI 12
38. Cerebrovascular diseases
Incidence by person
CZ SK NL EE, LT FI, PL 7
Period prevalence
CZ AT, SK NL EE, HU,
LT, LV, RO MT DE, FI, PL 13
Chapter X. Diseases of the respiratory system
39. Influenza Incidence by episode
FI, SK NL LT, RO EE, PL 7
40. Pneumonia
Incidence by episode
CZ, FI,
SK NL EE, LT, RO 7
Period prevalence
AT, FI,
SK NL
CZ, EE, HU, LT, LV, RO
DE 11
41. Asthma
Incidence by person
CZ NL EE, LT FI 5
Period prevalence
CZ SK NL EE, HU,
LT, LV, RO MT, PL AT, DE, FI 13
42. Chronic lower respiratory diseases other than asthma (incl. COPD)
Incidence by person
CZ NL EE, LT FI 5
Period prevalence
CZ SK HU, NL EE, LT, LV,
PL, RO AT, DE, FI 13
Chapter XI. Diseases of the digestive system
43. Gastric and duodenal ulcer (peptic ulcer)
Period prevalence
AT, FI, SI, SK
HU, NL CZ, EE,
LT, PL, RO MT DE 13
44. Alcoholic liver disease
Period prevalence
AT, NL, SI, SK
HU CZ, EE,
LT, PL, RO DE, FI 12
45. Diseases of liver other than alcoholic
Period prevalence
AT, NL, SI, SK
CZ, EE, HU, LT, PL, RO
DE, FI 12
46. Cholelithiasis
Incidence by person
FI, SK NL EE, LT 5
Period prevalence
AT, FI, SI, SK
NL CZ, EE, HU, LT, PL, RO
DE 13
Chapter XII. Diseases of the skin and subcutaneous tissue
47. Dermatitis and eczema
Period prevalence
CZ, SK AT, SI NL EE, HU,
LT, PL, RO DE, FI 12

Annexes
85Morbidity statistics in the EU — Report on pilot studies
Diseases in the shortlist
Measures
Countries that reported crude rates estimates and type of source
Disease-specific register
Hospital data
Providers of ambulatory health care
Insurance
Self-reported (HIS or EHIS)
Combined Total
48. Psoriasis Period prevalence
CZ, SK AT, SI EE, HU,
LT, PL, RO NL DE, FI 12
Chapter XIII. Diseases of the Musculoskeletal System
49. Rheumatoid arthritis
Period prevalence
AT, SI NL CZ, EE, HU, LT, LV, RO
DE, FI 11
50. Arthrosis Period prevalence
AT, SI NL CZ, EE, HU, LT,
RO MT DE, FI 11
51. Systemic connective tissue disorders
Period prevalence
AT, SI CZ, EE,
HU,LV, PL, RO
DE, FI 10
52. Spondylopathies and other dorsopathies (incl. low back pain)
Period prevalence
AT, SI NL CZ, EE, HU, LT, PL, RO
MT DE, FI 12
53. Osteoporosis Period prevalence
AT, SI NL CZ, EE, HU, LT,
RO MT, PL DE, FI 12
Chapter XIV. Diseases of the Genitourinary System
54. Glomerular and renal tubulo-interstitial diseases
Period prevalence
AT, SI NL, SK CZ, EE, HU, LT, PL, RO
DE, FI 12
55. Renal failure Period prevalence
AT, NL,
SI SK
CZ, EE, HU, LT, PL, RO
DE, FI 12
56. Urolithiasis
Incidence by person
NL, SK EE, LT 4
Period prevalence
AT, FI, SI NL, SK CZ, EE, HU, LT, PL, RO
MT DE 13
Chapter XIX. Injury, poisoning and certain other consequences of external causes 57. All morbidity due to injury, poisoning and certain other consequences of external causes
Incidence by episode
MT FI, SI LT, PL, RO EE 7
Period prevalence
AT, FI CZ, HU,
LT, PL, RO DE, EE 9
58. Intracranial injury
Incidence by episode
MT FI, SI,
SK NL LT, LV, RO EE 9
Period prevalence
AT, FI, SK CZ, HU, LT, LV, PL, RO
EE, NL DE 12
59. Fracture of femur
Incidence by episode
MT BE, FI, NL, SI,
SK LT, LV, RO EE 10
Period prevalence
AT, FI, NL, SK
CZ, HU,
LT, LV, PL, RO
BE, DE, EE 13
60. Poisoning by drugs, medicaments and biological substances and toxic effects of substances chiefly nonmedicinal as to source
Incidence by episode
FI, SI LT, LV, RO EE 6
Period prevalence
AT, FI CZ, HU,
LT, LV, PL, RO
DE, EE 10

Annexes
86Morbidity statistics in the EU — Report on pilot studies
Diseases in the shortlist
Measures
Countries that reported crude rates estimates and type of source
Disease-specific register
Hospital data
Providers of ambulatory health care
Insurance
Self-reported (HIS or EHIS)
Combined Total
Chapter XX. External causes of morbidity A. All morbidity due to external causes (injuries, poisonings, etc.)
Incidence by episode
LV FI, SI RO EE 5
Period prevalence
LV AT, CZ,
FI HU, RO DE, EE 8
B. Land transport accidents
Incidence by episode
LV, PL FI, SI HU RO EE 7
Period prevalence
LV, SK AT, CZ,
FI HU, RO EE, NL 9
C. Accidental falls
Incidence by episode
LV, MT FI, SI RO EE 6
Period prevalence
LV FI HU, RO EE, NL 7
D. Accidental poisoning
Incidence by episode
LV, MT FI, SI,
SK RO EE 7
Period prevalence
LV CZ, FI,
SK HU, RO DE, EE, NL 9
E. Intentional self harm (incl. suicidal attempt)
Incidence by episode
LV, MT, NL FI, SI,
SK RO EE 8
Period prevalence
LV AT, CZ, FI, SK
HU, RO DE, EE, NL 10
F. Assault
Incidence by episode
LV, MT FI, SI RO EE 6
Period prevalence
LV AT, CZ, FI, SK
HU, RO DE, EE, NL 10
G. Complications of medical and surgical care
Incidence by episode
EE, FI RO, SI 4
Period prevalence
CZ, FI EE, HU,
RO DE, NL 7

Annexes
87Morbidity statistics in the EU — Report on pilot studies
Annex 8 — Summary of pilot data and age-standardised estimates reported (range and ratio)
In the following tables is presented some information regarding the estimates for each disease. First of all, the number of countries that provides age-standardised estimates for the disease, then the minimum and maximum figures reported and finally the ratio between these two values.
As the data from surveys (HIS or EHIS) is subjective and often refers to overestimated figures, we excluded it from these tables.
Table 5: Chapter I. Certain infectious and parasitic diseases: Summary of pilot data and age-standardised estimates reported (range and ratio)
Morbidity Shortlist Number
Name of disease ICD-10 codes
corresponding Measure
No of countries
that reported age-
standardised estimates
Age-standardised estimates reported
Range
Ratio Min. Max.
1 Tuberculosis A15-A19, B90
Incidence by episode
11 0.0 16.0 -
Period prevalence
8 0.4 56.0 140.0
2 Sexually transmitted diseases
A50-A64
Incidence by episode
9 0.0 35.0 -
Period prevalence
6 0.9 120.0 139.5
3 Viral hepatitis, including Hepatitis B
B15-B19
Incidence by episode
10 0.0 7.0 -
Period prevalence
7 1.7 21.1 12.5
4
Human immunodeficiency virus disease (HIV/AIDS)
B20-B24, Z21
Incidence by episode
11 0.0 6.0 -
Period prevalence
7 0.1 10.0 100.0
Point prevalence
4 0.1 9.0 112.5
Note1: excluding self-reported data (HIS or EHIS). Note2: in some cases the rounding of the decimals transformed the figures into 0.0, when they don’t represent actual zeros. In these cases, the ratio was
not calculated.
Table 6: Chapter II. Neoplasms: Summary of pilot data and age-standardised estimates reported (range and ratio)
Morbidity Shortlist Number
Name of disease
ICD-10 codes corresponding
Measure
No. of countries that reported age-standardised
estimates
Age-standardised estimates reported
Range Ratio
Min. Max.
5 All malignant neoplasms
C00-C97
Incidence by person (or by episode)
15 18.8 75.4 4.0
Period prevalence (different definitions)
10 32.2 348.6 10.8
Note: excluding self-reported data (HIS or EHIS).

Annexes
88Morbidity statistics in the EU — Report on pilot studies
Table 7: Chapter IV. Endocrine, nutritional and metabolic diseases: Summary of pilot data and age-standardised estimates reported (range and ratio)
Morbidity Shortlist Number
Name of disease
ICD-10 codes corresponding
Measure
No. of countries that reported age-standardised
estimates
Age-standardised estimates reported
Range Ratio
Min. Max.
19 Diabetes mellitus
E10-E14
Incidence by person
7 10.7 42.0 3.9
Period prevalence
10 11.2 463.9 41.4
Point prevalence
3 125.0 364.0 2.9
Note: excluding self-reported data (HIS or EHIS).
Table 8: Chapter V. Mental and behavioural disorders: Summary of pilot data and age-standardised estimates reported (range and ratio)
Morbidity Shortlist Number
Name of disease ICD-10 codes corresponding
Measure
No. of countries
that reported age-
standardised estimates
Age-standardised estimates reported
Range
Ratio Min. Max.
20 Dementia (incl. Alzheimer’s disease)
F00-F03, G30 Period prevalence
9 1.5 148.5 99.0
21
Mental and behavioural disorders due to use of alcohol (incl. alcohol dependence)
F10 Period prevalence
8 0.1 141.3 1413.4
22
Mental and behavioural disorders due to use of psychoactive substances other than alcohol and tobacco (incl. drug dependence)
F11-F16, F18, F19
Period prevalence
7 0.2 16.4 82.1
23 Schizophrenia F20-F29 Period prevalence
9 5.7 75.9 13.3
24 Depression and other affective disorders
F30-F39 Period prevalence
8 4.0 422.0 105.5
25 Anxiety disorders F40, F41 Period prevalence
8 1.1 319.5 290.5
26 Eating disorders F50 Period prevalence
8 0.0 11.1 -
Note1: excluding self-reported data (HIS or EHIS). Note2: in some cases the rounding of the decimals transformed the figures into 0.0, when they don’t represent actual zeros. In these cases, the ratio was
not calculated.

Annexes
89Morbidity statistics in the EU — Report on pilot studies
Table 9: Chapter VI. Diseases of the nervous system: Summary of pilot data and age-standardised estimates reported (range and ratio)
Morbidity Shortlist Number
Name of disease ICD-10 codes
corresponding Measure
No. of countries that reported age-standardised
estimates
Age-standardised estimates reported
Range Ratio
Min. Max.
27 Parkinson’s disease
G20 Period prevalence
9 0.4 49.7 124.3
28 Multiple sclerosis G35 Period prevalence
9 0.9 13.0 14.4
29 Epilepsy G40, G41 Period prevalence
8 8.1 90.9 11.2
30 Migraine and other headache syndromes
G43, G44 Period prevalence
7 1.6 254.0 158.8
Note: excluding self-reported data (HIS or EHIS).
Table 10: Chapter VII. Diseases of the eye and adnexa: Summary of pilot data and age-standardised estimates reported (range and ratio)
Morbidity Shortlist Number
Name of disease
ICD-10 codes corresponding
Measure
No. of countries that reported
age-standardised
estimates
Age-standardised estimates reported
Range Ratio
Min. Max.
31 Cataract H25-H28 Period prevalence
6 9.6 208.0 21.7
32 Glaucoma H40, H42 Period prevalence
9 2.5 147.1 58.9
Note: excluding self-reported data (HIS or EHIS).
Table 11: Chapter VIII. Diseases of the ear and mastoid process: Summary of pilot data and age-standardised estimates reported (range and ratio)
Morbidity Shortlist Number
Name of disease
ICD-10 codes corresponding
Measure
No. of countries that reported
age-standardised
estimates
Age-standardised estimates reported
Range Ratio
Min. Max.
33 Hearing loss
H90, H91 Period prevalence
8 1.1 412.0 374.5
Note: excluding self-reported data (HIS or EHIS).

Annexes
90Morbidity statistics in the EU — Report on pilot studies
Table 12: Chapter IX. Diseases of the circulatory system: Summary of pilot data and age-standardised estimates reported (range and ratio)
Morbidity Shortlist Number
Name of disease ICD-10 codes
corresponding Measure
No. of countries that reported age-standardised
estimates
Age-standardised estimates reported
Range Ratio
Min. Max.
34 Hypertensive diseases
I10-I13, I15 Period prevalence
7 36.9 1618.8 43.9
35 Ischaemic Heart disease
I20-I25 Period prevalence
8 35.3 579.9 16.4
36 Acute Myocardial Infarction
I21, I22 Incidence by person
7 8.1 31.0 3.8
36 Acute Myocardial Infarction
I21, I22 Period prevalence
8 3.6 57.9 16.1
37 Heart failure I50 Period prevalence
7 33.8 268.0 7.9
38 Cerebrovascular disease
I60-I69 Incidence by person
6 15.0 53.0 3.5
38 Cerebrovascular disease
I60-I69 Period prevalence
7 41.9 242.1 5.8
Note: excluding self-reported data (HIS or EHIS).
Table 13: Chapter X. Diseases of the respiratory system: Summary of pilot data and age-standardised estimates reported (range and ratio)
Morbidity Shortlist Number
Name of disease ICD-10 codes
corresponding Measure
No. of countries that reported age-standardised
estimates
Age-standardised estimates reported
Range Ratio
Min. Max.
39 Influenza J09-J11 Incidence by episode
4 2.3 146.0 64.0
40 Pneumonia J12-J18 Incidence by episode
6 29.9 344.1 11.5
40 Pneumonia J12-J18 Period prevalence
7 27.2 233.0 8.6
41 Asthma J45, J46 Incidence by person
4 10.1 67.0 6.6
41 Asthma J45, J46 Period prevalence
6 11.5 524.0 45.6
42 Chronic lower respiratory disease
J40-J44, J47 Incidence by person
4 0.8 55.0 71.4
42 Chronic lower respiratory disease
J40-J44, J47 Period prevalence
7 12.8 319.7 24.9
Note: excluding self-reported data (HIS or EHIS).

Annexes
91Morbidity statistics in the EU — Report on pilot studies
Table 14: Chapter XI. Diseases of the digestive system: Summary of pilot data and age-standardised estimates reported (range and ratio)
Morbidity Shortlist Number
Name of disease ICD-10 codes
corresponding Measure
No. of countries
that reported age-
standardised estimates
Age-standardised estimates reported
Range
Ratio Min. Max.
43 Gastric and duodenal ulcer (peptic ulcer)
K25-K28 Period prevalence
9 3.2 230.6 72.1
44 Alcoholic liver disease
K70 Period prevalence
9 0.0 212.2 -
45 Diseases of liver other than alcoholic
K71-K77 Period prevalence
9 2.0 97.0 48.5
46 Cholelithiasis K80 Incidence by person
5 9.0 36.0 4.0
46 Cholelithiasis K80 Period prevalence
9 9.8 108.0 11.0
Note1: excluding self-reported data (HIS or EHIS). Note2: in some cases the rounding of the decimals transformed the figures into 0.0, when they don’t represent actual zeros. In these cases, the ratio was
not calculated
Table 15: Chapter XII. Diseases of the skin and subcutaneous tissue: Summary of pilot data and age-standardised estimates reported (range and ratio)
Morbidity Shortlist Number
Name of disease
ICD-10 codes corresponding
Measure
No. of countries that reported age-standardised
estimates
Age-standardised estimates reported
Range Ratio
Min. Max.
47 Dermatitis and eczema
L20-L30 Period prevalence
8 4.9 800.0 163.3
48 Psoriasis L40 Period prevalence
7 1.2 64.0 53.3
Note: excluding self-reported data (HIS or EHIS).

Annexes
92Morbidity statistics in the EU — Report on pilot studies
Table 16: Chapter XIII. Diseases of the Musculoskeletal System: Summary of pilot data and age-standardised estimates reported (range and ratio)
Morbidity Shortlist Number
Name of disease ICD-10 codes
corresponding Measure
No. of countries that reported age-standardised
estimates
Age-standardised estimates reported
Range Ratio
Min. Max.
49 Rheumatoid arthritis
M05, M06 Period prevalence
8 0.6 100.0 166.7
50 Arthrosis M15 - M19 Period prevalence
7 11.9 494.4 41.6
51 Systemic connective tissue disorders
M30 - M36 Period prevalence
7 0.8 32.5 40.6
52
Spondylopathies and other dorsopathies (incl. low back pain)
M45 - M54 Period prevalence
8 20.6 1146.0 55.6
53 Osteoporosis M80 - M82 Period prevalence
7 0.3 508.0 1693.3
Note: excluding self-reported data (HIS or EHIS).
Table 17: Chapter XIV: Diseases of the Genitourinary System: Summary of pilot data and age-standardised estimates reported (range and ratio)
Morbidity Shortlist Number
Name of disease ICD-10 codes
corresponding Measure
No. of countries that reported
age-standardised
estimates
Age-standardised estimates reported
Range Ratio
Min. Max.
54 Glomerular and renal tubulo-interstitial diseases
N00 - N08, N10 - N16
Period prevalence
8 5.5 199.0 36.2
55 Renal Failure N17 -N19 Period prevalence
8 2.0 47.5 23.8
56 Urolithiasis N20 - N23 Incidence by person
4 9.4 29.0 3.1
56 Urolithiasis N20 - N23 Period prevalence
9 4.8 92.0 19.2
Note: excluding self-reported data (HIS or EHIS).

Annexes
93Morbidity statistics in the EU — Report on pilot studies
Table 18: Chapter XIX: Injury, poisoning and certain other consequences of external causes: Summary of pilot data and age-standardised estimates reported (range and ratio)
Morbidity Shortlist Number
Name of disease
ICD-10 codes corres-ponding
Measure
No. of countries that reported age-standardised
estimates
Age-standardised estimates reported
Range Ratio
Min. Max.
57
All morbidity due to injury, poisoning and certain other consequences of external causes
S00-T98
Incidence by episode
6 5.7 1962.0 342.4
Period prevalence
6 89.9 1767.0 19.7
58 Intracranial injury S06
Incidence by episode
8 0.1 49.1 491.2
Period prevalence
8 6.6 62.0 9.4
59 Fracture of femur S72
Incidence by episode
9 4.0 29.6 7.4
Period prevalence
10 4.0 23.3 5.8
60
Poisoning by drugs, medicaments and biological substances and toxic effects of substances chiefly nonmedicinal as to source
T36-T65
Incidence by episode
6 0.4 48.0 120.0
Period prevalence
7 6.2 48.0 7.7
Note: excluding self-reported data (HIS or EHIS).

Annexes
94Morbidity statistics in the EU — Report on pilot studies
Table 19: Chapter XX: External causes of morbidity: Summary of pilot data and age-standardised estimates reported (range and ratio)
Morbidity Shortlist Number
Name of disease
ICD-10 codes
corresponding
Measure
No. of countries that reported age-standardised
estimates
Age-standardised estimates reported
Range Ratio
Min. Max.
A
All morbidity due to external causes (injuries, poisonings, etc.)
V01-Y89 Incidence by episode
5 40.3 1823.0 45.2
V01-Y90 Period prevalence
5 35.1 1647.0 46.9
B Land transport accidents
V01-V89 Incidence by episode
7 1.7 61.0 35.9
V01-V90 Period prevalence
6 2.1 91.0 43.3
C Accidental falls W00-W19
Incidence by episode
5 18.5 638.0 34.5
W00-W20 Period prevalence
6 13.6 518.6 38.1
D Accidental poisoning X40-X49
Incidence by episode
6 0.1 12.0 12.0
X40-X50 Period prevalence
7 0.1 15.0 150.0
E Intentional self harm (incl. suicidal attempt)
X60-X84 Incidence by episode
6 0.2 15.7 78.7
X60-X85 Period prevalence
7 0.0 16.0 -
F Assault X85-Y09
Incidence by episode
5 0.8 88.0 110.0
X85-Y10 Period prevalence
6 2.0 77.0 38.5
G Complications of medical and surgical care
Y40-Y66, Y69-Y84
Incidence by episode
4 0.1 21.5 215.4
Y40-Y66, Y69-Y85
Period prevalence
5 1.0 44.0 44.0
Note1: excluding self-reported data (HIS or EHIS). Note2: in some cases the rounding of the decimals transformed the figures into 0.0, when they don’t represent actual zeros. In these cases, the ratio was
not calculated.

Annexes
95Morbidity statistics in the EU — Report on pilot studies
Annex 9 — Technical descriptions of the call for proposals launched in the years 2004, 2007 and 2009
Click here to access Annex 9.

Annexes
96Morbidity statistics in the EU — Report on pilot studies
Annex 10 — Mapping of SANCO funded projects
Click here to access Annex 10.

European Commission
Morbidity statistics in the EU — Report on pilot studies
Luxembourg: Publications Office of the European Union 2014 — 96 pp. — 21 x 29.7 cm Theme: Population and social conditions Collection: Statistical working papers ISBN 978-92-79-36886-8 ISSN 2315-0807 doi:10.2785/52346 Cat. No: KS-TC-14-003-EN-N


HOW TO OBTAIN EU PUBLICATIONS
Free publications:
• one copy: via EU Bookshop (http://bookshop.europa.eu);
• more than one copy or posters/maps: from the European Union’s representations (http://ec.europa.eu/represent_en.htm); from the delegations in non-EU countries (http://eeas.europa.eu/delegations/index_en.htm); by contacting the Europe Direct service (http://europa.eu/europedirect/index_en.htm) or calling 00 800 6 7 8 9 10 11 (freephone number from anywhere in the EU) (*). 0H(*) The information given is free, as are most calls (though some operators, phone boxes or hotels may charge you).
Priced publications:
• via EU Bookshop (http://bookshop.europa.eu).
Priced subscriptions:
• via one of the sales agents of the Publications Office of the European Union (http://publications.europa.eu/others/agents/index_en.htm).

Exer in vu
lla faci blam
con
se euis n
ibh
el utat d
ip ex elestisim
R
ilis aug
iati siscilit venis n
im
2013
ed
ition
KS-TC-14-003-EN-N
doi:10.2785/52346


![Namibia Social Statistics - d3rp5jatom3eyn.cloudfront.net · Namibia statistics Agency - Eu] ]^} ]o^ îìíìrîìíð3 Namibia Social Statistics 2010 - 2014 Published by the Namibia](https://img.dokumen.tips/doc/110x75/5d18f48888c993495f8bc54d/namibia-social-statistics-namibia-statistics-agency-eu-o-iiiiriiid3.jpg)


![Kansas Health Statistics Report - KDHE · Kansas Health Statistics Report ... Kansas Trends in Poisoning Morbidity and ... 10th leading cause of death claiming 37,793 lives [1]](https://img.dokumen.tips/doc/110x75/5ae1b93a7f8b9a5b348b6ccf/kansas-health-statistics-report-health-statistics-report-kansas-trends-in.jpg)